Article

Analysis of Polarization and Depolarization Currents of Samples of NOMEX®910 Cellulose–Aramid Insulation Impregnated with Mineral Oil

Faculty of Electrical Engineering, Automatic Control and Computer Science, Opole University of Technology, Proszkowska 76 B2, 45-758 Opole, Poland
*
Author to whom correspondence should be addressed.
Energies 2020, 13(22), 6075; https://doi.org/10.3390/en13226075
Submission received: 3 November 2020 / Revised: 12 November 2020 / Accepted: 18 November 2020 / Published: 20 November 2020
(This article belongs to the Special Issue High Voltage Insulating Materials-Current State and Prospects)

Abstract

:
The article presents results of laboratory tests performed on samples of NOMEX®910 cellulose–aramid insulation impregnated with Nynas Nytro 10× inhibited insulating mineral oil using the polarization and depolarization current analysis method (PDC Method). In the course of the tests, the insulation samples were subjected to a process of accelerated thermal degradation of cellulose macromolecules, as well as weight-controlled dampening, thereby simulating the ageing processes occurring when using the insulation in power transformers. The effects of temperature in the ranges typical of normal transformer operation were also taken into account. On the basis of the obtained data, the activation energy was then fixed together with dominant time constants of cellulose–aramid insulation relaxation processes with respect to the temperature and degree of moisture, as well as thermal degradation of cellulose macromolecules. It was found that the greatest and predictable changes in the activation energy value were caused by the temperature and the degree of moisture in the samples. A similar conclusion applies to the dominant time constant of the relaxation process of cellulose fibers. Degree of thermal degradation samples was of marginal importance for the described parameters. The final outcome of the test results and analyses presented in the article are regression functions for the activation energy and the dominant time constants depending on the earlier listed parameters of the experiment, which may be used in the future diagnostics of the degree of technical wear of cellulose–aramid insulation performed using the PDC method.

1. Introduction

Power transformers are undoubtedly one of key elements of the electric energy distribution system. Their unfailing operation determines not only continuous energy deliveries for recipients, but also stable operation of the whole power system. The effects of a possible breakdown of a power transformer are always multidimensional, starting from purely economic ones, to logistics, to threats to property and life, as well as possible environmental contamination. For this reason, transformer units which are regarded as key (e.g., power plants’ step-up transformers or distribution transformers working in critical power system nodes), are equipped with automatic security systems, monitoring systems for a number of parameters determining the technical condition of the unit, and are subjected to diagnostic procedures recommended by respective standards or operating instructions. Bearing in mind the complex design of power transformers as well as their almost unique structure, ensuring unfailing continuous operation for a few dozen years is a difficult problem, which requires extensive scientific and expert knowledge.
Particularly for new power transformers, the technical condition of the electric insulation saturated with dielectric fluids is regarded as the basic hazard to safe operation, where the key factors are the level of moisture as well as the degree of ageing, defined as the degree of the materials’ thermal degradation [1,2,3,4,5,6]. Despite decades of designing and manufacturing power transformers, cellulose electric paper saturated with insulating mineral oil continues to be used as the basic electric insulation system. However, various kinds of synthetic and natural esters have become more and more recognized as substitutes for mineral oil [4,5,6,7,8]. One of the key factors accelerating the process of departing from mineral oils as the impregnating fluid, apart from improved electric, physical and chemical parameters of esters as compared to mineral oil, is their considerably better biodegradability. Likewise, we are constantly looking for a material that would effectively replace the commonly applied cellulose. At present, the highest hopes are related to synthetic papers manufactured on the basis of aramid fibers. This material was invented and patented by DuPont™ in the 1960s. DuPont™ produce a broad assortment of products to be used as electric insulation material in electric machines (also in power transformers) under the commercial name NOMEX® [6,7,8,9]. As compared to the classic cellulose paper, aramid paper is characterized by considerably better electrical properties (e.g., higher dielectric strength, higher volume and surface resistivity), physical properties (e.g., considerably higher breaking strength) and chemical properties (better resistance to ageing as a result of higher thermal resistance over continuous operation). Possible disadvantages of the aramid material include a higher price, lower ability to absorb dielectric fluids (worse impregnation as compared to cellulose), significantly higher rigidity than cellulose paper of similar thickness, which substantially complicates the process of manufacturing the insulation system for a transformer with complex geometry. In addition, intensification of the phenomenon of generating electrostatic charges as a result of stream electrification in transformers with induced circulation of dielectric fluid has also been observed [10,11]. Too high a presence of electrostatic charges in the solid insulation of a working transformer may lead to the development of partial discharges, accelerated ageing processes and, consequently, to complete discharge.
In order to use the unquestionable advantages of aramid papers in the insulation of power transformers with induced circulation of dielectric fluid, DuPont™ proposed a hybrid material, in the form of cellulose paper coated on both sides with a thin layer of synthetic aramid paper. This has resulted in a higher temperature class as compared to clean cellulose paper, an improved material dielectric fluid absorption capacity, and the impregnation capacity as compared to clean aramid paper, among other benefits. The article presents tests conducted on samples of insulation manufactured from this kind of material, which DuPont™ sells under the trade name NOMEX®910 [12]. A more detailed description of cellulose–aramid paper is presented in Section 2 of this article.
Because NOMEX®910 electro-technical paper contains a considerable amount of cellulose, its use in the insulation of a power transformer involves practically the same hazards as in a classic oil-saturated cellulose–aramid insulation. In brief, over the course of use, cellulose fibers, as a result of the presence of oxygen molecules, water, and elevated temperature, are subjected to the processes of oxidization, hydrolysis and pyrolysis, resulting in the bonds of cellulose macromolecules being torn apart (reduced degree of polymerization) and deterioration, first of all, of mechanical parameters (e.g., breaking strength). In addition, the described cellulose ageing processes generate a continuous increase in the degree of the material’s moisture due to the fact that water is one of the products of decay of the bonds of cellulose macromolecules. The increased moisture of cellulose paper significantly reduces electrical parameters (e.g., dielectric strength or volume resistivity), becoming a significant threat to further safe operation of the transformer’s insulation. In order to monitor the so-called degree of insulation’s technical wear in transformers, a number of diagnostic methods are applied, which estimate the degree of moisture as well as the ageing of cellulose paper impregnated with dielectric fluids. Therefore, a question arises: can the diagnostic methods applied so far, developed for impregnated cellulose papers, also be applied for new cellulose–aramid papers? The article presents the results of tests using the polarization diagnostic method analyzing the profiles of polarization and depolarization currents over time. This method is broadly used in diagnostic practice, and is referred to using the abbreviation PDC [7,13,14,15].

2. Materials Used for the Tests

As earlier described in the article’s abstract, for experimental tests the authors used solid insulation made of NOMEX®910 cellulose–aramid electro-technical paper, manufactured by DuPont™. The basis of this material is a high quality thermally improved cellulose pulp. A sheet of electro-technical paper formed from it is then coated on both sides with a thin layer of a binder from a high temperature meta-aramid polymer (NOMEX®). This procedure leads to an increase in the temperature class of the new material, which, for operation in mineral oil, increases to 130 °C (for operation in the environment of esters, it is 140 °C) [12]. In the case of electro-technical paper made of cellulose only, for Kraft type papers, the temperature class is 110–120 °C for operation in mineral oil. 
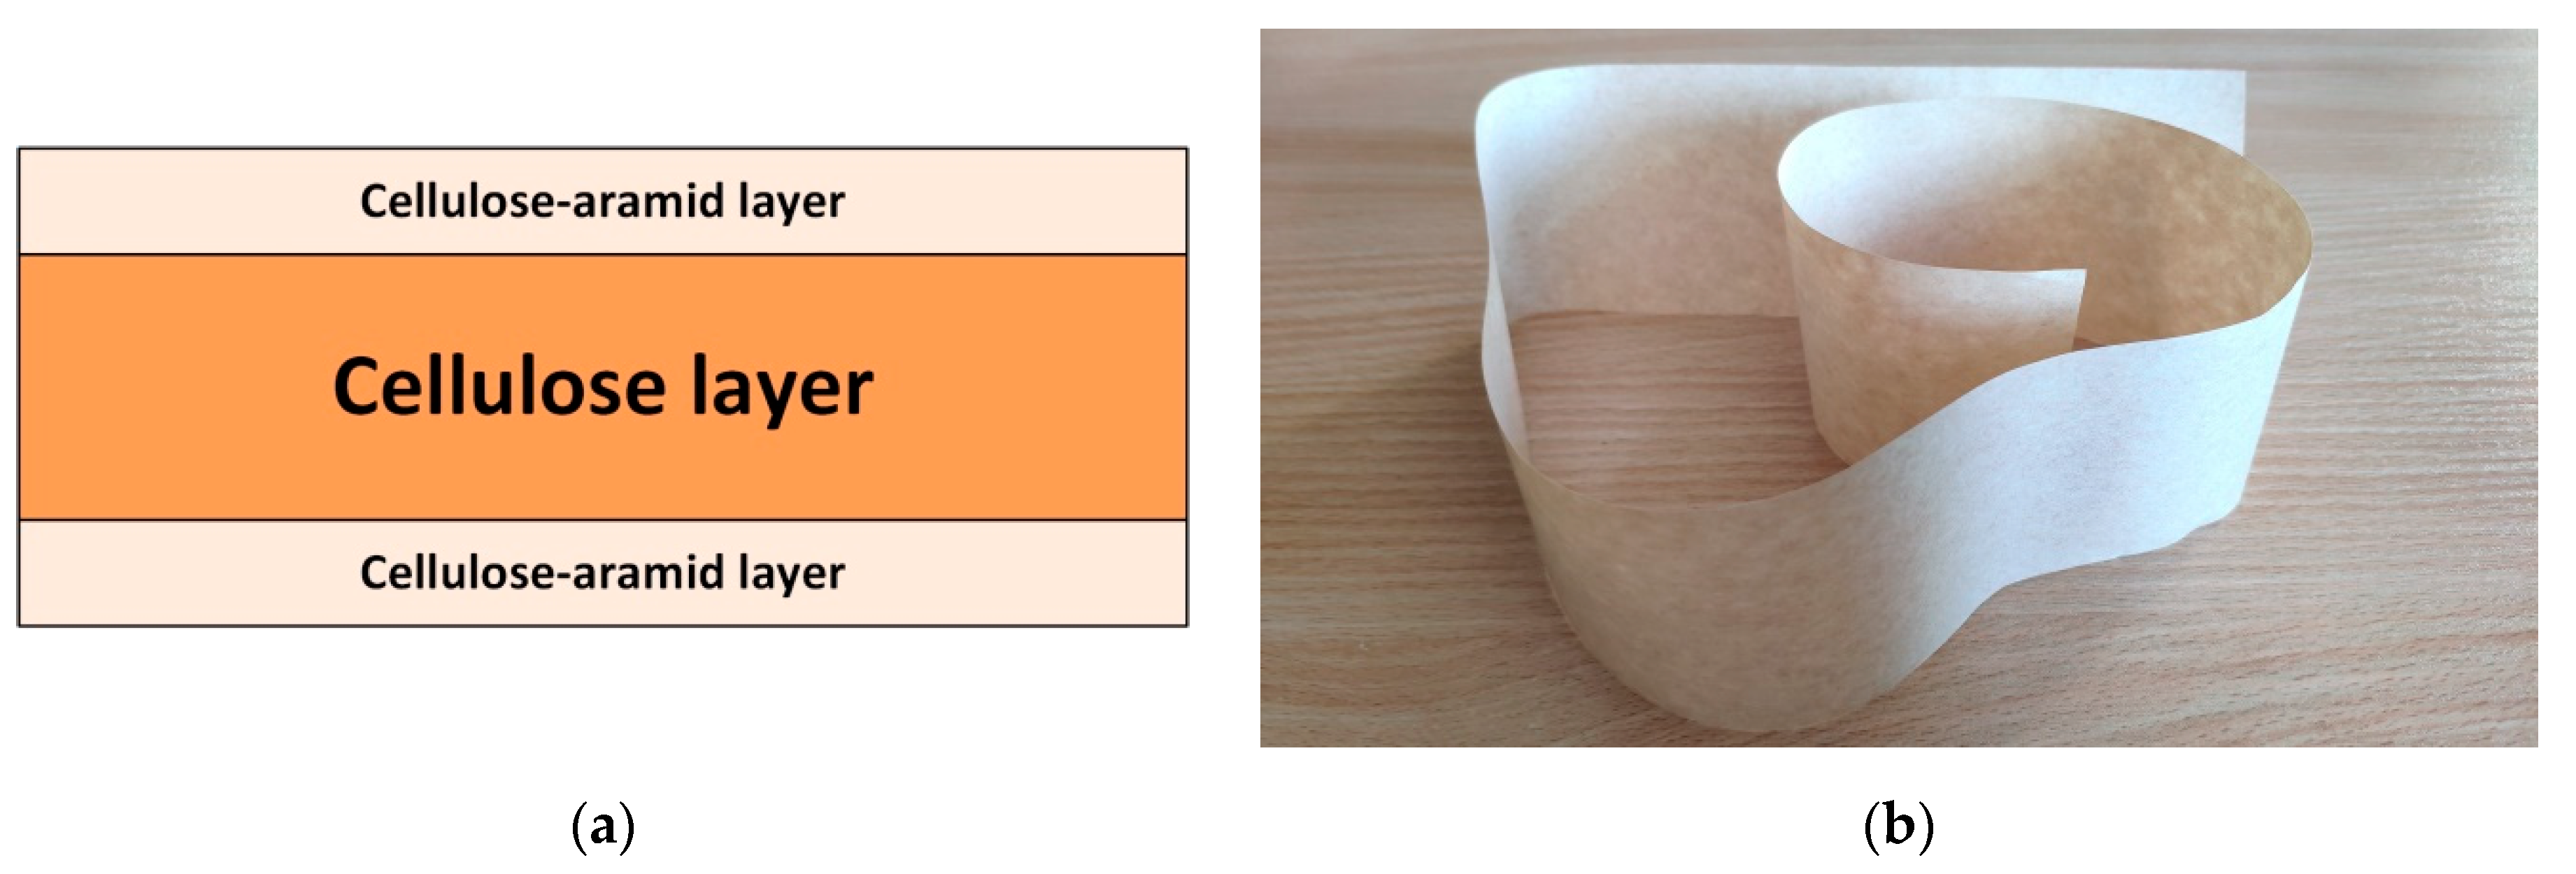
Figure 1 presents the cross-section of NOMEX®910 material structure and a real photograph of a small sample.
An approx. 10 °C increase in the temperature class of cellulose–aramid papers as compared to Kraft type cellulose papers is obviously not their single advantage. The basic objective of the designers was to obtain an increased mechanical strength of the new material, more precisely, tearing, breaking and tensile strength. It was assumed that, while in the case of the new cellulose–aramid material the listed parameters values will be similar to classical cellulose paper, along with the maintenance-related ageing process, the new material will definitely keep the values required by the standards for a longer time. This results from the fact that aramid fibers demonstrate a considerably higher resistance to the effect of temperature (the temperature class of electro-technical papers made of aramid only for operation in the air is 220 °C, e.g., NOMEX®410 [9]), at the same time, they provide significant strengthening for thermally weakened cellulose. As a result, during operation of the transformer and the inevitably increasing degradation of cellulose (chains of cellulose macromolecules being torn apart as a result of the oxidization, hydrolysis and pyrolysis phenomena), the aramid component will continue to be intact, ensuring the paper’s strengthened mechanical structure, and, consequently, will extend the technical life of the insulation and the whole transformer. The material’s good saturability with dielectric fluids was observed, as well as an increased dielectric strength during electric tests in the environment of mineral oil, which is particularly important [16]. At present, the substantially higher price as compared to Kraft type electro-technical papers should be considered the only disadvantage of NOMEX®910 material. However, because the material appeared on the market just several years ago, there are no statistically significant data describing many aspects related to its maintenance in power transformers. The most important aspects include: migration water processes between oil–aramid–cellulose and the time of setting the hydrodynamic balance depending on the temperature of the whole insulation; heat dissipation processes from the inside of the insulation (particularly when the surface of cellulose–aramid paper is contaminated with insulating oil ageing products); and, finally, the effectiveness of the methods applied so far to diagnose the level of moisture and ageing of the impregnated insulation. In the latter case, this article attempts to answer this very significant aspect with reference to the PDC method. Doubts in this respect can still be a valid factor that discourages potential transformer manufacturers from applying the insulation concerned to a broader extent. Table 1 presents basic technical parameters of 0.08 mm thick NOMEX®910 paper, which has been used in the tests.
Nynas inhibited mineral insulating oil with commercial symbol Nytro 10× was chosen as the impregnating fluid. Mineral oils of this Swedish company are very often applied in power transformers, and installed in European electric energy distribution systems. Table 2 states basic technical parameters of this dielectric fluid.

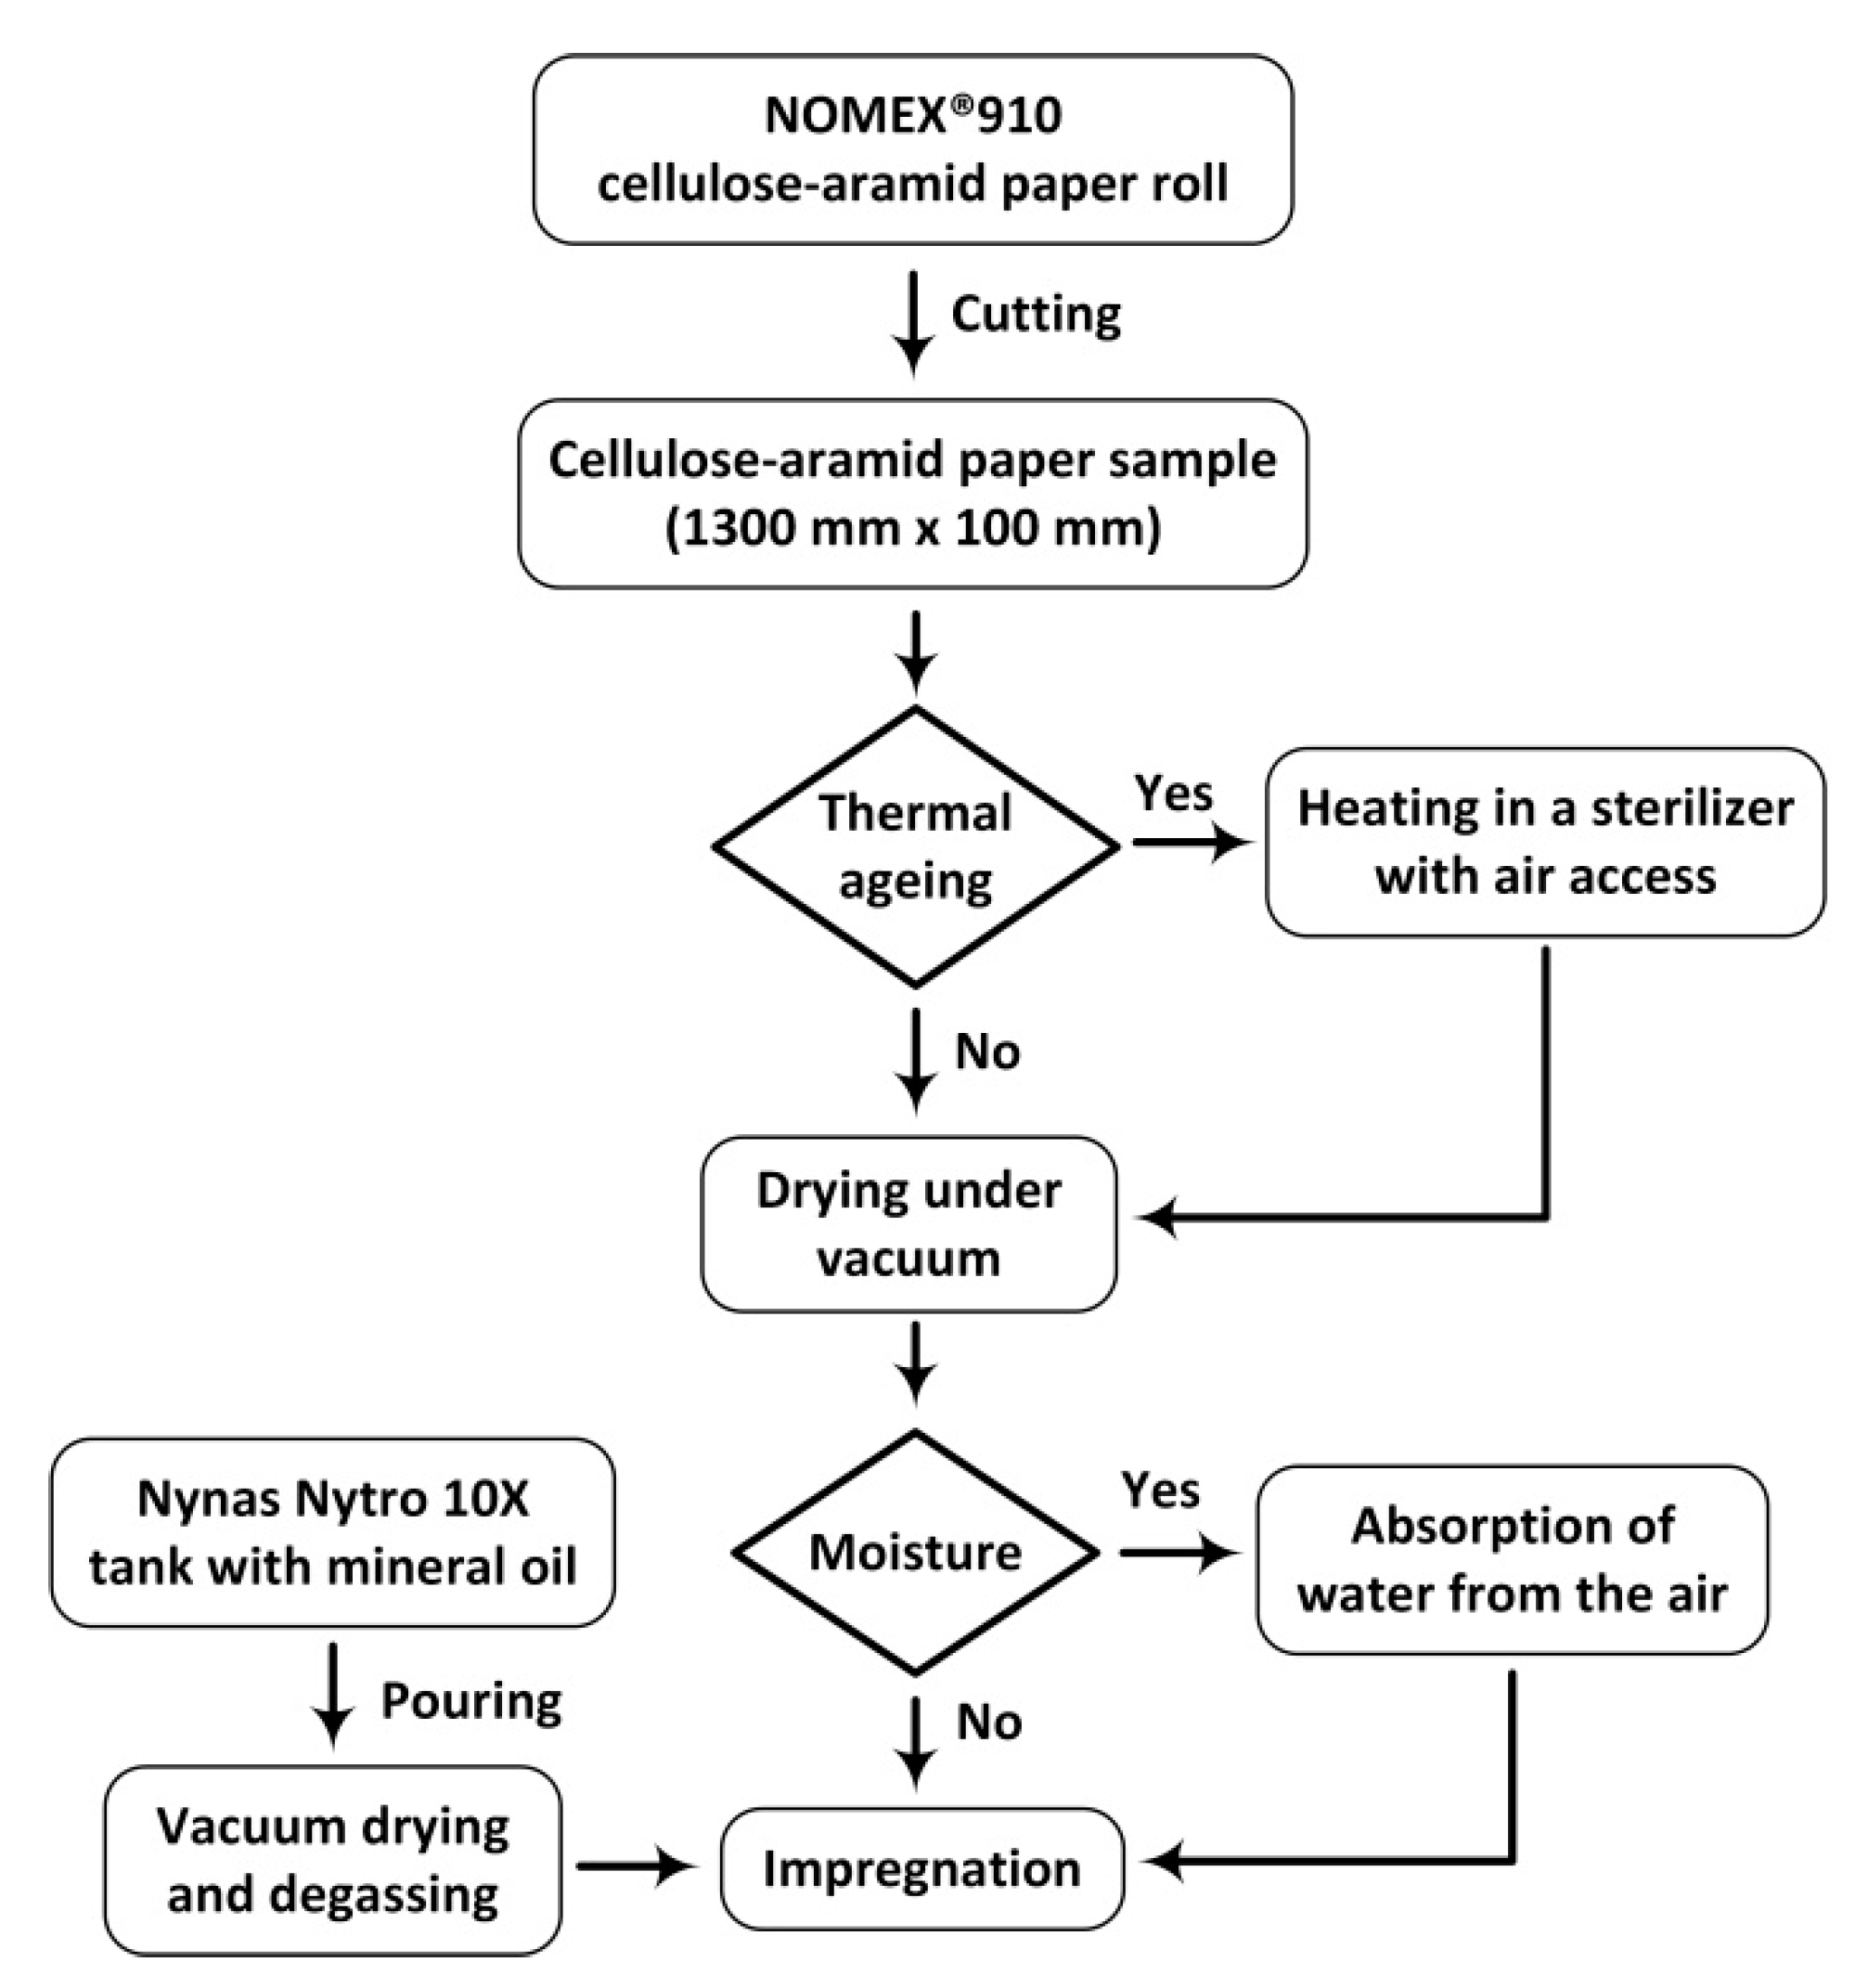
3. Sample Preparation Method

The insulation samples were made of 80 μm thick Nomex®910 transformer cellulose–aramid paper. It is the most frequently used type of cellulose–aramid insulation applied in contemporary new power transformers. The insulation paper was cut into 1300 mm × 100 mm strips. Then, before impregnation, the samples were subjected to a process of accelerated ageing by placing them in a sterilizer and heating at four different temperatures (130 °C, 150 °C, 170 °C and 190 °C) with the access of air for a definite time. In this way, 5 degrees of sample ageing were obtained: 0–1 h of ageing (fresh paper); 2–25 h of ageing at 130 °C; 3–25 h of ageing at 150 °C; 4–25 h of ageing at 170 °C; and 5–25 h of ageing at 190 °C. After the stage of accelerated ageing, the samples were placed in vacuum and heated at 120 °C for 2 h to be dried before impregnation.
Directly after the accelerated thermal ageing processes and drying in vacuum, the samples were subjected to a process of weight-controlled dampening, which consisted of the paper absorbing moisture directly from the surrounding air for a definite time. The degree of sample moisture was determined as the percentage growth in paper weight to a predefined amount. This has resulted in 4 degrees of sample moisture for all 5 degrees of ageing: 1—initial residual moisture (sample impregnation directly after the vacuum drying process, the adopted degree of sample moisture was close to 0%); 2—1.5% sample moisture; 3—2% sample moisture; and 4—2.5% sample moisture. Directly after the weight-controlled dampening process, the samples were subjected to the process of impregnation with the dielectric fluid. Nynas inhibited mineral insulating oil with commercial symbol Nytro 10× was used for this purpose. Before the impregnation process, insulating oil was initially degassed and dried in a vacuum at a temperature of 60 °C for 2 h, reducing the content of water dissolved in oil to approx. 10 ppm. Figure 2 shows the entire sample preparation process as a diagram.
The earlier described parameters of the sample ageing and moisture processes are certainly not accidental. Accelerated thermal ageing of cellulose paper in the environment of atmospheric air causes a significant loss in the degree of polymerization of cellulose macromolecule chains. On the basis of the authors’ past long-term studies and literature data [18,19] it can be stated that the selected ageing time as well as temperature range resulted in a gradual, proportional loss in the degree of cellulose polymerization from a value equal to approx. 1000 (non-aged samples) to approx. 200 (ageing in 190 °C for 25 h). The described scope of changes in the degree of cellulose polymerization corresponds to the whole technical life of cellulose insulation in power transformers [20]. Likewise, it can be assumed that the degree of moisture of cellulose–oil insulation in the range between approx. 0% and 2.5% in practice corresponds to moisture recorded in the statistical majority of power transformers working in electric energy distribution systems of many states [21,22]. Due to some technical problems and the long process of sample moistening, the decision was made to resign from values exceeding 2.5% of water in paper, knowing that values reaching as much as approx. 5% are recorded in strongly worn out transformers. It was decided to consider higher degrees of sample moisture in future tests.
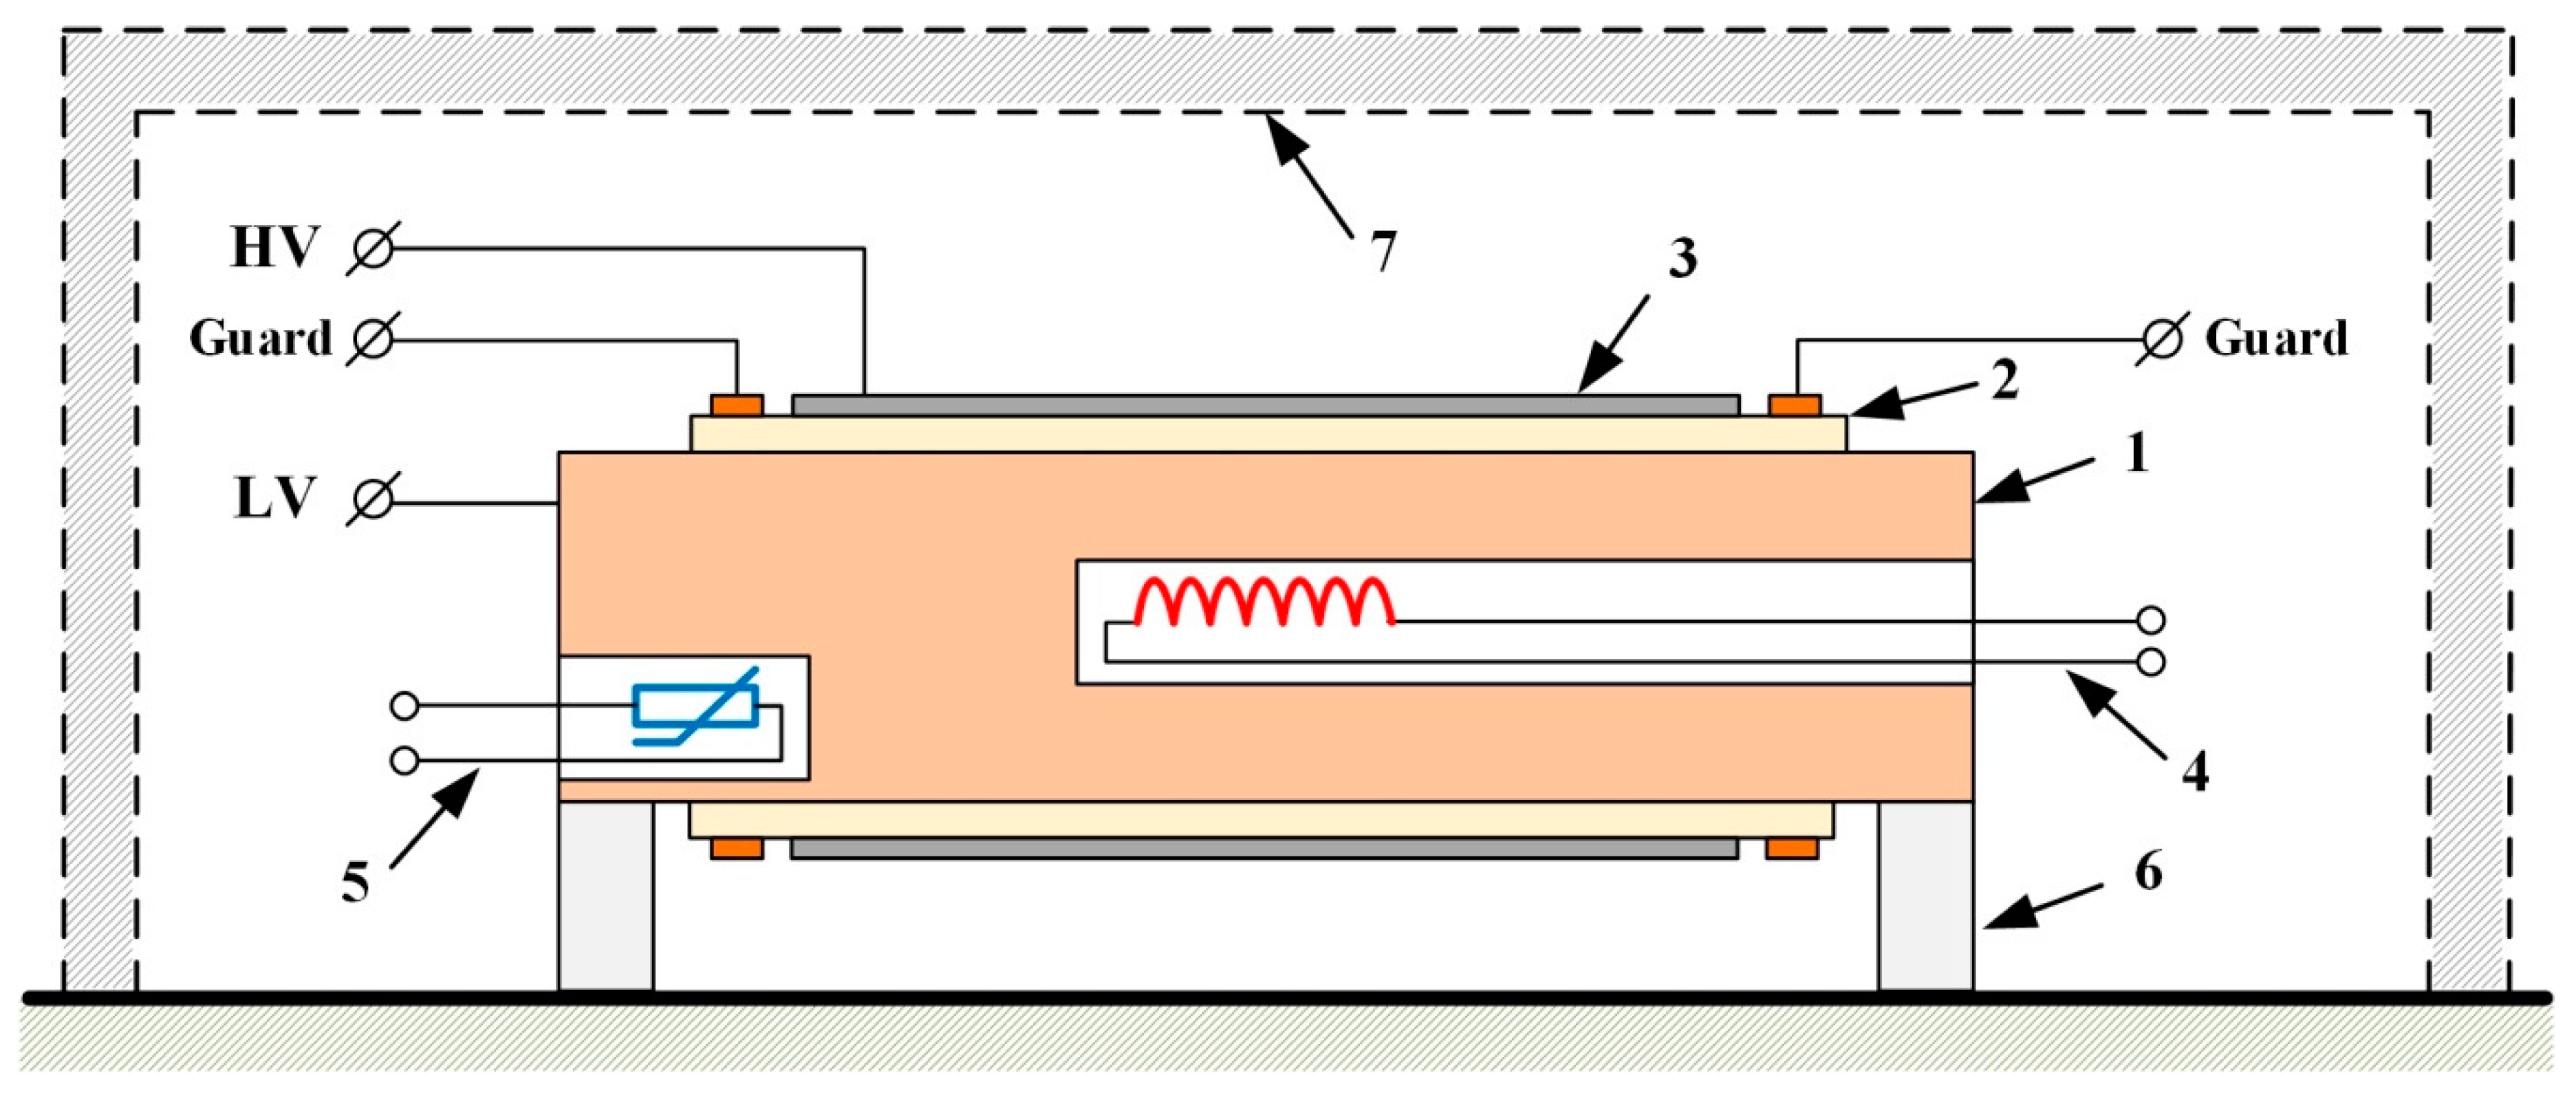
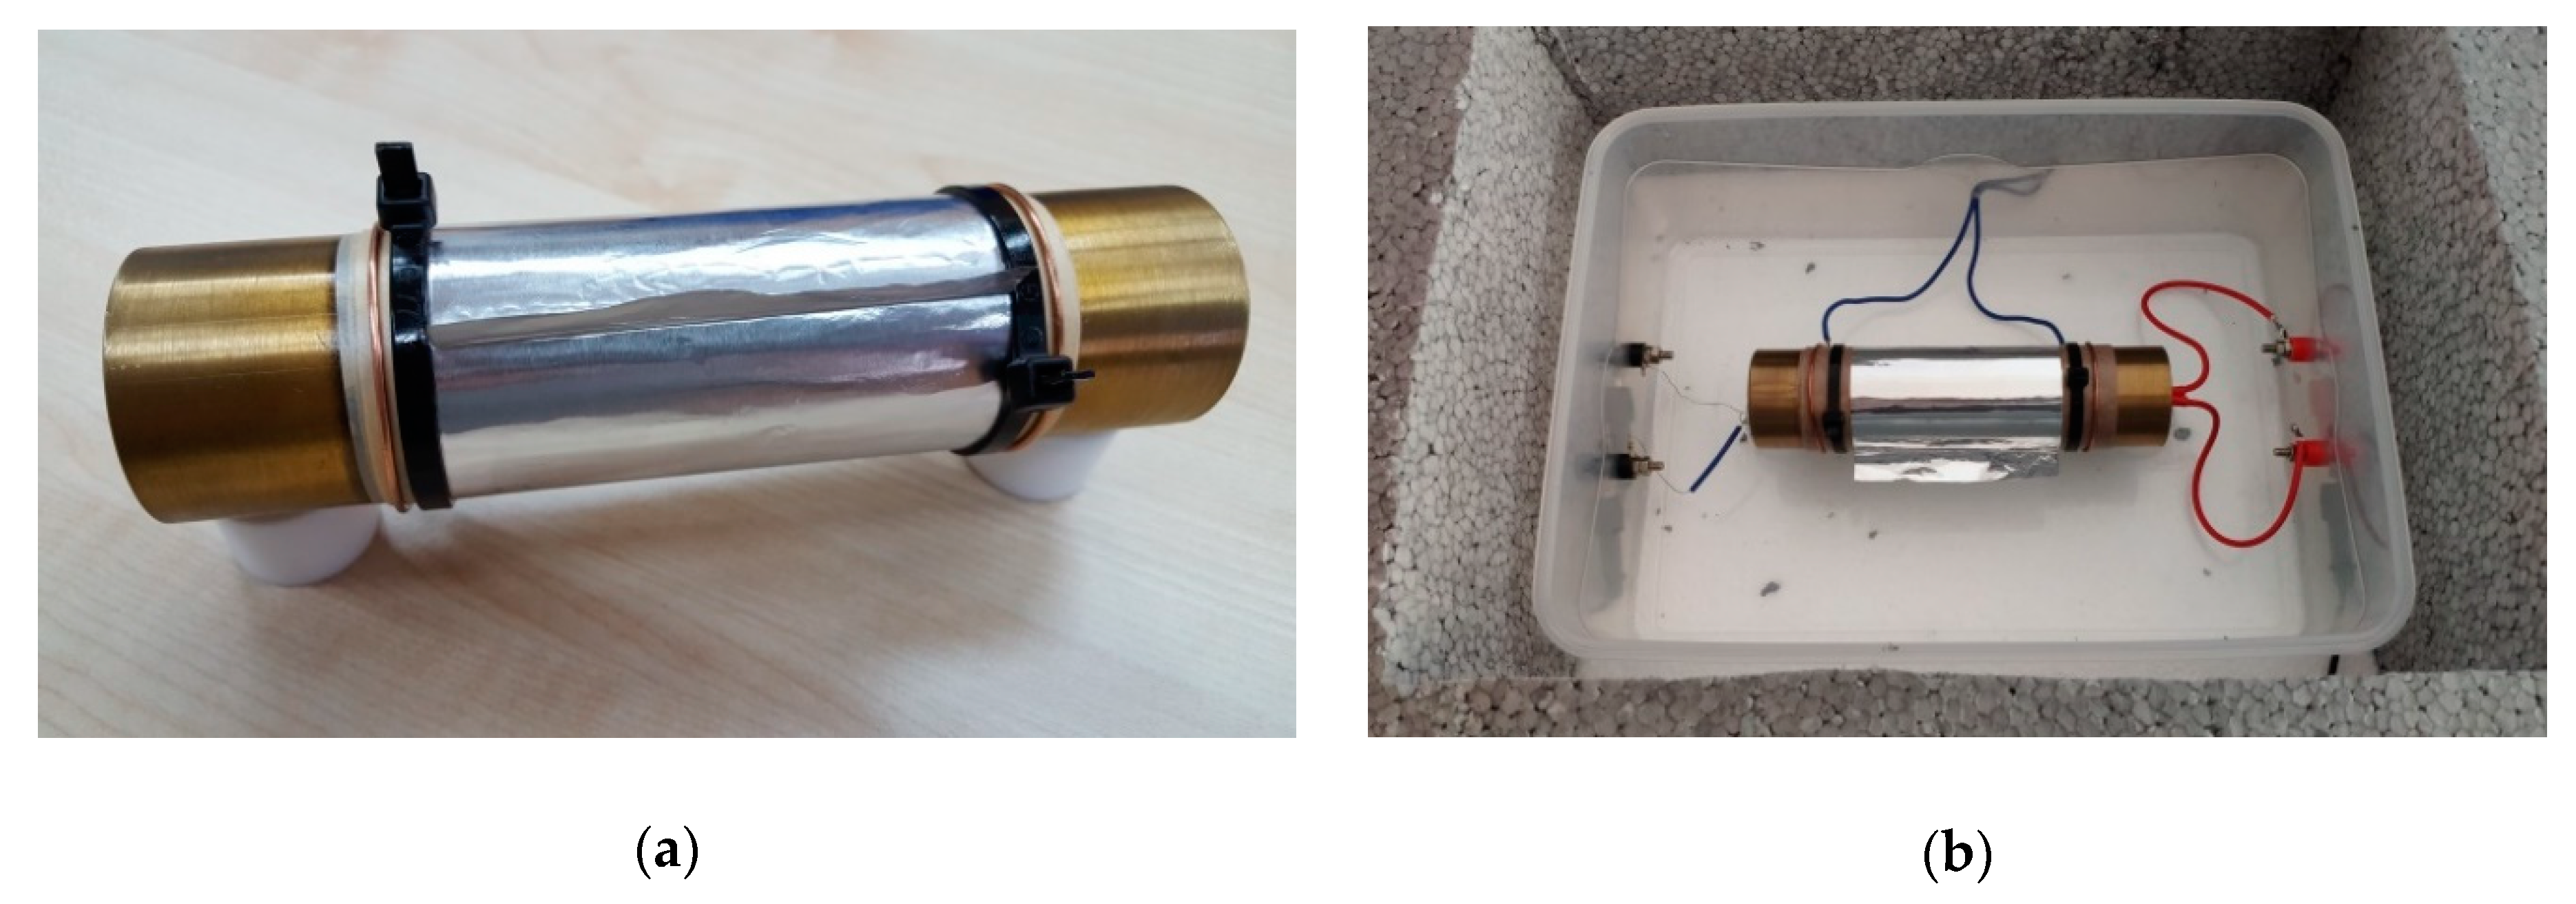
After the impregnation process, the samples were wound on the low potential electrode, which was a brass roll of 160 mm length and 40 mm diameter. In this way, 10 layers of insulation were obtained. The high potential electrode was made of a thin 80 mm aluminum foil. The foil was wound on the roll with the sample. Figure 3 shows a cross section of the electrode system and Figure 4 shows the system ready for testing. The tests were carried out in a hermetic chamber equipped with a system for temperature adjustment and stabilization. The tests were performed in the temperature range from 20 °C to 60 °C, which is consistent with the values typical of PDC diagnostics [13,14,15].

4. PDC Method

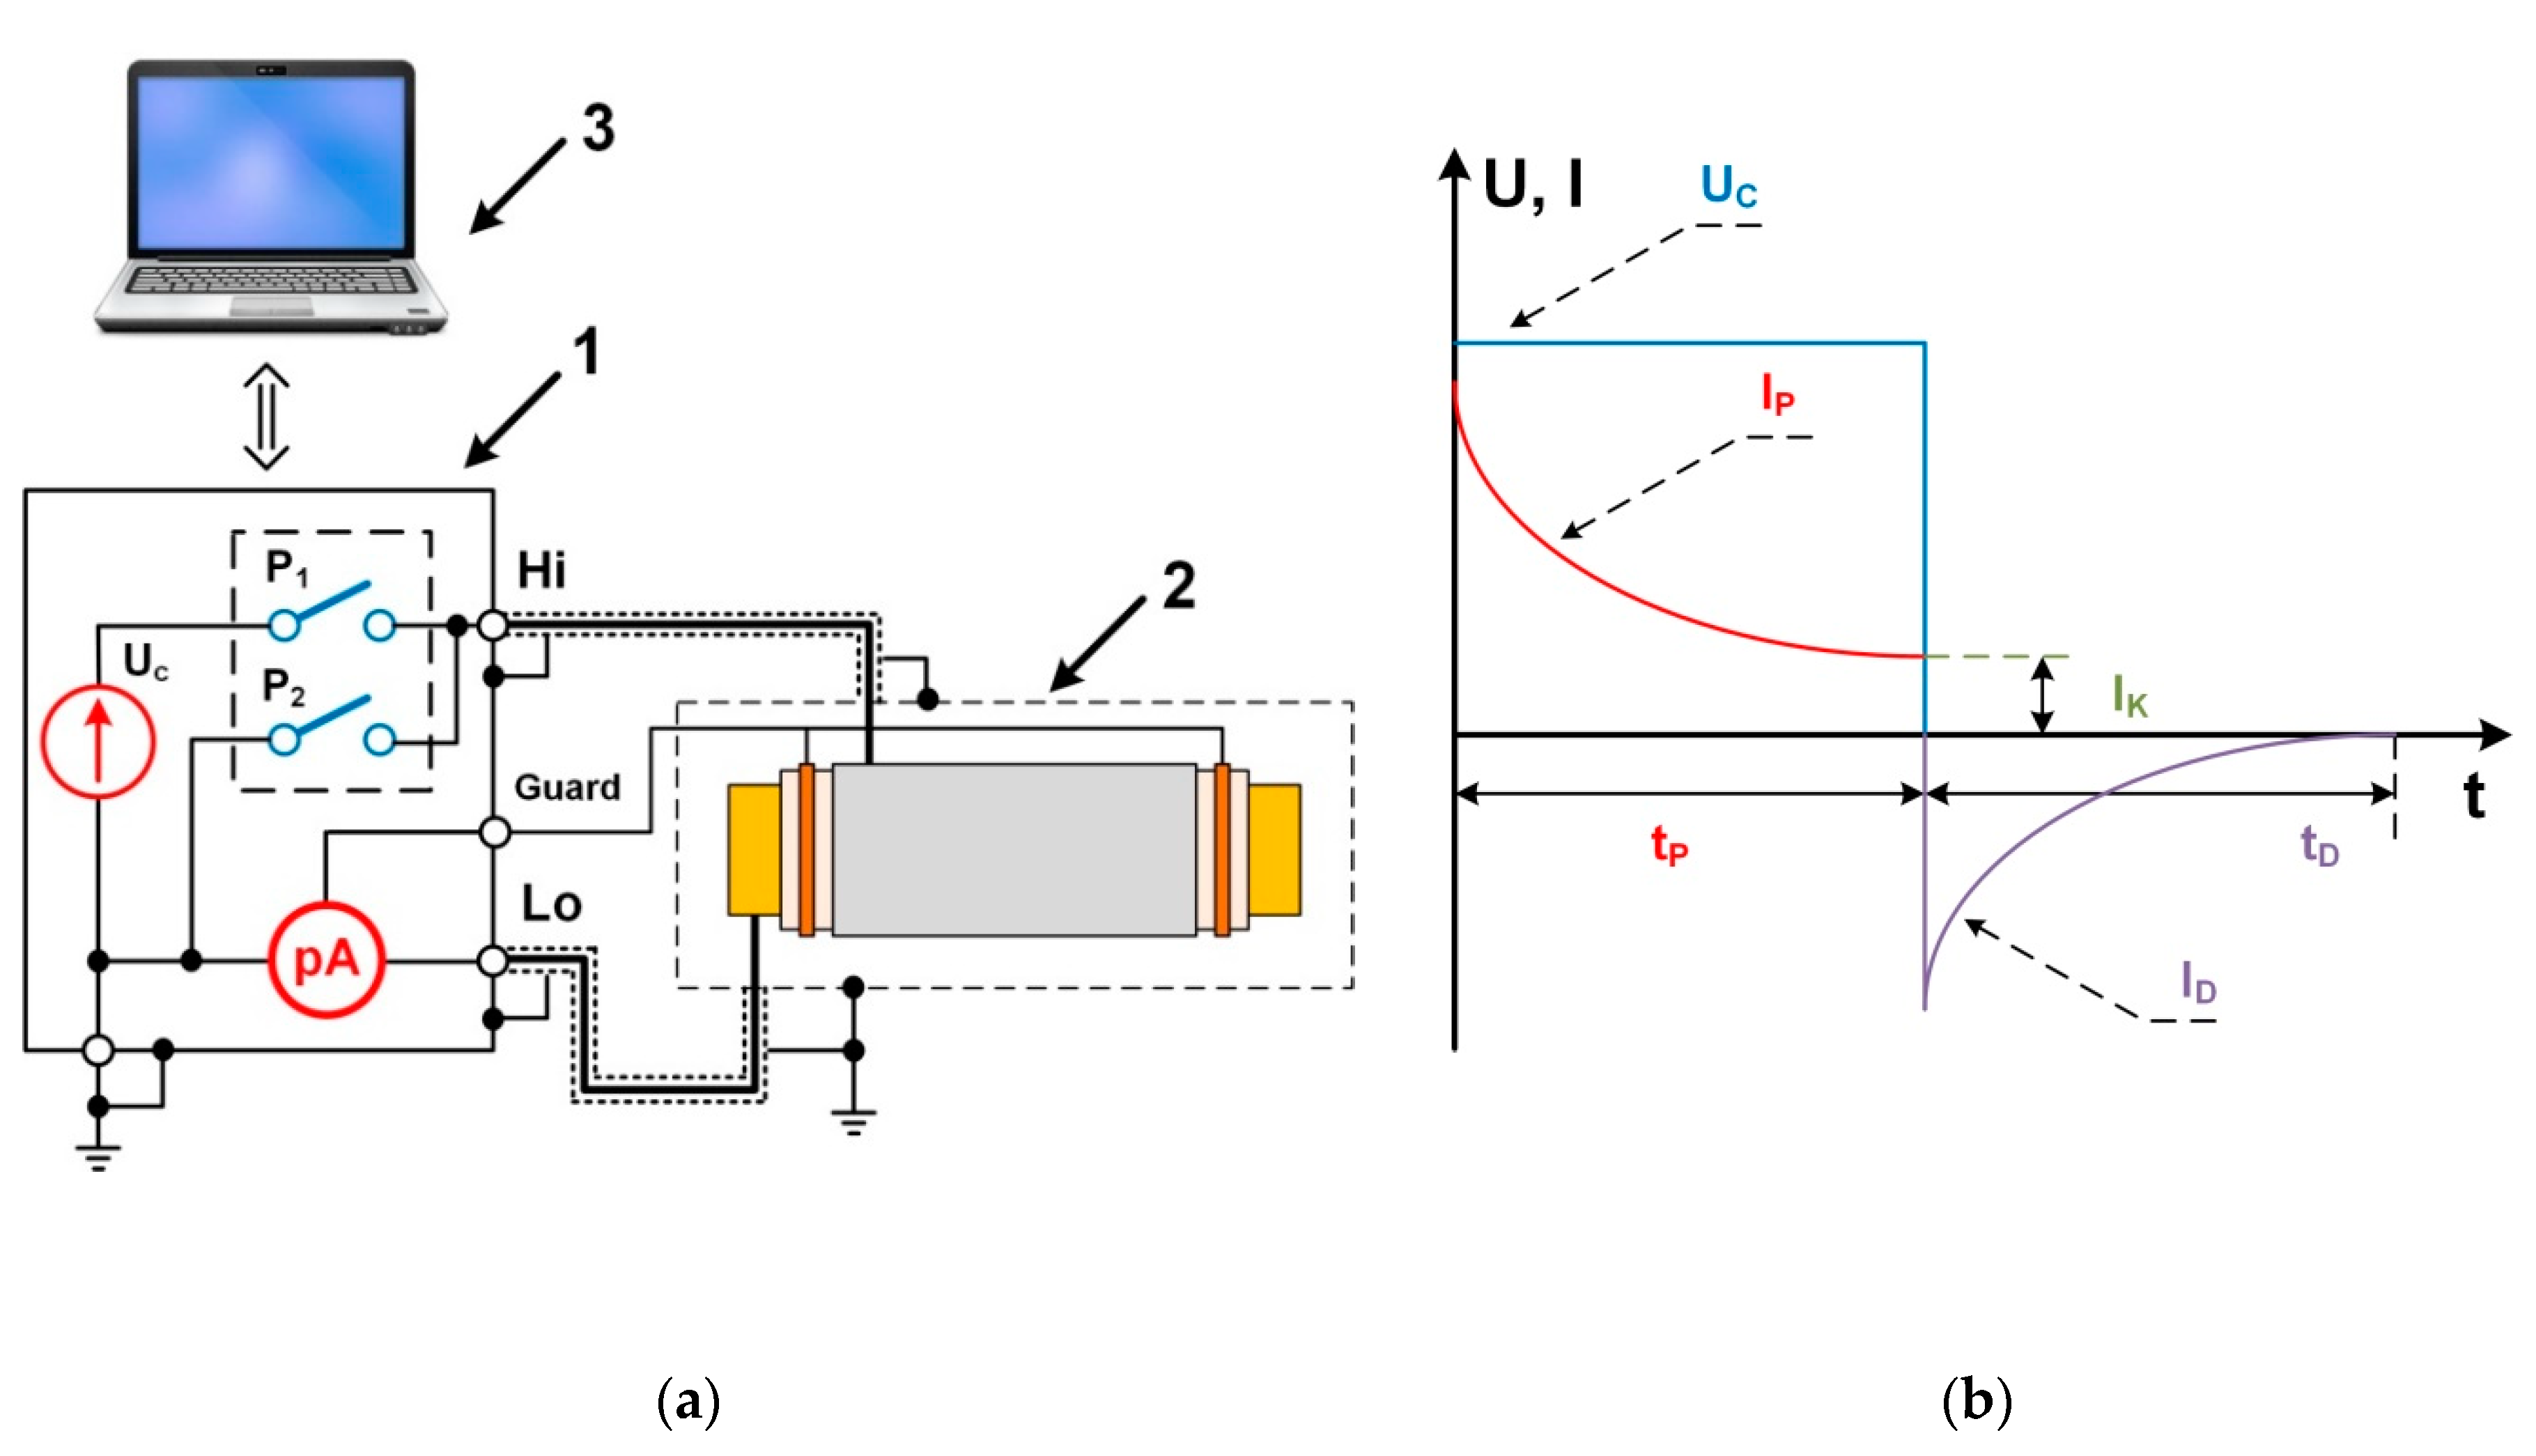
Figure 5 presents a diagram of the connections used in diagnostics of the condition of the paper–oil insulation using the PDC method and time characteristics of currents and voltages which were recorded while performing the tests. The PDC method consists of applying to the examined object (in the industrial diagnostics, these are clamps of a power transformer) a source of DC voltage and measuring and recording IP polarization current for a certain period of time tP. After time tP, the voltage source is disconnected, and the examined object’s measuring clamps are shortened. Then, the measurement and registration of ID depolarization current begins, also for a certain period of time tD. IP current decreases over the time of impact of the voltage source until the course is fixed at a certain level IK resulting from a finite resistivity value of the insulation being examined. On the other hand, ID current has the opposite sign to IP current and also decreases over time. Finally, the course of ID current decreases until zero is achieved, when the examined system discharges completely.
From the point of view of diagnosing the condition of oil insulation in power transformers, it is extremely important to select the right value of UC charging voltage and IP and ID current recording times. On the one hand, too low a value of UC voltage will cause substantial measuring difficulties (in the PDC method typical recorded current values are nA fractions), and thereby growth in interference (external and resulting from the presence of electrostatic loads in the insulation being examined). On the other hand, too high a UC value will cause the “masking” effect of the conductivity element of IP current (problems in precise registration of the absorption element of IP current) and can cause non-linear relaxation phenomena, significantly hindering the correct interpretation of the received measurement results. For this reason, it is recommended for the UC voltage value in the diagnostics of the condition of the paper–oil insulation in power transformers not to exceed 1 kV. The relaxation mechanism time constant values existing in such insulation require the polarization and depolarization time not to be shorter than min. 1000 s.
When relay P1 is switched on (Figure 5a), the UC charging voltage is put on the object being examined and IP polarization current flowing in the measuring circuit is registered (Figure 5b). After time tP, the control system switches P1 relay off and P2 on. Then, ID depolarization current is recorded in the circuit. The measurement is ended after time tD, when P2 relay is opened. The PDC method requires very careful shielding of the measurement cables, the examined object, and the measurements to be made with reference to the joint earth potential.
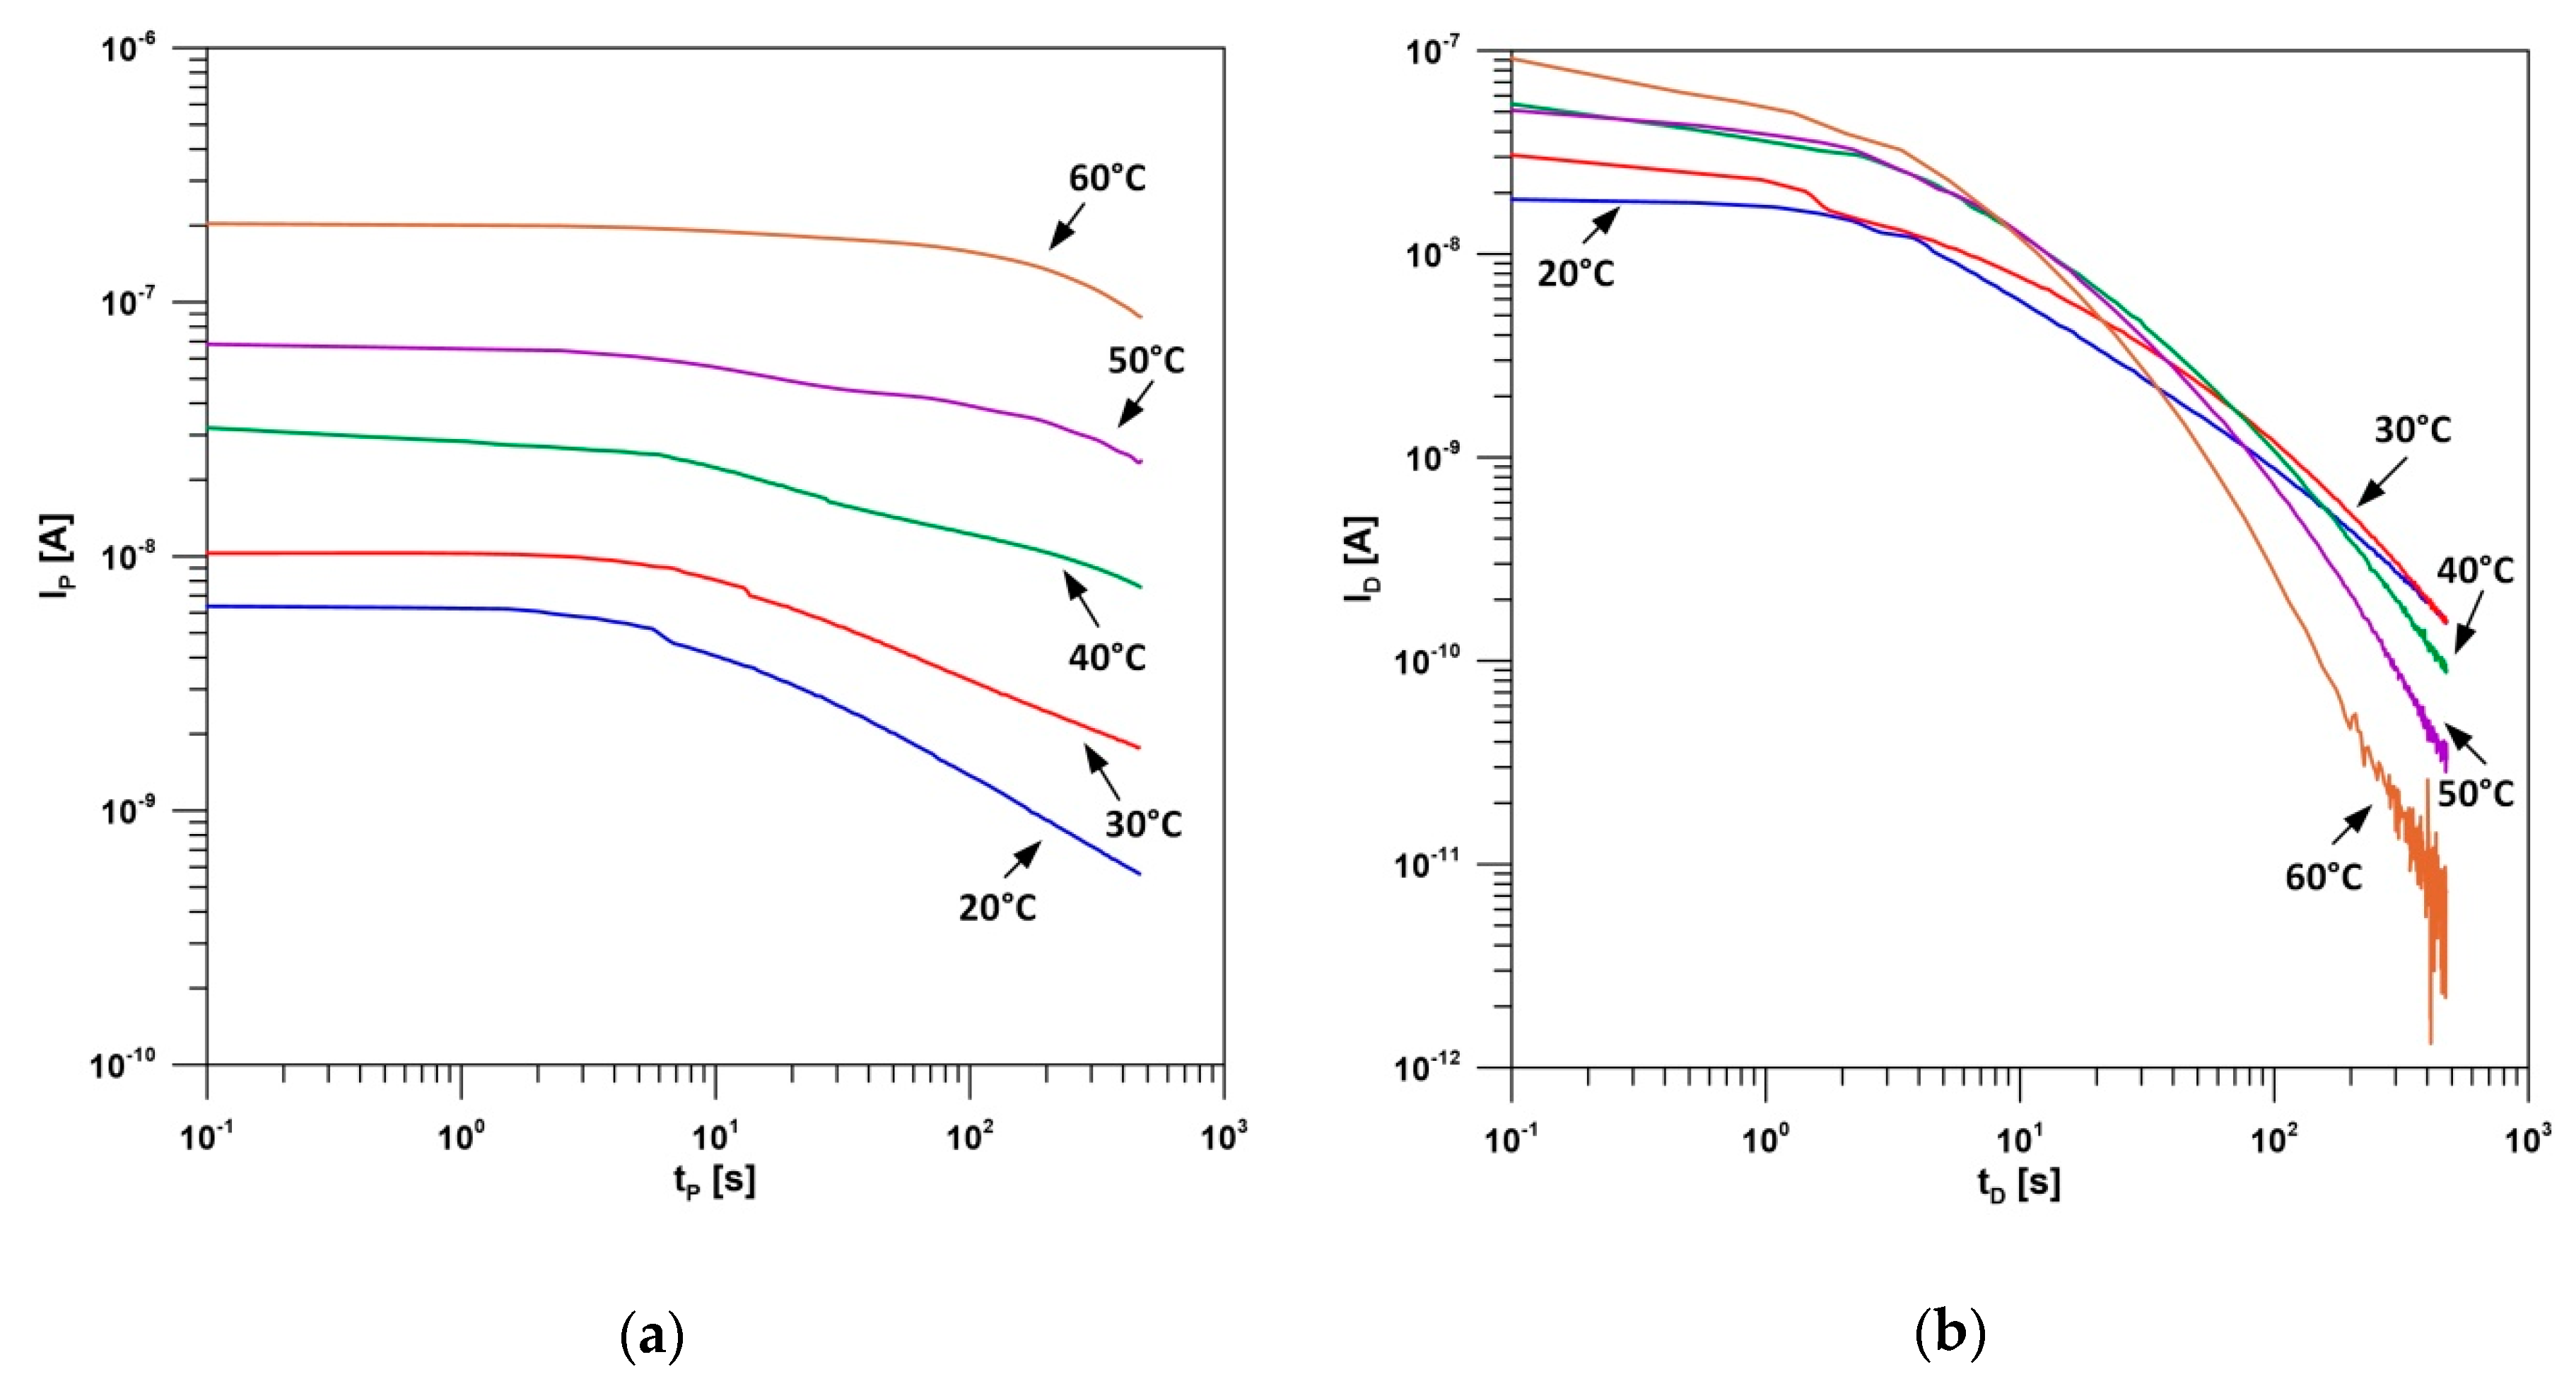
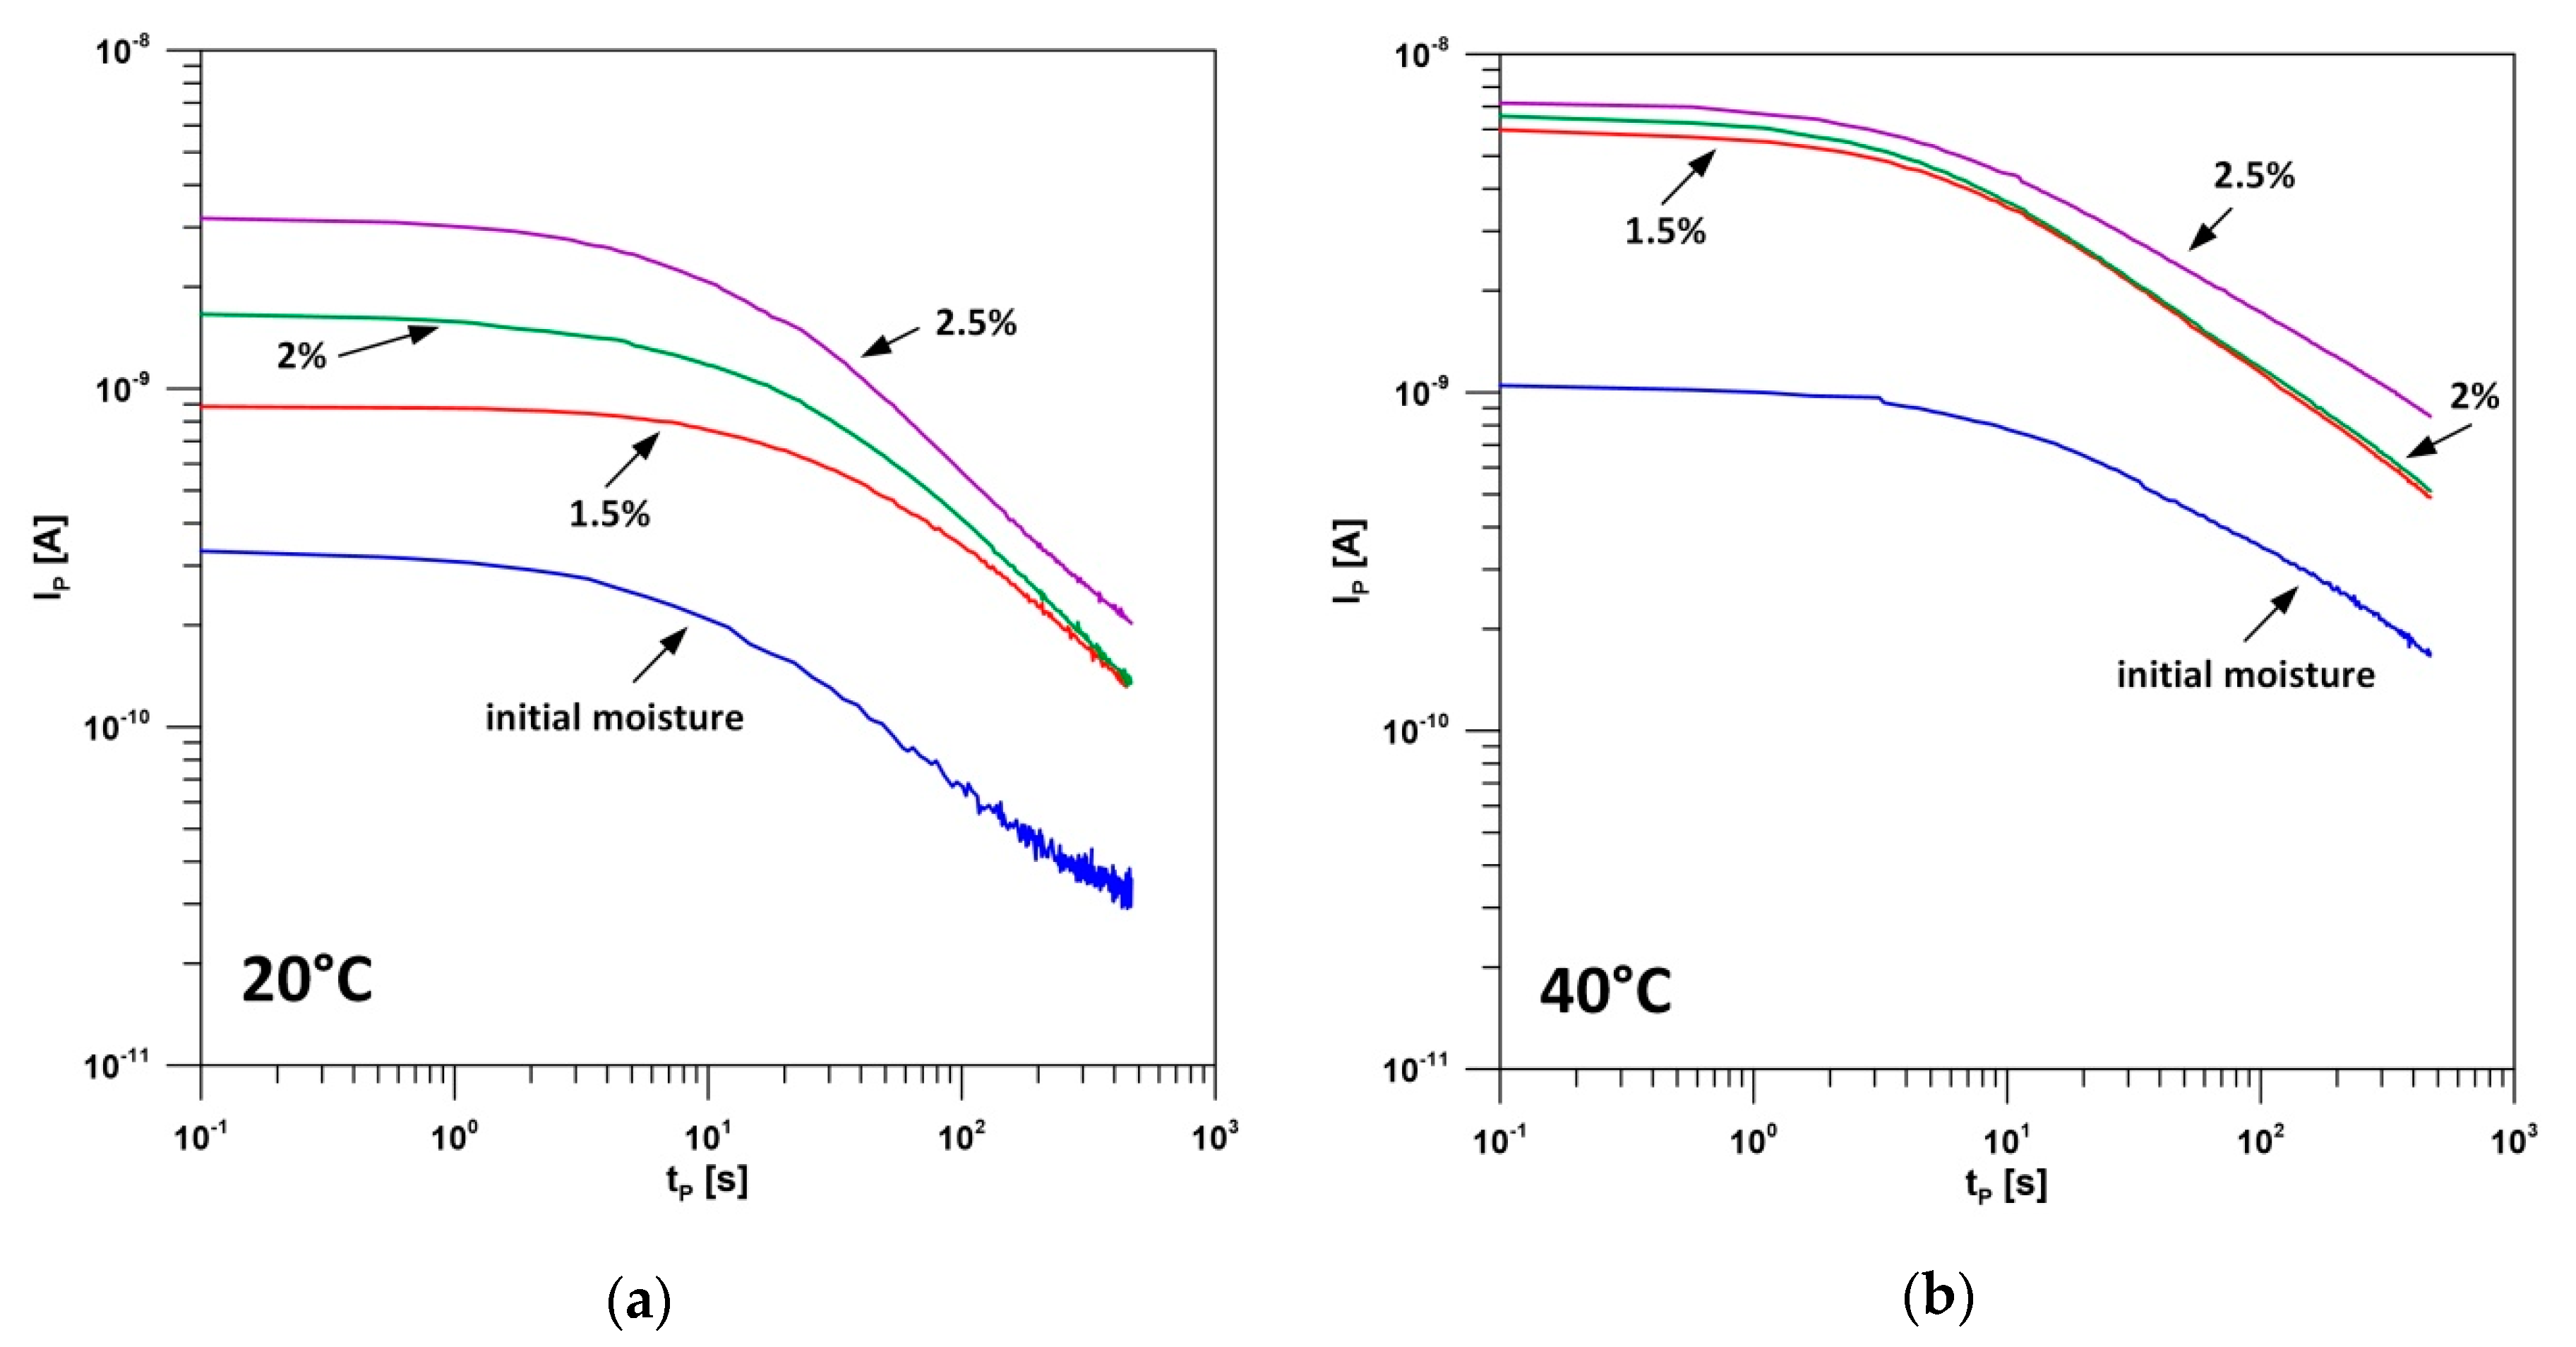
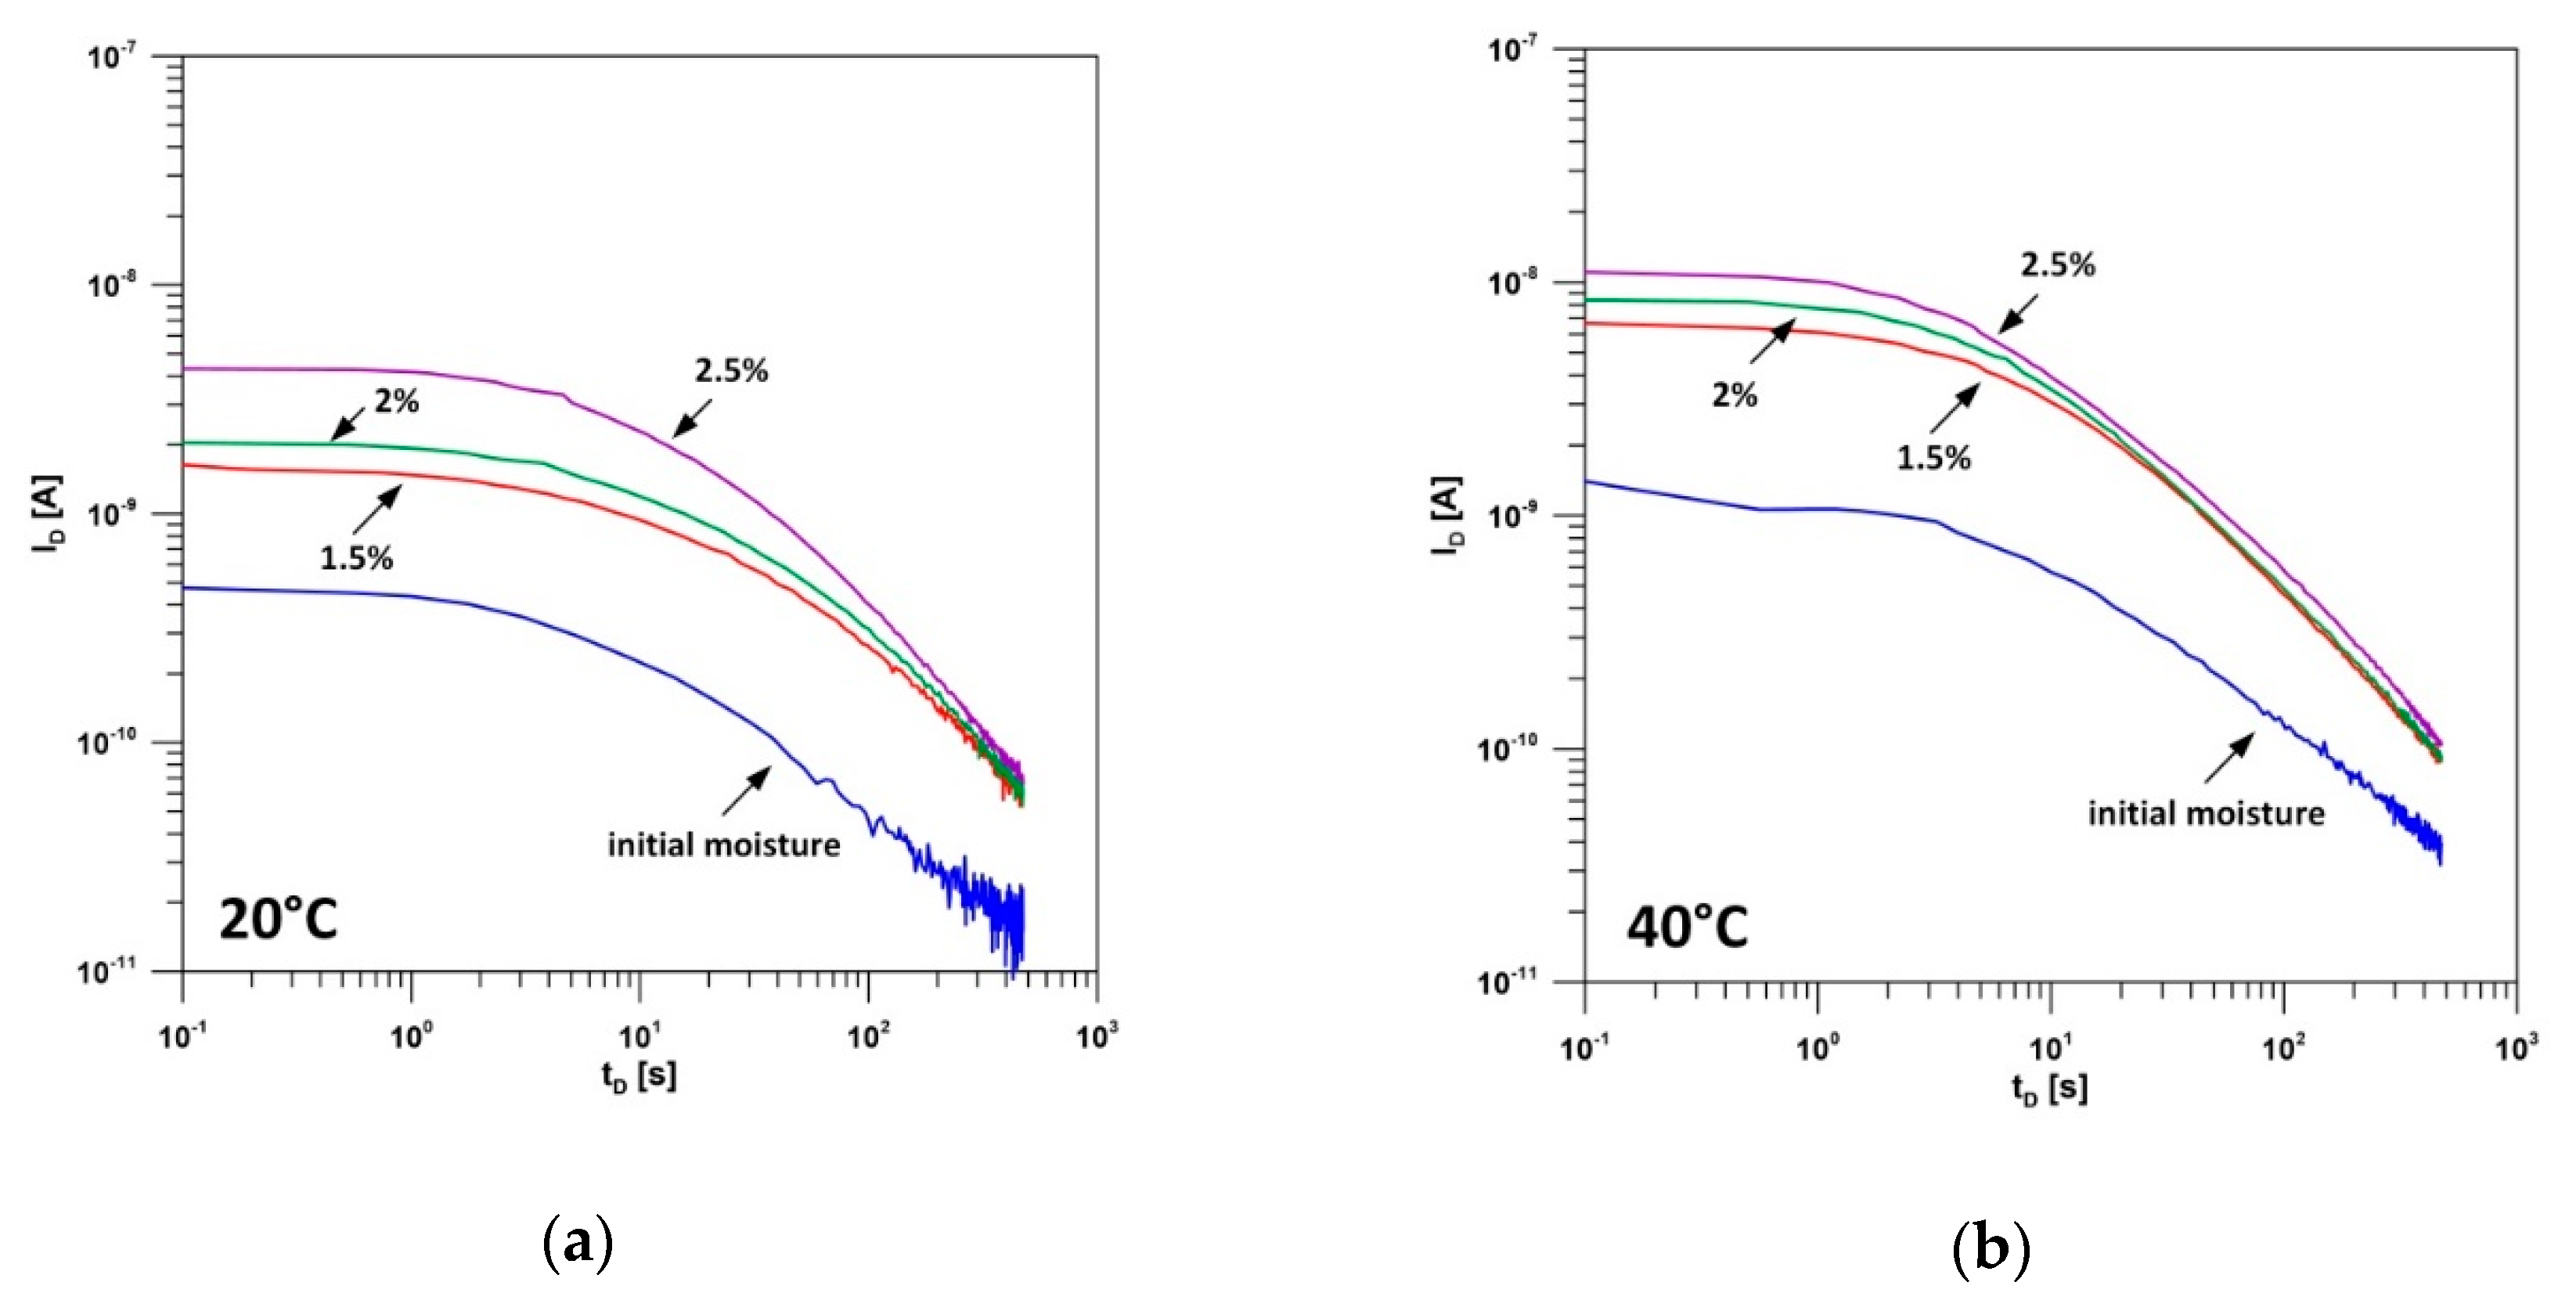
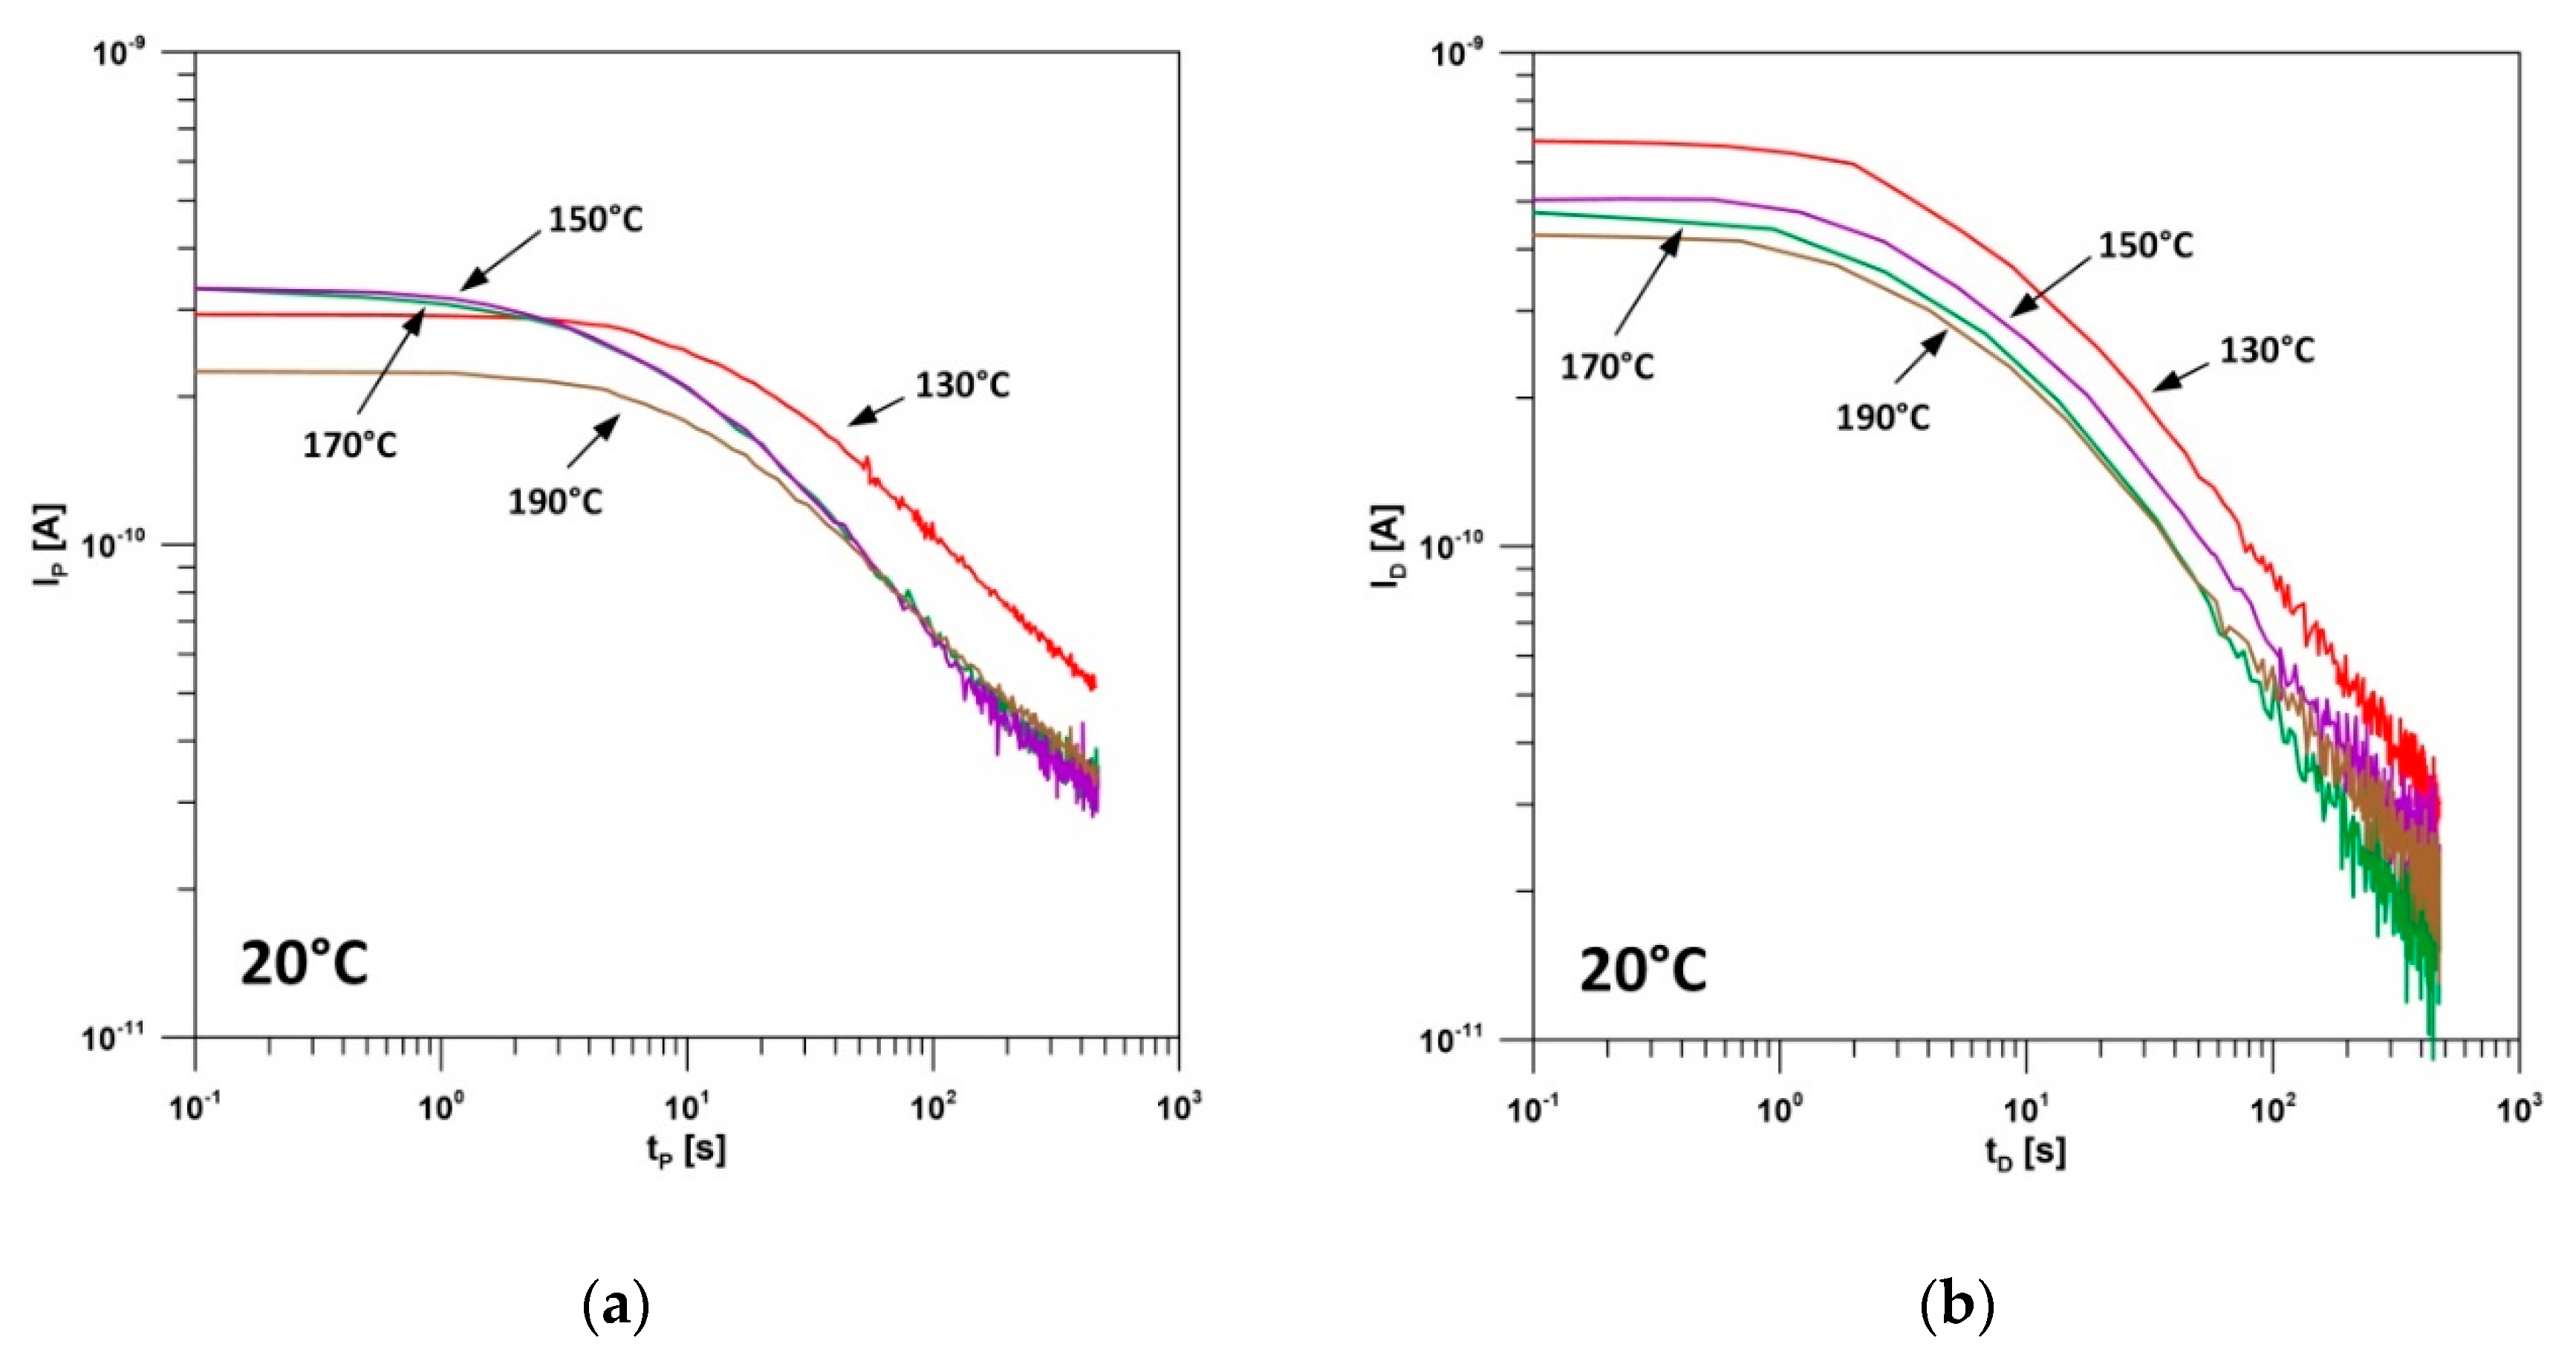
In the first approx. 100 s of the polarization and depolarization current measurement, the recorded values are mainly determined by the properties of the insulating oil, i.e., first of all its conductivity, provided that in this case important factors are the following: degree of moisture, contamination, acid value or the effect of temperature. Increasing oil conductivity causes almost proportional increases in the initial polarization current values, therefore it is possible to fix oil conductivity from IP values registered directly after applying the UC voltage. The condition of cellulose–aramid insulation is determined for considerably longer times, sometimes even exceeding 1000 s [13,14,15]. The degree of cellulose moisture determines the current leakage value, which increases along with the increasing moisture. A much faster depolarization current decay is also observed.
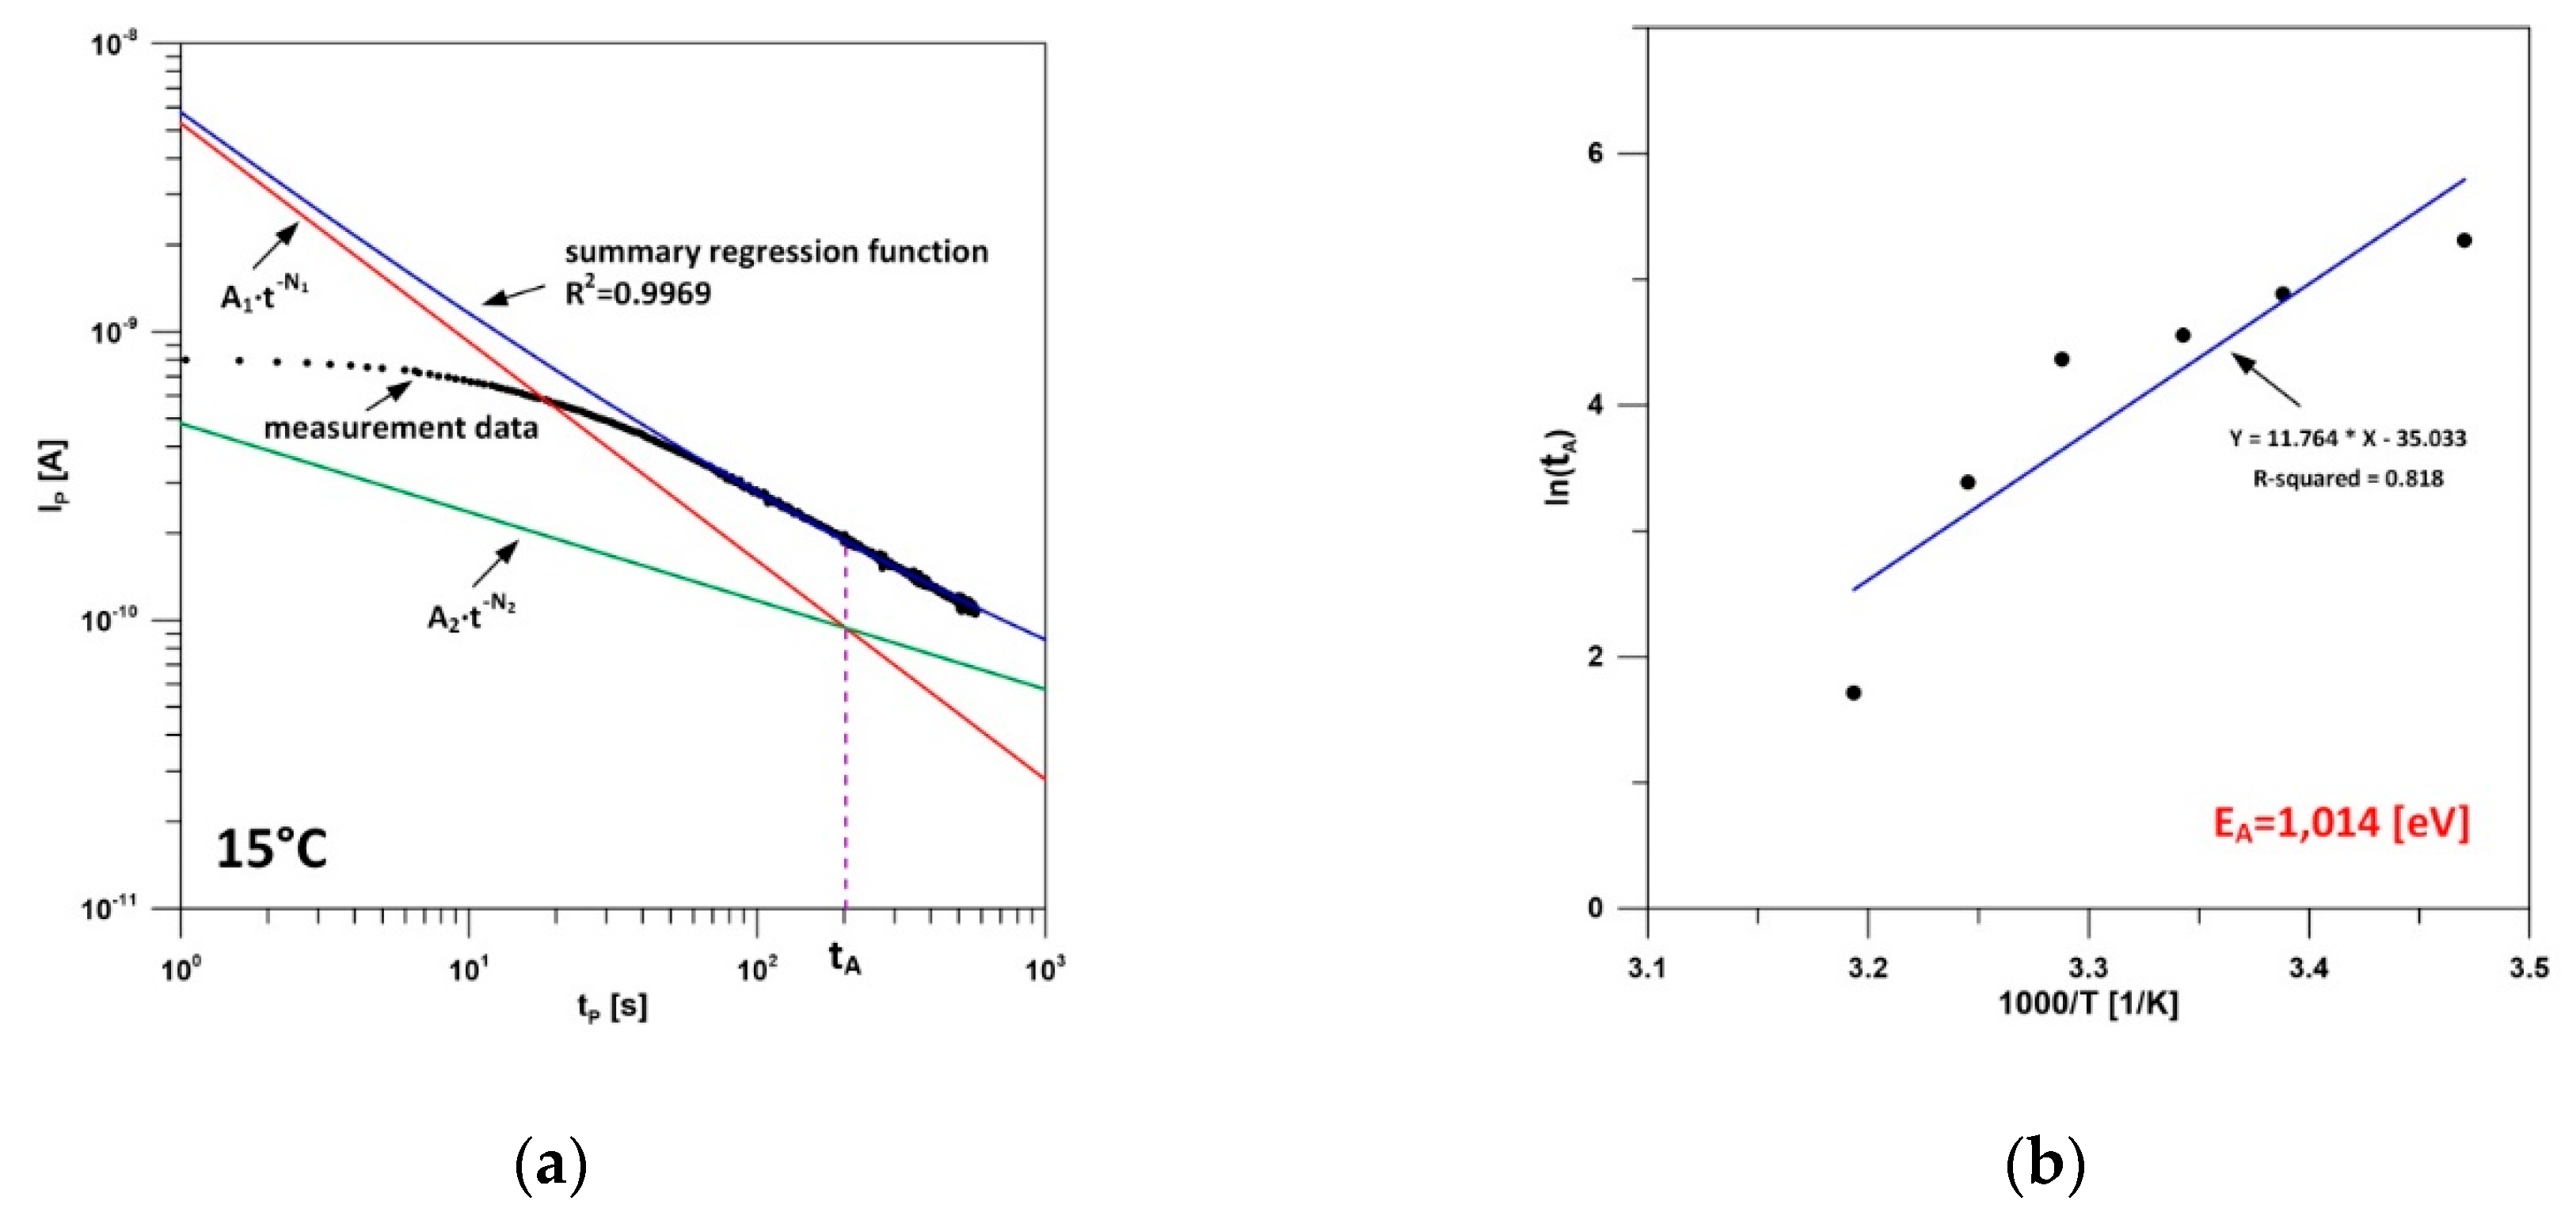
With sample polarization current time characteristics, it was decided to determine activation energy EA at which the low-frequency cellulose–aramid insulation relaxation process is subject to change. The purpose of the calculations was the assumption that the activation energy EA value is determined by the degree of moisture as well as the ageing of the samples, defined as the degree of cellulose macromolecule thermal degradation. The Low-Frequency Dispersion Jonscher equation was used as the sought sample polarization current regression function [23] in the form of:
I P ( t ) A 1 · t N 1 + A 2 · t N 2 ,
where A1, A2, N1, N2—function parameters.
The activation energy EA can be calculated utilizing linear approximation of the Arrhenius temperature graph [24], applying the following dependencies:
l n ( t A ) = f ( 1000 T ) ,
E A = 1000 · a · k ,
where tA—characteristic time (after which the relaxation process change occurs), T—sample temperature (in Kelvin degrees), EA—activation energy (eV), a—directional coefficient of linear regression function, and k—Boltzmann constant.
Characteristic time was calculated using the formula:
t A = A 2 A 1 N 1 + N 2 ,
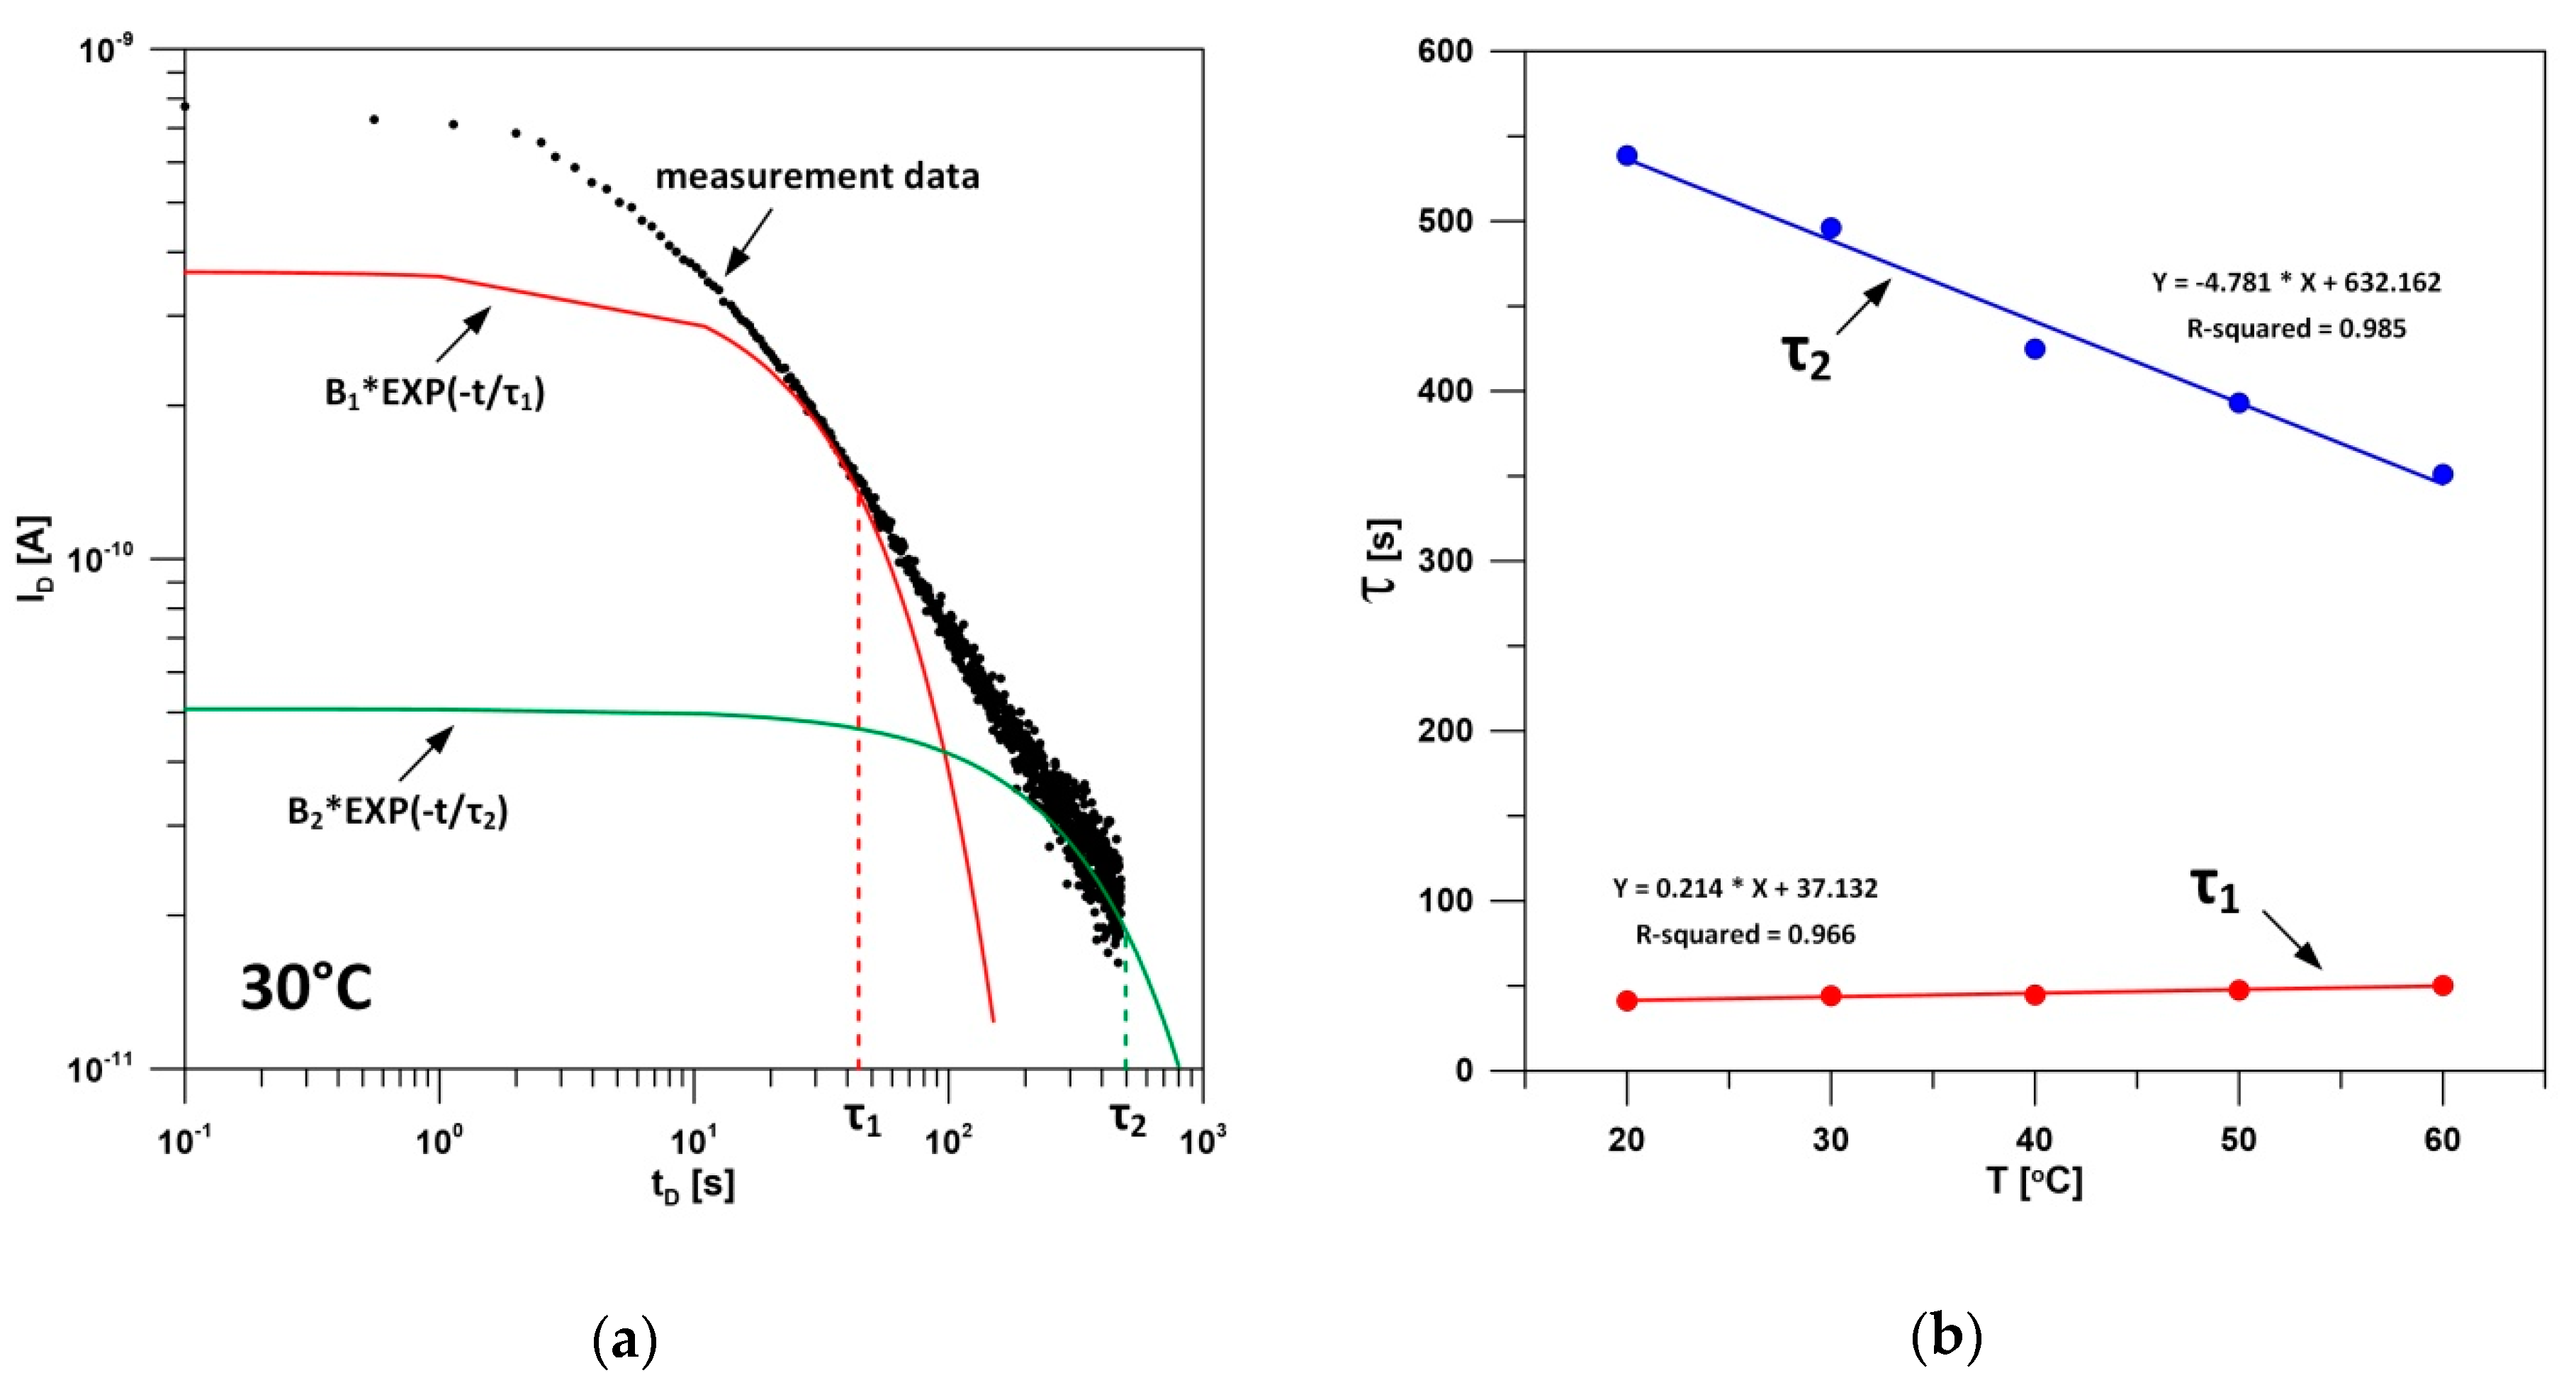
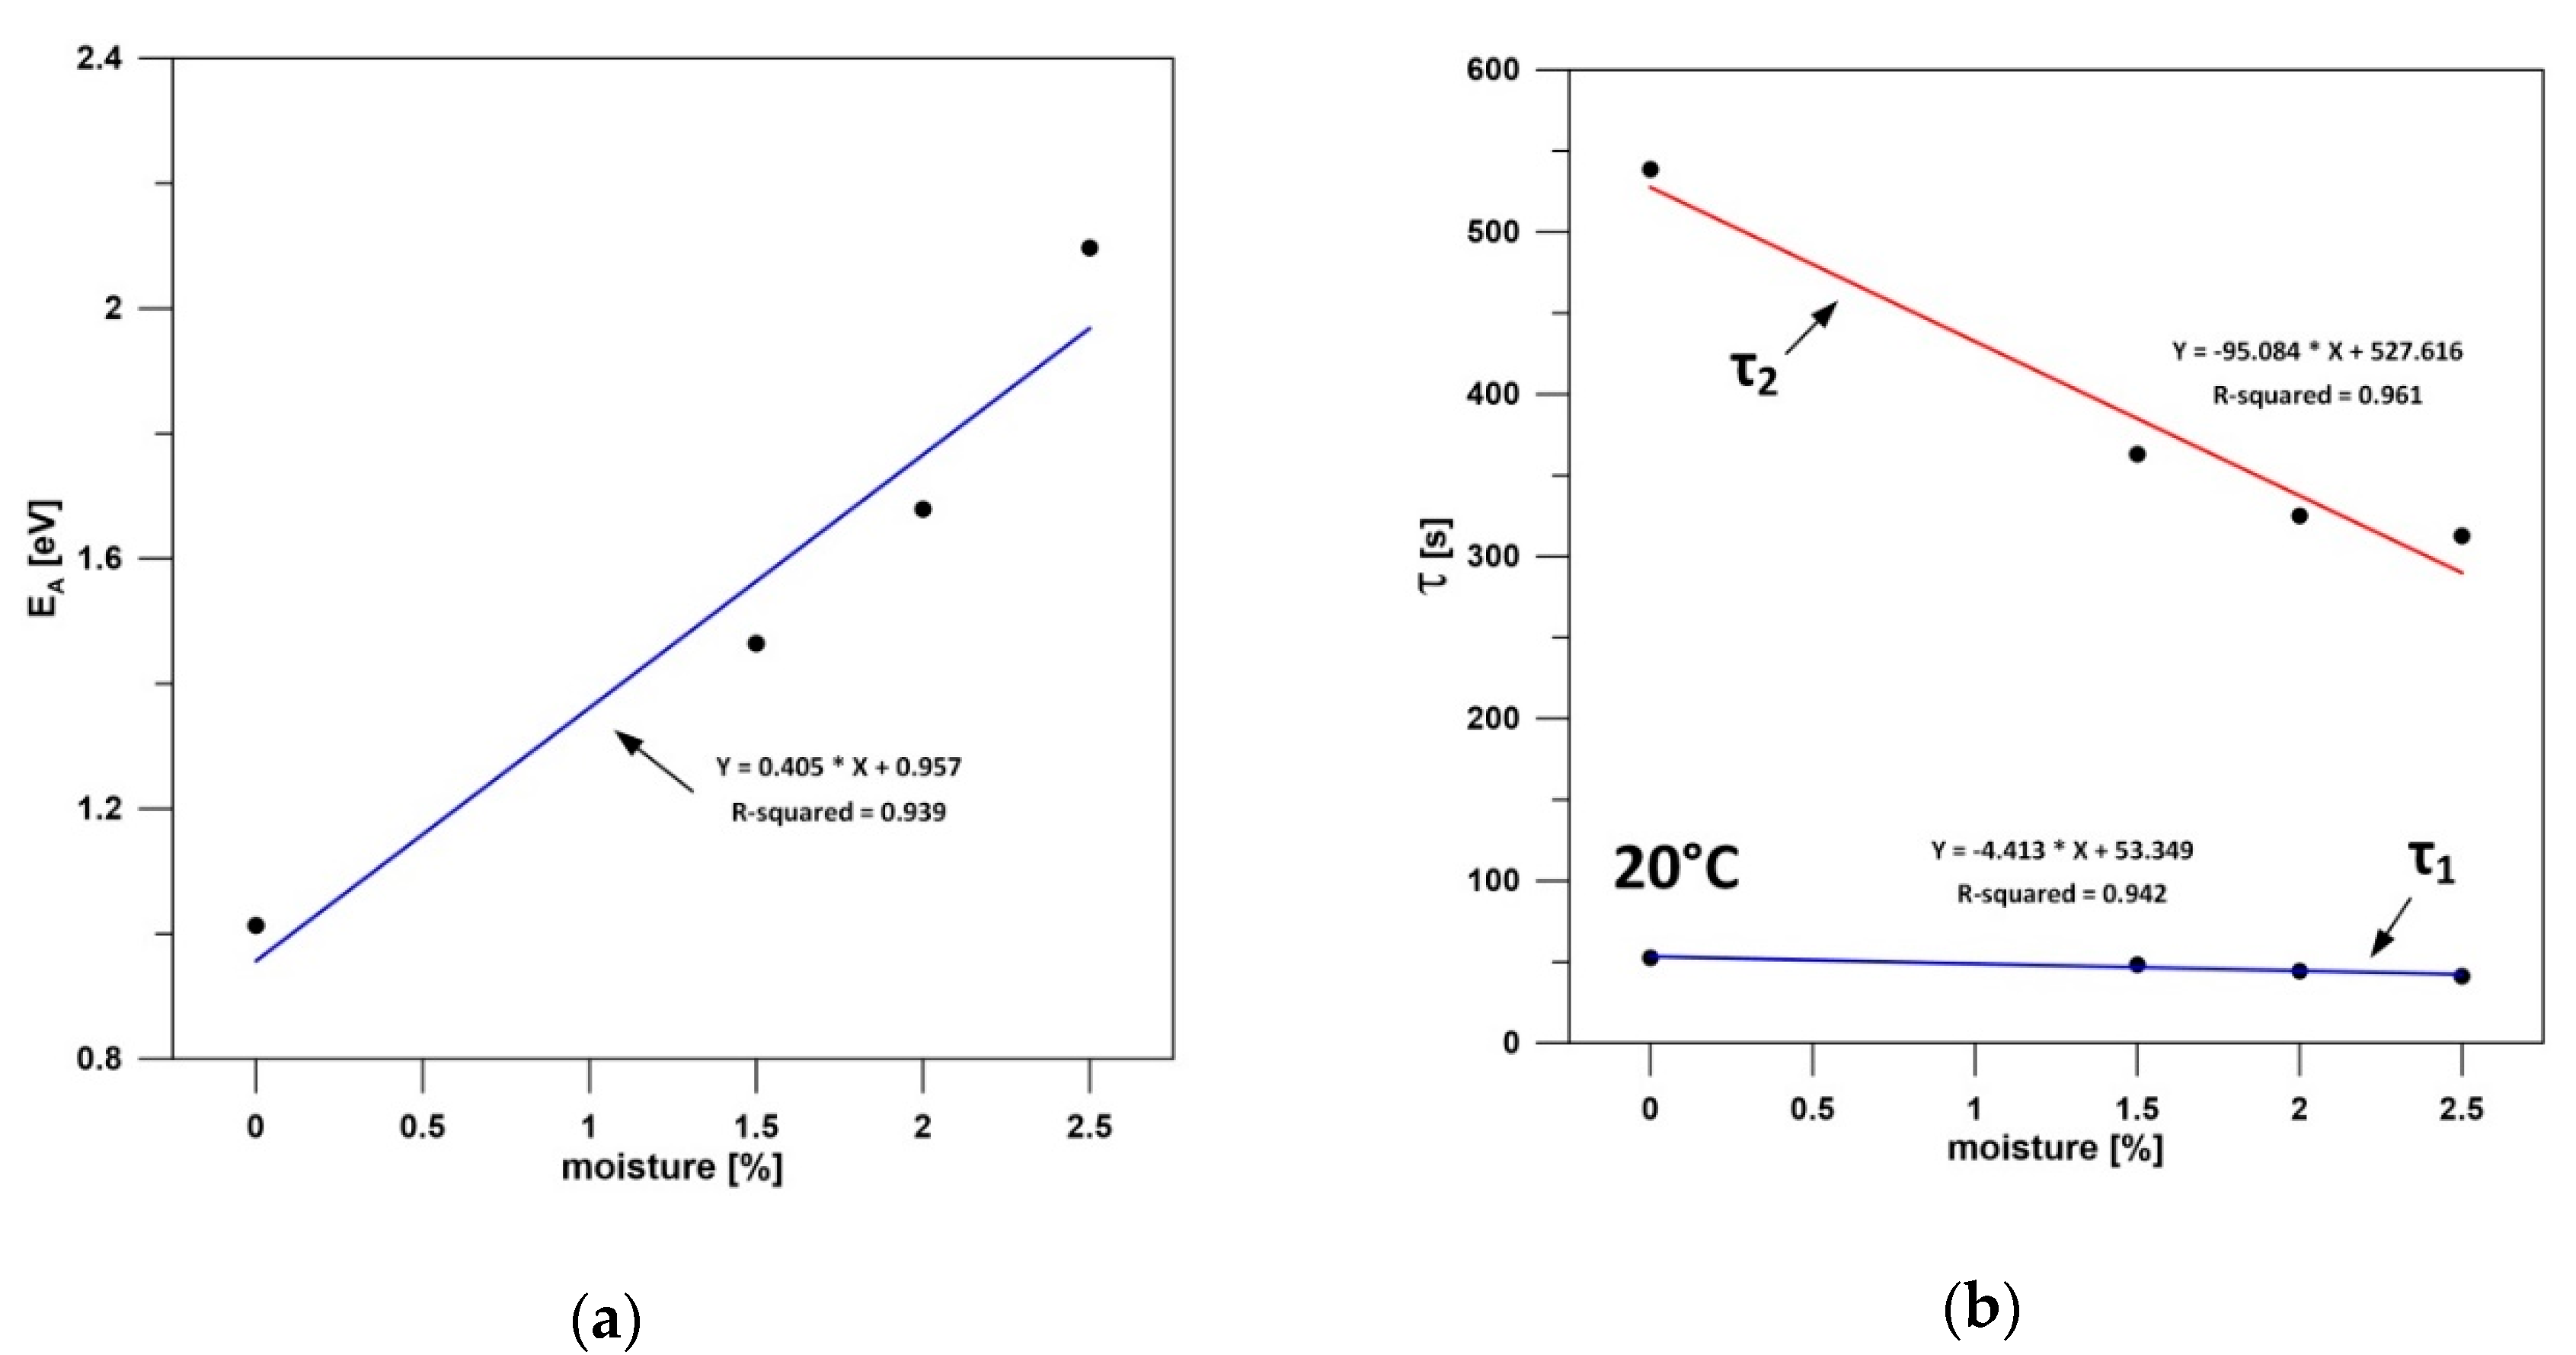
Using sample depolarization current time characteristics, it was decided to analyze the dominant time constants separately for the relaxation processes of aramid and cellulose fibers, depending on the degree of moisture as well as ageing of the cellulose–aramid insulation being examined. To this end, a Debye equation with two relaxation times was used as the sought depolarization current regression function:
I D ( t ) B 1 · e t τ 1 + B 2 · e t τ 2 ,
where B1, B2—function parameters, τ1, τ2—dominant time constants of the relaxation processes, for aramid fibers and cellulose fibers, respectively.

5. Experimental Results

An MIC-15k1 high resistance meter from Sonel® was used for the measurements of the polarization and depolarization currents. Thanks to the embedded battery of accumulators, the meter provided a solid and stable UC charging voltage value, which amounted to 500 V for all the experiments. The registration of the polarization and depolarization currents in time was realized with the dielectric discharge factor measurement function (DD factor—Dielectric Discharge). The meter’s software allowed any adjustment of the polarization and depolarization times, while data communication was over a wireless Bluetooth connection. The meter’s sampling frequency was approximately 2 Hz, which, in the case of measurements of low-frequency currents, was a fully sufficient value.

5.1. Effect of Temperature

Figure 6 presents exemplary time characteristics of the polarization and depolarization currents for a non-aged insulation sample with an average degree of moisture (residual moisture plus 1.5% paper weight increase as a result of water absorption from the environment, before the impregnation process). We can observe on the characteristics how the sample temperature affects the recorded current values, in the range from 20 °C to 60 °C, at steps every 10 °C. The scope of temperature changes of the samples adopted in the experiments is typical of diagnosing the condition of oil insulation in power transformers performed using polarization diagnostic methods (including the PDC method) [13,14,15,18,19,20,21,22]. It is important to remember that polarization diagnostic methods require the transformer to be detached from the network (off-line state) and, consequently, the insulation temperature must be lower than typical, which is assumed at approx. 60 °C for the transformer’s normal operation mode. If the transformer is disconnected for a long time from the network, the insulation temperature may be reduced even further to an ambient temperature, e.g., 20 °C.
The characteristics presented in Figure 6a prove that, along with an increase in insulation sample temperature, the depolarization current also increased across the whole time range. The reason for this phenomenon is the declining resistivity of mineral oil and cellulose itself. The observed change was almost proportional in relation to temperature, which is typical of insulation made of mineral oil-impregnated cellulose only [14,15]. In the case of the depolarization current (Figure 6b), temperature growth generated, just as before, an initial increase in the current, but a much faster decay was observed for times exceeding approx. 20 s. The reason is that the phenomenon related to the destructive effect of temperature on the polarization process of dielectric dipoles, making the following depolarization faster, because temperature facilitates the achievement of the initial state of dipoles disorder. As before, it can be stated that this is typical of mineral oil-impregnated cellulose insulation, which also proves the correctness of the completed measurements. It turned out that a small layer of aramid fibers does not significantly disturb the characteristics of the registered polarization and depolarization currents, with reference to the previously known effect of temperature in the PDC method for insulation made of mineral oil-impregnated cellulose paper only. The above conclusion was confirmed for all the examined samples, i.e., regardless of the degree of their moisture or ageing.
Figure 7a presents Debye regression functions according to Formula (5), which were used in order to fix time constants of two relaxation mechanisms based on the depolarization current of the cellulose–aramid insulation sample being examined. Certainly, the data presented in Figure 7a are only exemplary, while the regression functions being described were used for all the insulation samples, i.e., for each degree of moisture and ageing and for all temperatures. The sample of the insulation being examined was a thin layer of aramid fibers and mineral oil-impregnated cellulose, therefore it was assumed that the time characteristics of the depolarization current would contain at least three dominant time constants of the relaxation processes of the previously mentioned materials, i.e., aramid, cellulose and oil. Because the impregnation of the samples was made using fresh inhibited mineral oil, the time constant of the relaxation process of this poorly polar fluid was very small (below 1 s). Therefore, bearing in mind the primary nature of the tests being conducted (cellulose–aramid material), it was decided to ignore it. Recognizing that water collected in the insulation is stored mostly in cellulose (considerably higher absorbability compared to aramid fibers), a longer time constant τ2 was needed to describe this process only. Then, a shorter time constant τ1 was assigned to the relaxation process of aramid fibers. Figure 7b presents the effect of temperature on the value of the previously described time constants for a selected cellulose–aramid insulation sample, initially thermally aged in 150 °C with the smallest moisture.
Analyzing the characteristics from Figure 7b, two opposing tendencies can be noticed. Temperature growth in the sample being examined resulted in an insignificant increase in time constant τ1 value and a significant decrease in time constant τ2 value. In the first case, the change in time constant τ1 can be explained by the fact that the growing measurement temperature increased at the same time as the relative permeability of aramid fibers, and slightly reduced the material’s volume resistivity [9]. Assuming that the time constant value in the electric equivalent circuit defines the product of the current capacity and resistance of the material, permeability growth probably determined a slight change in time constant τ1 value. In the case of time constant τ2, which was correlated with the relaxation of cellulose fibers and the water collected in the material, temperature growth stimulated the process of water migration to the impregnating fluid, i.e., mineral oil [25]. Therefore, the amount of water in the insulation decreased (highly polar liquid with high permeability), and at the same time volume resistivity also decreased. The result of these phenomena was a considerable decrease in time constant τ2 value. The described observations were confirmed for all the examined insulation samples, regardless of the degree of ageing and moisture.

5.2. Effect of the Degree of Moisture

Figure 8 presents exemplary characteristics of the polarization current measured for cellulose–aramid insulation samples with initial thermal ageing at 150 °C and with various moisture degrees. For comparison purposes, Figure 8 presents the results of tests for two different temperatures. The increased moisture of the samples resulted in a significant growth in the polarization current values at the initial stage of the measurement (until approx. 10 s) and a growth in the current conductivity element, which could be observed for considerably longer times (close to 1000 s). It is a typical phenomenon of the effect of increased moisture for the classic cellulose–oil insulation, widely described in many publications [13,14,15]. Therefore, it can be assumed that practically all the water is stored in the Nomex®910 paper cellulose layer. The measurement temperature growth stimulates the process of water migration from the cellulose layer to mineral oil, thereby reducing the differences in the polarization current characteristics being described (Figure 8b). The term “initial moisture” means the degree of cellulose–aramid insulation sample moisture, which was left in the material after the vacuum drying process, still before the oil impregnation process. As the drying method utilized for cellulose materials in industry, was applied, it may be assumed that the initial moisture of Nomex®910 paper did not exceed 0.5%.
In a similar manner, it is also possible to interpret the depolarization current characteristics, which are presented in Figure 9 for the same selected insulation samples. The increased moisture in the samples also generated an increased value of the depolarization current in the initial part of the analysis (until approx. 10 s); sometime later, a faster decay process of the depolarization current was observed for these samples.
The measurement temperature growth (Figure 9b) also reduced the differences between the depolarization currents of samples with various moisture degrees within approx. 10 s, and this is due to the water migration process from cellulose to oil intensifying with increased temperature. The phenomenon described was observed for all the examined insulation samples, regardless of the degree of ageing (thermal degradation of cellulose fibers). The characteristics presented on Figure 8 and Figure 9 are only general in nature.
Using the sample depolarization current characteristics depending on the measurement temperature, it was decided to analyze, using Equations (1)–(4), the dependence of the activation energy EA on the degree of moisture of the cellulose–aramid insulation. Figure 10 presents the manner of fixing characteristic time tA (Figure 10a) and the activation energy EA value (Figure 10b) with the use of the Arrhenius graph [24] for a selected non-aged sample with the smallest degree of moisture.
The result of calculation of the activation energy EA depending on moisture for a selected non-aged cellulose–aramid insulation sample is presented in Figure 11a. A significant increase in the activation energy value along with the growing degree of insulation moisture should be noted. A similar phenomenon was observed for the classic mineral oil-impregnated cellulose insulation; however, the calculated EA values are slightly higher here [26]. Therefore, it can be assumed that the introduction of additional layers of aramid fibers in Nomex®910 paper raises the activation energy value at which the low-frequency insulation relaxation process is subject to change.
Figure 11b presents the effect of the degree of sample moisture on the value of two dominant time constants of the relaxation processes, determined on the basis of the depolarization current characteristics according to Equation (5). Increased moisture resulted in a slight decrease in time constant τ1, which was correlated with the relaxation process of aramid fibers, and, on the other hand, a considerably more intensive decrease in time constant τ2, which was correlated with the relaxation of cellulose fibers. The presented difference is probably related to a significantly higher water absorbability by cellulose than aramid fibers.

5.3. Effect of the Degree of Ageing

Figure 12 presents exemplary characteristics of the polarization currents (Figure 12a) and the depolarization currents (Figure 12b) measured for unmoistened samples with various ageing degrees. It was decided to analyze the effect of the degree of ageing in the temperature range of initial degradation of cellulose fibers (before the impregnation process) from 130 °C to 190 °C, with steps every 20 °C.
The greatest and the predictable effect of the degree of sample ageing was observed for the depolarization current within approx. 10 s (Figure 12b). Therefore, it can be concluded that a growth in the degree of thermal degradation of cellulose fibers significantly reduces the depolarization current value in this time range. For longer times, mostly due to small values of the registered depolarization currents at the level of 20–40 pA, the characteristics overlap, which makes their correct analysis difficult. In the case of the polarization currents (Figure 12a), within the observation time range up to approx. 10 s of the measurement, only the application of the initial degradation temperature of cellulose fibers equal to 190 °C caused a significant reduction in the current value as compared to the other samples. As thermal degradation of cellulose, namely a decrease in the degree of polymerization of its macromolecules, results mainly in a significant loss of mechanical properties (e.g., breaking strength), while the material’s volume resistivity remains at a similar level, the polarization current characteristics in longer time ranges (approx. 1000 s) will stabilize close to the value equal to the leakage current. Similar conclusions were achieved for the other measurement temperatures, i.e., up to 60 °C inclusive. Unfortunately, the introduction of additional sample moisture in the range from 1.5% to 2.5% rendered the effect of the degree of ageing practically unfeasible to be observed on the polarization and depolarization current characteristics. Water molecules, because of their strongly polar nature, effectively conceal any minor effect of the degree of ageing, with any possible changes in the characteristics being within the boundaries of the meter’s measuring error. This phenomenon was already observed in earlier publications from a co-author of this article [7,19].
Figure 13 presents the effect of the degree of sample ageing on the activation energy EA value (Figure 13a) and values of two dominant time constants of the relaxation processes (Figure 13b), which were determined on the basis of the depolarization current characteristics according to Equation (5).
The most important change that was observed on the characteristics from Figure 13 is that the growing degree of thermal degradation of cellulose fibers resulted in a minor, but constant, decrease in the activation energy value, after which the low-frequency relaxation process of the insulation being examined was subject to change. A probable reason is that the activation of cellulose macromolecules with a smaller degree of polymerization as a result of ageing is less energy-intensive in the polarization process. In the case of the dominant time constants from Figure 13b, it was observed that the growing degree of sample ageing does not cause any significant changes. The explanation of this fact for time constant τ1, which is correlated with the relaxation processes of aramid fibers, is quite obvious. The initial sample ageing temperature is simply too low to cause any significant changes in the structure of this material’s fibers [9]. In the case of time constant τ2, correlated mainly with the cellulose fiber relaxation process, the change is also negligible due to the similar process of decay of the depolarization current (Figure 12b) and the earlier described measuring difficulties.

6. Conclusions

The results of the tests presented in the article confirm that Nomex®910 cellulose–aramid electro-technical paper produced by DuPont™ is a material that can successfully be used and safely operated in the electro-insulation systems of power utilities for a long time. The basic goal of the company’s engineers, i.e., strengthened cellulose material structure by two-sided covering of the paper surface with a thin layer of aramid, has certainly been accomplished. This article authors’ opinion is particularly strong because of the fact that, after heating Nomex®910 paper in the temperature of 190 °C for 25 h with air access, the material changed to a darker color, however the structure of the surfaces did not change to a significant extent as compared to the samples heated at lower temperatures. The same process applied to classic Kraft type cellulose paper resulted in the material cracking when being handled after it was taken out of the furnace. Certainly, this statement applies to roll papers, with a thickness comparable to the cellulose–aramid paper used for the tests (0.08 mm).
At present however, there is still the problem of practical adaptation of the diagnostic methods applied so far for the classic cellulose–oil insulation, used, for example, in power transformers, as compared to hybrid semi-synthetic insulation, which Nomex®910 cellulose–aramid paper from DuPont™ is. It seems obvious that that the future of electro-insulation systems of power transformers will be synthetic materials. In the case of liquid materials, in many new and already operating transformer units, oil of mineral origin is being replaced by biodegradable esters. Likewise, aramid material is being introduced to solid electric insulation systems at the stage of transformer design and production. Unfortunately, because the new materials are more expensive than the classic materials (cellulose and mineral oil), the number of transformers with semi-synthetic insulation operating at present is still small, limiting expert knowledge connected with the maintenance of these units.
The test results presented in the article have proved that the PDC diagnostic method (polarization and depolarization method) can be successfully used to estimate the degree of moisture of cellulose–aramid insulation impregnated with insulating mineral oil. The profiles of polarization and depolarization currents depending on moisture of the samples are predictable and similar to the characteristics measured for the classic cellulose–oil insulation. The introduction of a thin layer of aramid in Nomex®910 paper does not induce any significant changes in the characteristics of the hydrodynamic balanced paper–oil, which is certainly, from the point of view of adaptation of the PDC method, a very promising feature. In the analysis of the depolarization current using the regression method with Debye double function, described by Formula (5), in the case of a longer time constant of τ2 relaxation processes, its practically linear dependence on the degree of sample moisture was observed (
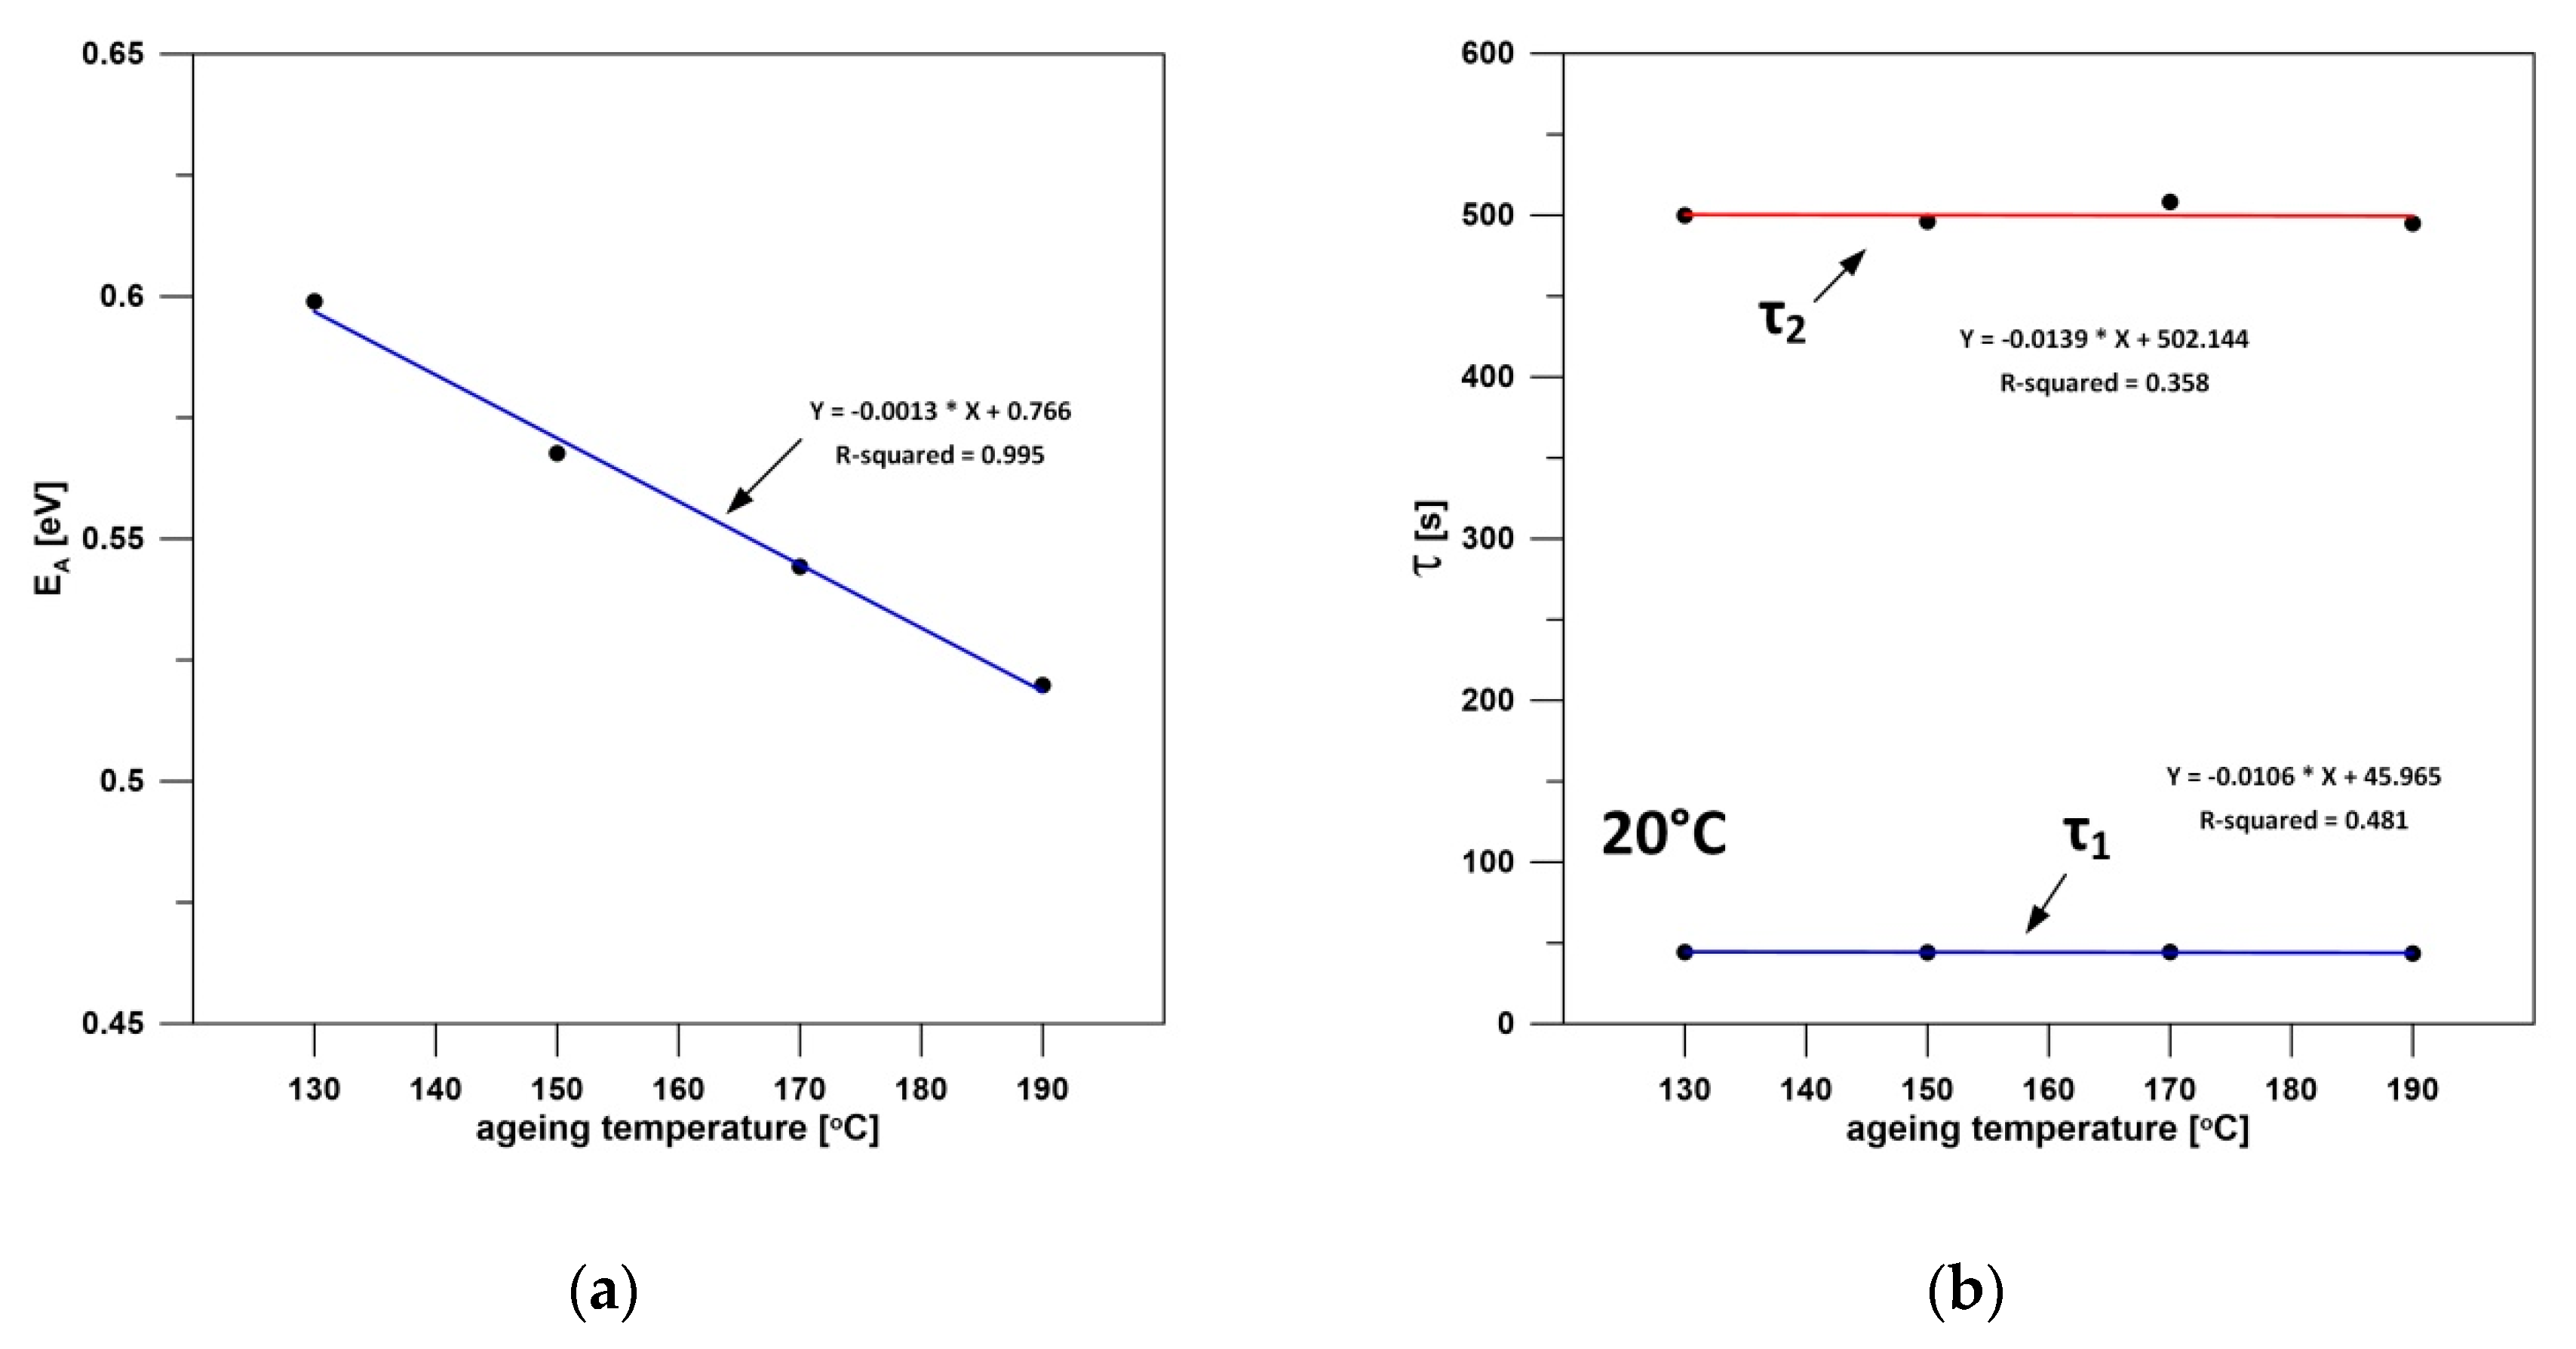
Figure 11b). This gives hope for the use of this information in future practical diagnostics of the degree of moisture in transformer insulation, although the article authors are aware that in the case of such complex systems, the linear dependence can change. The characteristics of the activation energy EA depending on moisture (Figure 11a) and depending on the degree of ageing (Figure 13a) are only cognitive in nature. In practical diagnostics, measurements of polarization and depolarization currents for several temperatures of the transformer’s insulation are usually impossible. The process of cooling down the transformer’s insulation system in offline mode is very time-consuming, which would require multiple diagnoses using the PDC method to be performed over several days, while, for the needs of diagnostics, transformers are switched off for as short a time as possible, subject to the company’s economic calculations. At present, like for the classic cellulose–oil insulation, the estimation of the degree of ageing for samples made of Nomex®910 paper impregnated with insulating mineral oil is a great challenge for the PDC method. The cellulose ageing processes are always accompanied by increased moisture, because water is one of the products of decay of its macromolecules. Water is a strongly polar liquid, and therefore has a “masking” effect for significantly smaller changes in the characteristics of, for example, the depolarization currents that are caused by ageing changes. In this respect, there is a need to continue further research.

Author Contributions

Conceptualization, S.W.; methodology, S.W.; formal analysis, S.W. and A.K.; investigation, S.W. and A.K.; writing—original draft preparation, S.W.; visualization, A.K.; supervision, S.W. All authors have read and agreed to the published version of the manuscript.

Funding

This research received no external funding.

Acknowledgments

The NOMEX®910 for testing was provided by DuPont™ Poland Sp. z o.o., ul. Postepu 17b, 02-676 Warszawa, Poland.

Conflicts of Interest

The authors declare no conflict of interest.

References

  1. Liao, R.; Hao, J.; Chen, G.; Ma, Z.; Yang, L. A Comparative Study of physicochemical, dielectric and thermal properties of pressboard insulation impregnated with natural ester and mineral oil. IEEE Trans. Dielectr. Electr. Insul. 2011, 18, 1626–1637. [Google Scholar] [CrossRef] [Green Version]
  2. Fofana, I.; Borsi, H.; Gockenbach, E.; Farzaneh, M. Aging of transformer insulating materials under selective conditions. Electr. Energy Syst. 2007, 17, 450–470. [Google Scholar] [CrossRef]
  3. Aslam, M.; Basit, A.; ul Haq, I.; Saher, S.; Khan, A.D.; Khattak, A.N. Improved Insulation Durability to Improve Transformer Aging. Int. J. Emerg. Electr. Power Syst. 2020, 21, 20190173. [Google Scholar] [CrossRef]
  4. Munajad, A.; Subroto and Suwarno, C. Study on the Effects of Thermal Aging on Insulating Paper for High Voltage Transformer Composite with Natural Ester from Palm Oil Using Fourier Transform Infrared Spectroscopy (FTIR) and Energy Dispersive X-ray Spectroscopy (EDS). Energies 2017, 10, 1857. [Google Scholar] [CrossRef] [Green Version]
  5. Przybylek, P.; Moranda, H.; Moscicka-Grzesiak, H.; Cybulski, M. Laboratory Model Studies on the Drying Efficiency of Transformer Cellulose Insulation Using Synthetic Ester. Energies 2020, 13, 3467. [Google Scholar] [CrossRef]
  6. Dombek, G.; Nadolny, Z.; Przybylek, P.; Lopatkiewicz, R.; Marcinkowska, A.; Druzynski, L.; Boczar, T.; Tomczewski, A. Effect of Moisture on the Thermal Conductivity of Cellulose and Aramid Paper Impregnated with Various Dielectric Liquids. Energies 2020, 13, 4433. [Google Scholar] [CrossRef]
  7. Wolny, S.; Lepich, M. Influence of ageing and moisture degree of aramid-oil insulation on depolarization current. In Proceedings of the IEEE International Conference on Dielectrics, Montpellier, France, 3–7 July 2016; pp. 1163–1166. [Google Scholar]
  8. Wolny, S. Analysis of High-frequency Dispersion Characteristics of Capacitance and Loss Factor of Aramid Paper Impregnated with Various Dielectric Liquids. Energies 2019, 12, 1063. [Google Scholar] [CrossRef] [Green Version]
  9. DuPont™ Nomex® 400 Series. Technical Data Sheet. Available online: https://www.dupont.com/products/nomex-400-series.html (accessed on 3 November 2020).
  10. Zdanowski, M. Streaming Electrification of Mineral Insulating Oil and Synthetic Ester MIDEL 7131. IEEE Trans. Dielectr. Electr. Insul. 2014, 21, 1127–1132. [Google Scholar] [CrossRef]
  11. Zdanowski, M. Streaming Electrification Phenomenon of Electrical Insulating Oils for Power Transformers. Energies 2020, 13, 3225. [Google Scholar] [CrossRef]
  12. DuPont™ Nomex® 900 Series. Technical Data Sheet. Available online: https://www.dupont.com/products/nomex-900-series.html (accessed on 3 November 2020).
  13. Hao, J.; Liao, R.; Chen, G.; Ma, Z.; Yang, L. Quantitative analysis ageing status of natural ester-paper insulation and mineral oil-paper insulation by polarization/depolarization current. IEEE Trans. Dielectr. Electr. Insul. 2012, 19, 188–199. [Google Scholar]
  14. Wolny, S.; Kedzia, J. The assessment of the influence of temperature of selected parameters of the approximation method of depolarization current analysis of paper–oil insulation. J. Non-Cryst. Solids 2010, 356, 809–814. [Google Scholar] [CrossRef]
  15. Saha, T.K.; Purkait, P. Investigation of Polarization and Depolarization Current Measurements for the Assessment of Oil-paper Insulation of Aged Transformers. IEEE Trans. Dielectr. Electr. Insul. 2004, 11, 144–154. [Google Scholar] [CrossRef] [Green Version]
  16. DuPont™ Nomex®T910. Technical Data Sheet. Available online: http://protectiontechnologies.dupont.com/Nomex-910-transformer-insulation (accessed on 3 November 2020).
  17. Nynas Nytro 10X. Technical Data Sheet. Available online: https://www.reinhardoil.dk/Nytro-10-X.pdf (accessed on 3 November 2020).
  18. Wolny, S.; Adamowicz, A.; Lepich, M. Influence of Temperature and Moisture Level in Paper-Oil Insulation on the Parameters of the Cole-Cole Model. IEEE Trans. Power Deliv. 2014, 29, 246–250. [Google Scholar] [CrossRef]
  19. Wolny, S. Aging degree evaluation for paper-oil insulation, carried out using the recovery voltage method. IEEE Trans. Dielectr. Electr. Insul. 2015, 22, 2455–2462. [Google Scholar] [CrossRef]
  20. Gorgan, B.; Notingher, P.V.; Wetzer, J.M.; Verhaart, H.F.A.; Wouters, P.A.A.F.; van Schijndel, A.; Tanasescu, G. Calculation of the remaining lifetime of power transformers paper insulation. In Proceedings of the 2012 13th International Conference on Optimization of Electrical and Electronic Equipment (OPTIM), Brasov, Romania, 22–24 May 2012; pp. 293–300. [Google Scholar]
  21. Jadav, R.B.; Ekanayake, C.; Saha, T.K. Understanding the Impact of Moisture and Ageing of Transformer Insulation on Frequency Domain Spectroscopy. IEEE Trans. Dielectr. Electr. Insul. 2014, 21, 369–379. [Google Scholar] [CrossRef]
  22. Zukowski, P.; Rogalski, P.; Koltunowicz, T.N.; Kierczynski, K.; Subocz, J.; Zenker, M. Cellulose Ester Insulation of Power Transformers: Researching the Influence of Moisture on the Phase Shift Angle and Admittance. Energies 2020, 13, 5511. [Google Scholar] [CrossRef]
  23. Jonscher, A. The Universal Dielectric Response and Its Physical Significance. IEEE Trans. Electr. Insul. 1992, 27, 407–423. [Google Scholar] [CrossRef]
  24. Zukowski, P.; Koltunowicz, T.N.; Kierczyński, K.; Rogalski, P.; Subocz, J.; Szrot, M.; Gutten, M.; Sebok, M.; Jurcik, J. Permittivity of a composite of cellulose, mineral oil, and water nanoparticles: Theoretical assumptions. Cellulose 2016, 23, 175–183. [Google Scholar] [CrossRef] [Green Version]
  25. Oommen, T.V. Moisture equilibrium in paper-oil insulation systems. In Proceedings of the 1983 EIC 6th Electrical/Electronical Insulation Conference, Chicago, IL, USA, 3–6 October 1983; pp. 162–166. [Google Scholar]
  26. Zenker, M.; Mrozik, A. Dielectric response of aramid paper impregnated with synthetic ester. Electr. Rev. 2018, 10, 164–167. (In Polish) [Google Scholar]
Figure 1. NOMEX®910 material structure: (a) cross-section; (b) photograph of a small sample.
Energies 13 06075 g001
Figure 2. Sample preparation diagram.
Energies 13 06075 g002
Figure 3. View of the measuring electrode system and the insulation sample studied: 1—a roll made of brass (LV—low potential electrode), 2—aramid–oil insulation sample, 3—metal foil (HV—high potential electrode), 4—heater, 5—temperature sensor, 6—insulator, 7—hermetic vessel plus thermal insulation.
Energies 13 06075 g003
Figure 4. Photograph of the insulation sample prepared for testing: (a) zoom on sample; (b) after placing the sample in the measuring system.
Energies 13 06075 g004
Figure 5. Diagnostics of the state of paper–oil insulation samples using the polarization and depolarization current analysis (PDC) method: (a) connections diagram; (b) time characteristics of currents and voltages. 1—measuring-switching system, 2—object being examined, 3—computer.
Energies 13 06075 g005
Figure 6. Effect of temperature on the characteristics of the PDC method for a selected cellulose–aramid insulation sample (non-aged with 1.5% moisture) mineral oil-impregnated: (a) polarization current; (b) depolarization current.
Energies 13 06075 g006
Figure 7. Analysis of time characteristics of the depolarization current by means of Debye regression function for a selected cellulose–aramid insulation sample (aged at 150 °C with the smallest moisture), mineral oil-impregnated: (a) depolarization current in the measurement temperature 30 °C; (b) temperature dependence of the dominant time constants for two relaxation processes.
Energies 13 06075 g007
Figure 8. Characteristics of the polarization current of cellulose–aramid insulation sample with initial thermal ageing at 150 °C and with various moisture: (a) polarization currents in the measurement temperature 20 °C; (b) polarization currents in the measurement temperature 40 °C.
Energies 13 06075 g008
Figure 9. Characteristics of the depolarization current of cellulose–aramid insulation samples with initial thermal ageing at 150 °C and with various moisture: (a) depolarization currents in the measurement temperature 20 °C; (b) depolarization currents in the measurement temperature 40 °C.
Energies 13 06075 g009
Figure 10. Method of fixing the activation energy EA for a selected non-aged cellulose–aramid insulation sample with the smallest degree of moisture: (a) way of fixing tA characteristic time from the polarization current; (b) Arrhenius graph.
Energies 13 06075 g010
Figure 11. Dependence of the activation energy EA (a) and dominant time constants τ1 and τ2 (b) on the degree of moisture for a selected non-aged cellulose–aramid insulation sample.
Energies 13 06075 g011
Figure 12. Characteristics of the polarization currents (a) and the depolarization currents (b) measured for unmoistened cellulose–aramid insulation samples for different degrees of initial ageing in the measurement temperature 20 °C.
Energies 13 06075 g012
Figure 13. Dependence of the EA activation energy (a) and dominant time constants τ1 and τ2 (b) on the degree of ageing for unmoistened cellulose–aramid insulation samples.
Energies 13 06075 g013
Table 1. Typical mechanical and electrical properties of NOMEX®910 paper (thickness 0.08 mm). Data from official DuPont™ online data sheet available online [16].
PropertyUnitsValueTest Method
Basis weightg/m280ASTM D646
Burst strengthN/cm227ASTM D828
Tensile strength, MD 1N/cm70ASTM D828
Tensile strength, XD 2N/cm17ASTM D828
Elongation, MD%2.2ASTM D828
Elongation, XD%6.9ASTM D828
Tear strength, MDN0.45TAPPI 414
Tear strength, XDN0.7TAPPI 414
AC rapid rise breakdown in mineral oilkV/mm87ASTM D149
Dielectric constant
60 Hz, 23 °C, mineral oil
-3.2ASTM D150
Dissipation factor
60 Hz, 23 °C, mineral oil
%0.9ASTM D150
1 Machine direction, 2 Cross machine direction.
Table 2. Typical physical, chemical, and electrical properties of Nynas Nytro 10× mineral oil. Data are from the official Nynas data sheet, available online [17].
PropertyUnitsValueTest Method
Density, 20 °Ckg/dm30.876ISO 12185
Viscosity, 40 °Cmm2/s7.6ISO 3104
Viscosity, −30 °Cmm2/s730ISO 3104
Flash point°C144ISO 2719
Pour point°C−60ISO 3016
Neutralization valuemg KOH/g<0.01IEC 296
Water contentmg/kg<20IEC 814
Interfacial tensionmN/m45ISO 6295
Dissipation factor, 90 °C-<0.001IEC 247
Breakdown voltage
-before treatment kV40–60IEC 156
-after treatmentkV>70IEC 296
Publisher’s Note: MDPI stays neutral with regard to jurisdictional claims in published maps and institutional affiliations.

