1. Introduction
The main aim of the research presented in this article was to determine and analyze the spectrum of optical radiation emitted by an electric arc in air for DC and different AC voltage frequencies. The shape of the spectrum and range of the radiation correspond with the applied voltage. Electric arc is an undesirable phenomenon in many areas. Uncontrolled electrical discharges from Corona Discharges (CD) to Partial Discharges (PD), breakdowns to the arc, or rapid changes in conditions allow the insulation medium to ionize and create a plasma channel for the arc. This is particularly dangerous for electrical equipment or the aviation industry. The aerospace industry is developing toward optimizing fuel consumption for this purpose by reducing the weight of aircraft. The transition from pneumatic or hydraulic systems to electrical systems is associated with a number of electrical failure problems. The next generation of aircraft that are to be fully electric (more electric aircrafts, MEA) will probably have to deal with the problems of choosing insulating materials for cables or protecting equipment, modules, and electric conductors against damage associated with electrical discharges and the detection of related damage and electrical phenomena. In aeronautics, as in other industries, the early detection of electrical discharges improves safety. In the paper [
1], the authors presented a method of CD detection with a cheap CMOS (Complementary Metal-Oxide-Semiconductor) camera recording the spectrum of electromagnetic radiation in the UV (Ultraviolet) and VIS (Visual light) ranges. For measurements of this range of radiation, devices such as spectrophotometers with a larger range of radiation recording can also be used: not only the wider UV range, but also the near infrared (NIR) light frequencies [
2]. This is a well-known method for the detection and measurement of partial discharges in power devices [
3]. The methods of apparent charge measurement, acoustic emission method [
4], X-ray recording in Gas Insulated Switchgear (GIS) [
5], or measurement of UHF signals [
6] are also used. However, in aircraft conditions at reduced pressure, the methods based on electromagnetic radiation detection—UHF or Optical methods—have the best efficiency. The atmospheric conditions are important in such measurements, as well as the arrangement of elements at the test site, which may constitute obstacles to the signals [
7]. The electric arc, which is a consequence of CD–PD breakdown, causes not only damages in electrical equipment, but also damages to the insulation, which increases the probability of occurrence of more such events and, consequently, failures. Along with the increase of voltages, which is required with the increased consumption of electric energy, the electric stresses in the insulations of wires also increase. The risk of electric arcs also increases. A comprehensive review of the knowledge and needs concerning arc tracking is presented in the article [
8]. In the paper [
9], the authors analyzed the electric arc spectrum for alternating current (AC). In the earlier mentioned article [
1], the research on CD spectra were related to direct current (DC). This article presents research on electric arc spectra coming from both DC and AC for selected frequencies of current generating an arc in the air under normal pressure.
There are also areas in industry where the arc is used in many processes. Generated in appropriate conditions and controlled by the selection of many parameters, the electric arc is a phenomenon without which many industries could not work. One of them is welding. The electric arc connects the workpiece with a suitable admixture and produces a weld. Transformer (classic) welding machines usually supply the electrodes (so-called lagging) with alternate voltage–network voltage. They operate at a low frequency, which is unfavorable, because the arc near the sinusoidal transition is extinguished by 0V, and as a result, an uneven weld is obtained on the welded material, and the material is easily melted [
10]. Recent methods of current inversion technology and the use of microprocessor controller technologies have resulted in new alternatives for old-fashioned methods: manual metal arc (Manual Metal Arc, MMA) welding and TIG (Tungsten Inert Gas) welding techniques [
11]. The TIG method is associated with a non-fusible wolfram electrode and a negative voltage power supply. In MMA-type inverter welders, there is a lagging electrode usually supplied with positive voltage. The use of constant voltage improves the quality of the weld and enables a more accurate control of the arc, using electronic circuits that precisely regulate the voltage, current, and circuit induction of the electrode. In TIG welding, it is recommended to limit the energy released during the arc fracture, as the increased arc discharge energy is accompanied by the erosion of the non-flammable electrode [
12]. In all types of welders, a significant part of energy is radiated to the environment in the form of electromagnetic radiation as a result of uncontrolled stimulation of the arc shielding gas atoms. It is important for these processes to limit this radiation by controlling the arc supply. This will limit the impact of this radiation on the health of workers and reduce losses in a broad sense from the economic point of view [
13]. The second of the hypotheses put forward in these studies is the assumption that it is possible to increase the efficiency of welding equipment by modifying the parameters of the current supplying the electric arc. The supply of a high-frequency voltage to the arc allows for more precise control of the arc formation process and the reduction of excitations of the shielding gas atoms, thus reducing the parasitic emission of electromagnetic waves. Moreover, the differentiation of electric arcs based on spectra can be applied in arc furnaces. Diagnosis of the insulation of such devices is based on PD detection. The optical method is one of the diagnostic methods. Efficient differentiation of whether the signal comes from a generated arc or from a damaged insulation is important to ensure operational safety. This problem was partially addressed in [
14].
Recording of the spectrum of electromagnetic radiation generated by electric arcs has so far focused on DC arcs and was performed by means of UV cameras, visible light cameras, and spectrophotometers. Arcs with currents from 50 to 200 A were studied [
15] as well as arcs with current peak levels from 10 to 100 kA with short peak duration: about 15 µs [
16]. The first of them presents the results recorded for the whole process related to the arc formation and its development until its expiry. In the article by Martins et al. [
16], the camera was synchronized with the arc generator trigger. The development of this research is presented in the article [
17]. The authors investigated arcs generated by the current with peak values from 100 to 250 kA. In the study, a high-speed camera from the visible light range was used. The use of the spectrophotometer extends the spectrum of electromagnetic radiation by UV and NIR. The article [
18] presents the use of a system with a spectrophotometer to record the spectrum of an electric arc generated on a Yacob ladder powered by direct current. The color of the DC arc changes from blue to violet and then yellow, creating a flame as the current increases, which is all in the visible light range [
19]. Spectra from outside the visible light range are presented in the literature as residual, mainly for direct current supply. There is no work that would analyze the spectra for AC and DC in such a wide range. Arc power supply for different frequencies gives surprising results and is presented in our previous article [
9]. The main aim of the research presented in this article was to determine and analyze the spectrum of optical radiation emitted by an electric arc in air for DC and different AC voltage frequencies. The shape of the spectrum and range of the radiation correspond with the applied voltage.
The article is an extension of comparative tests of DC and AC electric arcs. The aim of the authors was to present generalized experimental studies on the DC electric arc, in relation to the AC electric arc, with a wide spectrum of supply voltage frequencies. The research was of laboratory and cognitive character, and the parameters of electric arc supply were not optimized for any of the applications proposed in the article.
2. Materials and Methods
In this study, two systems were used to generate an electric arc. Block diagrams of the systems are shown in
Figure 1 and
Figure 2. The first system (
Figure 1) generated a high-frequency electric arc of a given frequency. The second system (
Figure 2) was prepared to generate an arc with a DC-powered spark gap.
The circuit from
Figure 1 consisted of a functional generator (Tektronix AFG1022), whose signal output was connected to the input of a power amplifier using an integrated amplifier on the Texas Instruments OPA541 circuit. The output of the power amplifier supplied the primary winding of the high-voltage transformer adapted to work with high frequency by using a ferrite core. The transformer’s gear ratio was 1:500. The transformer’s secondary winding fed directly to the spark plug terminals located inside the shielded chamber, which also accommodates the spectrometer probe to record the electromagnetic radiation emitted by the electric arc. The optical input surface of the spectrometer was positioned parallel to the generated electric arc at a distance of 1 cm. The optical radiation emitted by the electric arc was recorded with an optical spectrophotometer type HR4000 from Ocean Optics, which allowed registration in the range from 200 to 1100 nm. The transmission of the optical signal from the emission source to the spectrophotometer took place using a polymer optical fiber (POF) with the same spectral range as the spectrophotometer. The optical system was calibrated by the instrument manufacturer and included compensation for the spectral transmission characteristics of the POF optical fiber. The spectrometer data output was connected to a PC.
The system in
Figure 2 was created by modifying the first system in which the output of the secondary winding of the high-voltage transformer was connected to a single-half rectifier with a ripple filter. The first end of the high-voltage transformer secondary winding was connected to the anode of a high-voltage rectifier diode (BY16 Diotec Semiconductor), whose cathode was connected to the first electrode of a 1nF high-voltage ceramic capacitor and the first spark plug. The second end of the secondary winding of the high-voltage transformer was connected to the second electrode of the 1nF high-voltage ceramic capacitor and the second spark plug.
The sinusoidal voltage signal from the function generator was fed to the power amplifier, in which it was amplified with current and from the amplifier output fed the primary winding of the high-voltage transformer. The stimulated high-voltage transformer induced in its secondary winding a sinusoidal voltage of adjustable frequency and 4 kV amplitude. In the first circuit, the alternating high voltage directly supplied the spark gap. In the second circuit, the high alternating voltage was regulated to DC and filtered from the ripple and then fed to the spark plug inputs. An electric arc was formed in the spark gap, the light spectrum of which was recorded by a probe and optical spectrometer system. Data from the spectrometer were sent to a PC, where they were archived and further analyzed in the Matlab calculation program.
The measurements were taken in a laboratory with constant ambient conditions, using the systems described above. Arc initialization took place by shortening the electrodes to each other and then extending them over a distance of several millimeters. The measurements were made at an ambient temperature of 22 °C, humidity of 45%, and air pressure of 1000 hPa. The constant voltage of the spark supply from the second system was 4 kV, and the same voltage amplitude was also set for alternating voltages in the first system. During the measurements, none of the electrodes of the spark plug was earthed: the spark plug worked on floating reference potential.
For the purpose of interpretation and analysis of recorded optical signals, the following division of the spectral range was assumed: ultraviolet radiation (UV, from 200 to 380 nm), visible light (VIS, from 380 to 780 nm) and near-infrared (NIR, from 780 to 1100 nm). Each measurement cycle was preceded by a background light calibration procedure.
3. Results and Discussion
Figure 3 shows the registered spectra of optical radiation in the UV-VIS-NIR range for an electric arc generated at 4 kV AC at different frequencies. The obtained optical spectra of electric arcs for different frequencies of current presented in
Figure 3 are mostly similar. The same arc release voltage, 4 kV, was used in the test. The characteristic peaks for each frequency are mainly in the ultraviolet range. However, some differences appear for very different frequency values of the arc generating current. For low frequencies, the spectrum range can be seen in the near-infrared part and partially in the visible light range (
Figure 3a). For increasingly higher frequencies (
Figure 3b,c), the visible light and NIR components disappear. For frequencies of 100 and 130 kHz (
Figure 3d,e), this range is already marginally recorded. It can also be noted that the component in the VIS range for 380–440 nm from a clear peak at low frequencies clearly becomes a Pareto and may not be an important descriptor for this frequency range. Characteristic wavelengths for the presented graphs are collected and presented in
Table 1.
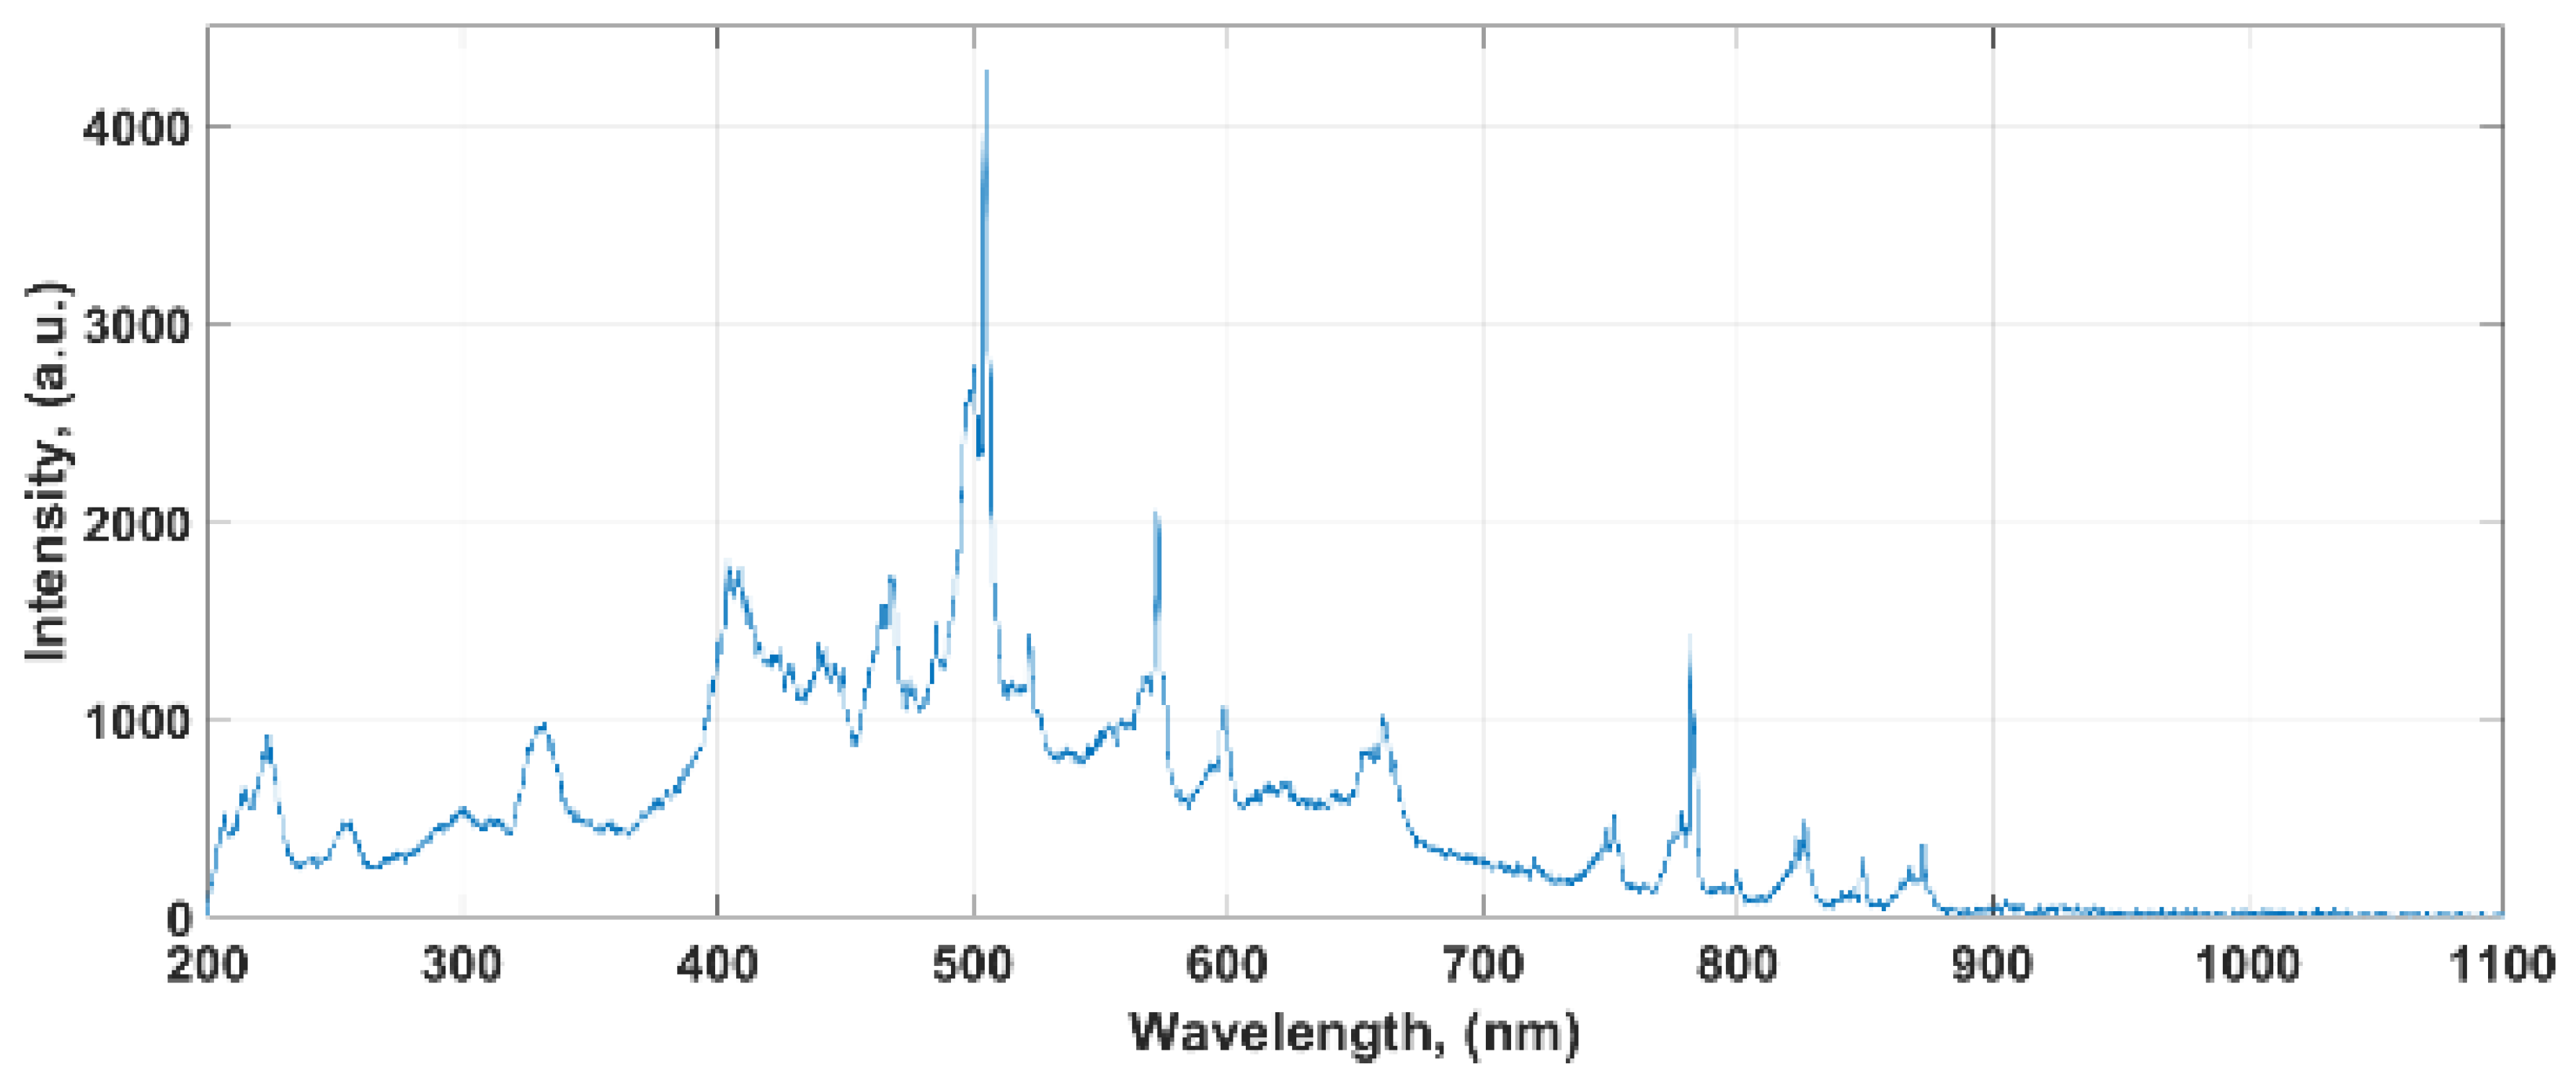
Figure 4 shows the radiation spectrum in the UV-VIS-NIR range for the electric arc generated by DC. The whole range of spectral lines with characteristic wavelengths of higher intensity than the continuous spectrum can be observed.
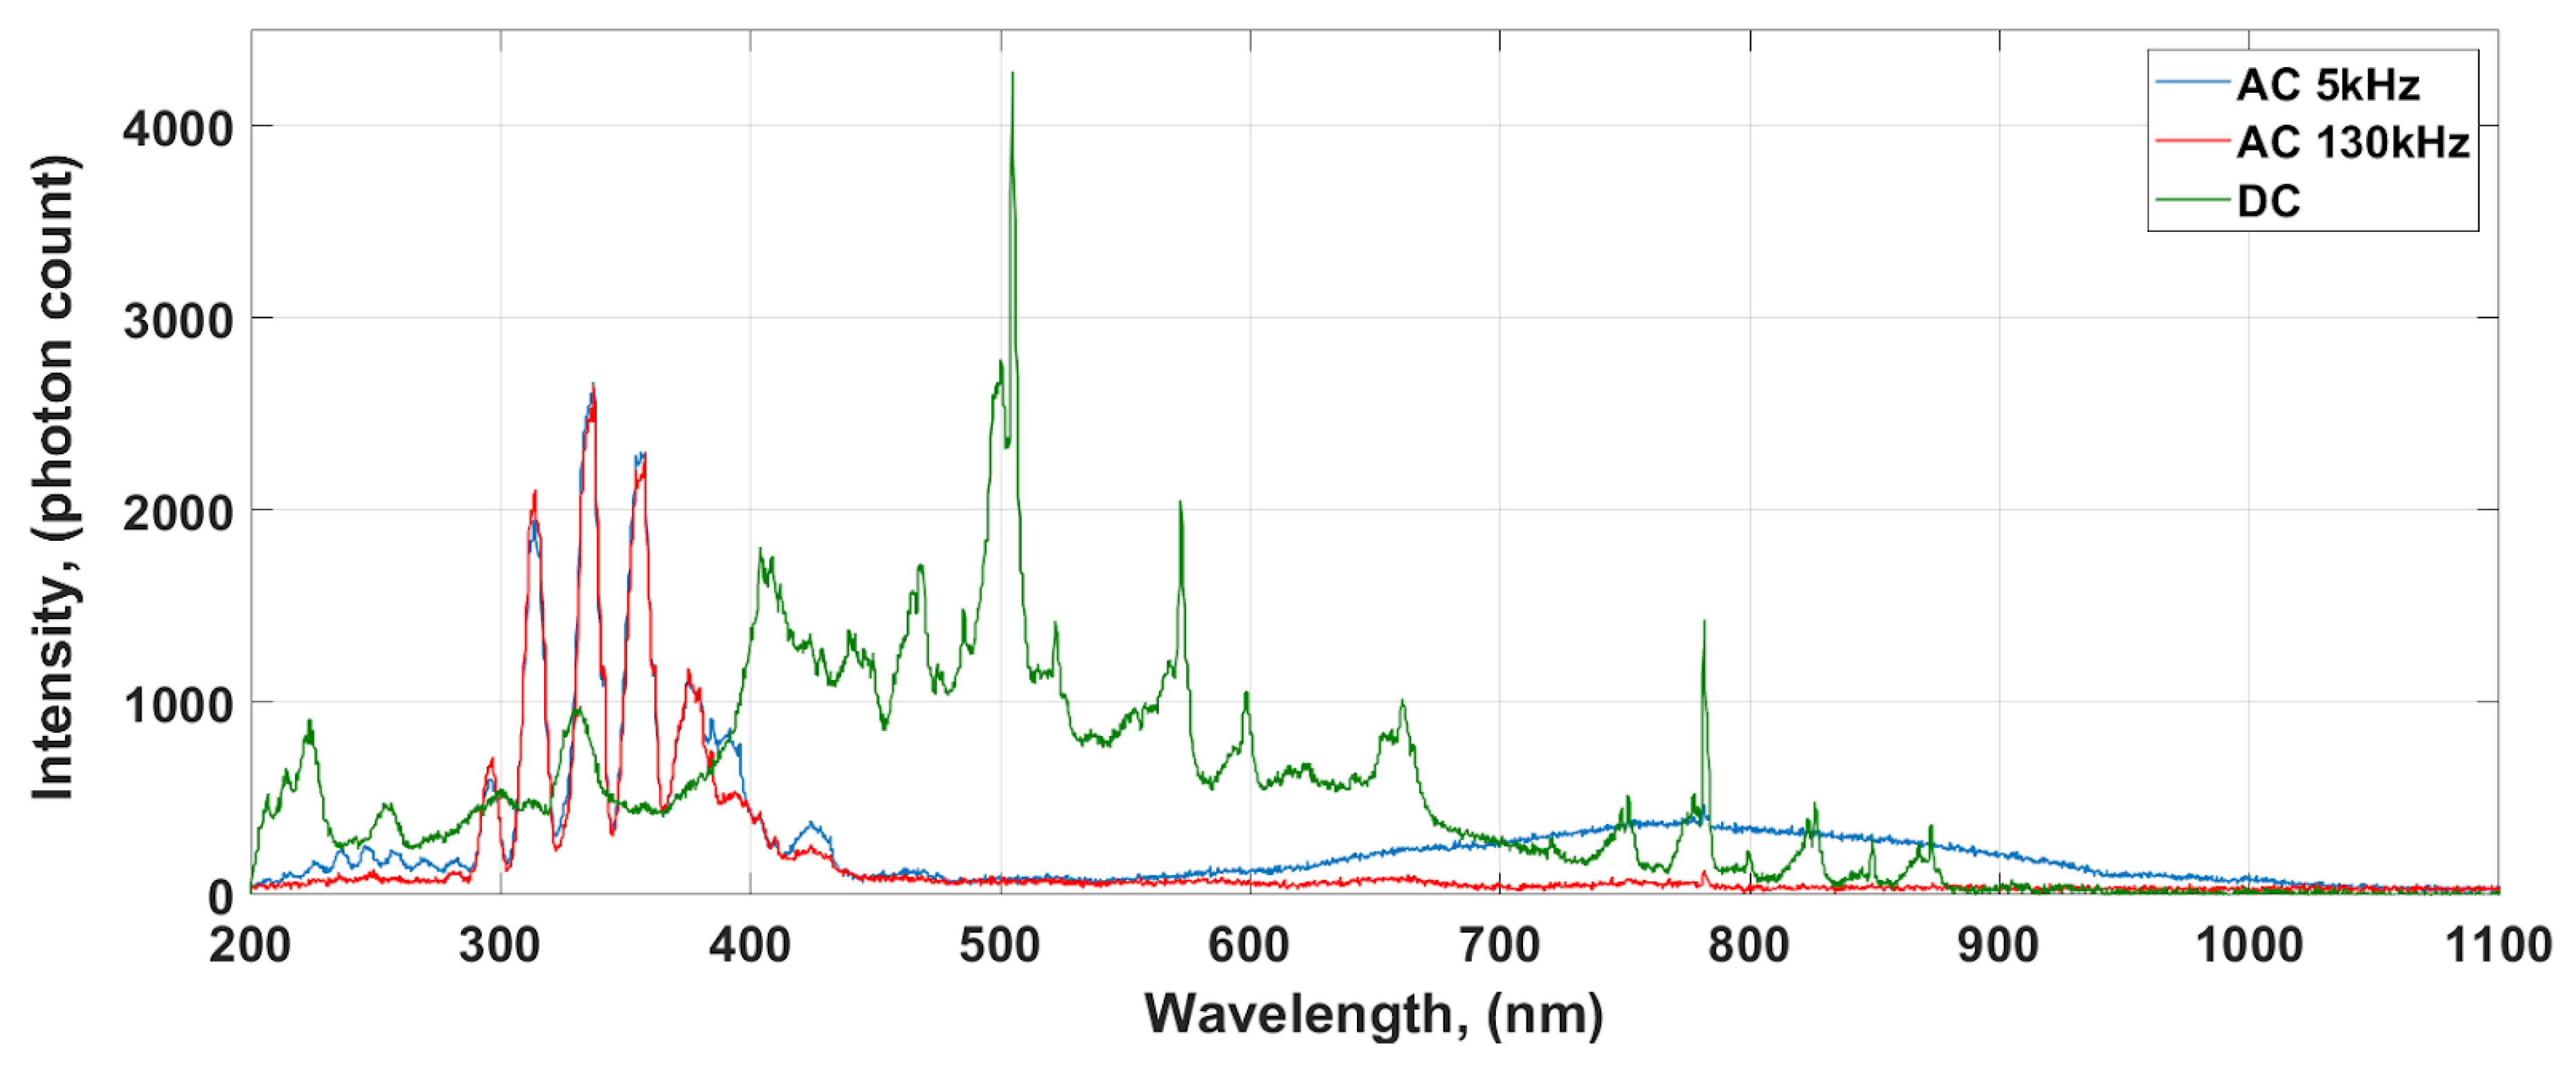
Table 1 shows the characteristic line lengths for this spectrum. Compared to the spectra obtained from arcs generated by alternating voltage, the main part of the electromagnetic wave being recorded is in the visible light range. In addition, a greater share of NIR can be observed than it was visible for arcs generated by AC. The comparison of the spectra to better illustrate the differences is shown in
Figure 5.
Using the assumptions of quantum mechanics, we can describe optical radiation as a stream of photons, in which each elementary particle is a carrier of energy. The amount of energy that a single photon has can be determined by the following equation:
where
E—energy of a single photon (J),
h—Planck constant 6.626 × 10⁻³⁴ (J·s),
υ— wave frequency (1/s).
The optical radiation wave frequency is expressed by the formula:
where
υ—wave frequency (1/s);
c—speed of light in vacuum 2.998 × 10⁸ (m/s);
λ—wavelength (nm).
From the number of photons recorded by the spectrophotometer for each wavelength, it is possible to estimate the relative amount of energy that this component emits (
). For this purpose, the number of photons (n) is included in Equation (1):
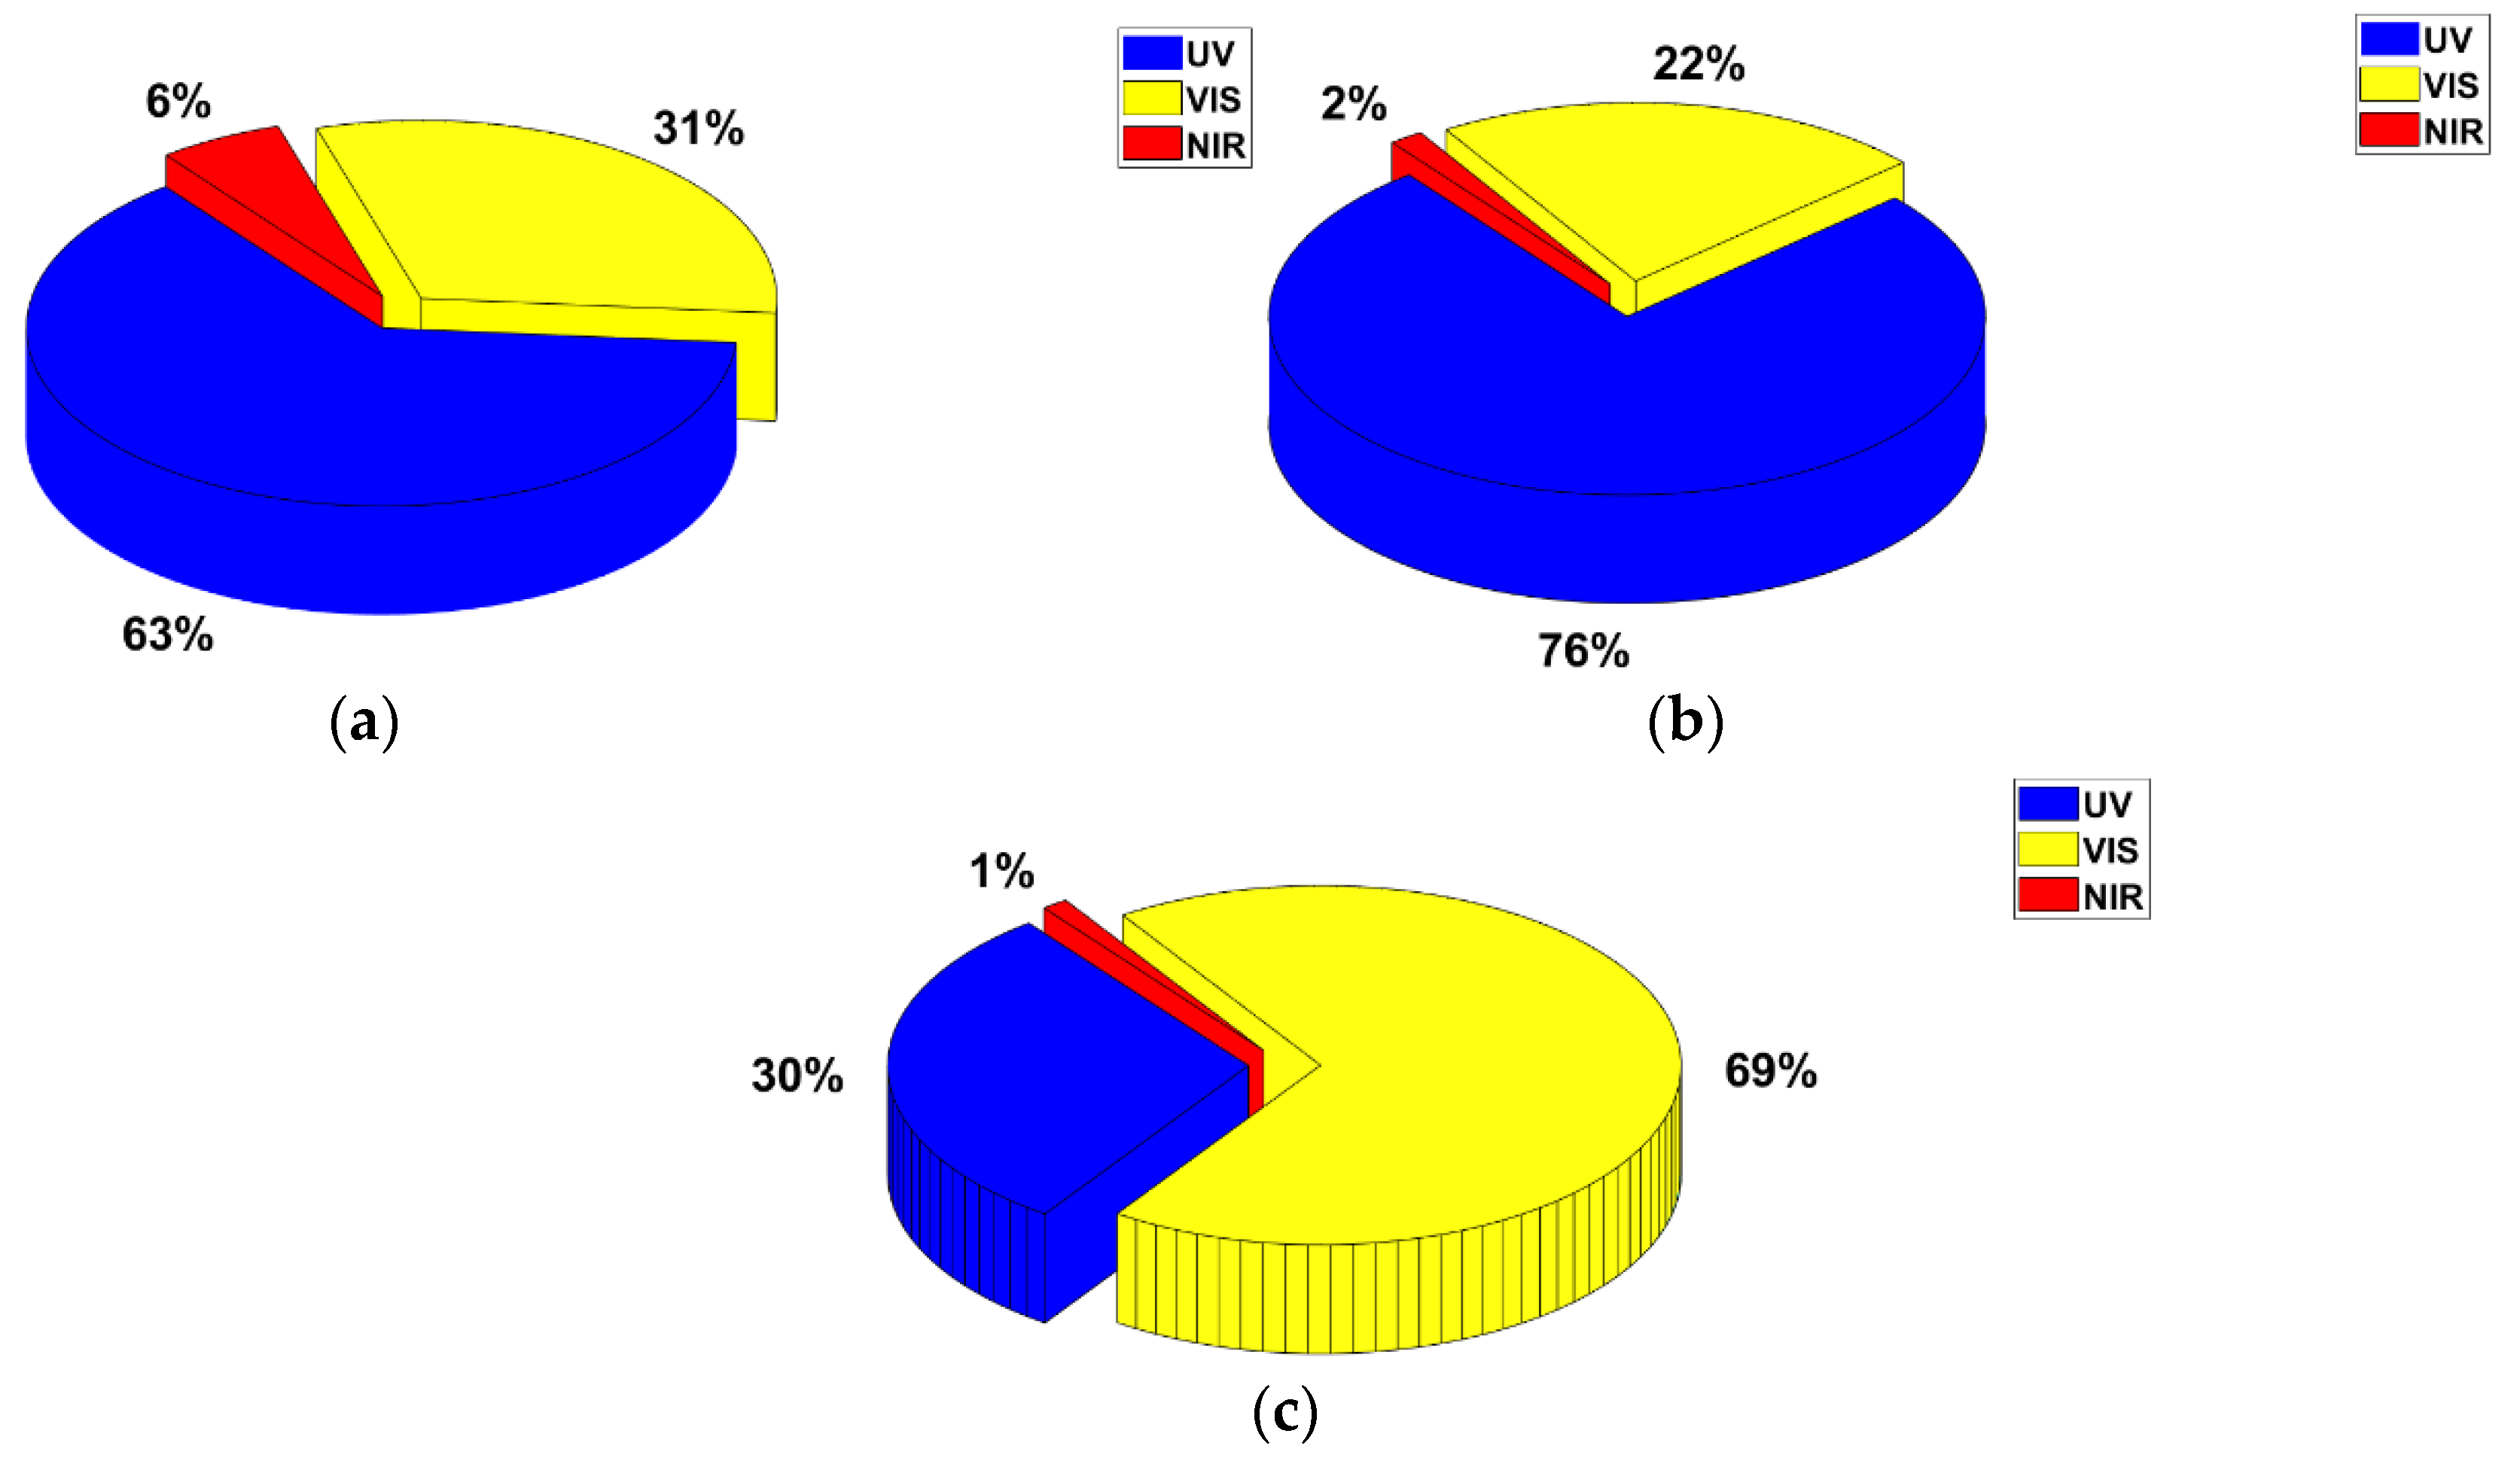
The sum of the energies of all components makes it possible to determine the energy for the whole analyzed spectral range (UV-VIS-NIR). Thus, the energy calculated is not the total energy of the optical radiation emitted by the electric arc. It is a relative value estimated on the basis of recorded spectral characteristics, which, for better illustration, is presented as a percentage of individual spectral ranges (
Figure 6).
When analyzing the spectral ranges for the energy emitted, it can be concluded that for an electric arc generated at alternating voltage, regardless of its frequency, ionizing radiation dominates in the ultraviolet range. Its share is about 60–70% of the emitted energy in the form of optical radiation. The remaining part is the energy of visible light photons, whose share is about 20–30% and a small share, about 2–6% of infrared radiation energy.
Slightly different energy distribution was observed for the optical radiation emitted by the electric arc generated at DC voltage. In this case, the energy of ionizing radiation is only 30% of the energy emitted as optical radiation. However, the dominant share is for the energy of visible light photons. Infrared radiation energy is very low and represents only 1% of the energy of the whole spectral range.
Differences in the energy shares of spectral ranges as well as in spectral characteristics obtained for the arc generated at alternating and DC voltage result, among others, from physicochemical phenomena occurring at the atomic level. The high frequency of alternating voltage significantly reduces the transmission of energy needed to stimulate gas atoms (in this case, it is air). It causes a rapid change in polarization, which causes an increase in electron acceleration and at the same time slowing down the electrons. This has a significant impact on the kinetic energy transmitted by them, which, as a result of the rapid polarization, cannot reach a sufficiently high value to interact with air particles. Only part of the electrons reaches a sufficiently high level of energy at which, as a result of the collision, ionizing radiation is emitted and registered in the ultraviolet range. This is clearly visible on alternating voltage spectra, where a small number of band spectra, characteristic for the activity of high-energy particles, are observed (
Figure 3).
In the case of the arc generated at DC voltage, the transmitted energy is supplied continuously. This maintains a constant and stable electric field in which moving electrons increase their kinetic energy. When the electron collides with gas particles, it transfers most of its energy to their excitation, which can be observed in the form of numerous band spectra occurring in the spectral characteristics (
Figure 4).
4. Conclusions
On the basis of the results obtained, significant differences in the recorded spectra of optical radiation emitted by the electric arc generated at alternating and direct voltage were shown. The percentage share of optical radiation energy was estimated for particular spectral ranges. For example, the results obtained may be useful in the design of arc-protective systems. They can also be a starting point for designing electronic and power-electronic systems of arc generation with given physical and physicochemical properties. In turn, this can translate into new designs, prototypes, and constructions of different devices. The generalized studies presented in the article may be a guide for scientists dealing with welding arcs, arc lamps, or chemical catalyst systems, improving their energy efficiency and functional parameters. Research on the physical properties of the electric arc, correlated with the frequency parameters of the voltage generating the electric arc, can also be applied to the design of electric actuators, their electrical bundles, and power supply systems, which are used in challenging environmental conditions conducive to the formation of an undesirable electric arc, e.g., at reduced atmospheric pressure in aircraft.


