Using PCM in Two Proposed Residential Buildings in Christchurch, New Zealand


Abstract
1. Introduction
2. Methodology
2.1. Software Description
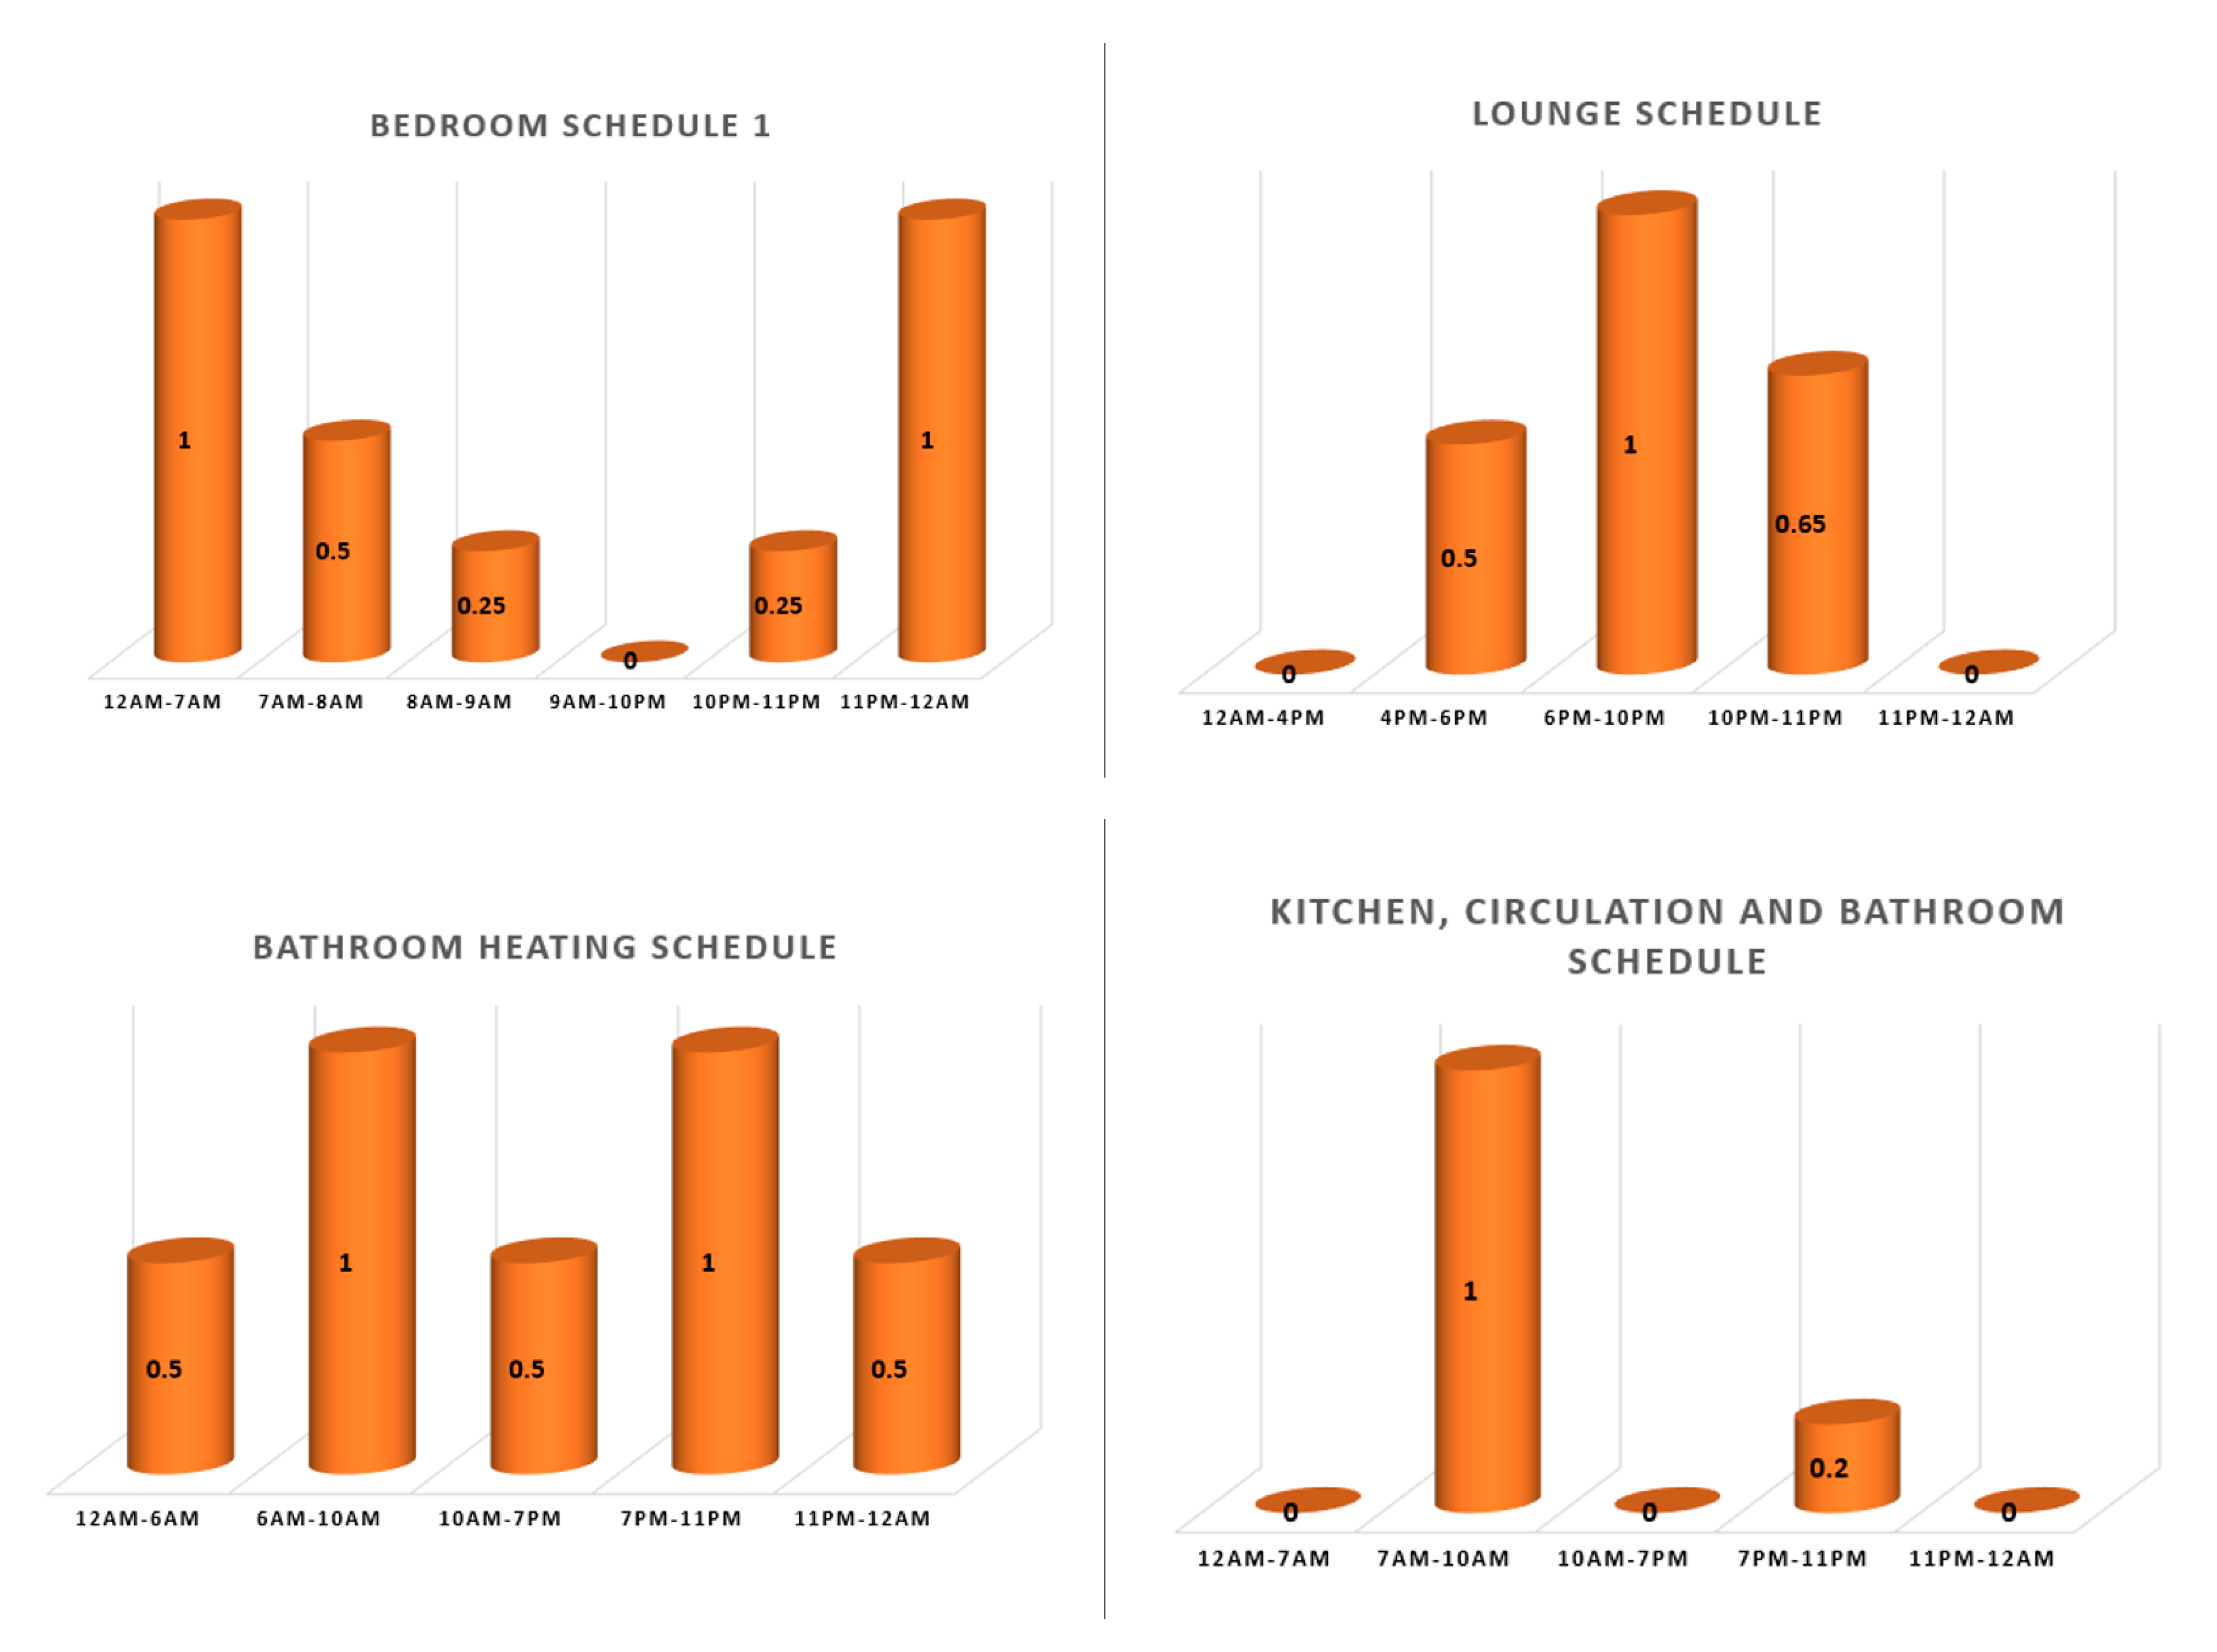
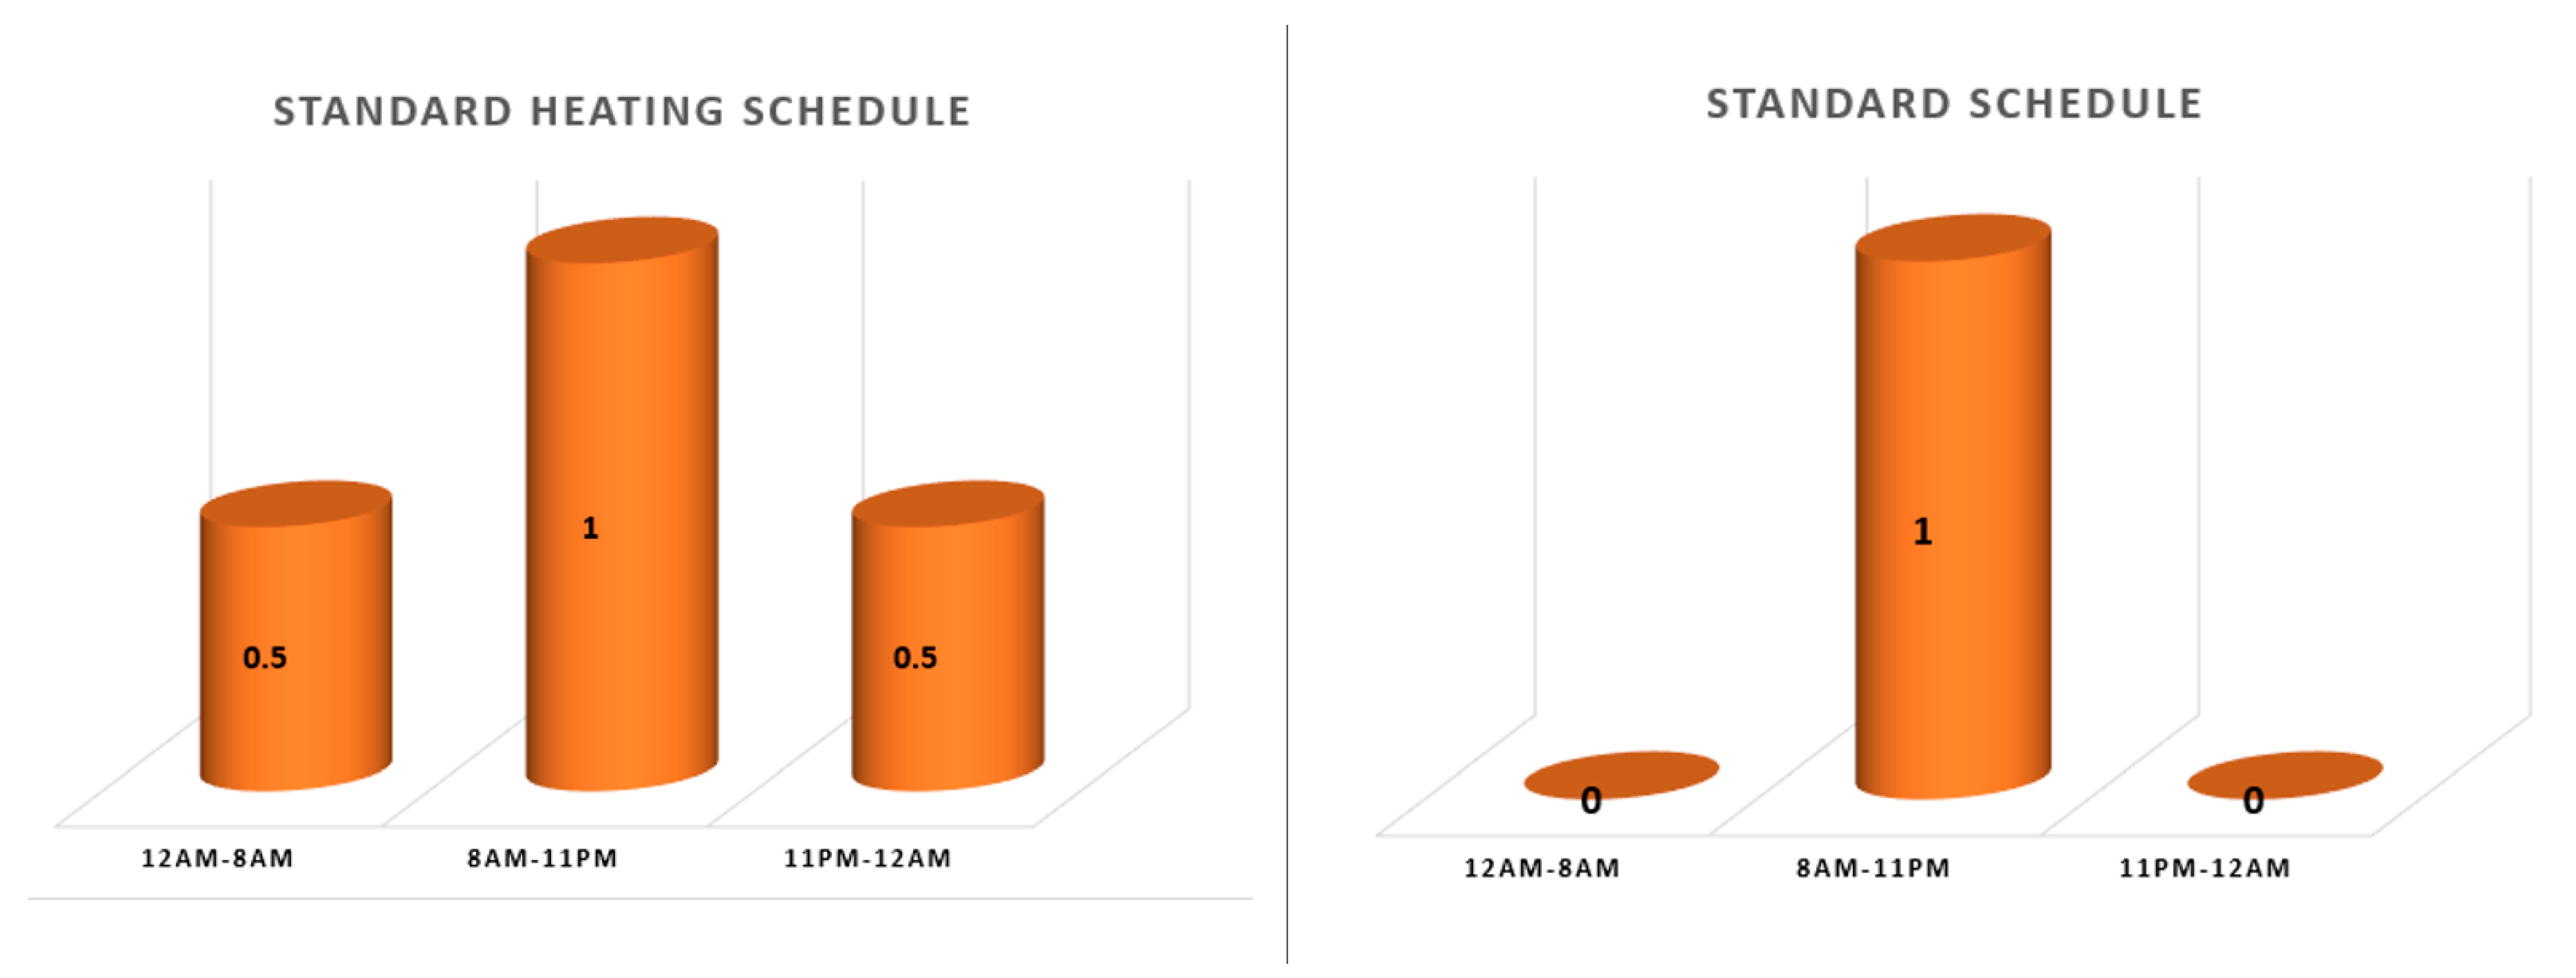
2.2. Zone Schedule
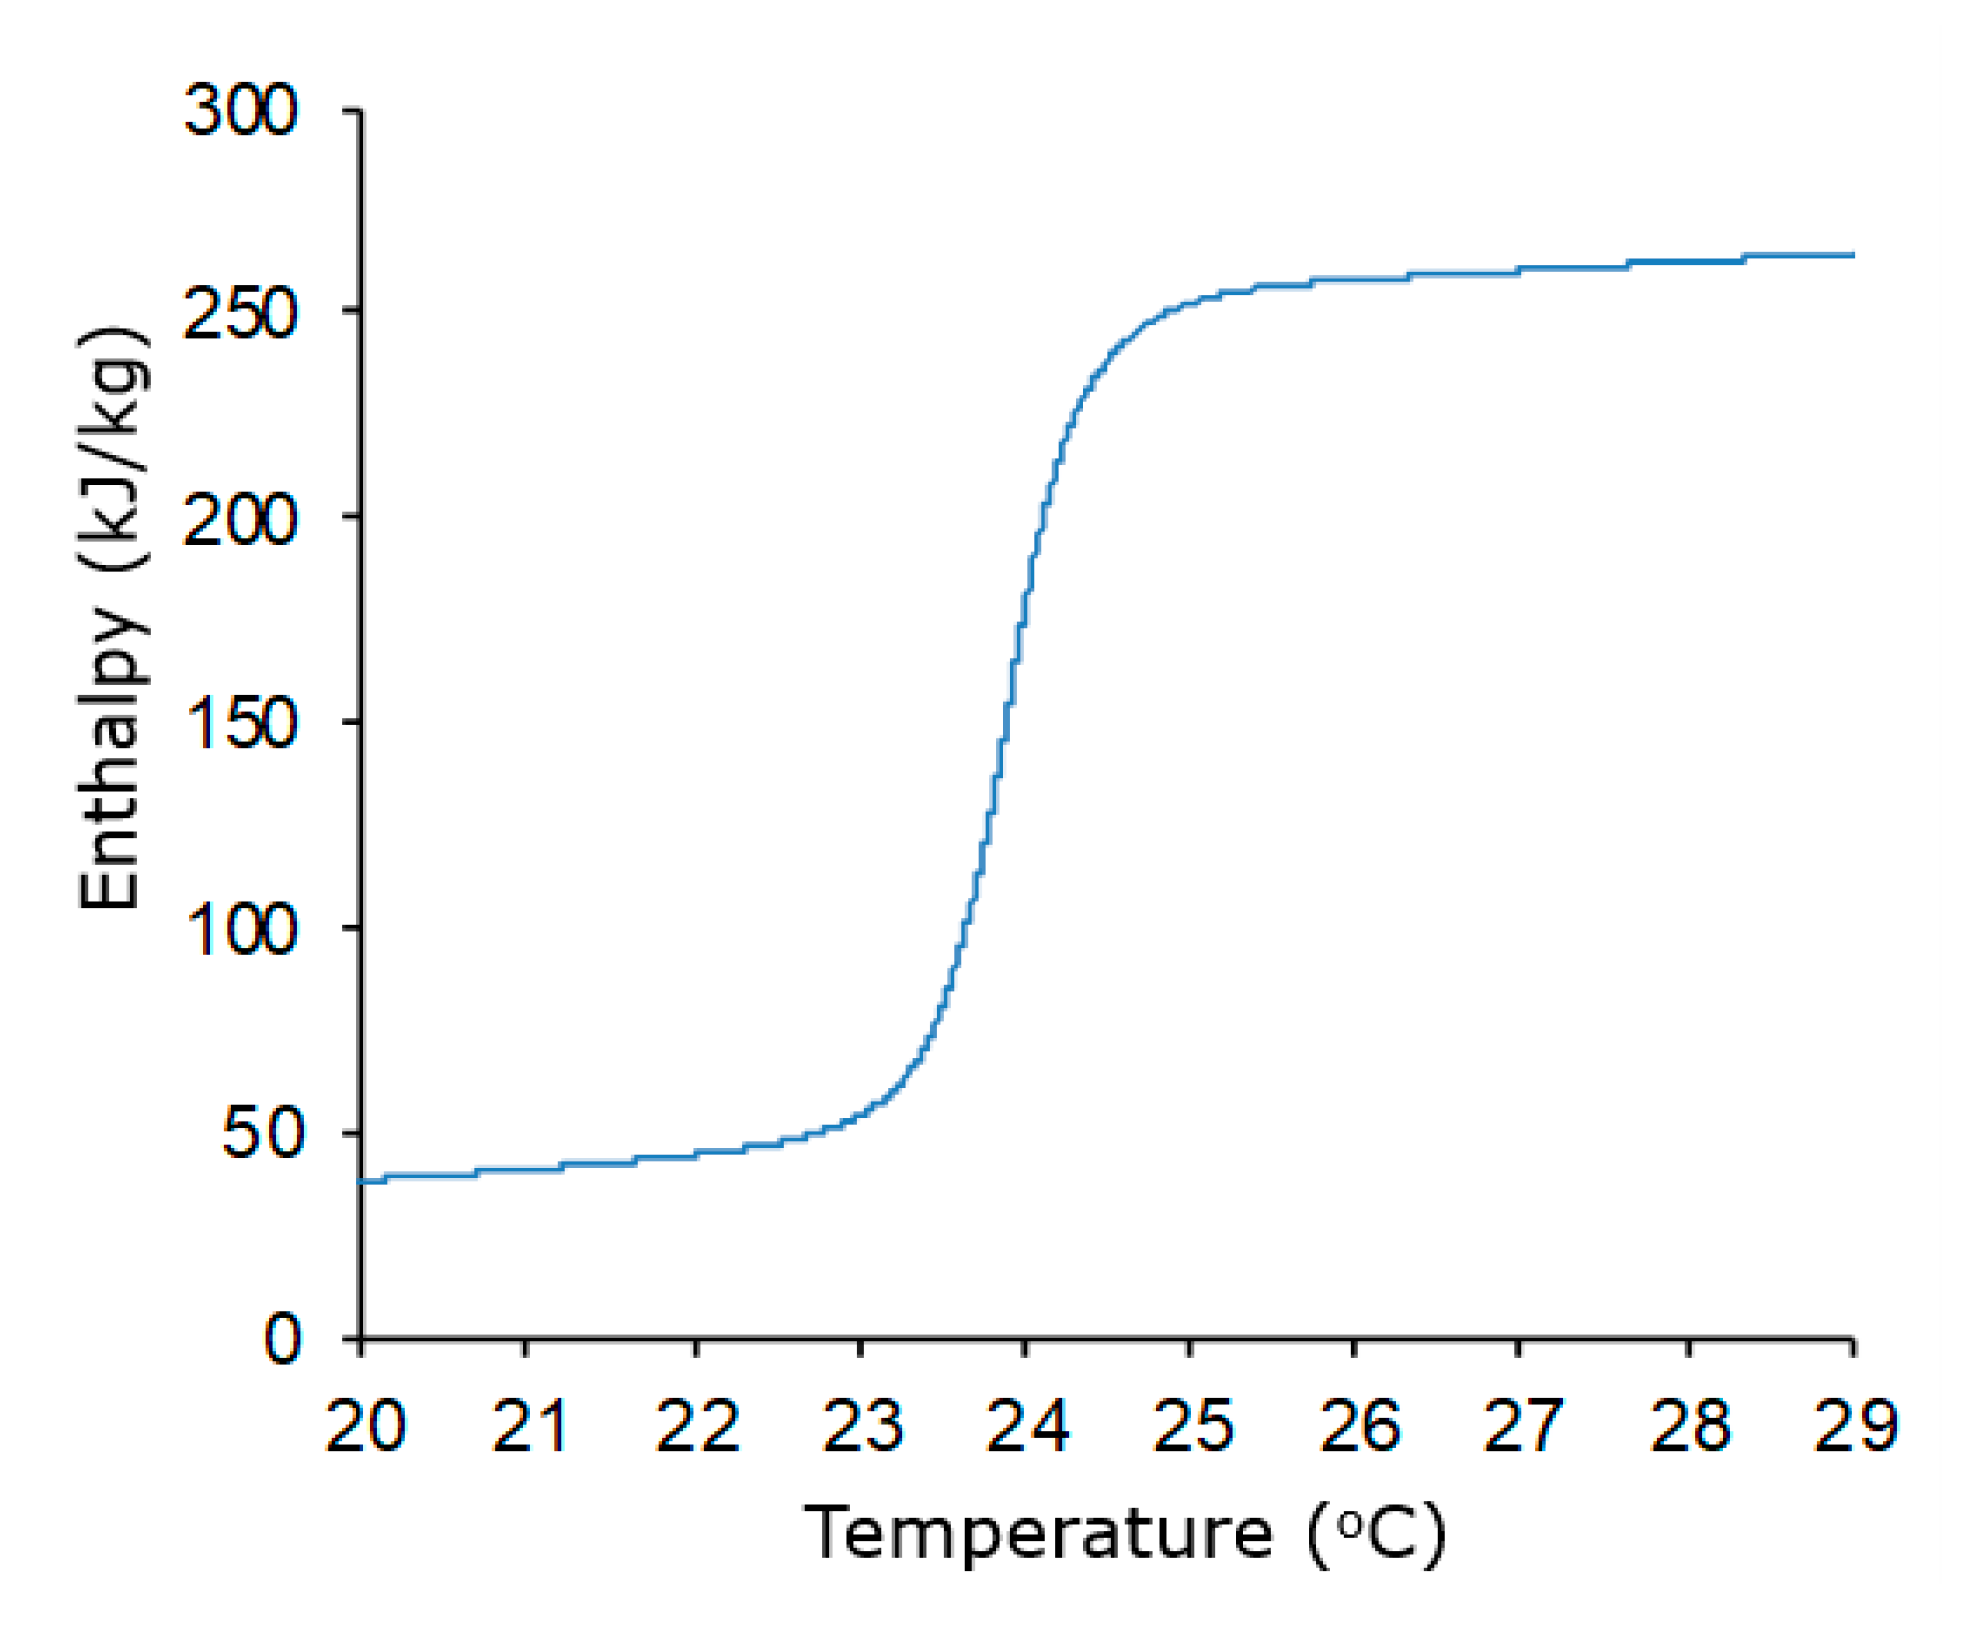
2.3. PCM Selection
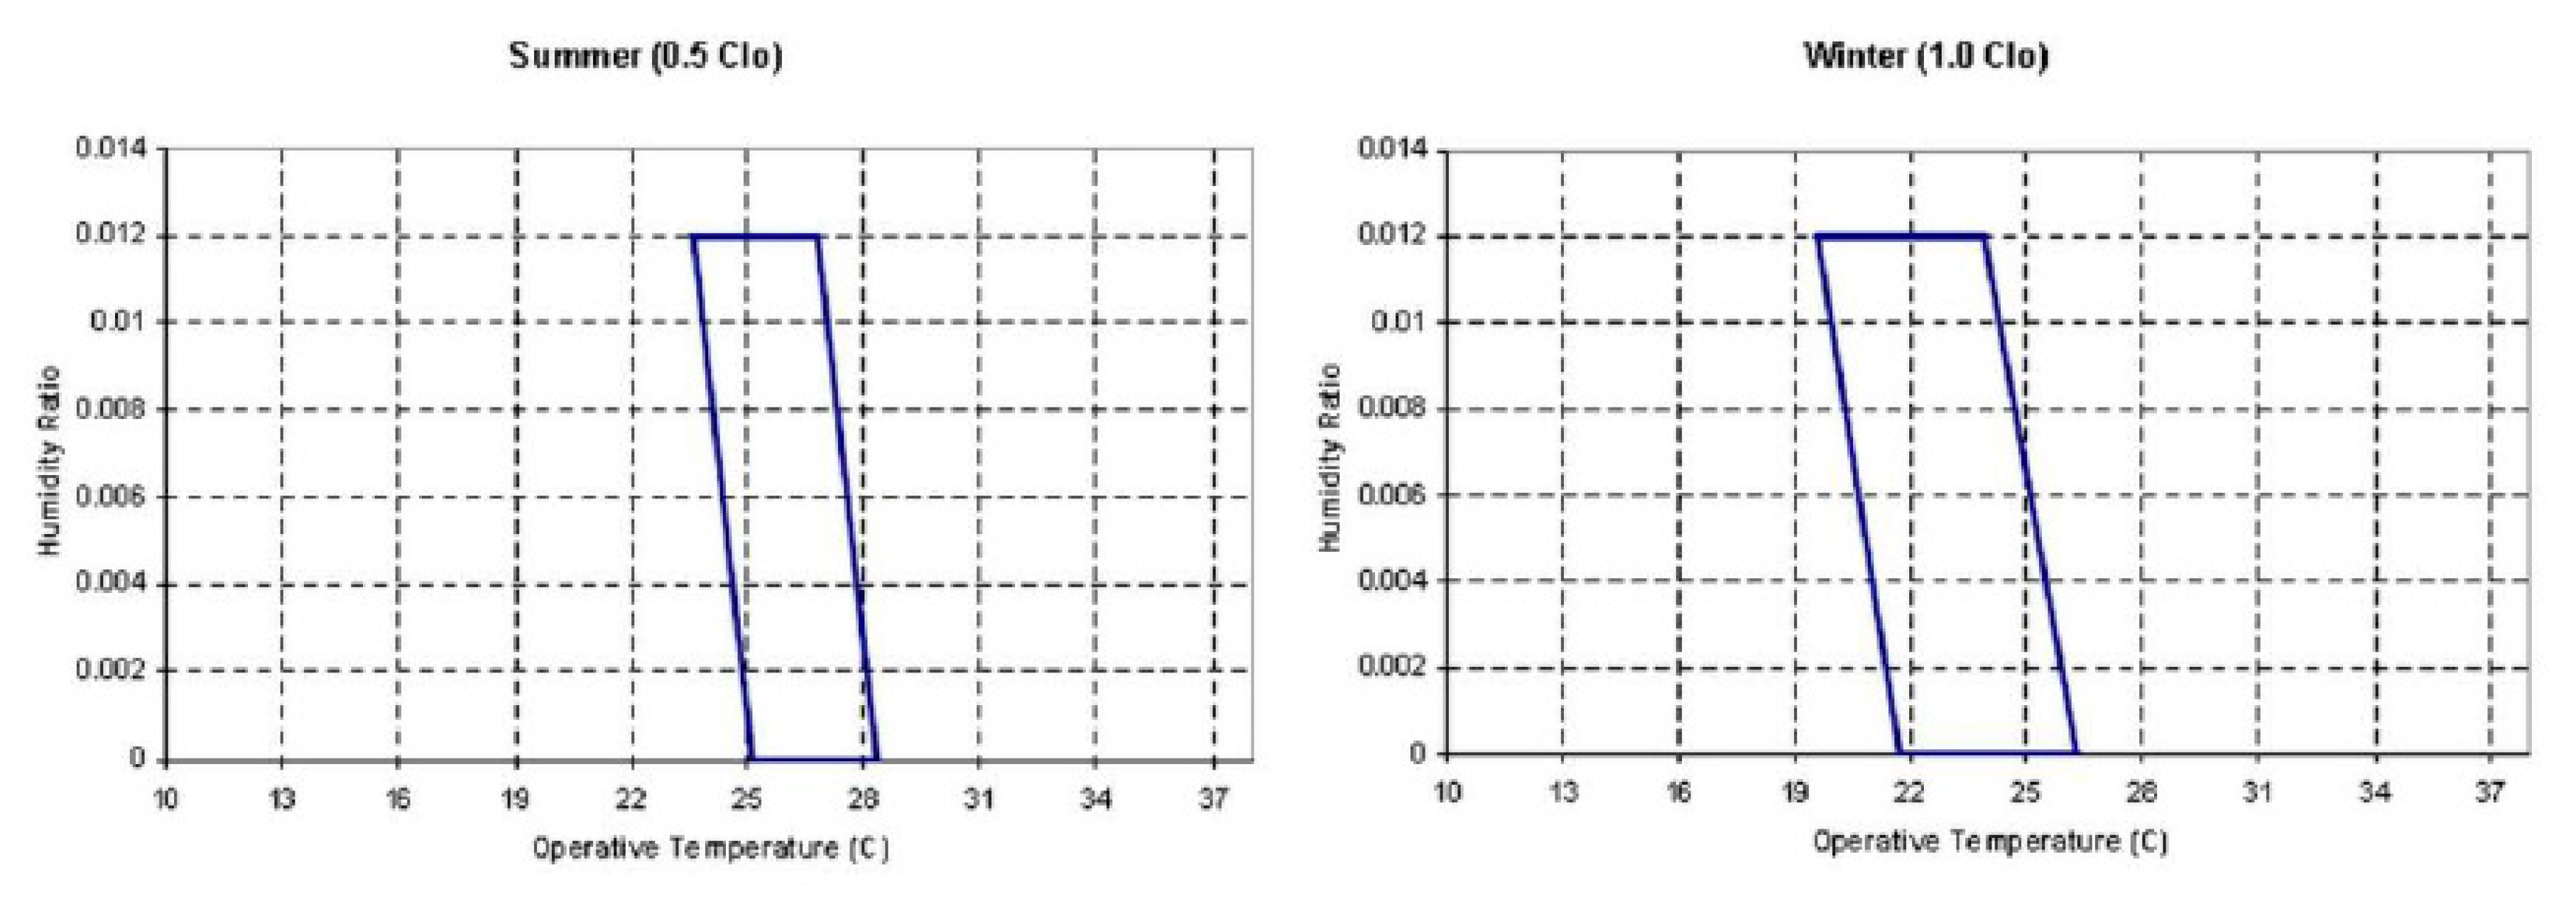
2.4. Analysis of Energy Performance and Comfort
- (i)
- Met: 1 for all occupants (meaning that only men would live at the premises);
- (ii)
- The clothing insulation was assumed to be 1 clo for the winter and 0.5 clo during summer;
- (iii)
- The occupant’s activity and calculation of comfort were based on room type.
- (a)
- The heating setpoint (HSP) indicates the ideal indoor air temperature () of the zone (or building) when the heating, ventilation, and air conditioning (HVAC) system is turned on.
- (b)
- The heating setback (HSB) defines the minimum in a building when the HVAC system is turned off.
- (c)
- When the natural ventilation setpoint (NVSP) is exceeded in a room, natural ventilation (i.e., the opening of windows) is induced provided that the external is lower than the internal and the respective zone is occupied according to its occupancy schedule.
- (d)
- The shading control temperature (SCT) defines the minimum temperature for the operation of the shading devices. When this temperature is exceeded in an occupied zone, the drapes are closed to reduce further solar gains.
3. Results and Discussion
3.1. PCM Benefit in Annual Simulation
3.1.1. Heating Demand
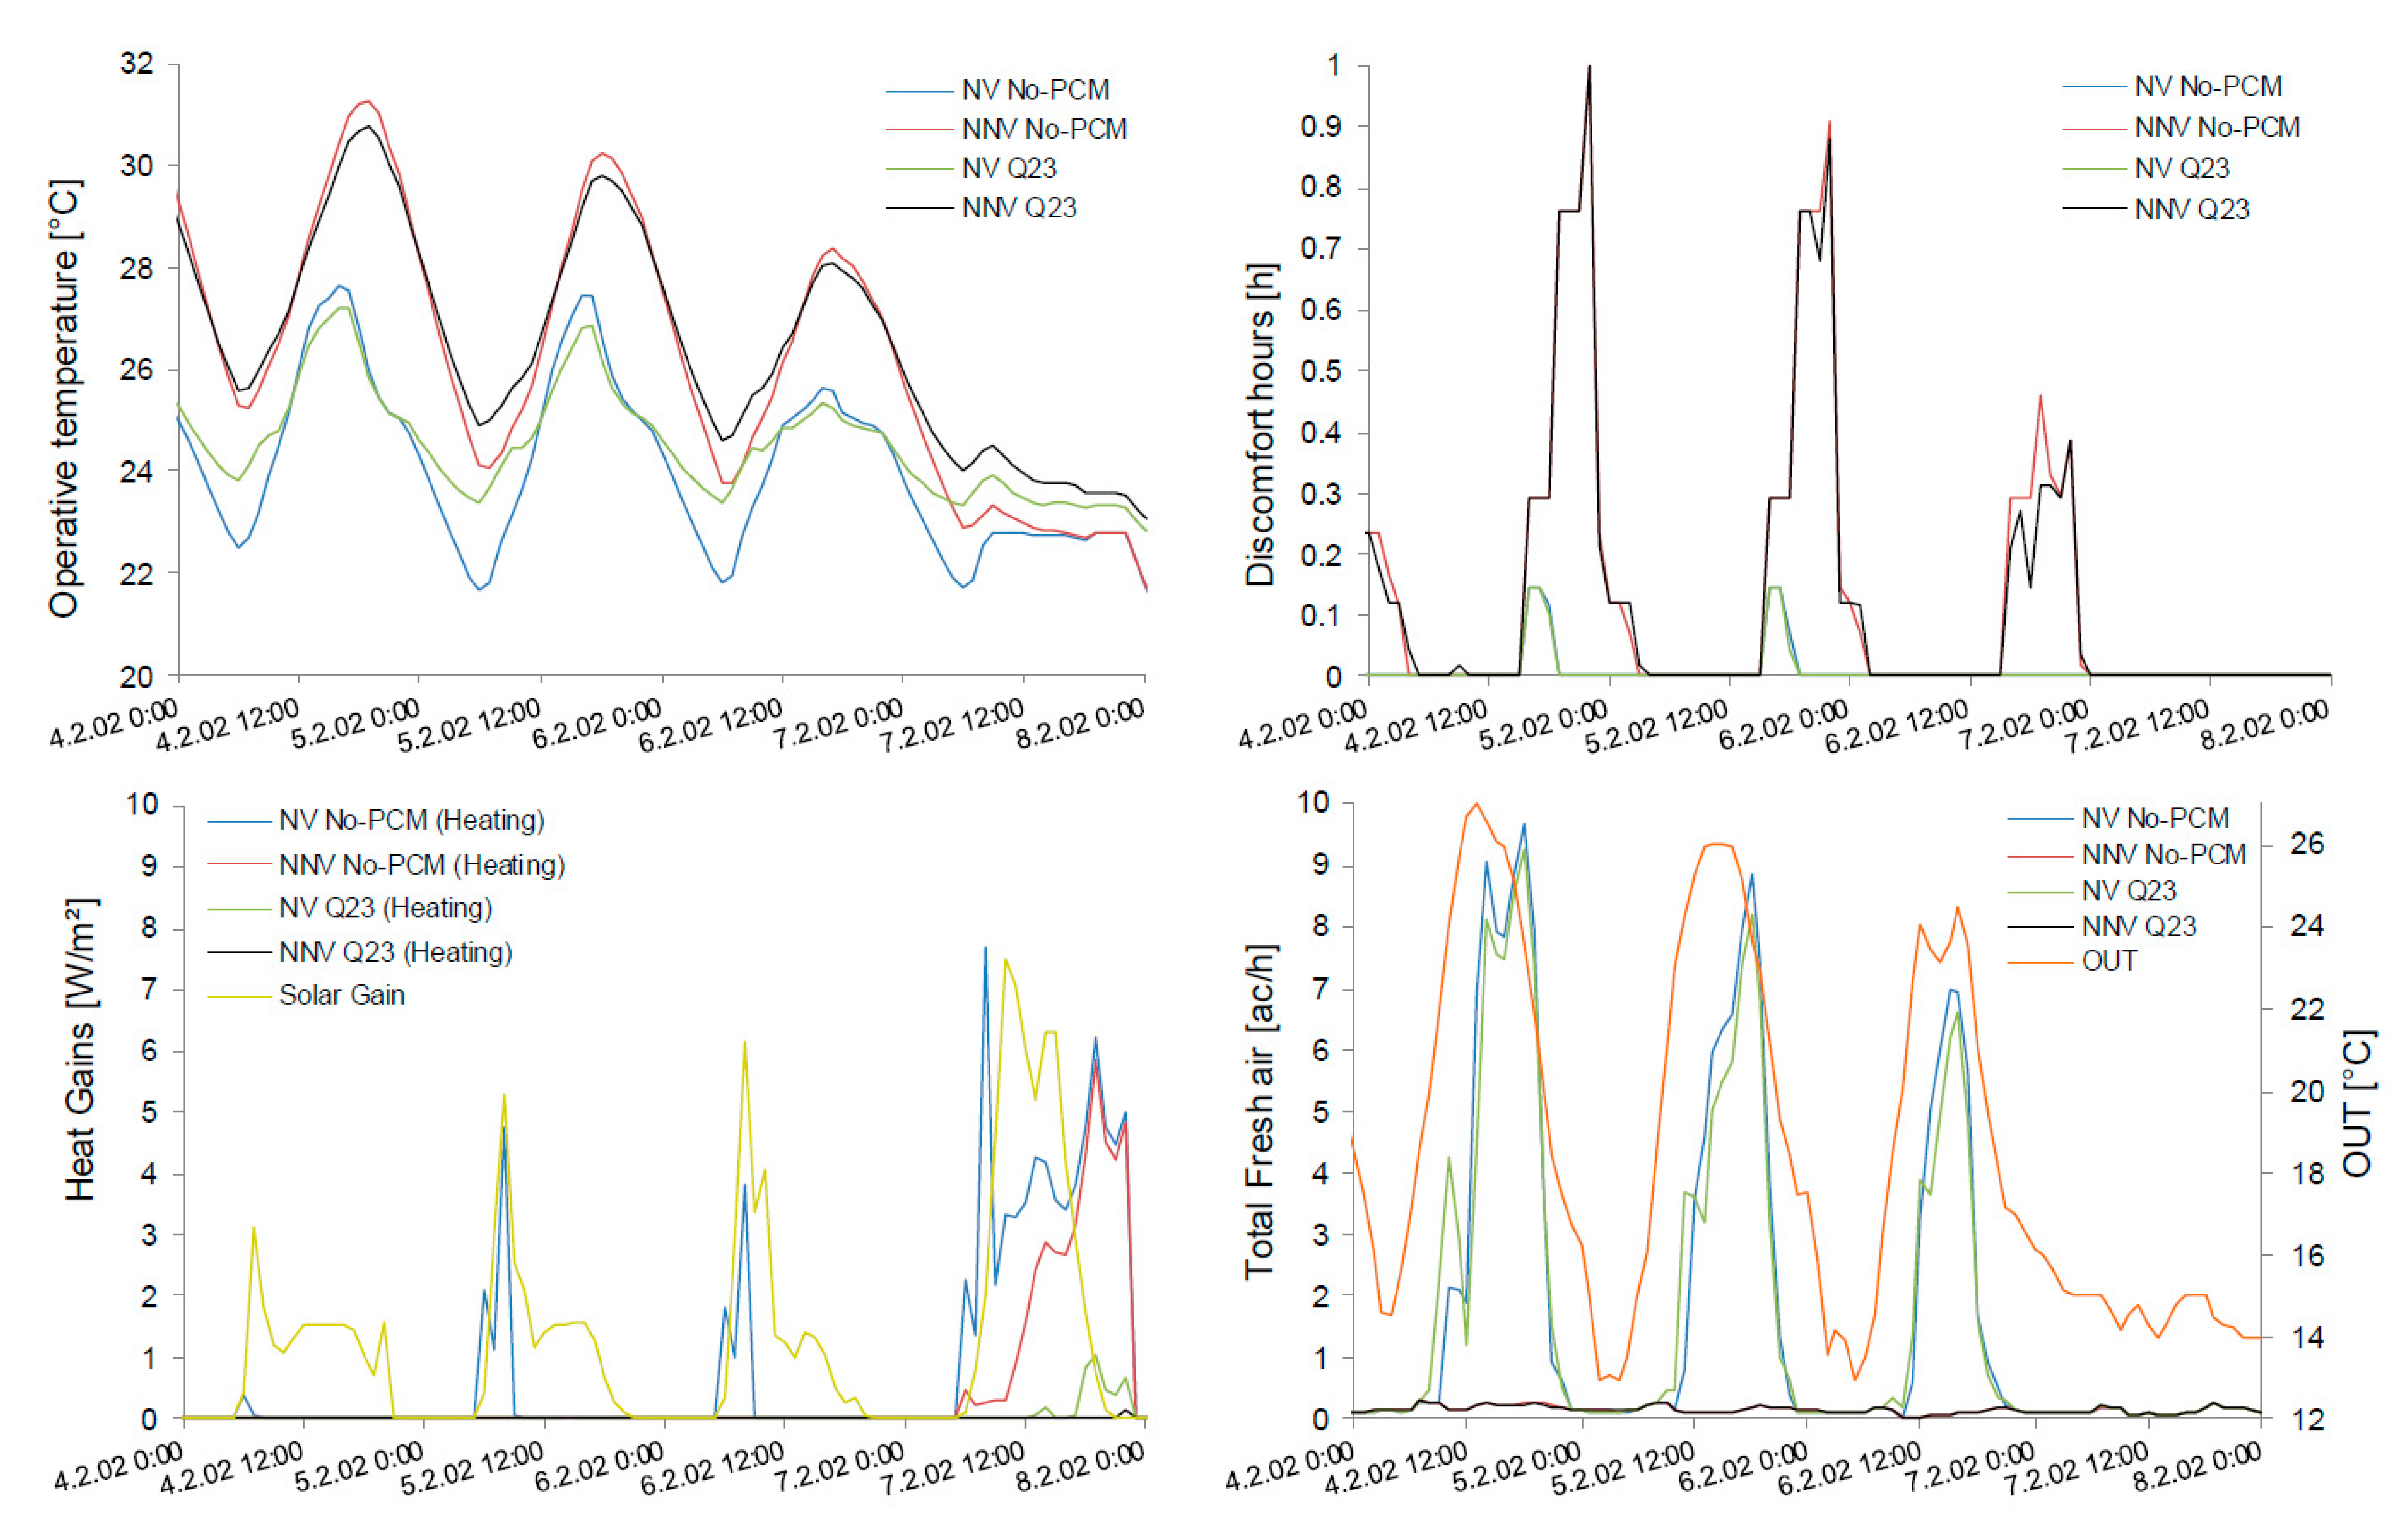
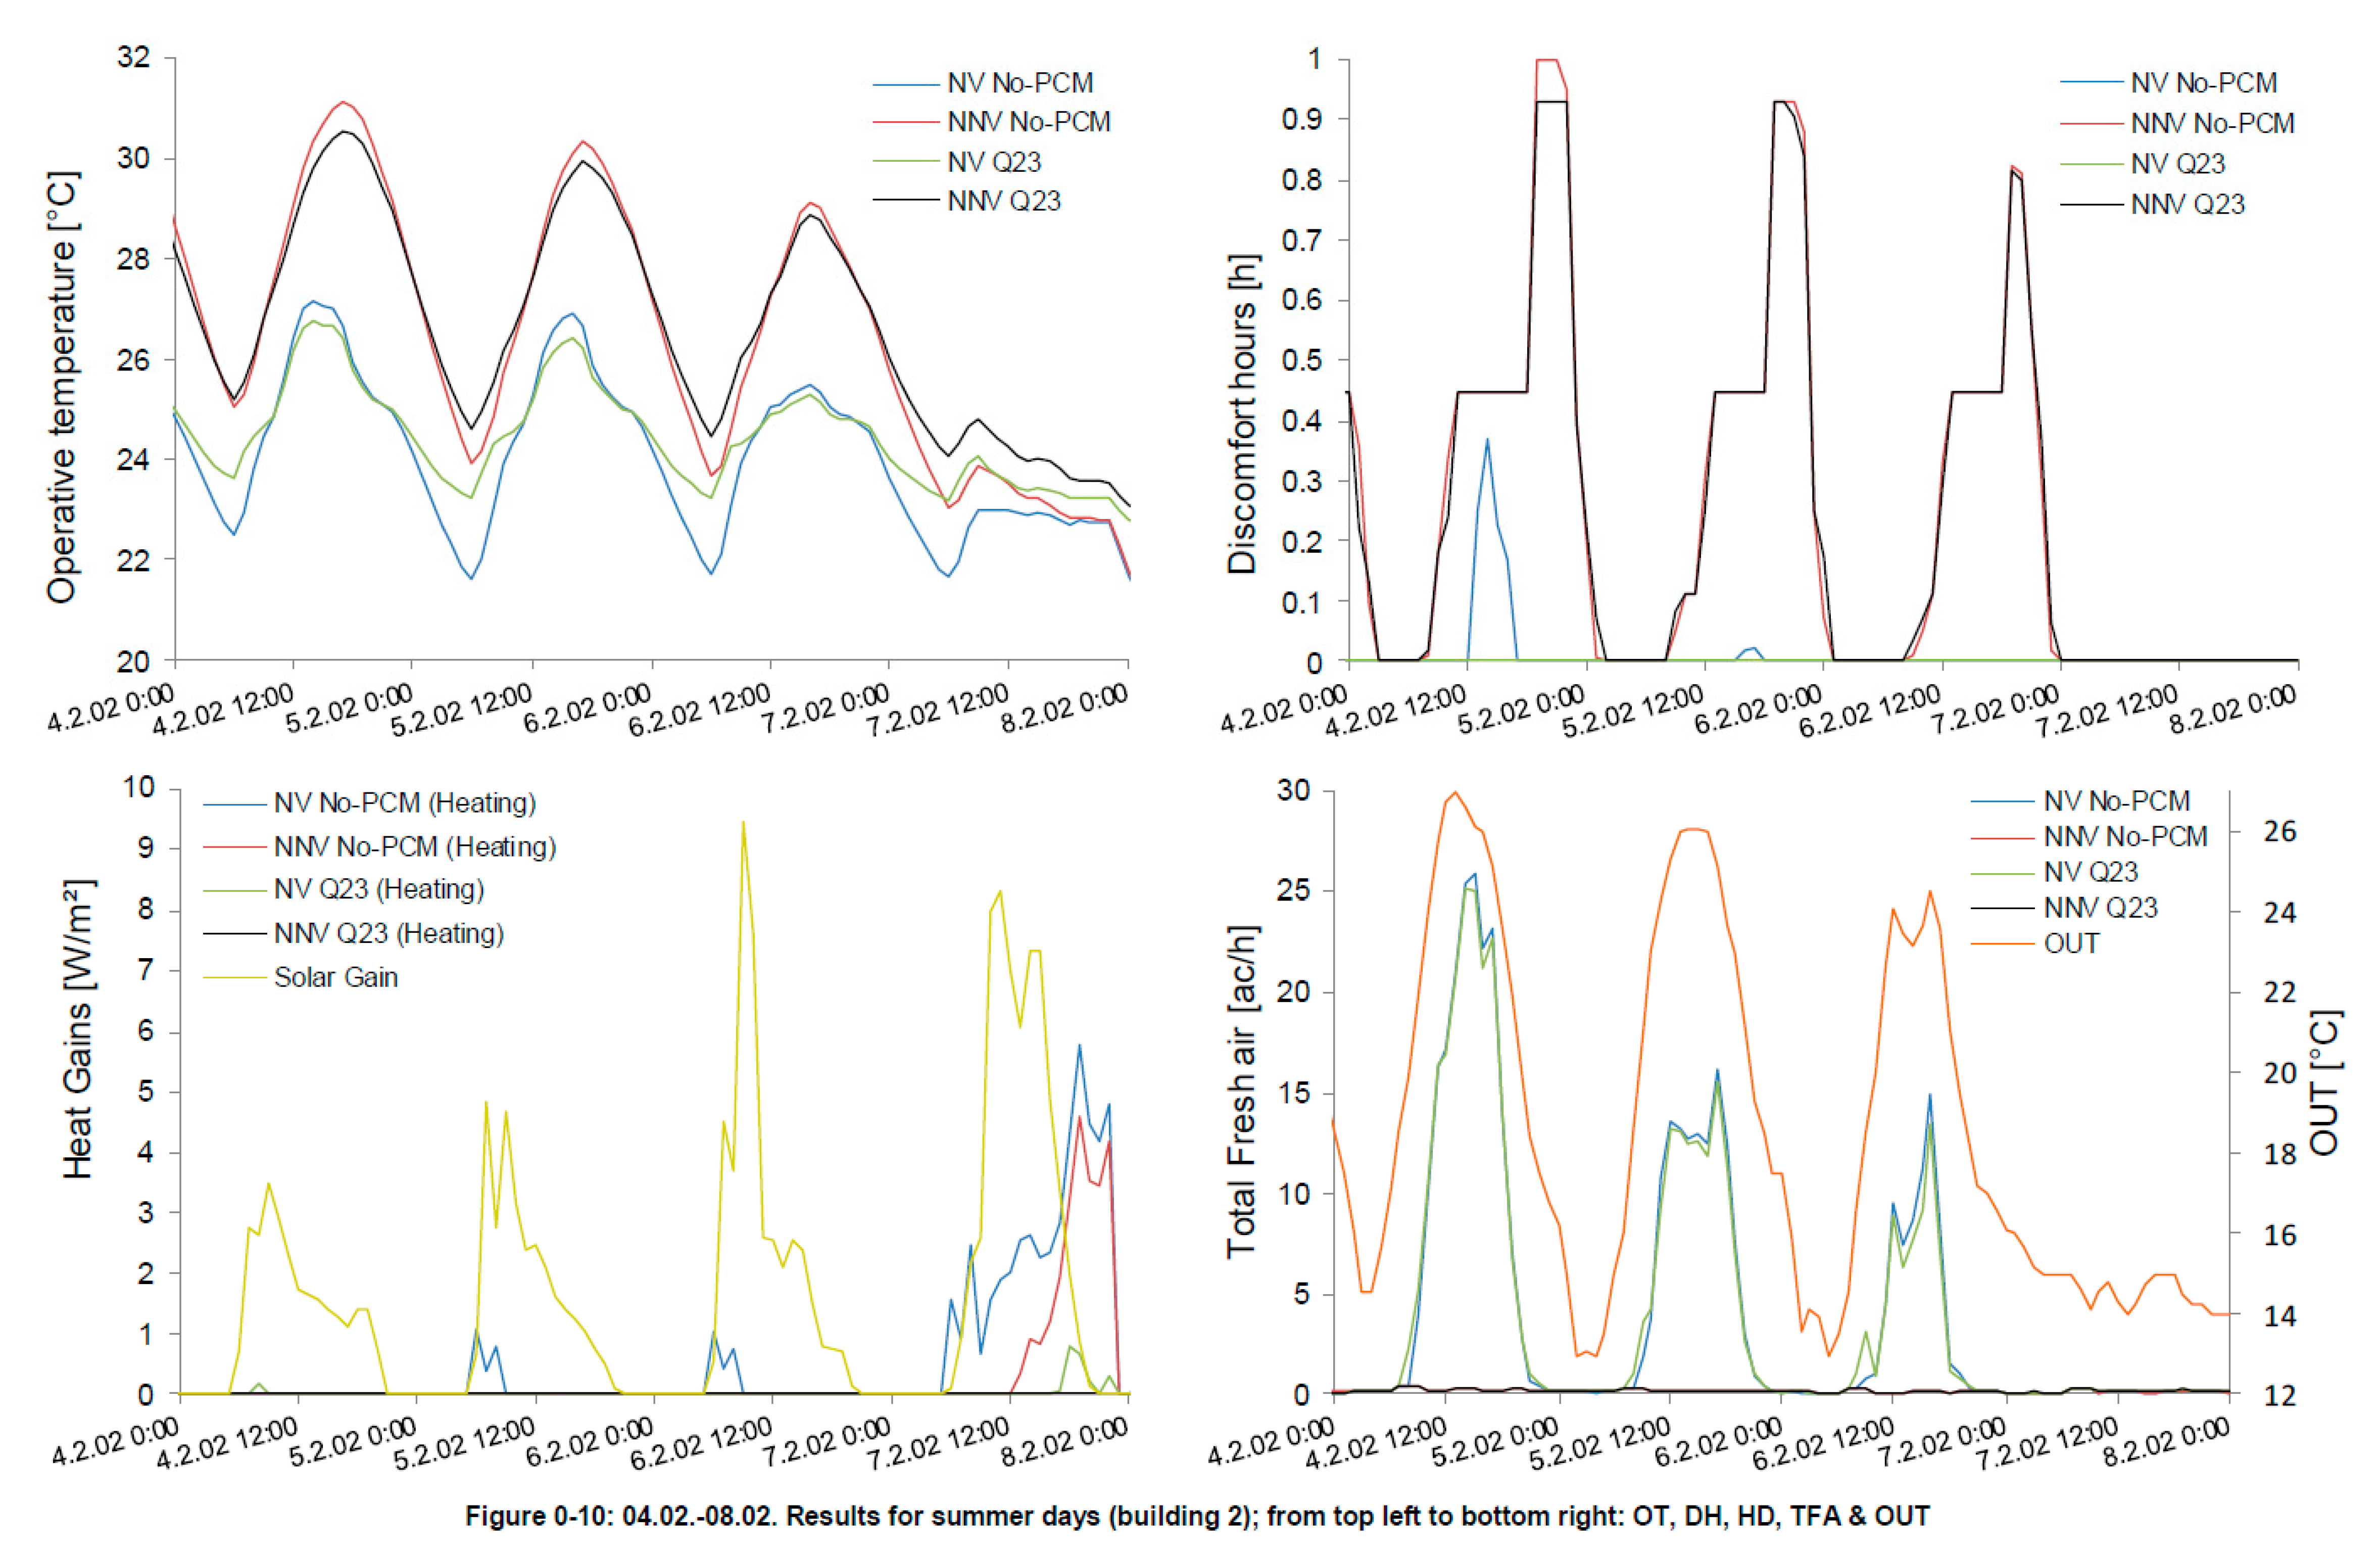
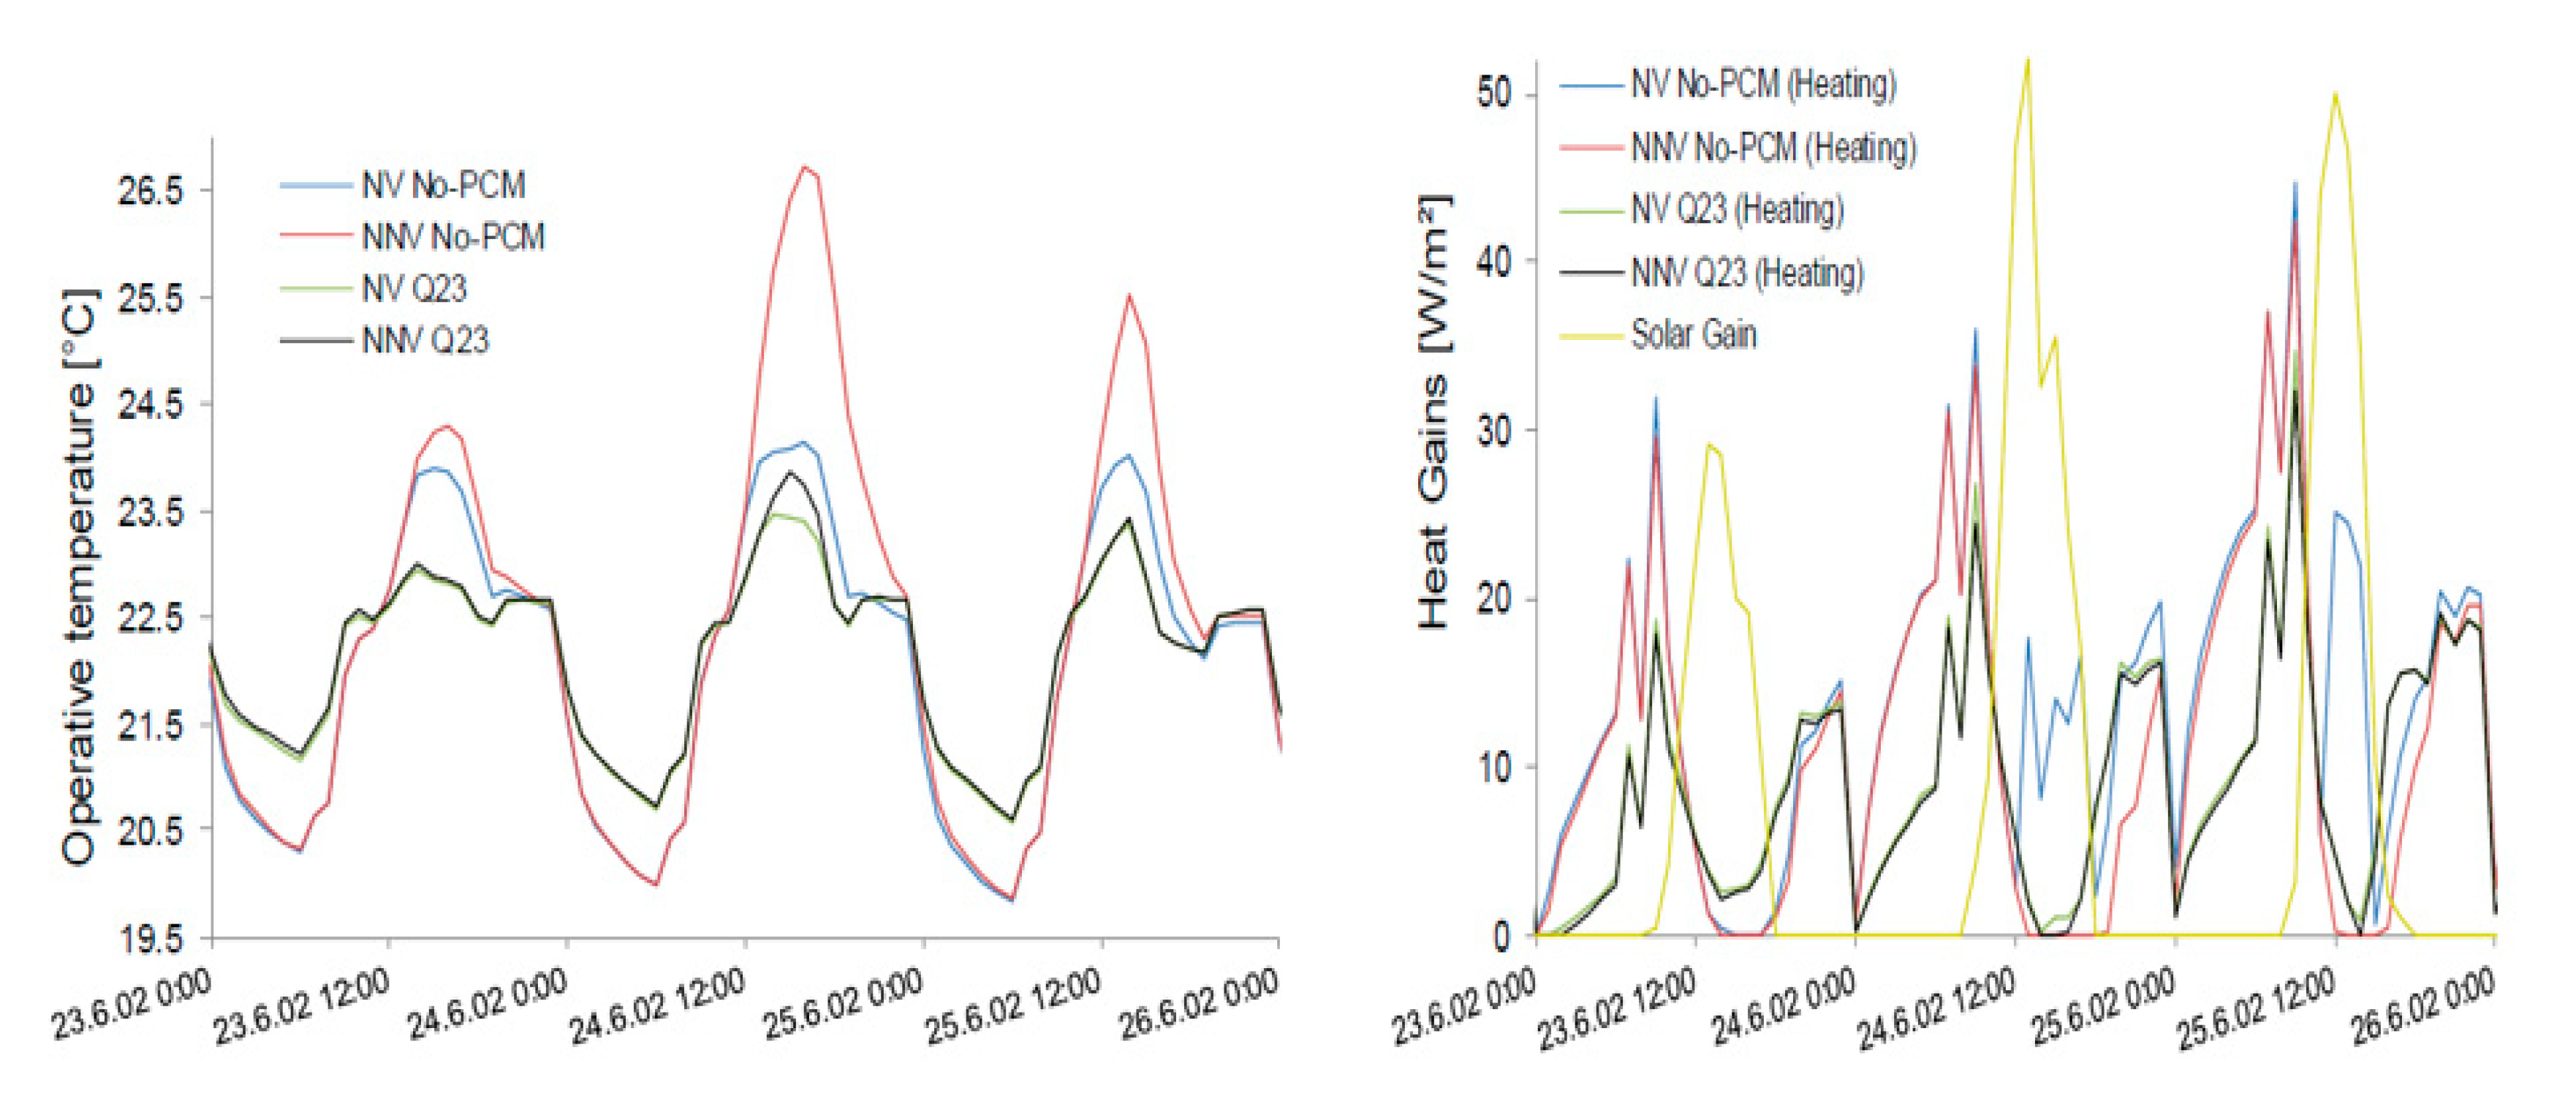
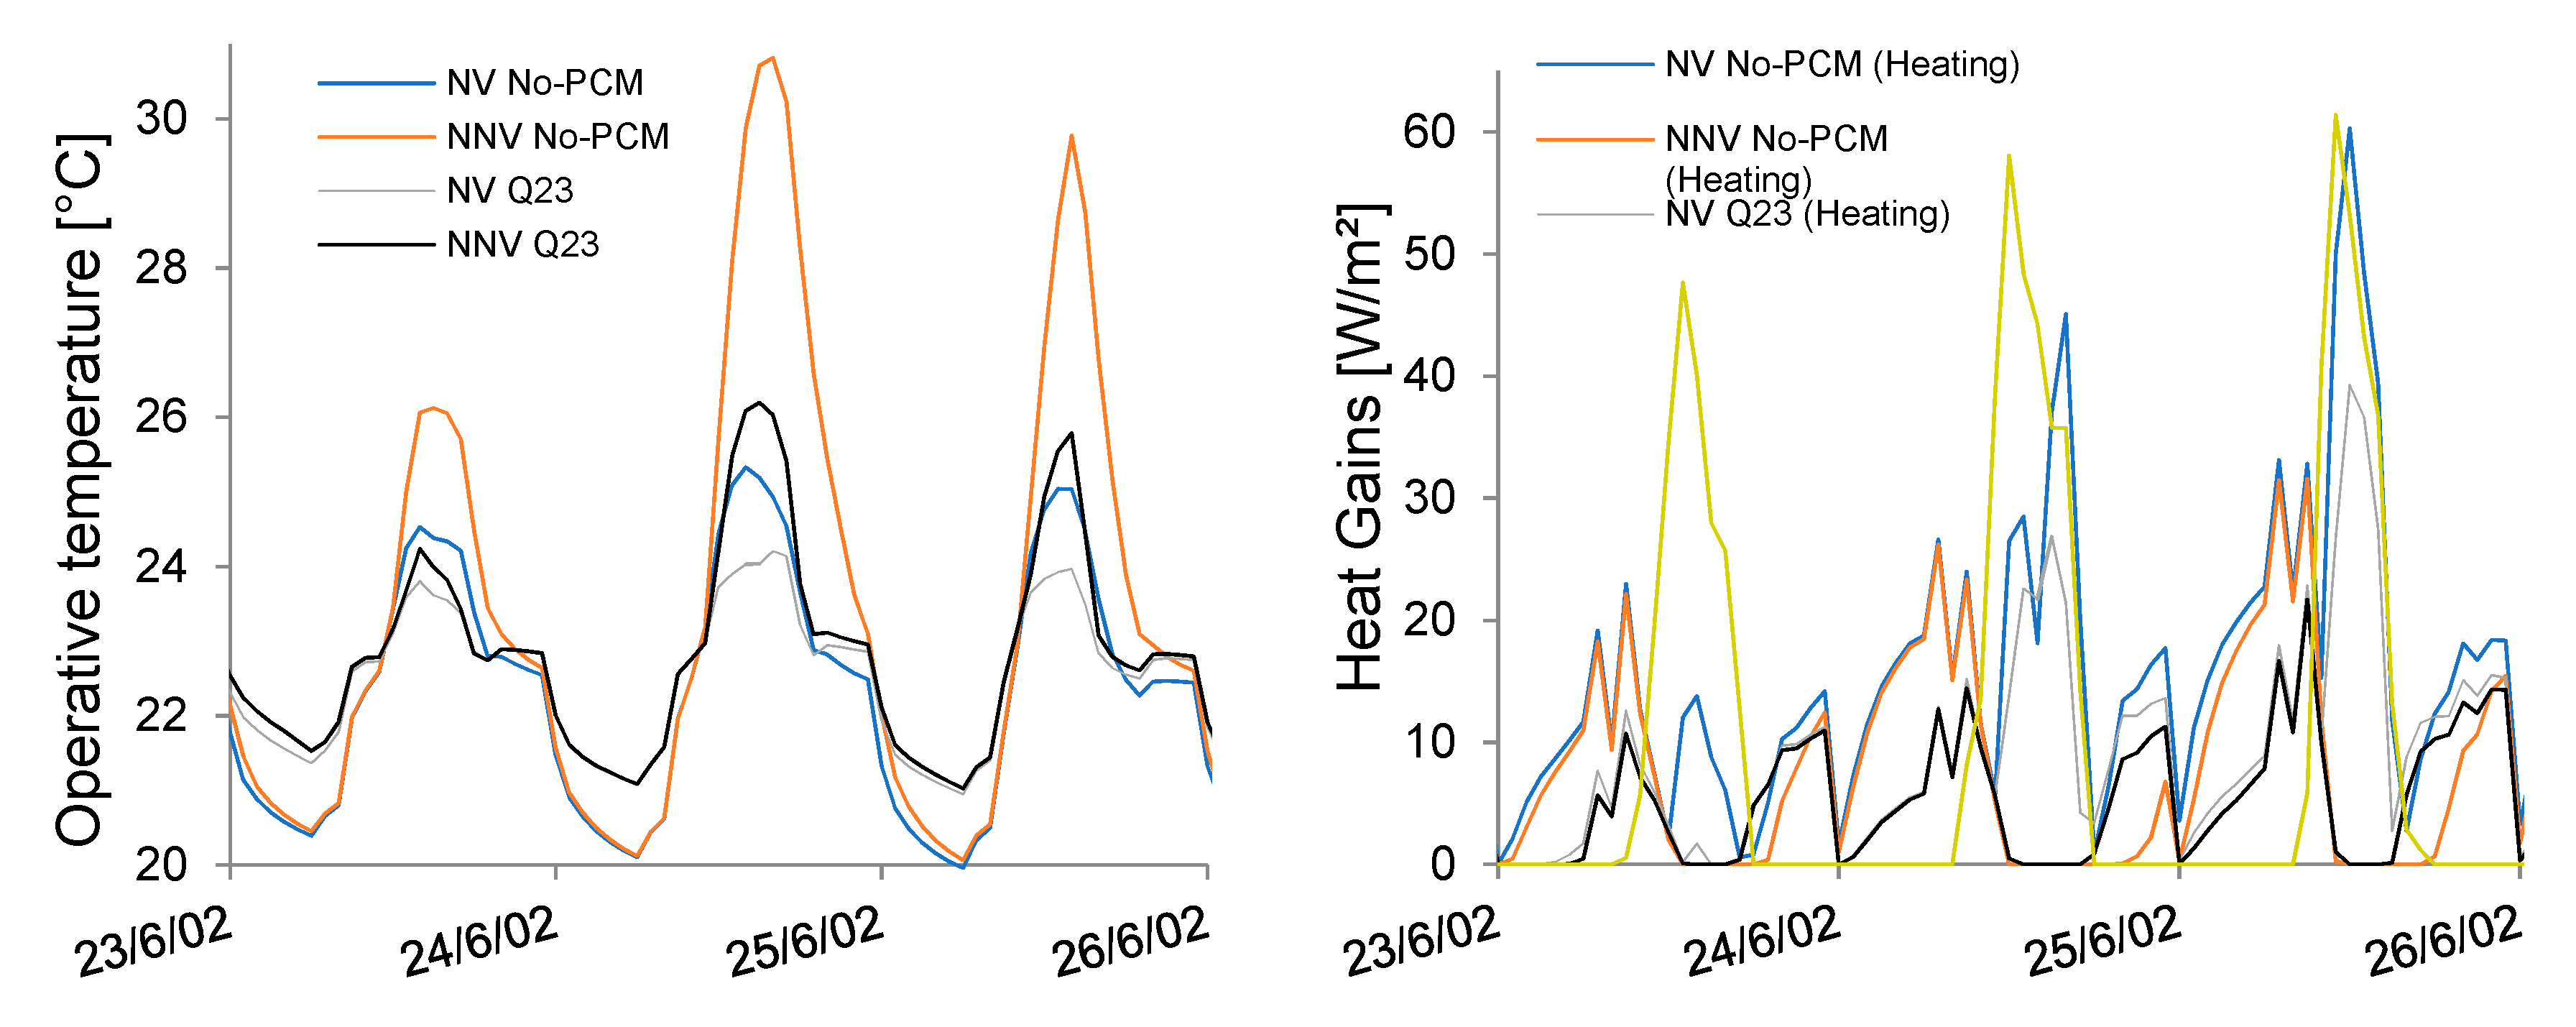
3.1.2. Comfort
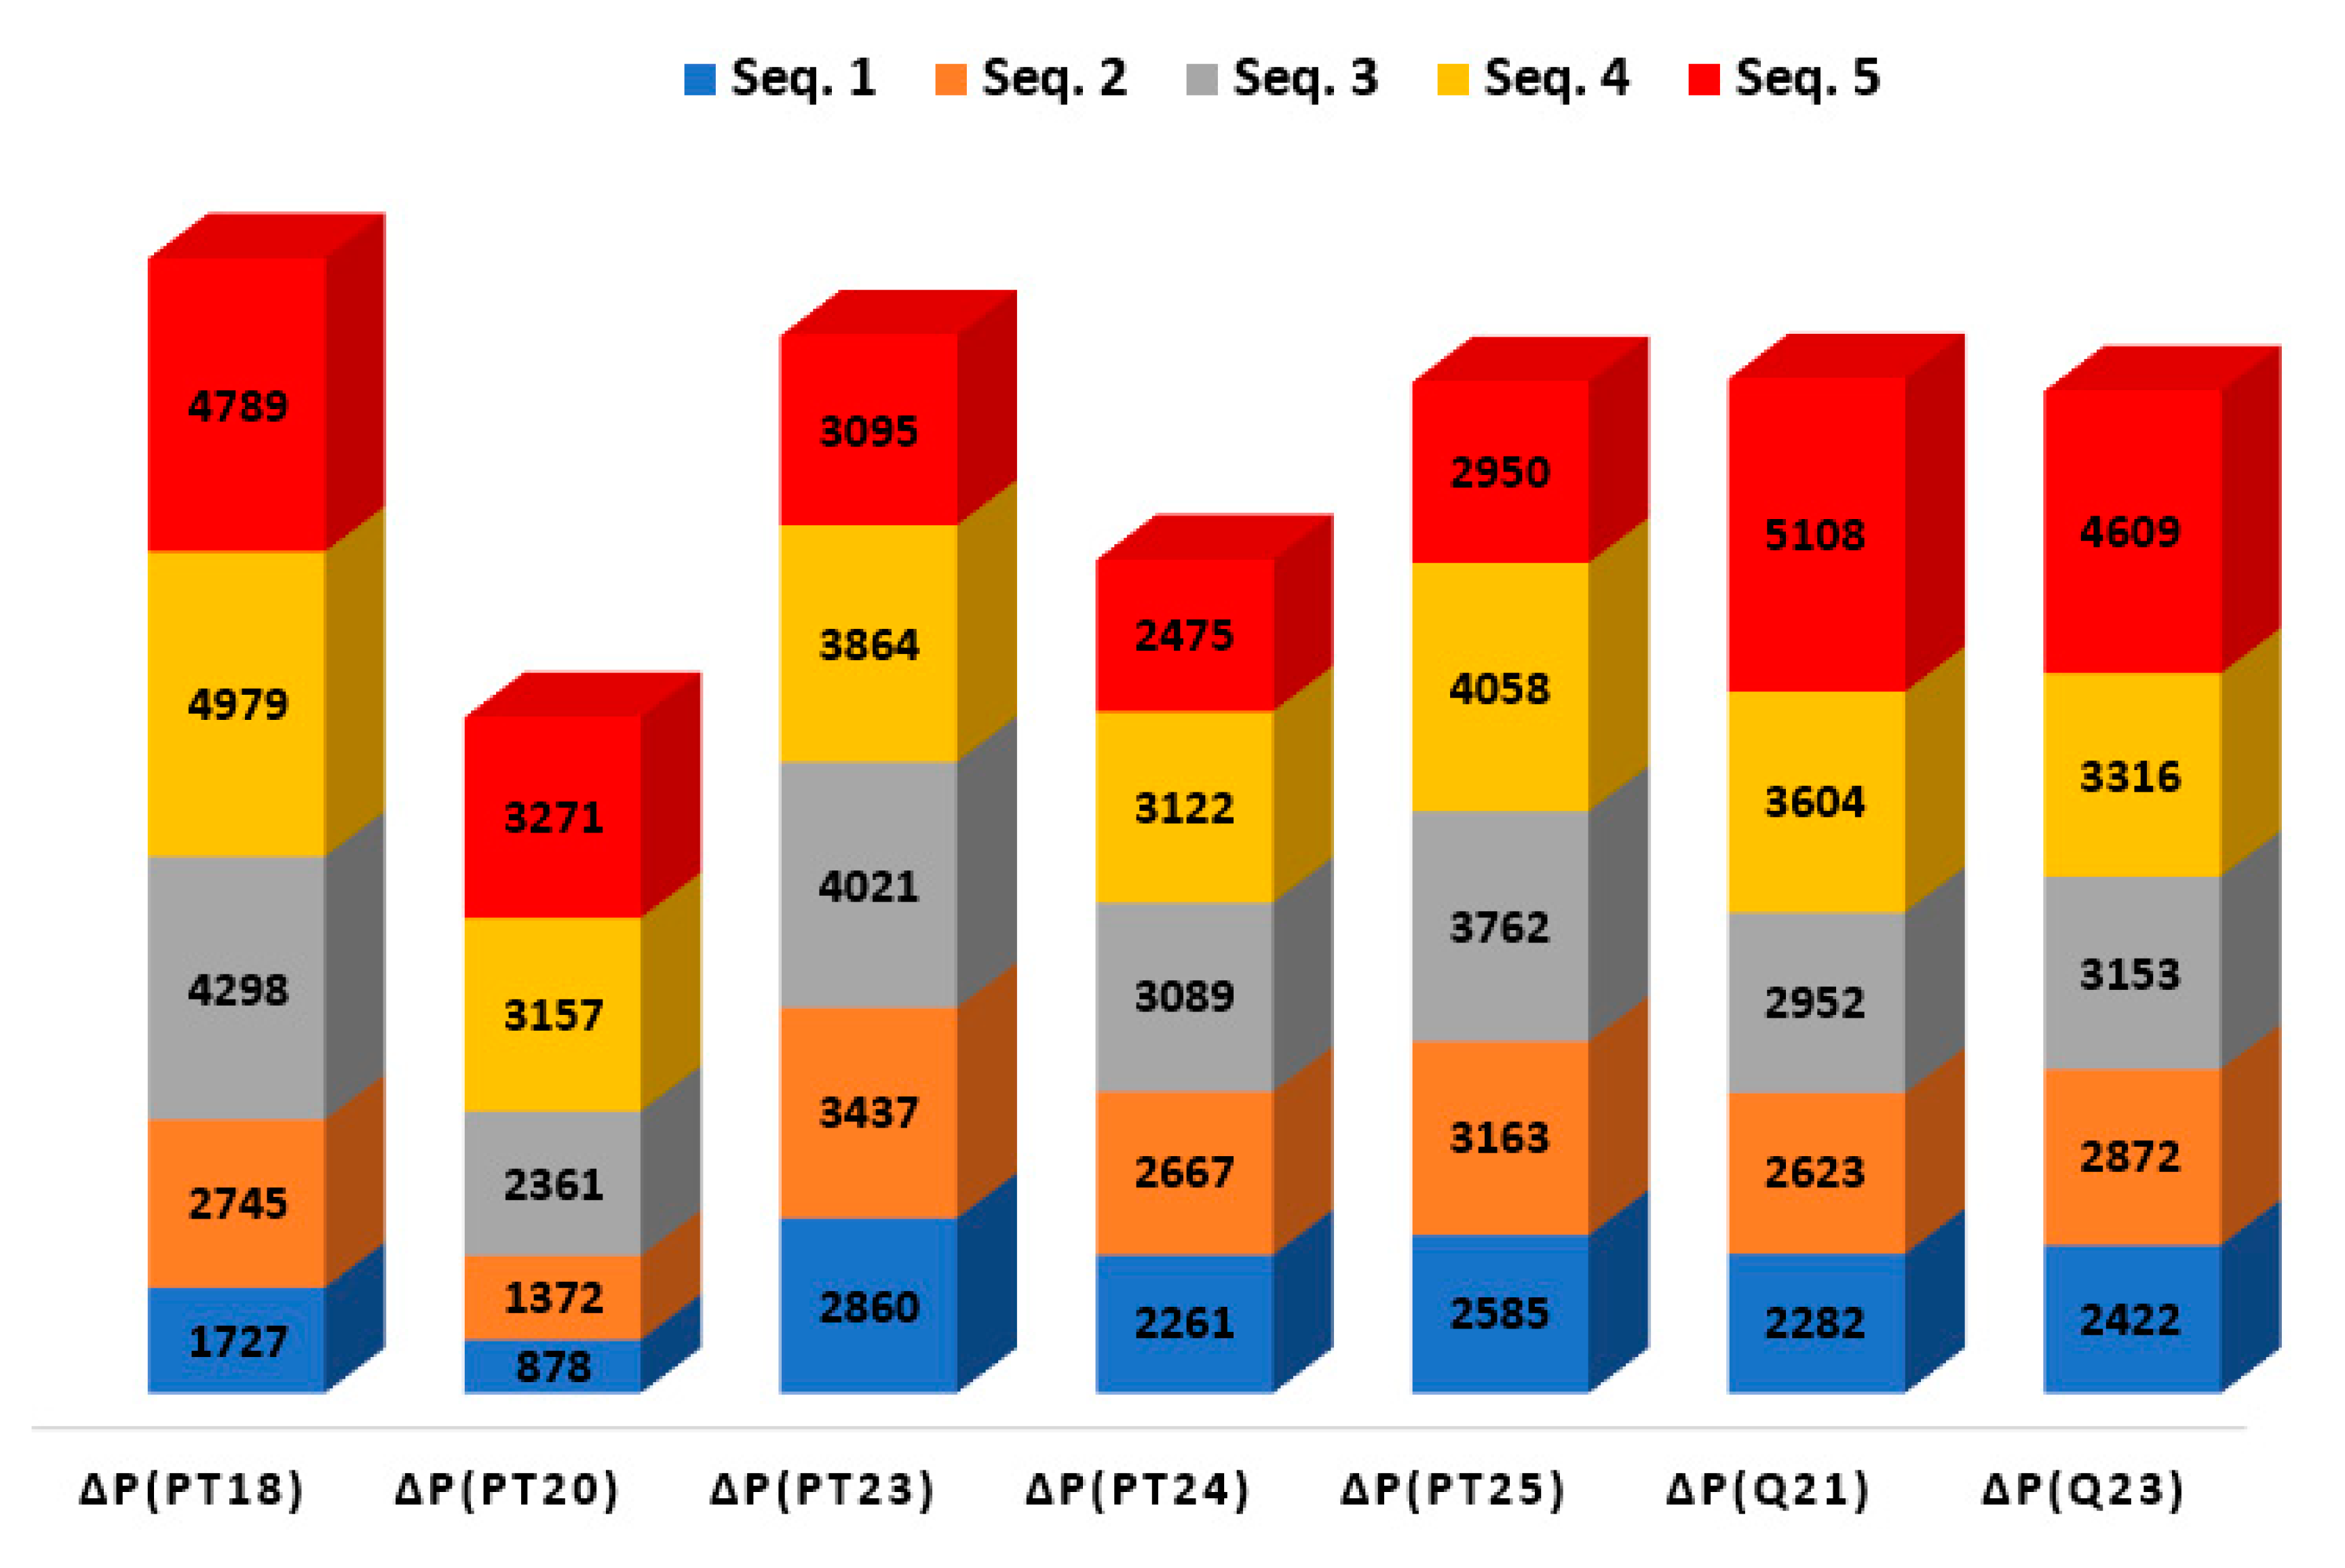
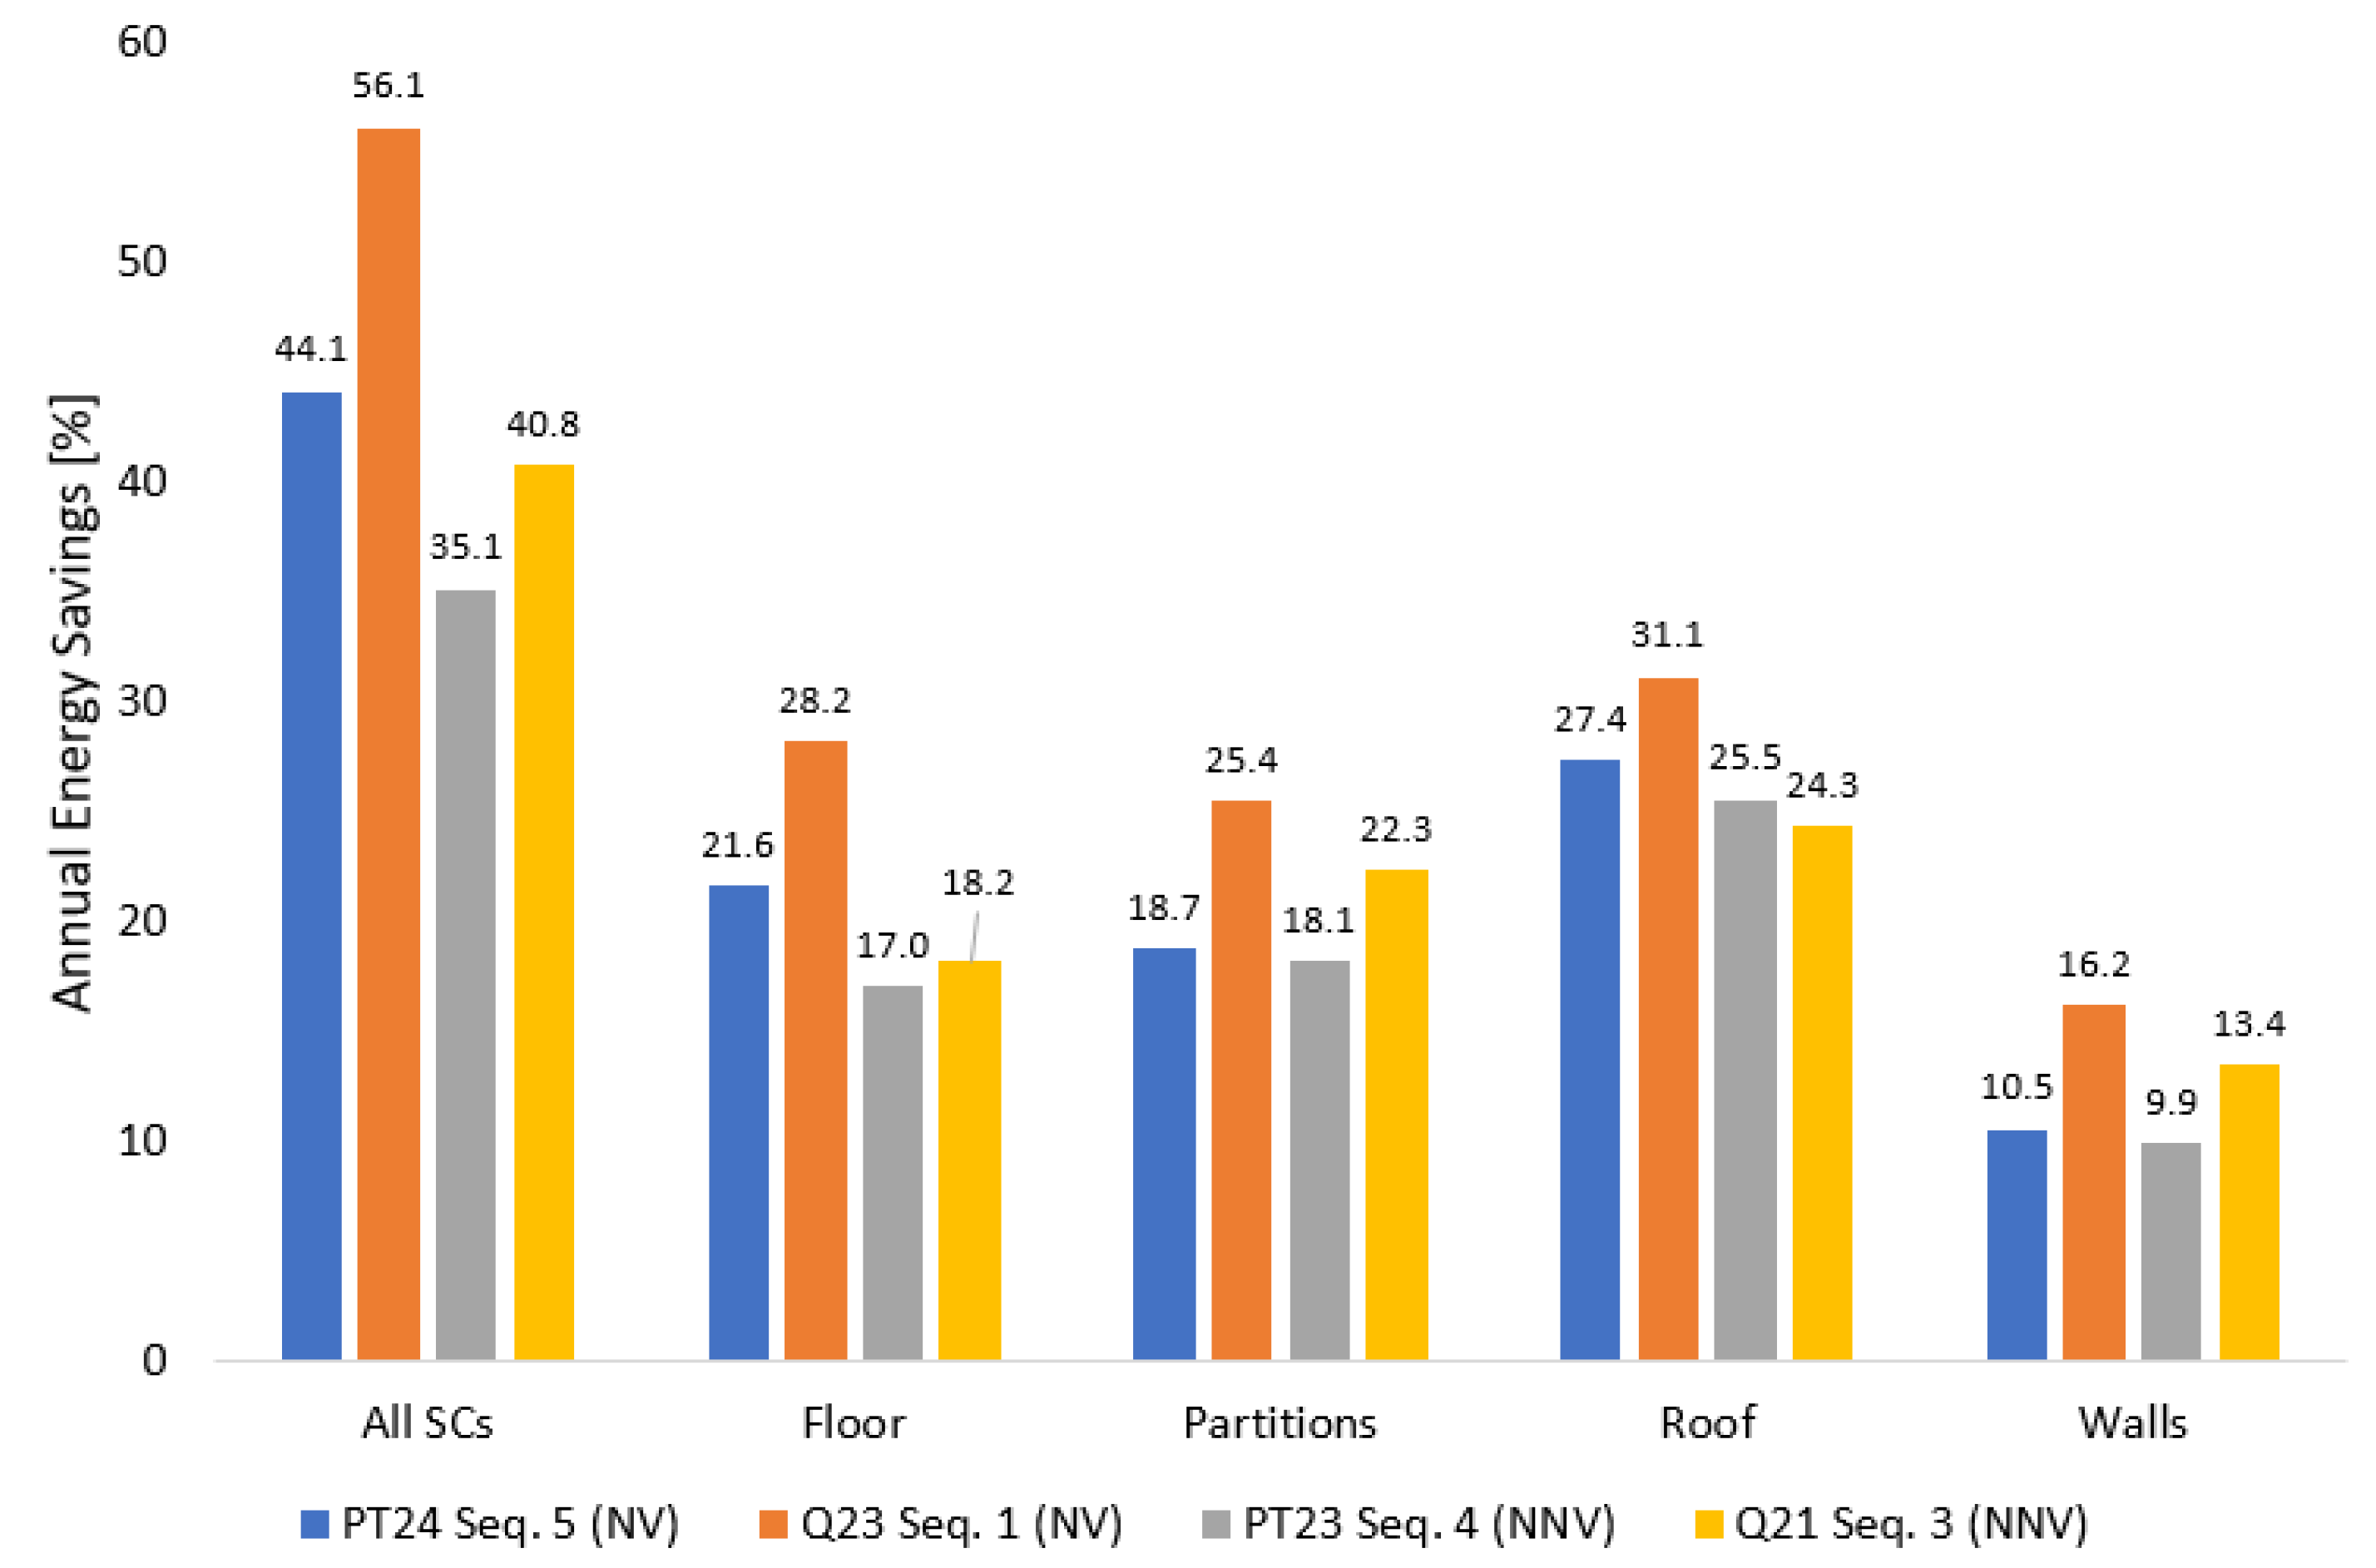
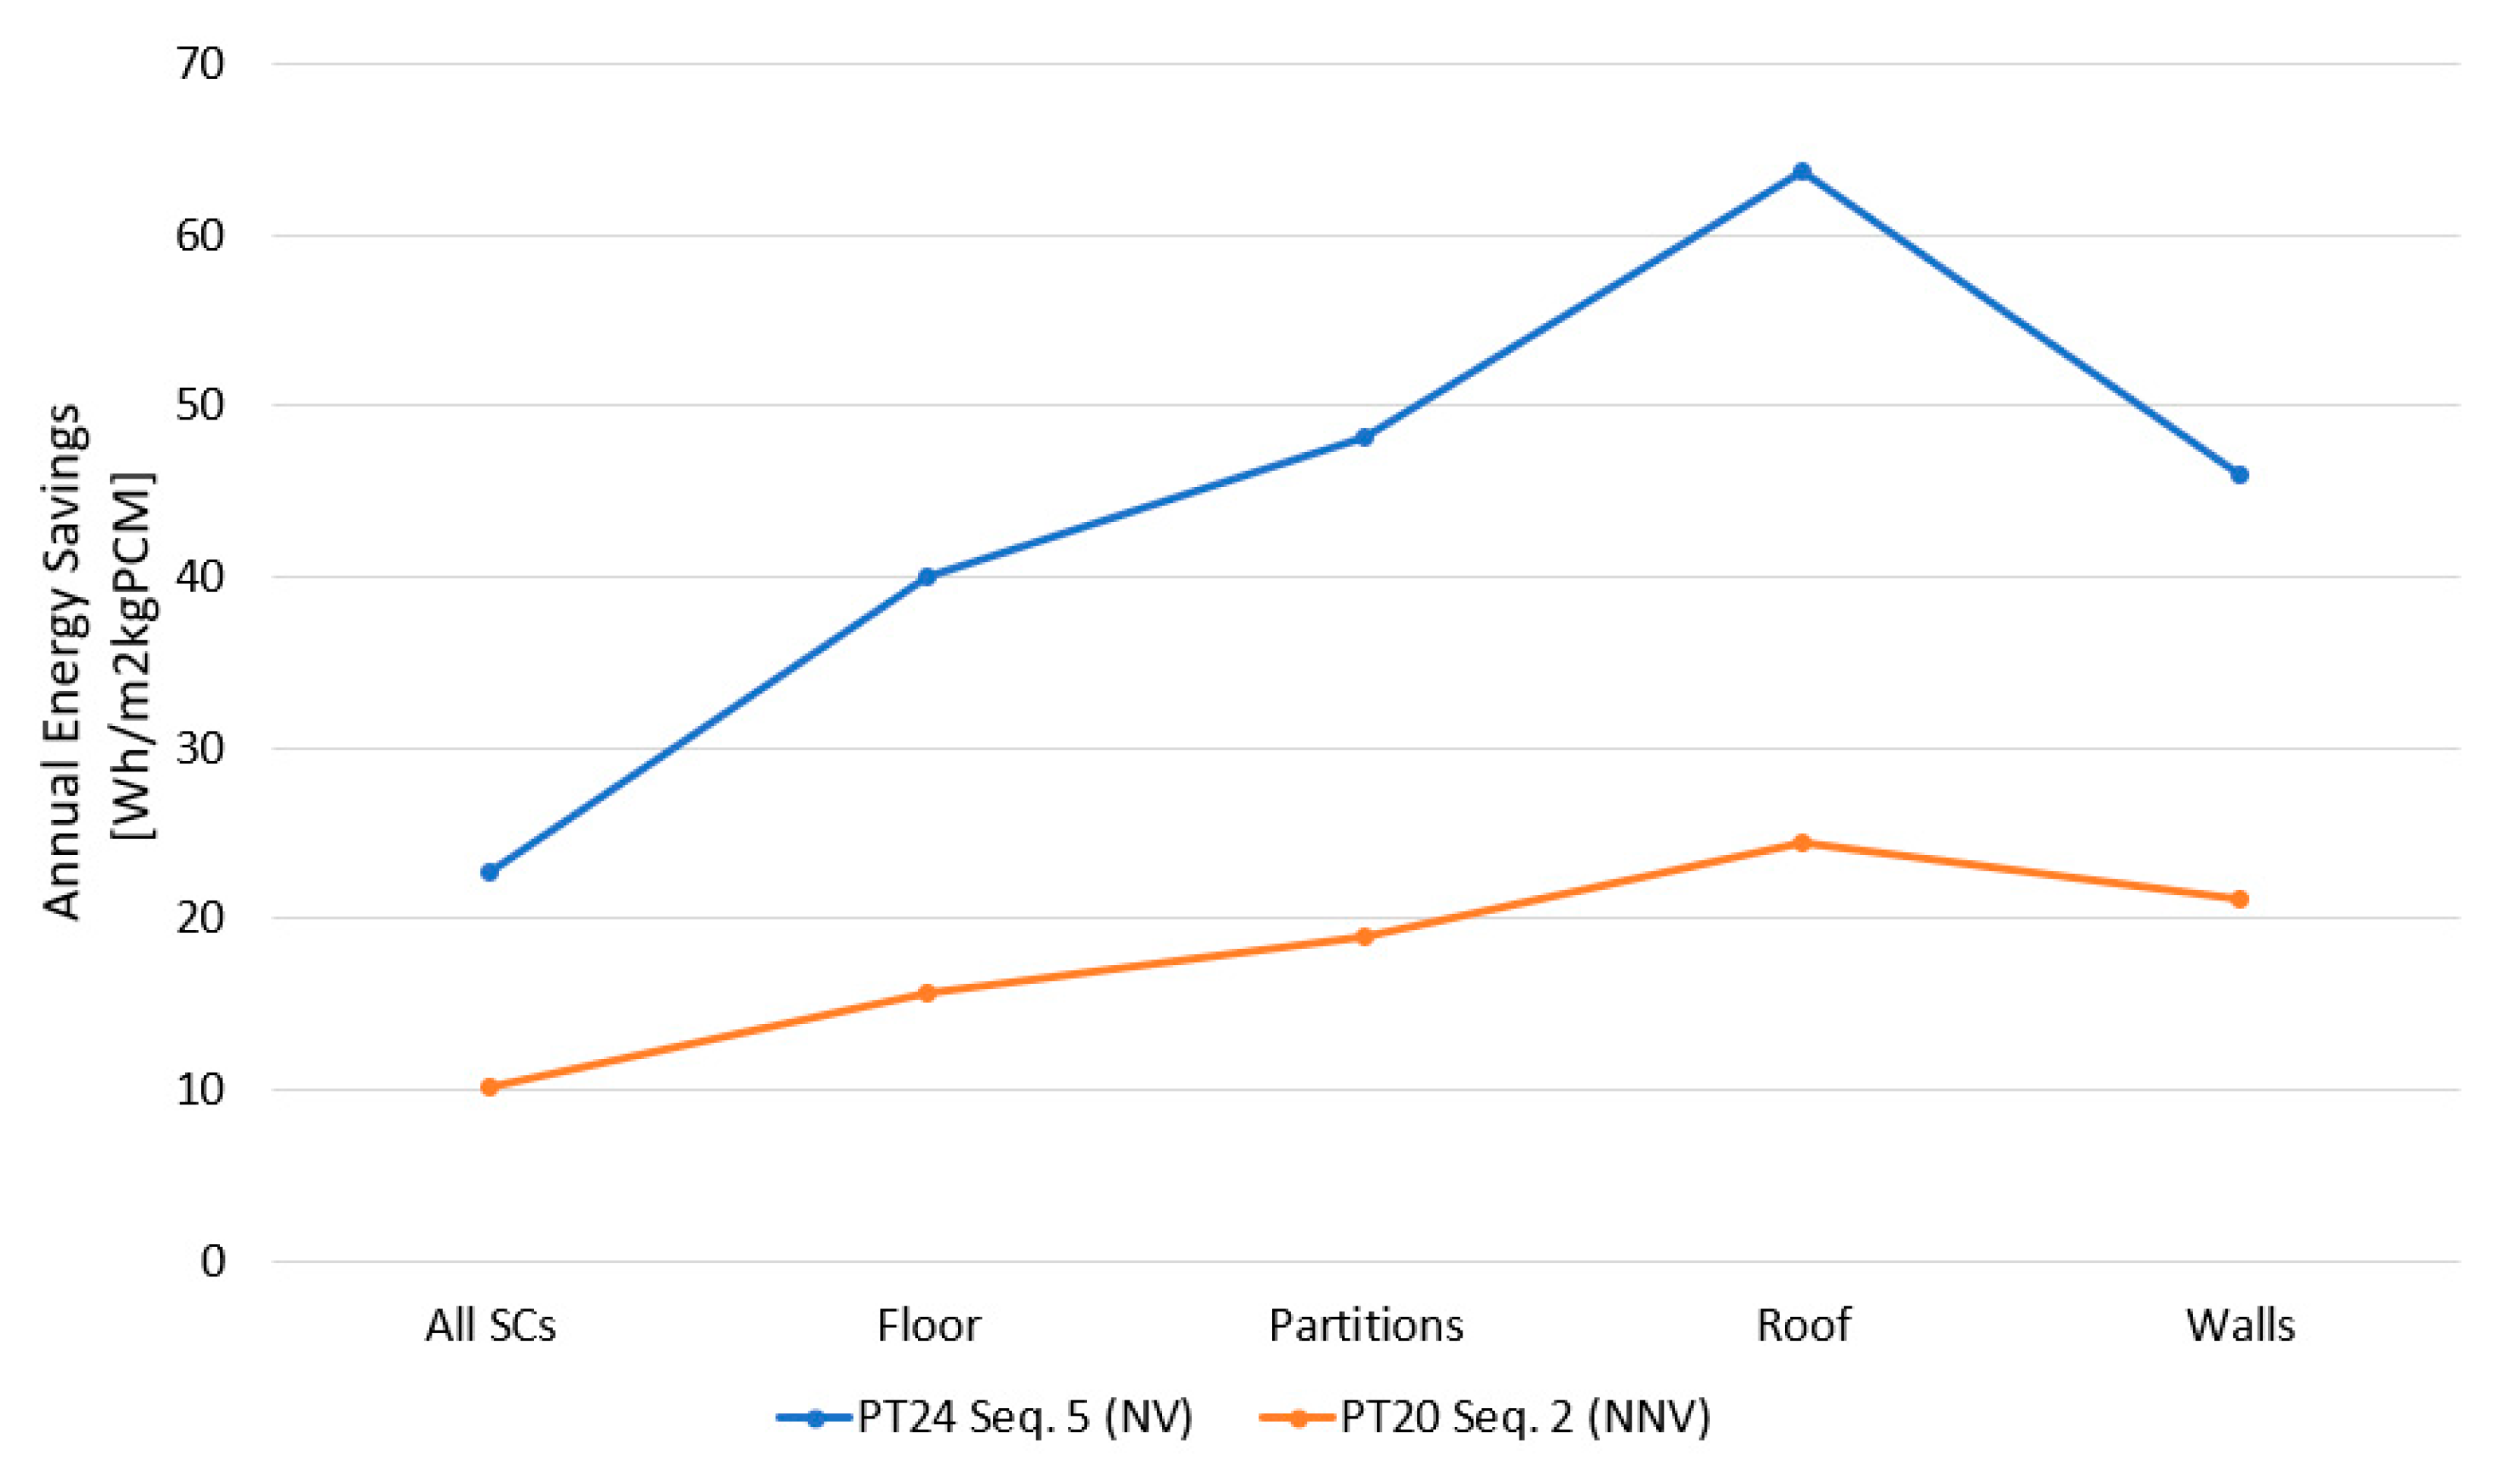
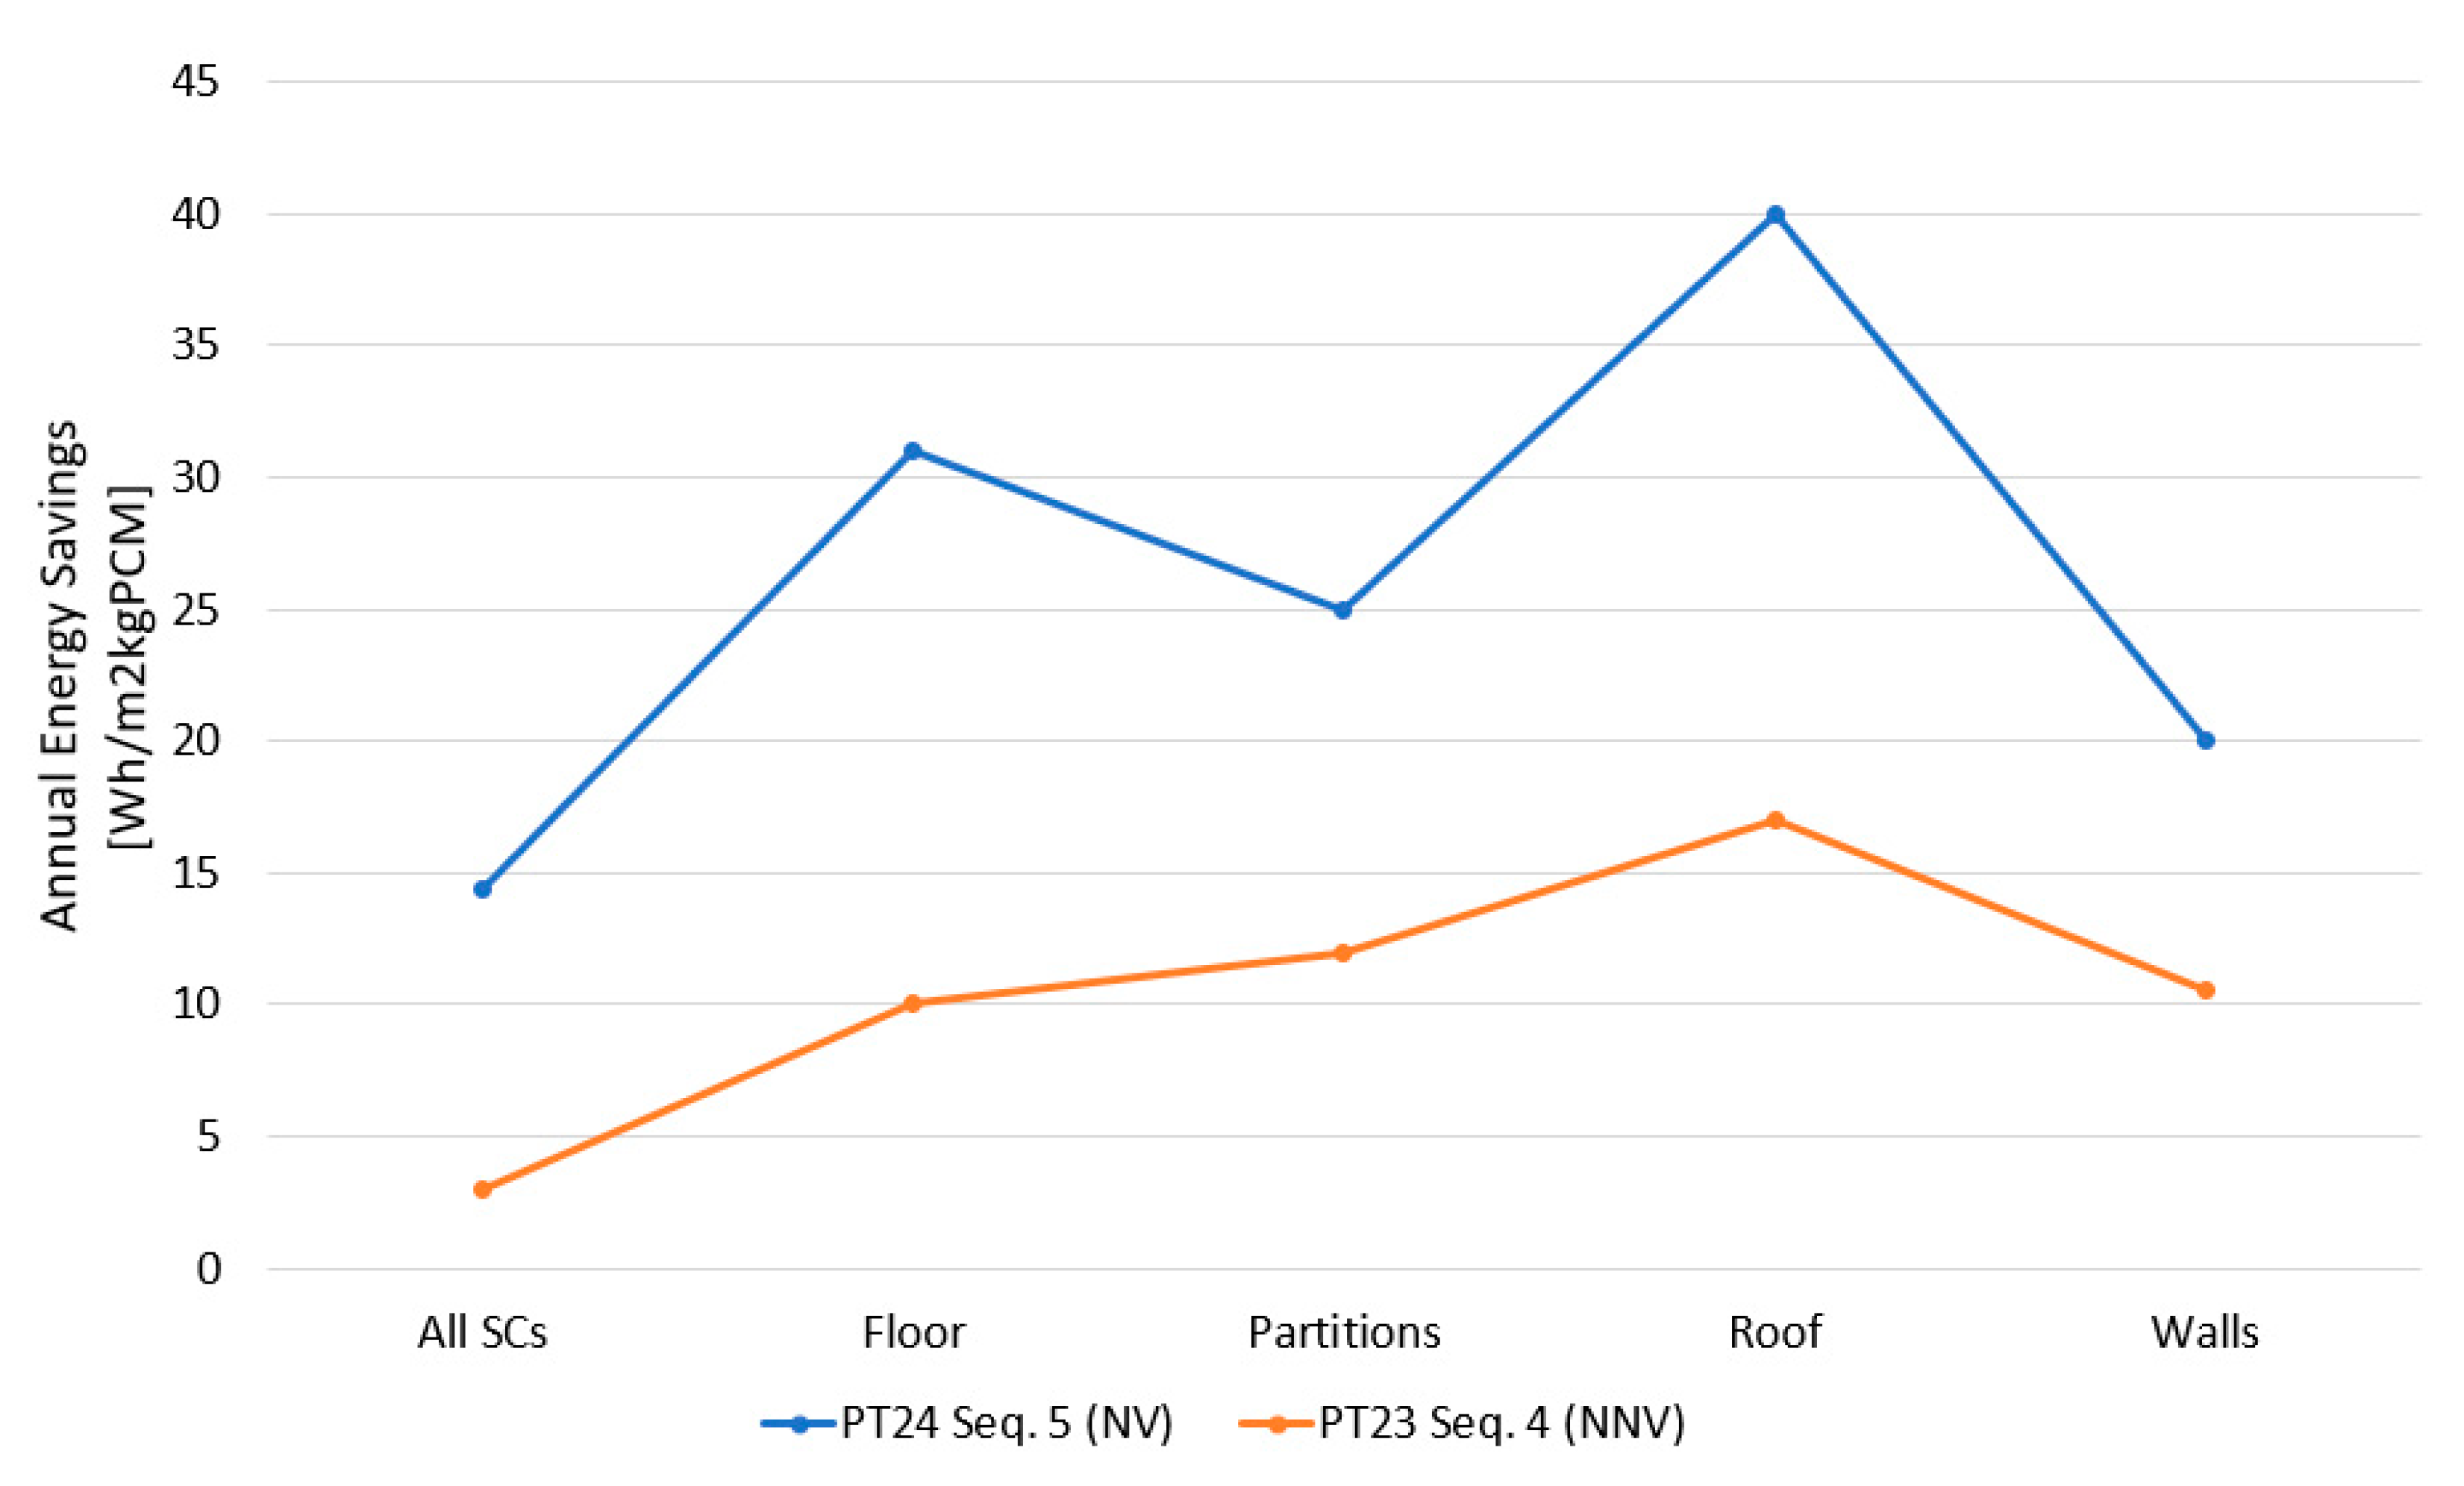
3.2. Marginal PCM Benefit
3.3. Building Performance
3.4. Effect of PCM in Different Building Locations
3.5. Error Analysis
4. Conclusions
5. Recommendations
Author Contributions
Funding
Conflicts of Interest
Appendix A

| Layer | Material | K (W/m·K) | CP (J/kg·K) | (kg/m3) | Thickness (m) | Solar Absorptance |
|---|---|---|---|---|---|---|
| 4 (ext) | Lightweight metallic cladding | 0.290 | 1000 | 1250 | 0.0055 | 0.4 |
| 5 | Extruded polystyrene—CO2 blowing | 0.034 | 1400 | 35 | 0.2000 | 0.6 |
| 3 | PCM if applicable | 0.003/0.0010 | ||||
| 6 (int) | Roofing felt | 0.190 | 837 | 960 | 0.0050 | 0.8 |
| Layer | Material | K (W/m·K) | CP (J/kg·K) | (kg/m3) | Thickness (m) | Solar Absorptance |
|---|---|---|---|---|---|---|
| 7 (ext) | Plywood (lightweight) | 0.150 | 2500 | 560 | 0.0180 | 0.78 |
| 8 | Expanded polystyrene—lightweight | 0.053 | 1400 | 12 | 0.0600 | 0.6 |
| 3 | PCM if applicable | 0.003/0.0010 | ||||
| 9 | Underlay, cork | 0.050 | 1500 | 200 | 0.0029 | 0.6 |
| 10 (int) | Timber flooring | 0.140 | 1200 | 650 | 0.0140 | 0.78 |
| Layer | Material | K (W/m·K) | CP (J/kg·K) | (kg/m3) | Thickness (m) | Solar Absorptance |
|---|---|---|---|---|---|---|
| 11 | Painted oak | 0.190 | 2390 | 700 | 0.0400 | 0.5 |
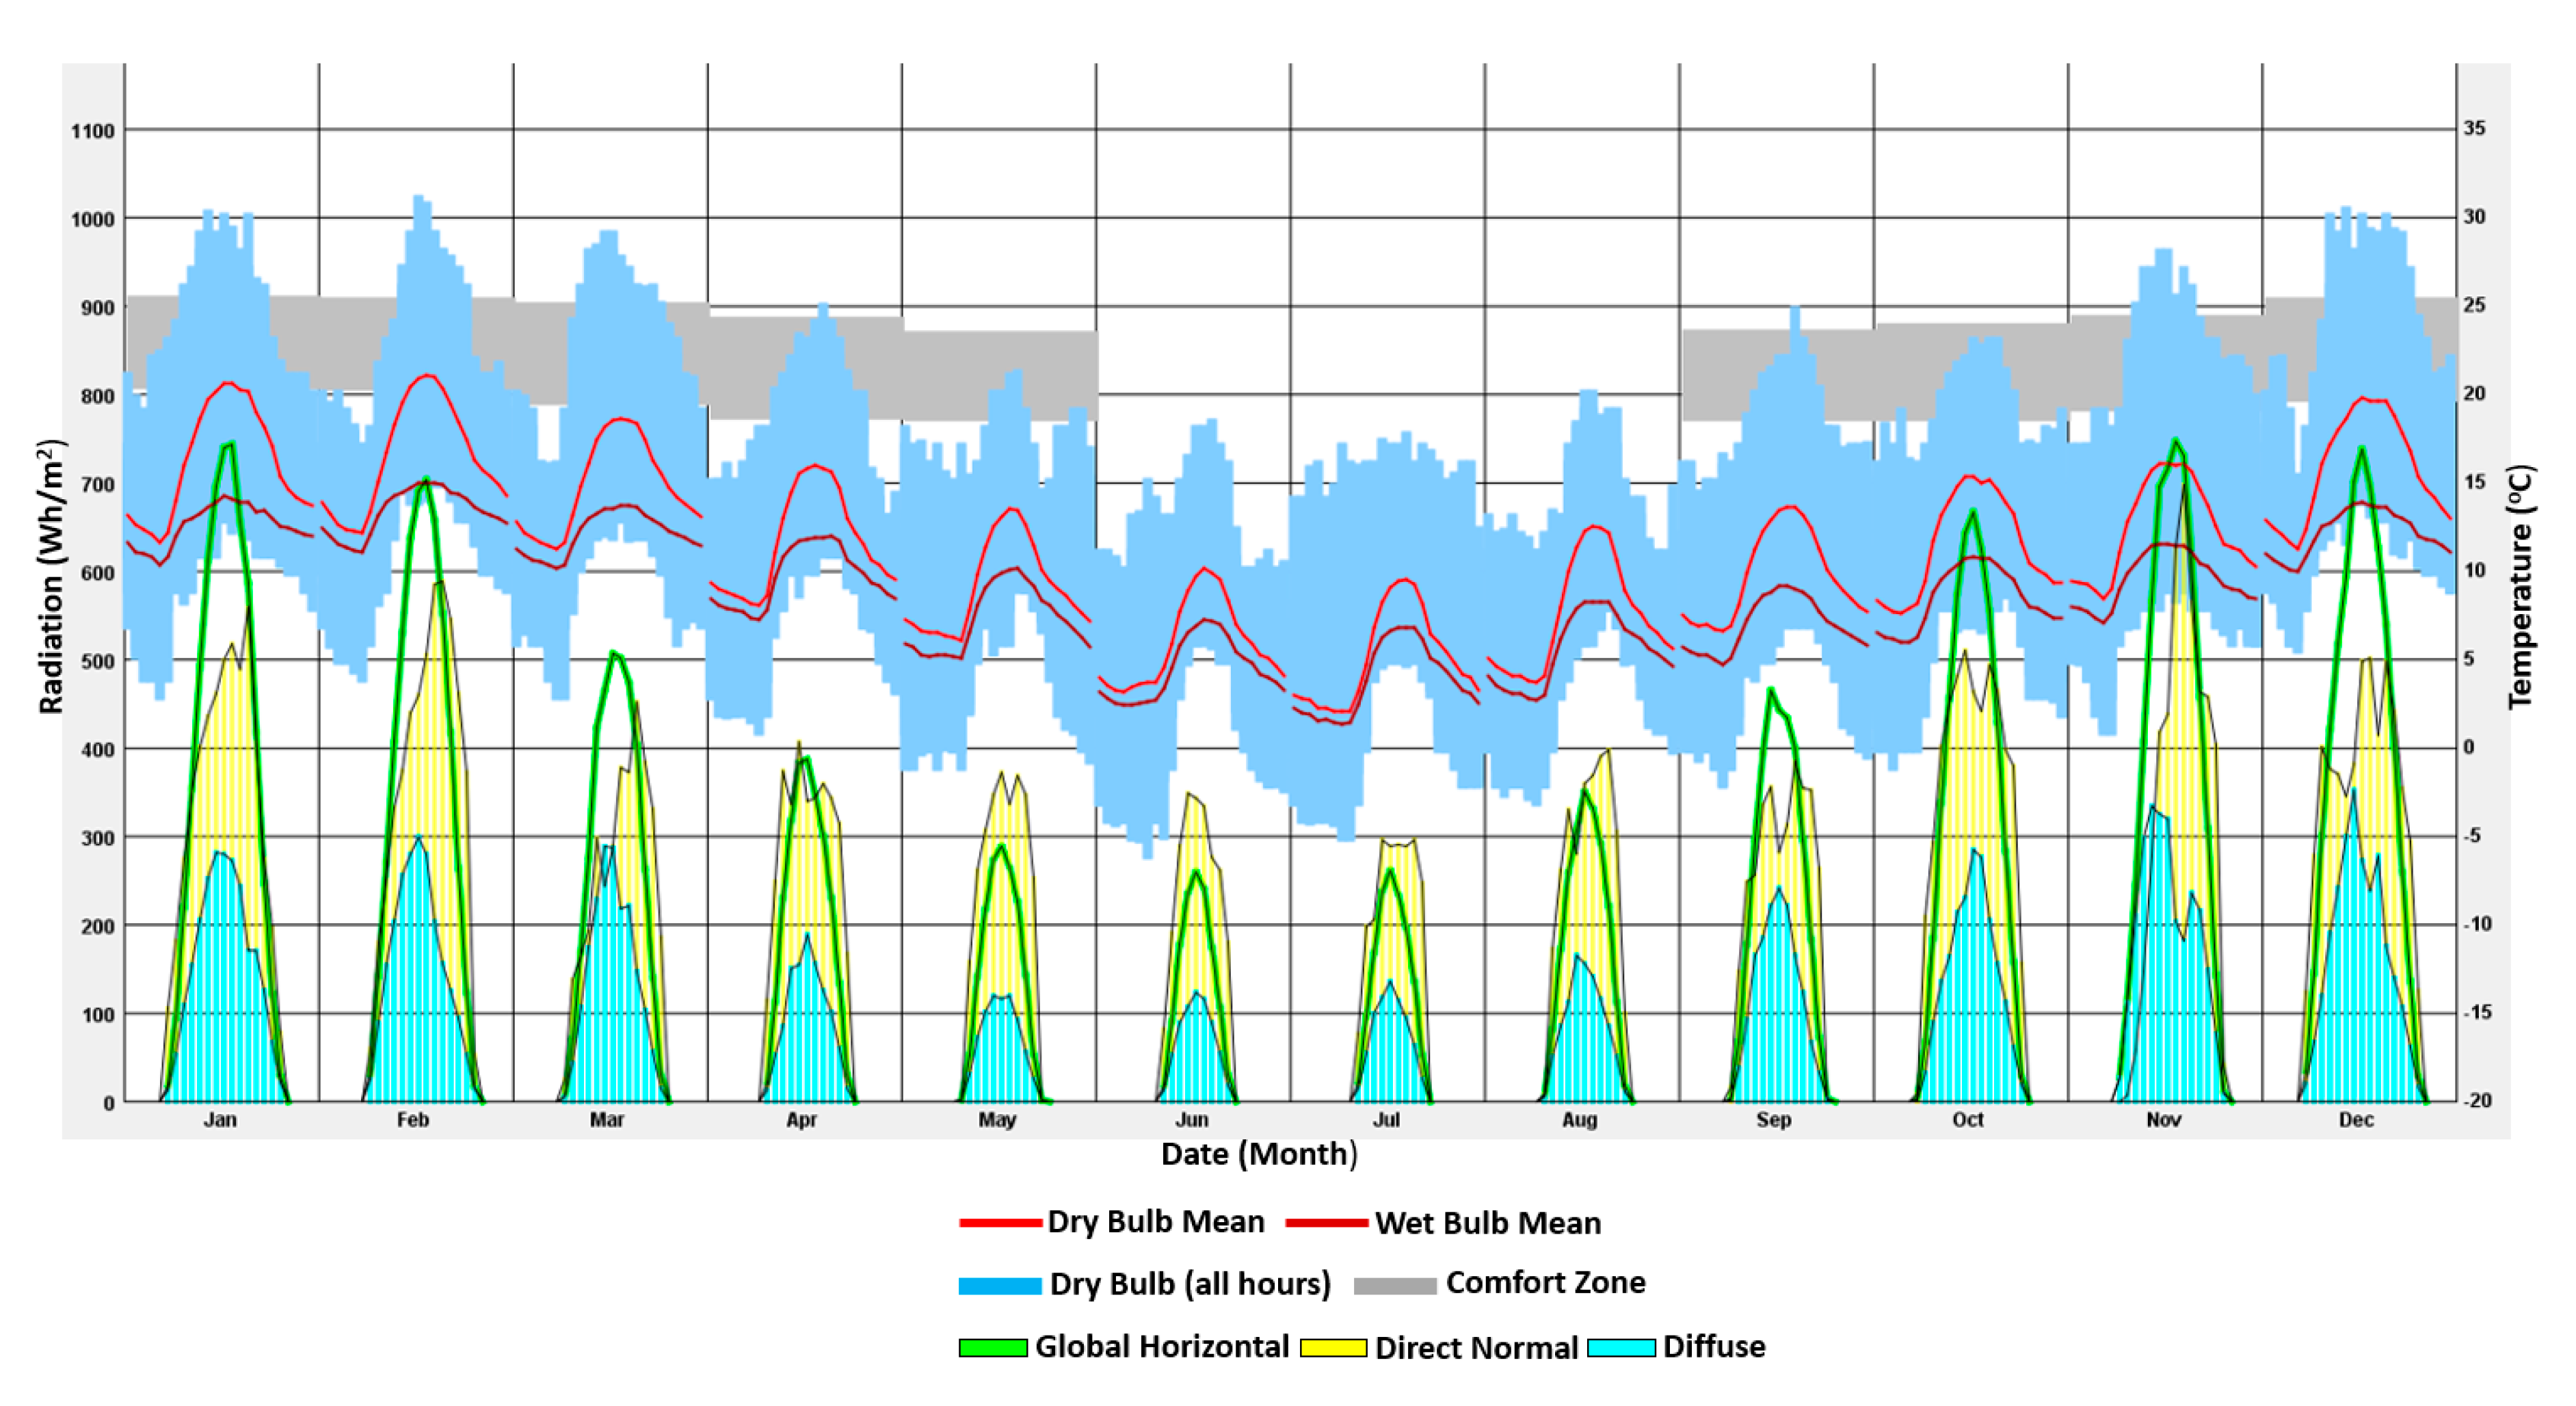
Weather Data

References
- Ikutegbe, C.A.; Farid, M.M. Application of phase change material foam composites in the built environment: A critical review. Renew. Sustain. Energy Rev. 2020, 131, 110008. [Google Scholar] [CrossRef]
- Pérez-Lombard, L.; Ortiz, J.; Pout, C. A review on buildings energy consumption information. Energy Build. 2008, 40, 394–398. [Google Scholar] [CrossRef]
- Leardini, P.; Iliffe, J.; Gronert, R. Building passive houses in subtropical climates? A lesson learnt from New Zealand. In Proceedings of the 17th International Passive House Conference, Frankfurt, Germany, 19–20 April 2013. [Google Scholar]
- Tait, M. Christchurch Earthquake: 100,000 Homes Damaged, 10,000 Unsavable. Available online: https://www.nzherald.co.nz/hawkes-bay-today/news/christchurch-earthquake-100000-homes-damaged-10000-unsavable/L7JS7GMGGFVRIVTV42FDUQ7SHU/ (accessed on 20 August 2019).
- Besen, P.; Leardini, P.; Boarin, P. Passive Houses in New Zealand: A comparison between predicted and real performance through post-occupancy evaluation. In Proceedings of the South Pacific Passive House Conference 2017, Christchurch, New Zealand, 3–5 May 2017. [Google Scholar]
- Farid, M.M.; Khudhair, A.M.; Razack, S.A.K.; Al-Hallaj, S. A review on phase change energy storage: Materials and applications. Energy Convers. Manag. 2004, 45, 1597–1615. [Google Scholar] [CrossRef]
- Cabeza, L.F.; Castell, A.; Barreneche, C.; De Gracia, A.; Fernández, A.I. Materials used as PCM in thermal energy storage in buildings: A review. Renew. Sustain. Energy Rev. 2011, 15, 1675–1695. [Google Scholar] [CrossRef]
- Zhou, D.; Zhao, C.Y.; Tian, Y. Review on thermal energy storage with phase change materials (PCMs) in building applications. Appl. Energy 2012, 92, 593–605. [Google Scholar] [CrossRef]
- Hadorn, J.-C. Thermal Energy Storage for Solar and Low Energy Buildings—State of the Art; Servei de Publicacions de la Universitat de Lleida: Lleida, Spain, 2005. [Google Scholar]
- Zalba, B.; Marín, J.M.; Cabeza, L.F.; Mehling, H. Review on thermal energy storage with phase change: Materials, heat transfer analysis and applications. Appl. Therm. Eng. 2003, 23, 251–283. [Google Scholar] [CrossRef]
- He, B.; Martin, V.; Setterwall, F. Phase transition temperature ranges and storage density of paraffin wax phase change materials. Energy 2004, 29, 1785–1804. [Google Scholar] [CrossRef]
- Sharma, R.K.; Ganesan, P.; Tyagi, V.V.; Metselaar, H.S.C.; Sandaran, S.C. Developments in organic solid–liquid phase change materials and their applications in thermal energy storage. Energy Convers. Manag. 2015, 95, 193–228. [Google Scholar] [CrossRef]
- Kuznik, F.; David, D.; Johannes, K.; Roux, J.J. A review on phase change materials integrated in building walls. Renew. Sustain. Energy Rev. 2011, 15, 379–391. [Google Scholar] [CrossRef]
- Rathod, M.K.; Banerjee, J. Thermal stability of phase change materials used in latent heat energy storage systems: A review. Renew. Sustain. Energy Rev. 2013, 18, 246–258. [Google Scholar] [CrossRef]
- Koschenz, M.; Lehmann, B. Development of a thermally activated ceiling panel with PCM for application in lightweight and retrofitted buildings. Energy Build. 2004, 36, 567–578. [Google Scholar] [CrossRef]
- Barzin, R.; Chen, J.J.J.; Young, B.R.; Farid, M.M. Application of PCM underfloor heating in combination with PCM wallboards for space heating using price based control system. Appl. Energy 2015, 148, 39–48. [Google Scholar] [CrossRef]
- Gholamibozanjani, G.; Farid, M. A comparison between passive and active PCM systems applied to buildings. Renew. Energy 2020, 162, 112–123. [Google Scholar] [CrossRef]
- Gholamibozanjani, G.; Farid, M. Application of an active PCM storage system into a building for heating/cooling load reduction. Energy 2020, 210, 118572. [Google Scholar] [CrossRef]
- Kuznik, F.; Virgone, J. Experimental assessment of a phase change material for wall building use. Appl. Energy 2009, 86, 2038–2046. [Google Scholar] [CrossRef]
- Errebai, F.B.; Chikh, S.; Derradji, L. Experimental and numerical investigation for improving the thermal performance of a microencapsulated phase change material plasterboard. Energy Convers. Manag. 2018, 174, 309–321. [Google Scholar] [CrossRef]
- Kuznik, F.; Virgone, J.; Roux, J.J. Energetic efficiency of room wall containing PCM wallboard: A full-scale experimental investigation. Energy Build. 2008, 40, 148–156. [Google Scholar] [CrossRef]
- Omrany, H.; GhaffarianHoseini, A.; GhaffarianHoseini, A.; Raahemifar, K.; Tookey, J. Application of passive wall systems for improving the energy effciency in buildings: A comprehensive review. Renew. Sustain. Energy Rev. 2016, 62, 1252–1269. [Google Scholar] [CrossRef]
- Zhu, N.; Ma, Z.; Wang, S. Dynamic characteristics and energy performance of buildings using phase change materials: A review. Energy Convers. Manag. 2009, 50, 3169–3181. [Google Scholar] [CrossRef]
- Diarce, G.; Urresti, A.; García-Romero, A.; Delgado, A.; Erkoreka, A.; Escudero, C.; Campus-Celador, Á. Ventilated active façades with PCM. Appl. Energy 2013, 109, 530–537. [Google Scholar] [CrossRef]
- Diarce, G.; Campos-Celador, Á.; Martin, K.; Urresti, A.; García-Romero, A.; Sala, J.M. A comparative study of the CFD modeling of a ventilated active façade including phase change materials. Appl. Energy 2014, 126, 307–317. [Google Scholar] [CrossRef]
- Mandilaras, I.D.; Kontogeorgos, D.A.; Founti, M.A. A hybrid methodology for the determination of the effective heat capacity of PCM enhanced building components. Renew. Energy 2015, 76, 790–804. [Google Scholar] [CrossRef]
- Vautherot, M.; Maréchal, F.; Farid, M.M. Analysis of energy requirements versus comfort levels for the integration of phase change materials in buildings. J Build. Eng. 2015, 1, 53–62. [Google Scholar] [CrossRef]
- DesignBuilder. DesignBuilder EnergyPlus Simulation Documentation for DesignBuilder; DesignBuilder: Stroud, UK, 2011; p. 822. [Google Scholar]
- Cook, P.; Sproul, A. Towards low-energy retail warehouse building. Archit. Sci. Rev. 2011, 54, 206–214. [Google Scholar] [CrossRef]
- ASHRAE. Thermal Environmental Conditions for Human Occupancy; ANSI/ASHRAE 55-2010; ASHRAE: Washinton, DC, USA, 2010. [Google Scholar]
- DesignBuilder. DesignBuilder and Energy Plus Simulation Documentation for DesignBuilder; DesignBuilder: Stroud, UK, 2018; p. 982. [Google Scholar]
- Marín, J.M.; Zalba, B.; Cabeza, L.F.; Mehling, H. Determination of enthalpy–temperature curves of phase change materials with the temperature-history method: Improvement to temperature dependent properties. Meas. Sci. Technol. 2003, 14, 184. [Google Scholar] [CrossRef]
- Soares, N.; Gaspar, A.R.; Santos, P.; Costa, J.J. Multi-dimensional optimization of the incorporation of PCM-drywalls in lightweight steel-framed residential buildings in different climates. Energy Build. 2014, 70, 411–421. [Google Scholar] [CrossRef]
- Konuklu, Y.; Paksoy, H.Ö. Phase change material sandwich panels for managing solar gain in buildings. J. Sol. Energy Eng. 2009, 131, 41012. [Google Scholar] [CrossRef]
- American Society of Heating Refrigerating and Air-Conditioning Engineers, Inc. ASHRAE Handbook—Heating, Ventilating, and Air-Conditioning Applications, SI ed.; American Society of Heating Refrigerating and Air-Conditioning Engineers, Inc.: Washington, DC, USA, 2015. [Google Scholar]
- Saffari, M.; De Gracia, A.; Ushak, S.; Cabeza, L.F. Economic impact of integrating PCM as passive system in buildings using Fanger comfort model. Energy Build. 2016, 112, 159–172. [Google Scholar] [CrossRef]


| Building Zone | Occupancy | Mechanical Ventilation | Natural Ventilation | Heating |
|---|---|---|---|---|
| Bedroom A | Bedroom schedule 1 | Bedroom schedule 1 | Standard schedule | SH |
| Lounge A | Lounge schedule | Lounge schedule | Standard schedule | SH |
| Kitchen A | Kitchen schedule | Kitchen schedule | Standard schedule | SH |
| Circulation Area A | Circulation schedule | Circulation area schedule | Standard schedule | SH |
| Bathroom A | Bathroom schedule | Bathroom schedule | Standard schedule | BH |
| Storage Room A | No occupancy | No mechanical ventilation | No natural ventilation | NH |
| Bedroom B | Bedroom schedule 2 | Bedroom schedule 2 | Standard schedule | SH |
| Kitchen B | Kitchen schedule | Kitchen schedule | Standard schedule | SH |
| Circulation Area B | Circulation schedule | Circulation area schedule | Standard schedule | SH |
| Bathroom B | Bathroom schedule | Bathroom schedule | Standard schedule | BH |
| Storage room B | No occupancy | No mechanical ventilation | No natural ventilation | NH |
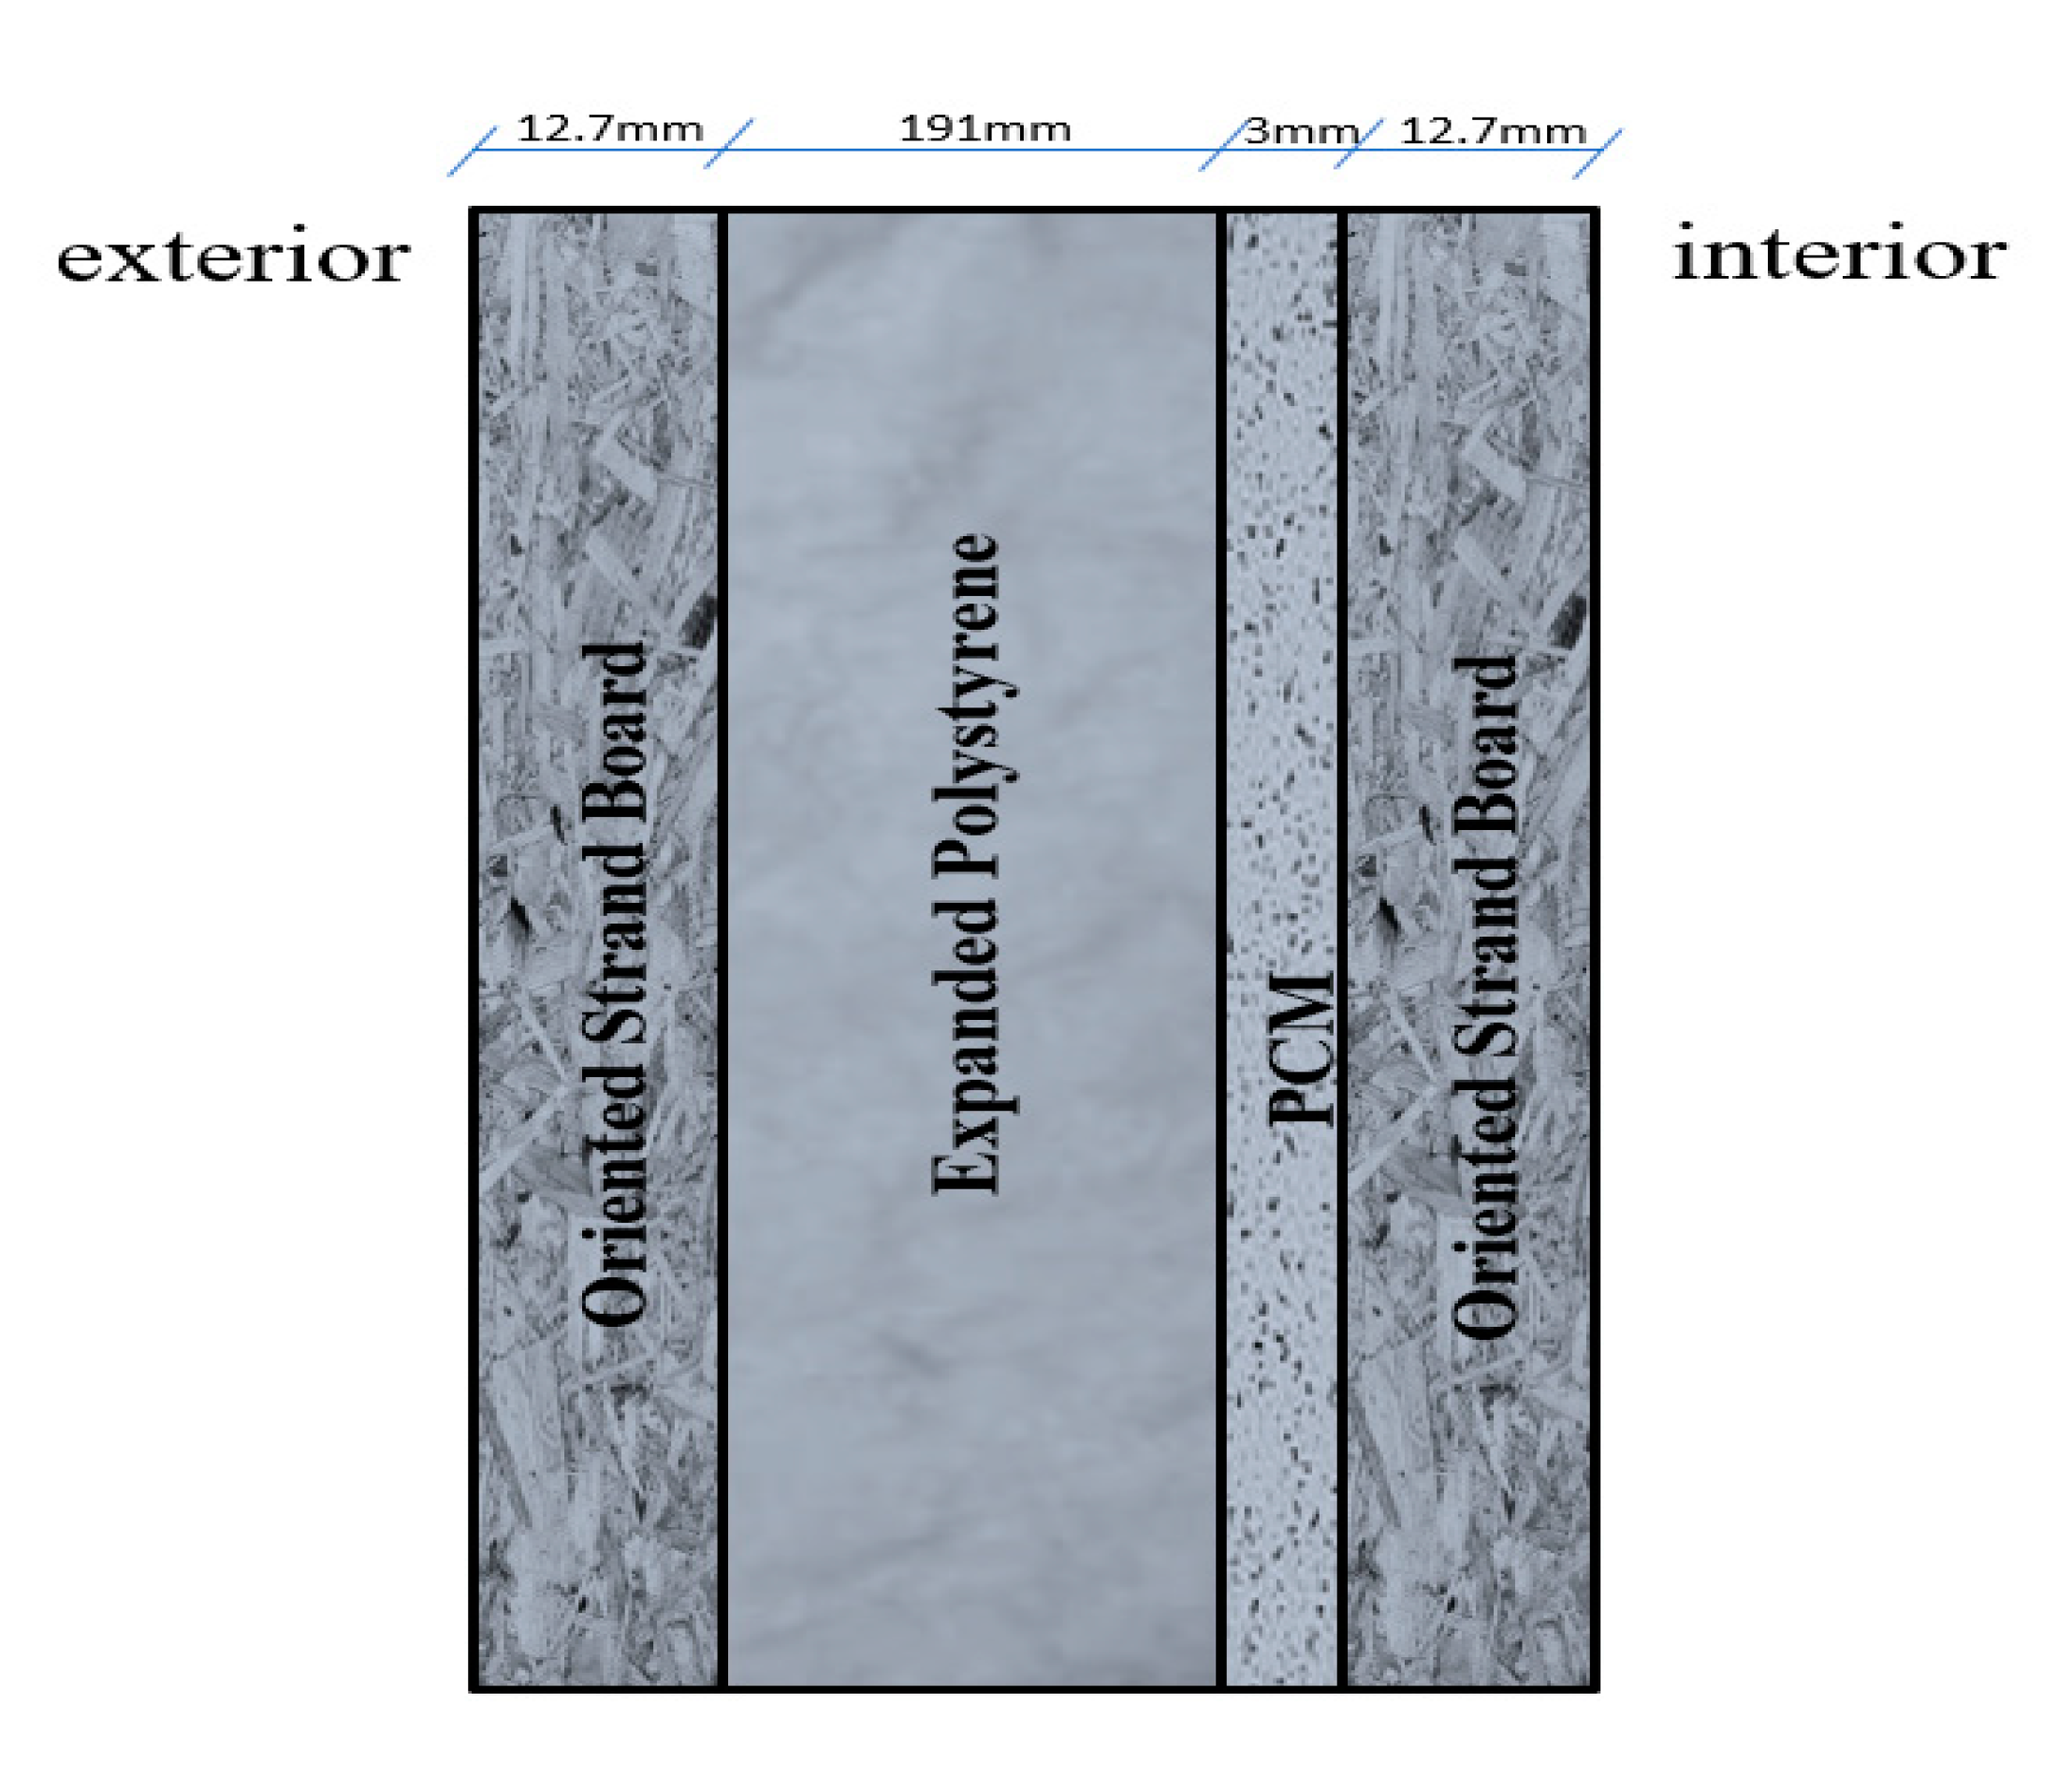
| Layer | Material | K (W/m·K) | CP (J/kg·K) | (kg/m3) | Thickness (m) | Solar Absorptance |
|---|---|---|---|---|---|---|
| 1 (exterior) | Oriented strand board | 0.105 | 1880 | 650 | 0.0127 | 0.7 |
| 2 | Expanded polystyrene | 0.040 | 1400 | 15 | 0.1910 | 0.6 |
| 3 | PCMs if applicable | 0.003/0.0010 | ||||
| 1 (interior) | Oriented strand board | 0.105 | 1880 | 650 | 0.0127 | 0.7 |
| Layer | Material | K (W/m·K) | CP (J/kg·K) | (kg/m3) | Thickness (m) | Solar Absorptance |
|---|---|---|---|---|---|---|
| 1 (exterior) | Oriented strand board | 0.105 | 1880 | 650 | 0.0127 | 0.7 |
| 3 | PCMs if applicable | 0.003/0.0010 | ||||
| 2 | Expanded polystyrene | 0.040 | 1400 | 15 | 0.1910 | 0.6 |
| 3 | PCMs if applicable | 0.005/0.0015 | ||||
| 1 (interior) | Oriented strand board | 0.105 | 1880 | 650 | 0.0127 | 0.7 |
| Layer | Material | K (W/m·K) | Thickness (m) | Solar Transmittance | Outside Solar Reflectance | Inside Solar Reflectance |
|---|---|---|---|---|---|---|
| 1 | Viracon Norther Low E on clear | 1 | 0.00305 | 0.613 | 0.2 | 0.257 |
| 2 | Air | - | 0.013 | - | - | - |
| 3 | Drapes—close weave | 0.1 | 0.003 | 0.05 | 0.3 | - |
| Layer | U-Value (W/m2·K) | Dividers Width (m) | Horizontal Dividers | Vertical Dividers | Frame Width (m) |
|---|---|---|---|---|---|
| 1 | 3.476 | 0.02 | 1 | 1 | 0.04 |
| PCM | K (W/m·K) | CP (J/kg·K) | (kg/m3) | ΔHs, l (kJ/kg) |
|---|---|---|---|---|
| BioPCM mat Q21 | 0.2 | 1970 | 235 | 186 |
| BioPCM mat Q23 | 0.2 | 1970 | 235 | 186 |
| PureTemp 18 | 0.2 | 1740 | 860 | 189 |
| PureTemp 20 | 0.185 | 2110 | 860 | 180 |
| PureTemp 23 | 0.2 | 1915 | 860 | 203 |
| PureTemp 24 | 0.2 | 2945 | 860 | 185 |
| PureTemp 25 | 0.2 | 2140 | 860 | 185 |
| Sequence | Bedroom | Lounge | Kitchen | Circulation | Bathroom |
|---|---|---|---|---|---|
| 1 | 20/18/24/24 | 20/18/24/24 | 20/18/24/24 | 20/18/24/24 | 20/14/24/24 |
| 2 | 21/19/24/24 | 21/19/24/24 | 21/19/24/24 | 21/19/24/24 | 21/14/24/24 |
| 3 | 22/20/24/24 | 22/20/24/24 | 22/20/24/24 | 22/20/24/24 | 22/14/24/24 |
| 4 | 23/21/25/24.5 | 23/21/25/24.5 | 23/21/25/24.5 | 23/21/25/24.5 | 23/14/25/24.5 |
| 5 | 24/21/26/25.5 | 24/21/26/25.5 | 24/21/26/25.5 | 24/21/26/25.5 | 24/14/26/25.5 |
| Sequence | Naturally Vented (NV) | Not Naturally Vented (NNV) | ||
|---|---|---|---|---|
| d = 10 mm | d = 3 mm | d = 10 mm | d = 3 mm | |
| 1 | 43.45–56.49 | 30.85–52.26 | 35.67–50.00 | 22.77–45.78 |
| 2 | 35.71–54.14 | 26.22–45.07 | 29.06–46.94 | 20.91–37.43 |
| 3 | 29.45–51.81 | 18.87–44.47 | 21.96–42.26 | 14.22–34.45 |
| 4 | 22.65–45.12 | 12.91–38.63 | 17.72–37.06 | 10.58–30.12 |
| 5 | 19.43–38.54 | 11.25–33.53 | 13.97–29.55 | 8.38–24.19 |
| Sequence | NV | NNV | ||
|---|---|---|---|---|
| d = 10 mm | d = 3 mm | d = 10 mm | d = 3 mm | |
| 1 | 54.47–71.40 | 51.83–61.77 | 45.58–64.06 | 38.62–58.19 |
| 2 | 41.30–65.89 | 39.05–55.82 | 35.65–58.30 | 33.76–47.15 |
| 3 | 30.45–57.88 | 28.55–51.97 | 26.55–49.72 | 24.78–40.77 |
| 4 | 25.59–49.88 | 23.33–47.17 | 21.60–42.90 | 19.87–37.03 |
| 5 | 23.07–45.03 | 20.70–44.08 | 17.46–33.68 | 16.03–30.53 |
| Building | Floor (mm) | Partition (mm) | Roof (mm) | External Walls (mm) |
|---|---|---|---|---|
| A | 3.333 | 1.843 | 2.766 | 2.496 |
| B | 2.801 | 1.195 | 2.713 | 5.287 |
Publisher’s Note: MDPI stays neutral with regard to jurisdictional claims in published maps and institutional affiliations. |
© 2020 by the authors. Licensee MDPI, Basel, Switzerland. This article is an open access article distributed under the terms and conditions of the Creative Commons Attribution (CC BY) license (http://creativecommons.org/licenses/by/4.0/).
Share and Cite
Schmerse, E.; Ikutegbe, C.A.; Auckaili, A.; Farid, M.M. Using PCM in Two Proposed Residential Buildings in Christchurch, New Zealand. Energies 2020, 13, 6025. https://doi.org/10.3390/en13226025
Schmerse E, Ikutegbe CA, Auckaili A, Farid MM. Using PCM in Two Proposed Residential Buildings in Christchurch, New Zealand. Energies. 2020; 13(22):6025. https://doi.org/10.3390/en13226025
Chicago/Turabian StyleSchmerse, Erik, Charles A. Ikutegbe, Amar Auckaili, and Mohammed M. Farid. 2020. "Using PCM in Two Proposed Residential Buildings in Christchurch, New Zealand" Energies 13, no. 22: 6025. https://doi.org/10.3390/en13226025
APA StyleSchmerse, E., Ikutegbe, C. A., Auckaili, A., & Farid, M. M. (2020). Using PCM in Two Proposed Residential Buildings in Christchurch, New Zealand. Energies, 13(22), 6025. https://doi.org/10.3390/en13226025