1. Introduction
The rapid deployment of renewable generation in the last two decades has seen the introduction of new power sources on the distribution network. Previously, power flowed strictly from supply to demand but distributed generators (DGs) have transformed the structure of distribution networks. The installed capacity of DG on UK networks reached 26 GW in 2019, 24% of installed renewable capacity, and is projected to increase to 36% by 2050 [
1]. Although the integration of DG has significant benefits in decarbonising the electricity industry [
2], it also brings a series of challenges to network operation due to the variability and uncertainty of renewable output. Bidirectional power flow, voltage rise and increased fault level have been identified as key issues that DG poses to network operation [
3]. As the share of DG increases, the pressure on network capacity due to voltage rise and reverse power flow will rise. Therefore, there is a critical need to fully utilise the network capacity to connect DG by exploring the potential of different DG configurations and considering new network management techniques. The research on how to locate and size renewable DGs to maximise their overall connectable capacity is often referred to as ‘hosting capacity’ in the literature [
4,
5].
Hybrid generation comprising different types of renewable generation offers a potentially valuable route to better balance their output and increase their grid integration [
6,
7,
8]. The time-varying nature of renewable resources creates less predictable and uncontrollable generation peaks and troughs. Generation peaks that coincide with periods of low demand define the worst-case scenarios that drive voltage rise and increased reverse power flow on distribution networks. Ultimately, these conditions determine the capacity that Distribution Network Operators (DNOs) are willing to connect. If generation is based on resources with different profiles, either resulting from temporal or spatial differences, then individual extreme peaks may be suppressed, and network constraints might be avoided or reduced. A DNO could then connect more capacity.
The complementarity between different renewable resources seems to be highly dependent on the location in which the study is made; however, in general, research has proven that a diversified portfolio of renewables improves their output reliability. Many studies have focused on the analysis of complementarity among wind, solar photovoltaic (PV) and hydroelectricity generation to facilitate grid integration. These studies have reported valuable complementarity in different locations and time scales [
9,
10,
11]. Hoicka et al. investigated wind and solar in Ontario, Canada and found complimentary resources result in less variability of power output [
12]. The solar and wind resources around China were modelled using the MERRA-2 reanalysis dataset and the complementarity of wind and PV connected more capacity than individual resources [
13]. In [
14], the strong temporal synergy of solar and wind resource is found in Australia and their combination increases the use of existing transmission assets. In [
15], annual and interannual complementarities among wind, PV and hydropower are explored in Colombia for stable power supply during the annual dry season and the El Nino Sothern Oscillation. The impact of complementarity on small scale hybrid wind-PV systems is studied in [
16] and the authors proposed a set of complementarity indices for power supply reliability. The work in [
17] found that the joint operation of PV and hydro stations helps to increase PV integration and also raises their profit on the day-ahead market. Halamay et al. also identified the diversification of resources at large scale as a way to reduce utility reserve requirements [
18]. The value of local hybrid solar-wind systems is examined in [
19] and shows the benefit of the combination of the hybrid generation and the value of selective curtailment of generation.
While the renewable complementarity for increasing grid-integration is an active research field, studies on the complementarity involving both wave and tidal resources are sparse. There are a few studies on combining wind only with wave. The complementarity of wind and wave resources at locations around Europe have been compared, and sites that had two generation profiles with stable behaviour and low correlation were found to reduce the variability of power output to the grid [
20]. Similar studies include the evaluation of colocated wind and wave for the US west coast and the UK North Sea [
21], Latin America and Europe [
22]. These works mainly look at the supply profile of the combined resources but do not consider their feasibility regarding network capacity constraints.
Another popular route for increasing hosting capacity for renewables is through the use of advanced network control schemes [
23,
24]. Historically, DNOs have connected DG with a ‘fit-and-forget’ or ‘passive control’ approach where generator unit capacities are constrained at the planning stage so that when connected they can operate without intervention. This hosting capacity is defined according to often infrequent worst-case scenarios, where low demand coincides with high generation output, making relatively inefficient use of the network. The downside of this approach has been widely recognised and the potential to make better use of the network by using active network management (ANM) techniques has been well articulated. Several different ANM control schemes have been proposed. In a method referred to as coordinated voltage control (CVC), on-load tap changers (OLTC) are used to change (lower) the set-point voltage on the secondary side of transformers, mitigating voltage rise [
25]. Power factor control (PFC) varies the DG power factor from inductive to capacitive depending on the direction of required voltage control [
26,
27]. Alternatively, DNOs may reserve the right to reduce power output via active curtailment control (ACC) during periods that stretch the network capabilities [
28,
29]. ANM has been trialled on a distribution network on the Orkney Islands, Scotland with power flow management through ACC used successfully to keep network components within their thermal limits [
30]. Optimal power flow (OPF) techniques have been developed to understand how DG affects distribution network operation, the constraints to deployment, and how connectable capacity may be enhanced [
31,
32,
33]. Multiperiod AC OPFs have indicated that ANM schemes (notably ACC, CVC and PFC) increase the capacity of wind generation connected to distribution networks [
34].
Summarizing the research gap identified in the existing literature: firstly, regarding complementarity of multiple renewable resources few, if any, consider the complementary potential of offshore wind, wave and tidal energy sources to improve the connectable capacity. Secondly, few existing works on resource complementarity explicitly consider the reliable operation of networks in terms of voltage and thermal limits in the distribution network. In contrast, this study takes a rigorous approach and thoroughly investigates the complementary benefits of these three offshore renewable resources in alleviating network constraints and increasing the hosting capacity. Moreover, the additional benefits from active network management are also studied in detail. The main contribution of this work can be described as:
The novel introduction of three offshore renewable resources—offshore wind, wave and tidal stream—to a hosting capacity study. A multivariate scenario reduction technique is adapted to effectively consider variation and complementarity of renewables over a long time period.
The generic AC OPF based hosting capacity model is established to find the simultaneous hosting capacity for various resource combinations considering their complementarity and a suite of ANM control schemes. The hosting capacity problem is formulated as a nonlinear programming (NLP) model to accurately model voltage and thermal constraints.
Comparative analysis is detailed in the case study in Scotland for different configurations of renewable resources and control schemes. This identified which resources combine to offer enhanced hosting capacity and energy delivery and which features constrain the performance of network control schemes.
This paper is structured as follows:
Section 2 introduces the optimisation model for hosting capacity analysis.
Section 3 introduces the case study and
Section 4 provides the resource evaluation and hosting capacity analysis and discussion. The conclusion is provided as the last section.
2. AC OPF Model for Hosting Capacity Analysis
An AC OPF based approach is adopted here to model a hosting capacity problem with the objective to maximise the overall connectable capacity of candidate DG located at specified locations across the network. The OPF formulation is widely used to find the optimal control settings for a power network to fulfil its objective function whilst remaining within network limits. An AC solution is preferred as it accounts for active and reactive network components, both of which are known to affect voltage levels, a key constraint to generation on distribution networks. While traditionally used for operational analysis, it has found use in ‘planning’ analysis such as for hosting capacity analysis where the capacity of generators are optimised [
32,
34].
The normal AC OPF is extended here to consider multiple resources and multiple time periods. The multiperiodicity grasps the time-varying nature of demand and renewable generation profiles; specifically the need to capture a wide range of conditions requires a large number of time periods (at least a year) at relatively high time resolution (such as hourly). Hybrid generation configurations can easily be analysed using a multiperiod approach, which account for their differing temporal characteristics. The OPF-based nonlinear optimisation model is implemented in the modelling language AIMMS [
35] and solved using the CONOPT 4.0 NLP solver.
Before the formal mathematical description, it is worth explaining how the optimisation operates in simple terms. The model uses the DG production and demand in each time period and determines the resulting set of power flows. As the DG size(s) are increased, the production across all periods will increase, changing the power flows and resulting in higher voltages and larger reverse power flows. Where DG is not actively controlled, the DG(s) capacity will be increased until a voltage or thermal constraint is reached in one or more periods (normally that with maximum production and minimum demand). This defines the hosting capacity.
Where there are ANM controls in place and DG capacity and production increase, voltages and reverse power flows increase. However, where a constraint is reached in a period the optimisation will look to change the control setting (power factor, transformer voltage or curtailment) such that the DG capacity can increase further. Each time period is treated separately but more periods will tend to see changes in control settings as the DG capacity increases. This continues until one or more of the control settings have reached their limit (e.g., power factor limits, transformer voltage limits or maximum curtailment), defining the hosting capacity.
2.1. Objective Function
More formally, the objective function of the optimisation is to maximise the total connectable capacity of potential DGs of different resource types located at specified locations in the network over all considered renewable resources:
where
is the active power capacity of generator
g for resource
r.
2.2. Network Constraints
The three major constraints that the optimisation is subject to are: (1) active and reactive power balance, (2) voltage limits and (3) power flow limits.
2.2.1. Active and Reactive Nodal Power Balances
The active power balance equations are derived from Kirchhoff’s current law and define the power flow into and out of each bus:
where
is the active power injection into connecting lines
L from bus
b in period
m;
is demand in each period expressed relative to peak value
.
is the generator output level for the resource
r during period
m and is defined as the instantaneous output as a fraction of the maximum/nominal output (i.e., capacity factor), and is determined by the resource characteristics such as wind speed in corresponding periods
m. If the bus is connected to external connection
x, typically the grid supply point (GSP), any excess or deficit of production is met from exports/imports
from the external network.
The reactive power balance constraints can be derived similarly:
where the reactive power output of DG is calculated based on its power factor angle
.
2.2.2. Voltage Limits
Network bus voltages
over all time periods must be within defined limits described by lower and upper boundaries,
:
2.2.3. Power Flow Limits
Flow of power through each line and transformer has specified flow limits imposed by the equipment capabilities and described as:
where
and
are, respectively, the active and reactive flows through line/transformer
l and
is the apparent power flow limit.
2.3. Active Network Management
ANM schemes are expected to complement the efforts of hybrid generation configurations for maximising DG production. Active network management aims to adapt control settings for network components and DG on an ongoing basis in response to network constraints. Depending on the scheme these define target DG production levels, power factors and transformer set-points in each period that serve to allow larger generators and more energy production. The three schemes discussed in the introduction are simulated to investigate their benefit to networks.
2.3.1. Active Curtailment Control
Curtailment control selectively reduces DG active power output in periods when voltage or power flow limits would otherwise be breached, by reducing reverse power flows. In the model, curtailment
is considered as a variable, applied by the DNO when the network is constrained, which reduces the active power delivered in period
m. The resulting power production in period
m (
) takes the place of the simple generator capacity previously included in Equation (2):
with a similar replacement required for Equation (3). The amount of curtailment applied to each renewable DG is limited by its full potential output in the corresponding period:
To ensure a realistic level of curtailment that a developer might agree to, the level of curtailment of each DG is restricted by the curtailment factor
, a proportion of the total potential energy generation over the full study period
M (e.g., over a whole year) as a global limit:
where
is the duration of period
m, e.g., an hour.
2.3.2. Power Factor Control
Power factor control enables local voltage control close to the DG to alleviate voltage constraints. DGs are simulated with the capability to dispatch their power factor
from period to period, within the inductive and capacitive limits of the DG (
):
Making power factor more inductive will tend to reduce reverse power flows and limit voltage rise, enabling larger generators to be connected.
2.3.3. Coordinated Voltage Control
Coordinated voltage control allows the GSP transformer secondary voltage
to be set to raise or lower overall voltage levels in the network. The secondary voltage is a variable in the model constrained within the range indicated by the transformer tap changer limits (
):
In general, setting a lower secondary voltage will tend to allow greater generation by enabling a greater degree of voltage rise relative to the substation.
2.4. Treatment of Long-Term Time-Series Data
It is important that the full variation of renewable resource and demand over an extended period (e.g., a year) is captured in the analysis, so that the obtained DG capacities satisfy all operational conditions. However, the non-convex nonlinear nature of the hosting capacity optimisation model makes this quite challenging. For example, the direct use of hourly data for one year in the optimisation will generate 8760 operational scenarios to be considered simultaneously, which means a significant number of time-varying variables and corresponding constraints, making the nonlinear optimisation problem laborious or intractable.
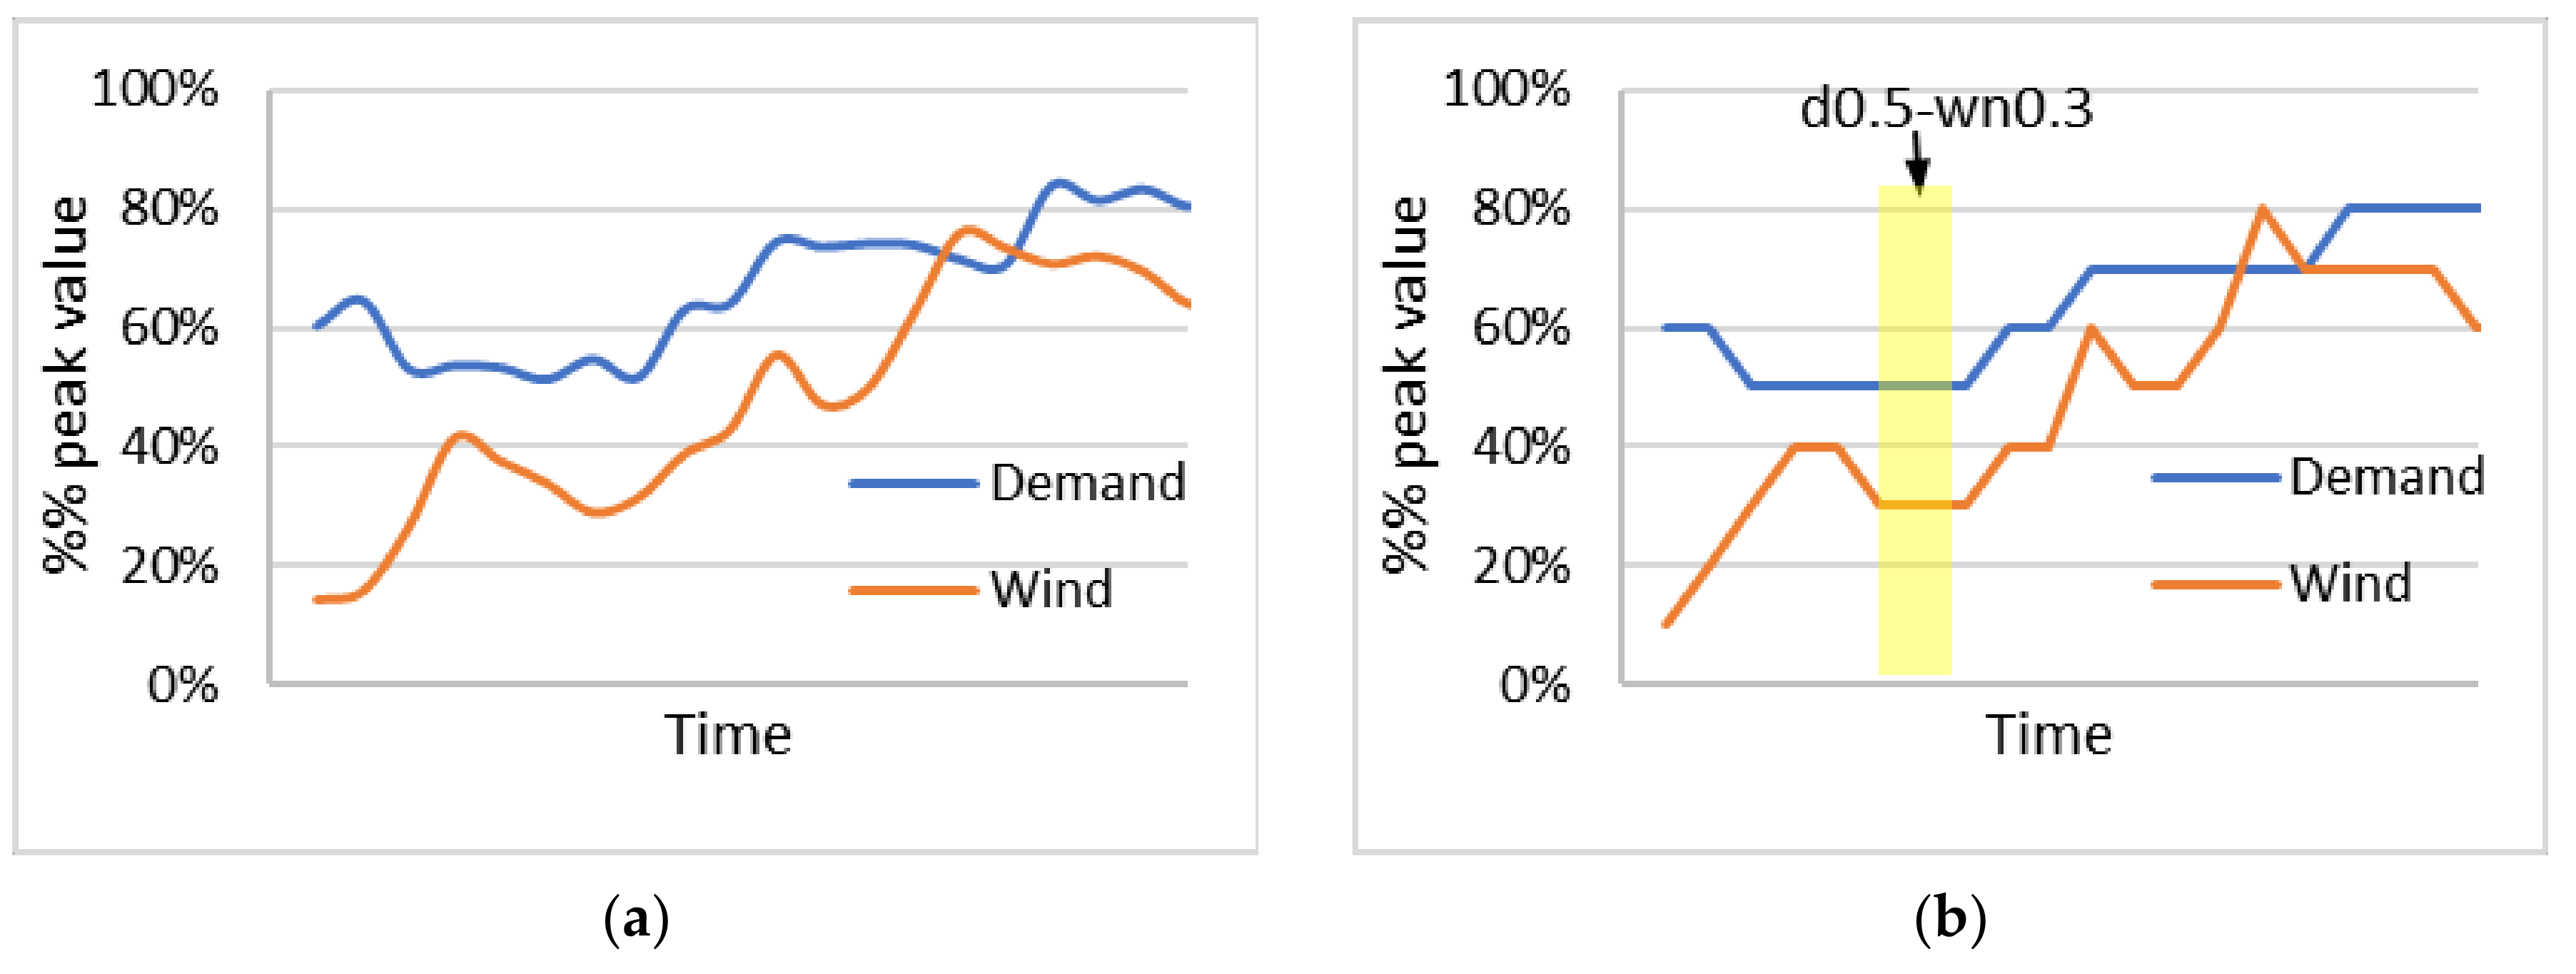
To address the computational challenge whilst effectively preserving the temporal interrelationships between resources and demand, scenario reduction is adopted here. The approach uses ‘representative’ combinations of demand and renewable resource level as inputs, rather than the direct use of full time series. The first step is to discretize the original values, the illustration of which is shown in
Figure 1 using the example of demand and wind data. After the discretization, the values are aggregated according to the occurrence of ‘similar’ periods and allocated into a series of bins covering specific intervals. Such treatment of long-term time-series data was previously detailed in [
34], which also showed that discretisation only has a minor impact on accuracy. This paper further develops it to address the ‘coincidence’ of three different resources (i.e., tidal, wave and wind) and demand, essentially a four dimensional array.
3. Orkney Island Case Study
The case study considers application of the method to a representative location suitable for colocated offshore wind, wave and tidal resources. The resource data relates to part of Orkney off the north coast of Scotland, which has a valuable combination of strong winds, an energetic wave climate and sites suitable for tidal stream by virtue of its position between the North Atlantic and the North Sea.
3.1. Resource Evaluation
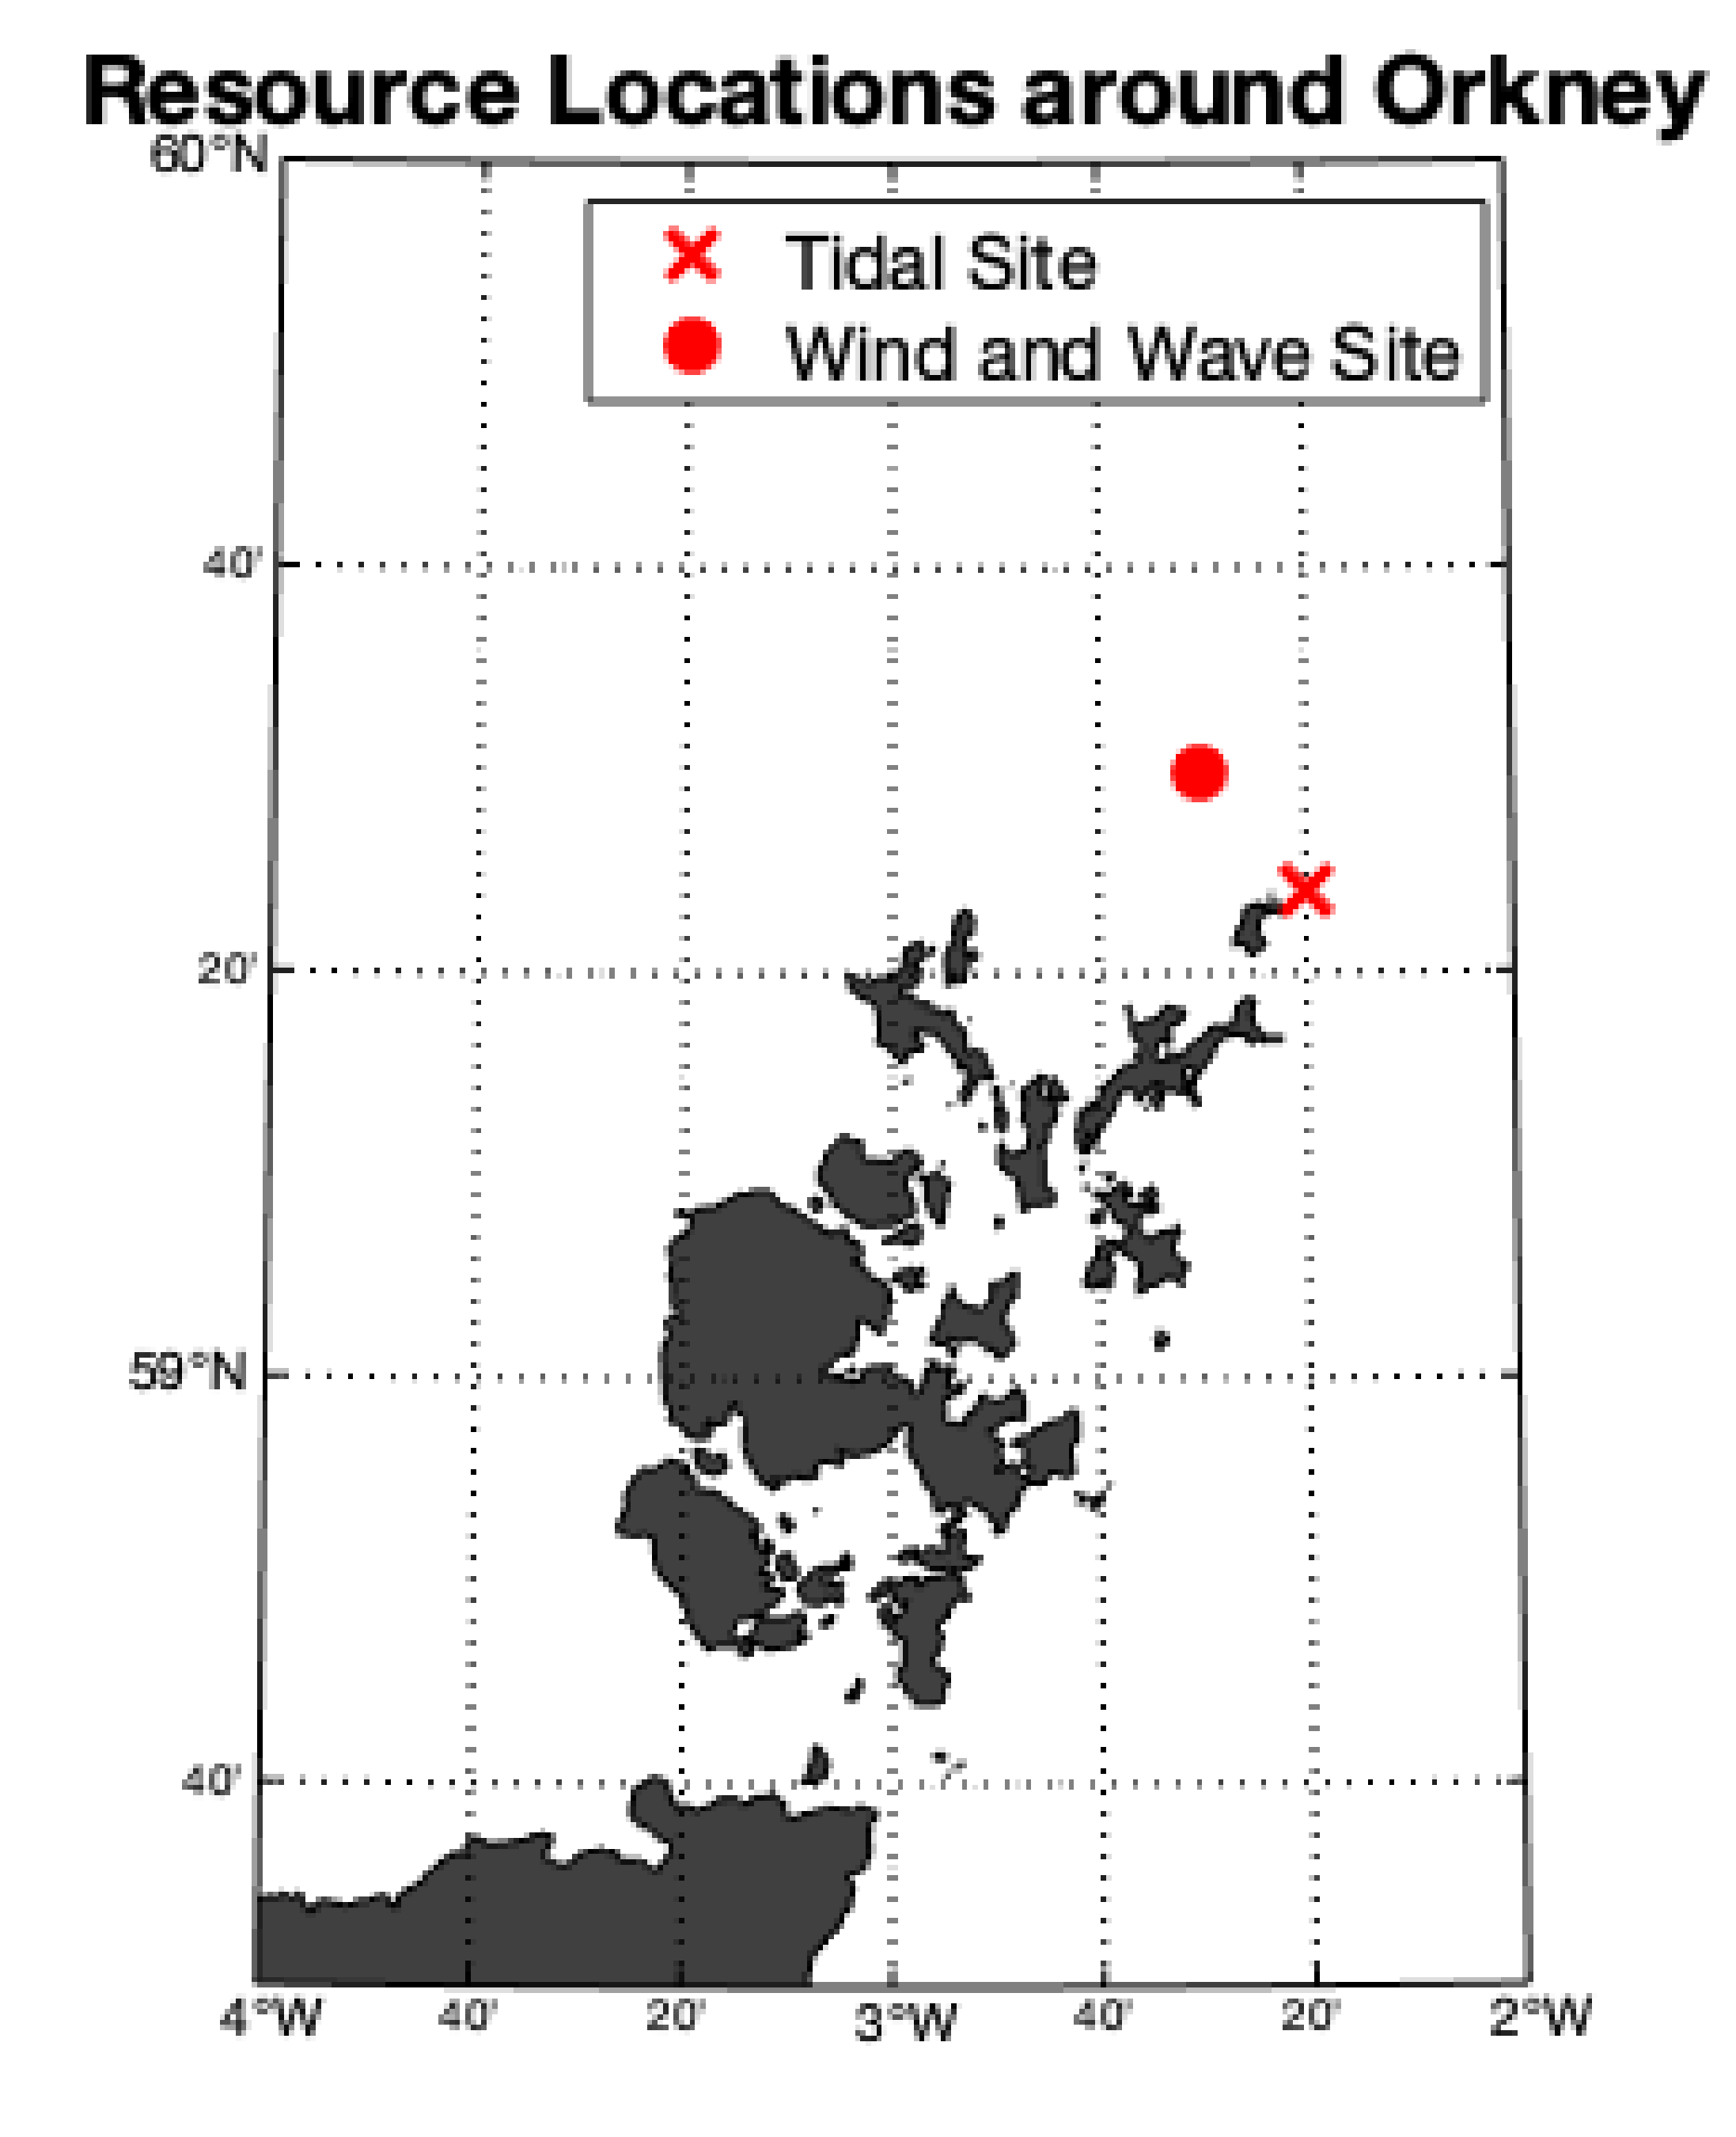
Three resource profiles with hourly resolution were built from observational and modelled datasets from North Ronaldsay, Orkney using concurrent 2016 data. The location of the data sites is shown in
Figure 2. Hourly offshore wind speed (m/s) and wave power density (per metre of wave crest) time series were based on the ECMWF ERA5 reanalysis dataset [
36], which was extensively validated. A tidal current velocity time series (m/s) was built from the FOAM Shelf Seas—Atlantic Margin Model (AMM7) coupled hydrodynamic-ecosystem model [
37]. Due to the resolution of the model it slightly underestimated current velocities so a scaling factor was applied to the tidal profile to raise the 25 highest current velocities to equal the observed local average peak spring velocity [
38].
Three representative devices were used to convert the resource time series into production time series. A 1 MW, 18 m rotor diameter SeaGen tidal turbine [
39] was chosen to convert tidal energy. The nature of the flow off the tip of North Ronaldsay was thought to be effectively captured by the bidirectional capability of the turbine. A Pelamis wave energy converter, scaled up from 750 to 1500 kW as in [
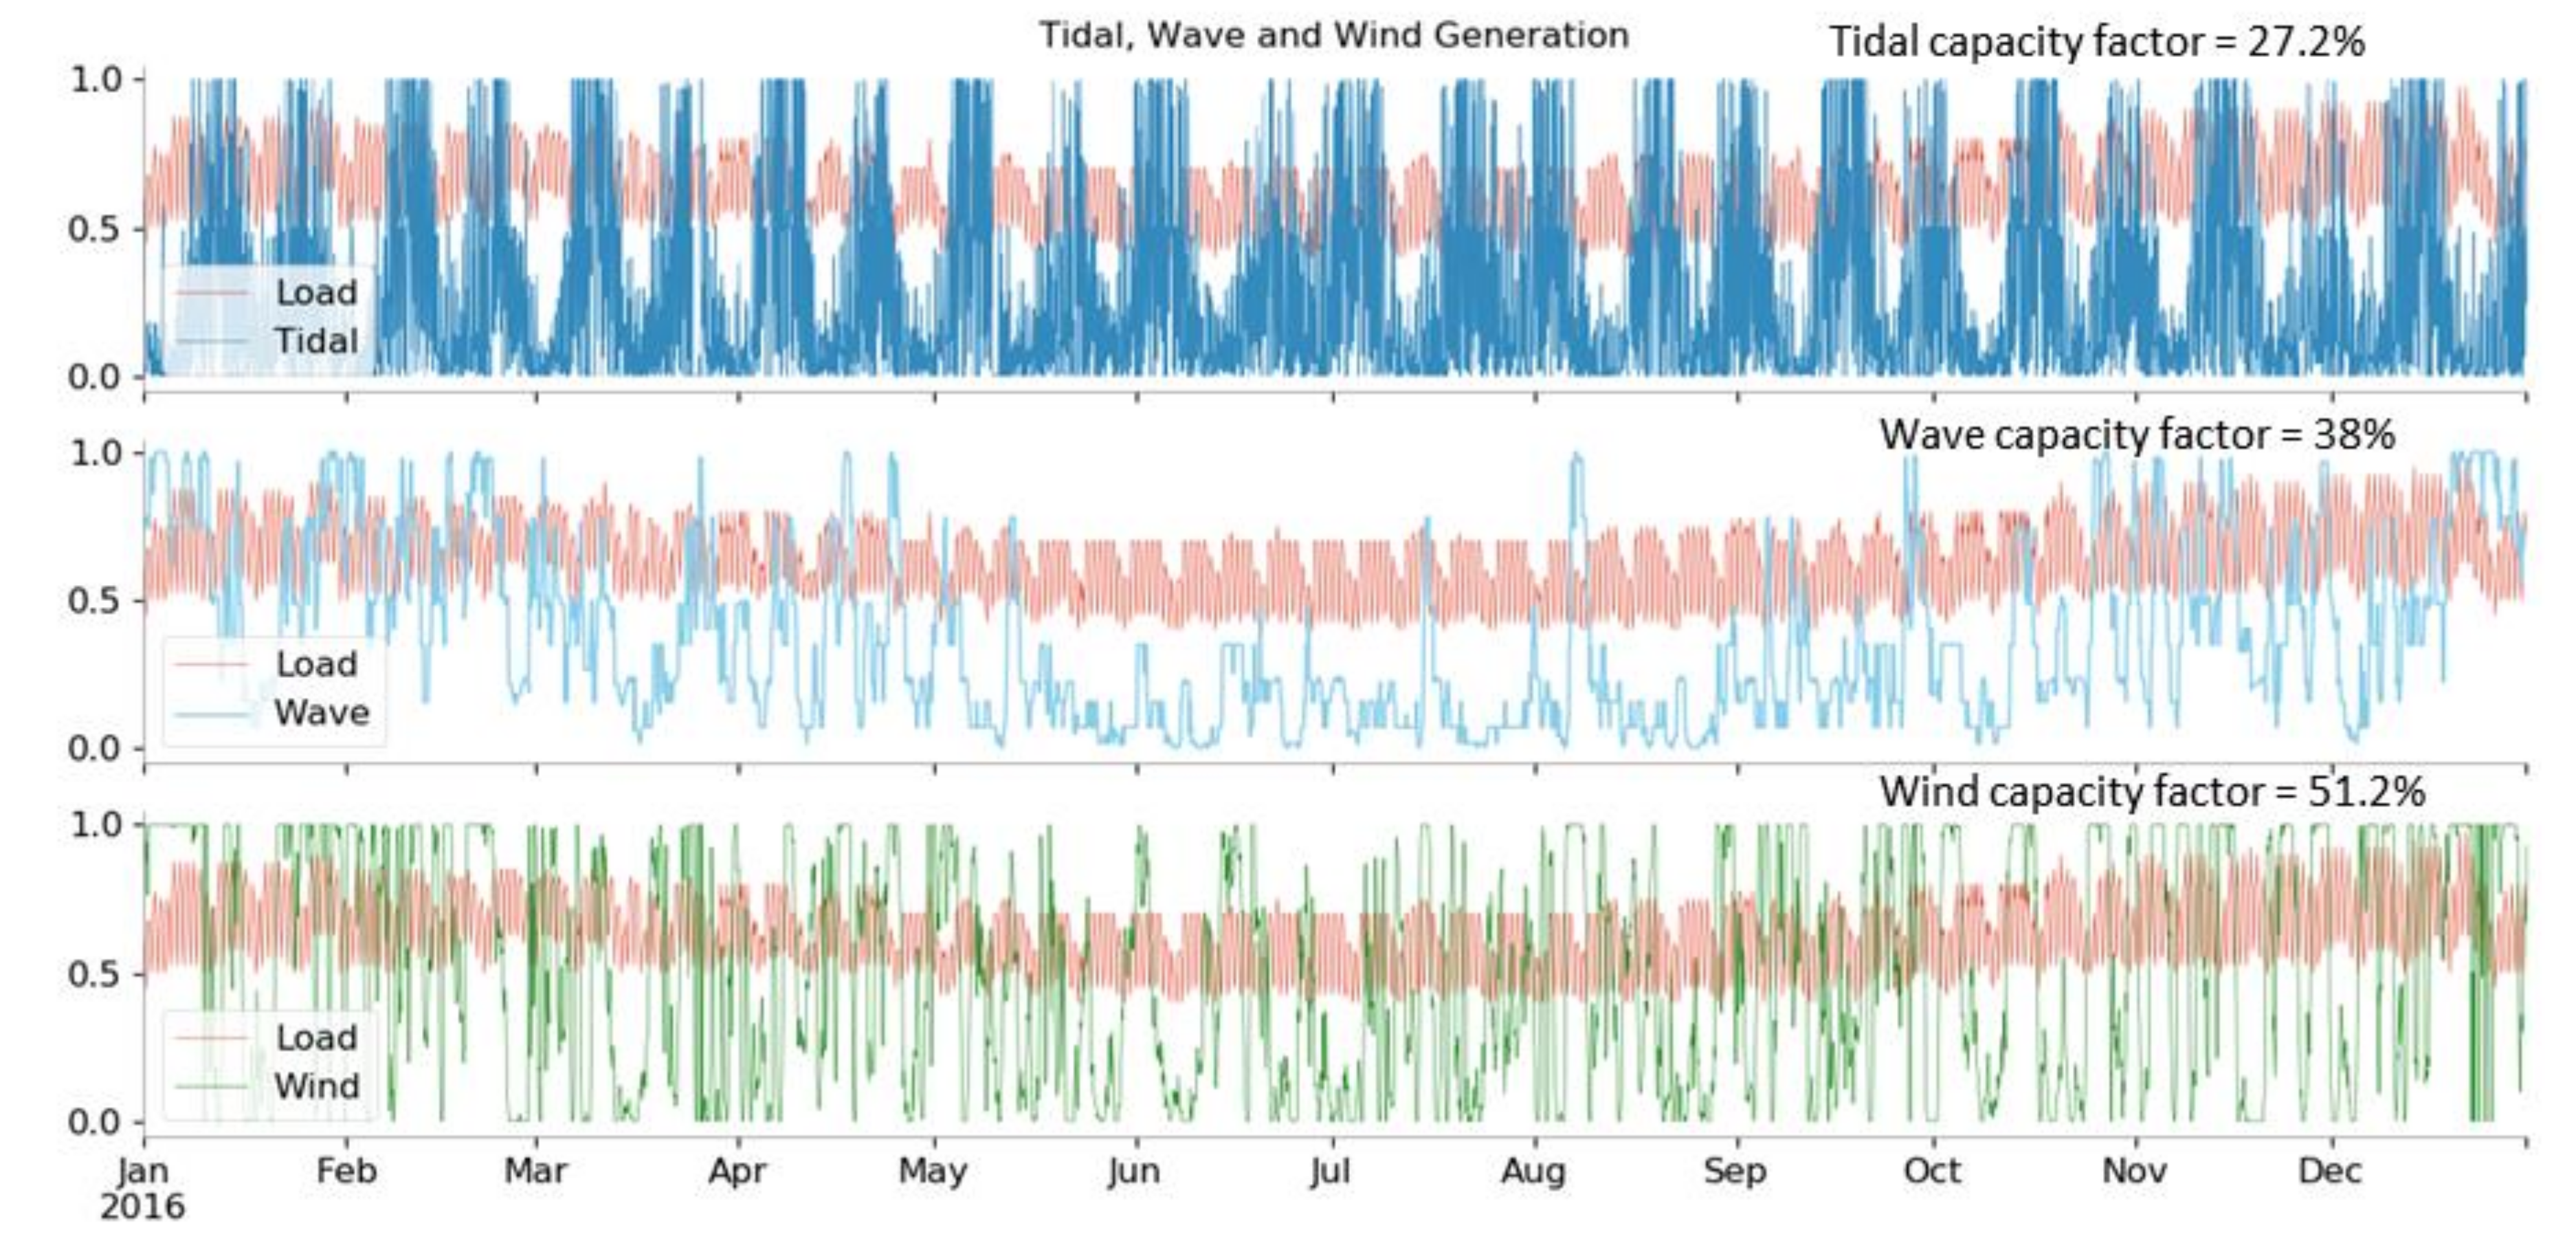
40], was chosen due to its wide coverage of energy period and wave height. Although this device was no longer being actively developed for commercialisation, it was well suited to the site characteristics around Orkney and was deemed appropriate to exhibit the benefits of hybrid generation. A generic wind power curve based on a 7.58 MW 127 m diameter direct-drive Enercon E-126 at 80 m hub height was used to convert the wind resource. The resulting year-long hourly generation profiles are shown in
Figure 3 along with the electricity load profile [
40].
Tidal: The SeaGen capacity factor was 27.2%, a product of many hours spent at slack water between energetic flood and ebb flows typical of tidal turbines. The variation of tidal generation was dominated by semidiurnal and fortnightly cycles determined by celestial orbits.
Wave: The scaled up Pelamis device achieved a capacity factor of 38%, which is comparable with some of the most efficient wave converter locations analysed in a recent study [
41].
Figure 3 shows that the wave profile had a strong seasonal variation with calmer summers and more energetic winters.
Wind: Offshore wind generation had the highest capacity factor of the three generator types, reaching 51.2%. Wind exhibited a similar, but less pronounced seasonal distribution to the wave profile. Regular high production (relative to the generator capacity) will increase energy delivered but will also tend to stretch the limits of the network, which might affect how wind is handled in the optimisation.
To investigate the relationship among these generation types, and also between each generation type and load, their correlation coefficients are provided in
Table 1. The peak cross-correlation coefficients and their associated lags were also calculated and given in
Table 2.
A low correlation between the tidal profile and demand or other generation profiles is attributed to the misalignment of the production timescales with those for the others. Independence from other profiles could either support or suppress the inclusion of tidal generation in a hybrid configuration. Generation unrelated to the demand profile will cause frequent imbalance between generation and demand and tend to limit connectable capacity, as peaks of the two are not expected to co-occur. However, an opposite and beneficial impact can be expected with two unrelated generators, where the isolation of peaks reduces the overall generation peak and reduces the strain on the network. Wind and wave profiles are related by moderately high correlation (
Table 1) with maximum cross-correlation occurring with a six-hour lag relative to the wind profile (
Table 2). Large lags between wind and wave were attributed in [
24] to sites where the mechanisms driving wind and wave variation were isolated by the Atlantic fetch, seemingly appropriate for the site north of Orkney, and potentially describing the results. Kalogeri et al. [
20] also noted the benefit that lower correlation and higher peak lags offer hybrid generation configurations in the form of smoother power output with fewer zero hours.
Table 1 and
Table 2 suggest the wave and wind resource off North Ronaldsay may complement one another more than the same two resources analysed at other selected locations in Europe.
3.2. Network Description
A typical but deliberately simple rural distribution network [
42], outlined in
Figure 4, was used to analyse the colocated offshore renewable resources. This is not the actual network constructed in Orkney but was used to enable comparison with earlier work using the same network [
43]. The buses at the end of each feeder offer DG connection sites at bus C and bus E. The two sites had the potential to harness any of the three resources considered in the optimisation due to the proximity of each resource’s high energy regions.
Each bus was connected with local load, the sum of which had a maximum of 15.1 MW and minimum of 5.5 MW. The network was supplied by one 110/38 kV transformer at the grid supply point (GSP). Line and transformer information is given in
Table 3. Voltage variation was limited to the range of ±10%, and the transformer OLTC voltage target was fixed at 1.078 per unit when an ANM scheme was not considered. During the consideration of CVC, the tap changing potential at the GSP was +5/−15%. Power factor control was limited to power factors between
0.9. The curtailment limit was set at 10% of the total potential energy output of each generation type throughout the study period.
3.3. Resource-Demand Coincidence
In their original state, the demand and generation profiles take the form of four time-series each with 8760 hourly steps. The NLP optimisation program cannot directly account for such a large dataset, particularly with more than one bus location. Instead, the scenario reduction technique in
Section 2.4 was applied to use the duration of coinciding demand-generation levels as input for the NLP to reduce the computational burden.
The hourly demand and generation data of each resource were fitted to various operating state bins, in the percentage of its peak value, centred around 10% steps from 0 to 100%. Demand never fell into a bin lower than 40%, so only 7 of the 11 load states were considered. Periods could then be defined as every combination of demand and generation operating state that occurs in the dataset. The duration of the period is simply the number of hourly occurrences. This unique combination was observed throughout the year.
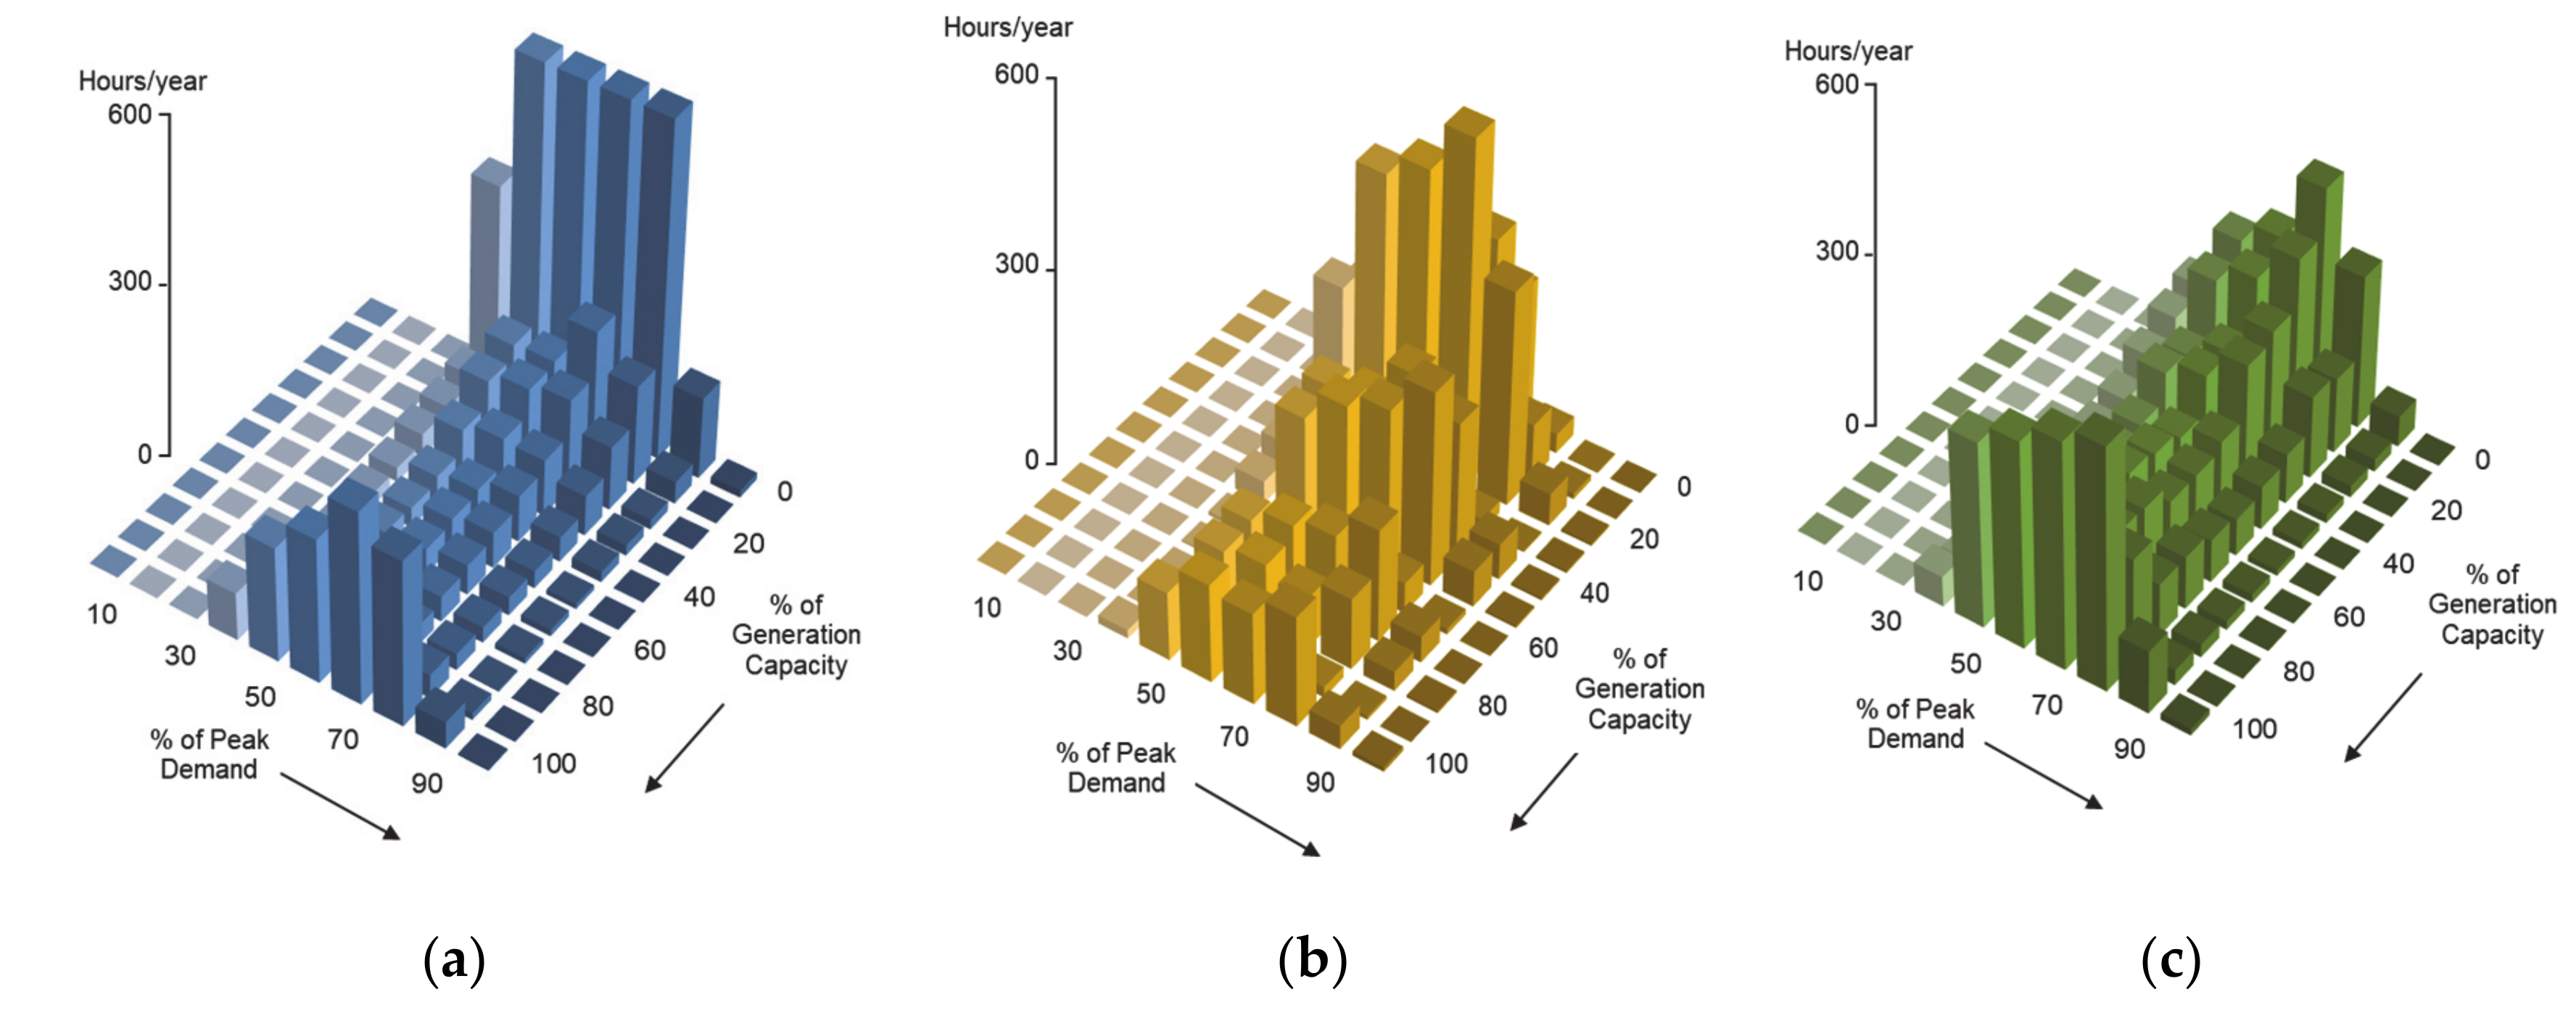
A total of seven different resource configurations were considered in generating the profile of coincident hours: single resources, hybrids of any two and all three resources together.
Figure 5 depicts the bivariate distributions of demand with each individual resource and their coincident hours. For brevity and also due to difficulty with visualization, the tri- and quadrivariate distributions are not shown for each case. However, the ‘worst-case’ scenarios are listed in
Table 4, which show the periods of high generation (100%) and low demand (40%), which were particularly restrictive to the connection of DG capacity. The coincident hours of these show that the occurrence of worst case periods varied considerably. Single resource tidal and wind cases exhibited the highest coincident hours, wave exhibited somewhat less and none of the four hybrid resource combinations exhibited more ‘worst-case’ hours than wave alone. This demonstrates that there was potential value in diverse combinations in terms of reducing the frequency of capacity limiting periods.
4. Results
Different combinations of resources and control schemes are studied to explore their ability to maximise hosting capacity and the delivered energy. They are grouped into two subsections:
Each resource case is examined subject to six different network control schemes: passive network (i.e., No ANM) or actively managed network with either active curtailment control (ACC), coordinated voltage control (CVC) and power factor control (PFC) applied individually or with ACC combined with CVC or PFC.
Table 5 provides the results of hosting capacity for all studied cases and
Table 6 is the corresponding delivered energy. To aid comparison, the derived effective capacity factor, as the ratio of actually delivered energy to the amount of energy that would have been produced at full capacity, is given in
Table 7.
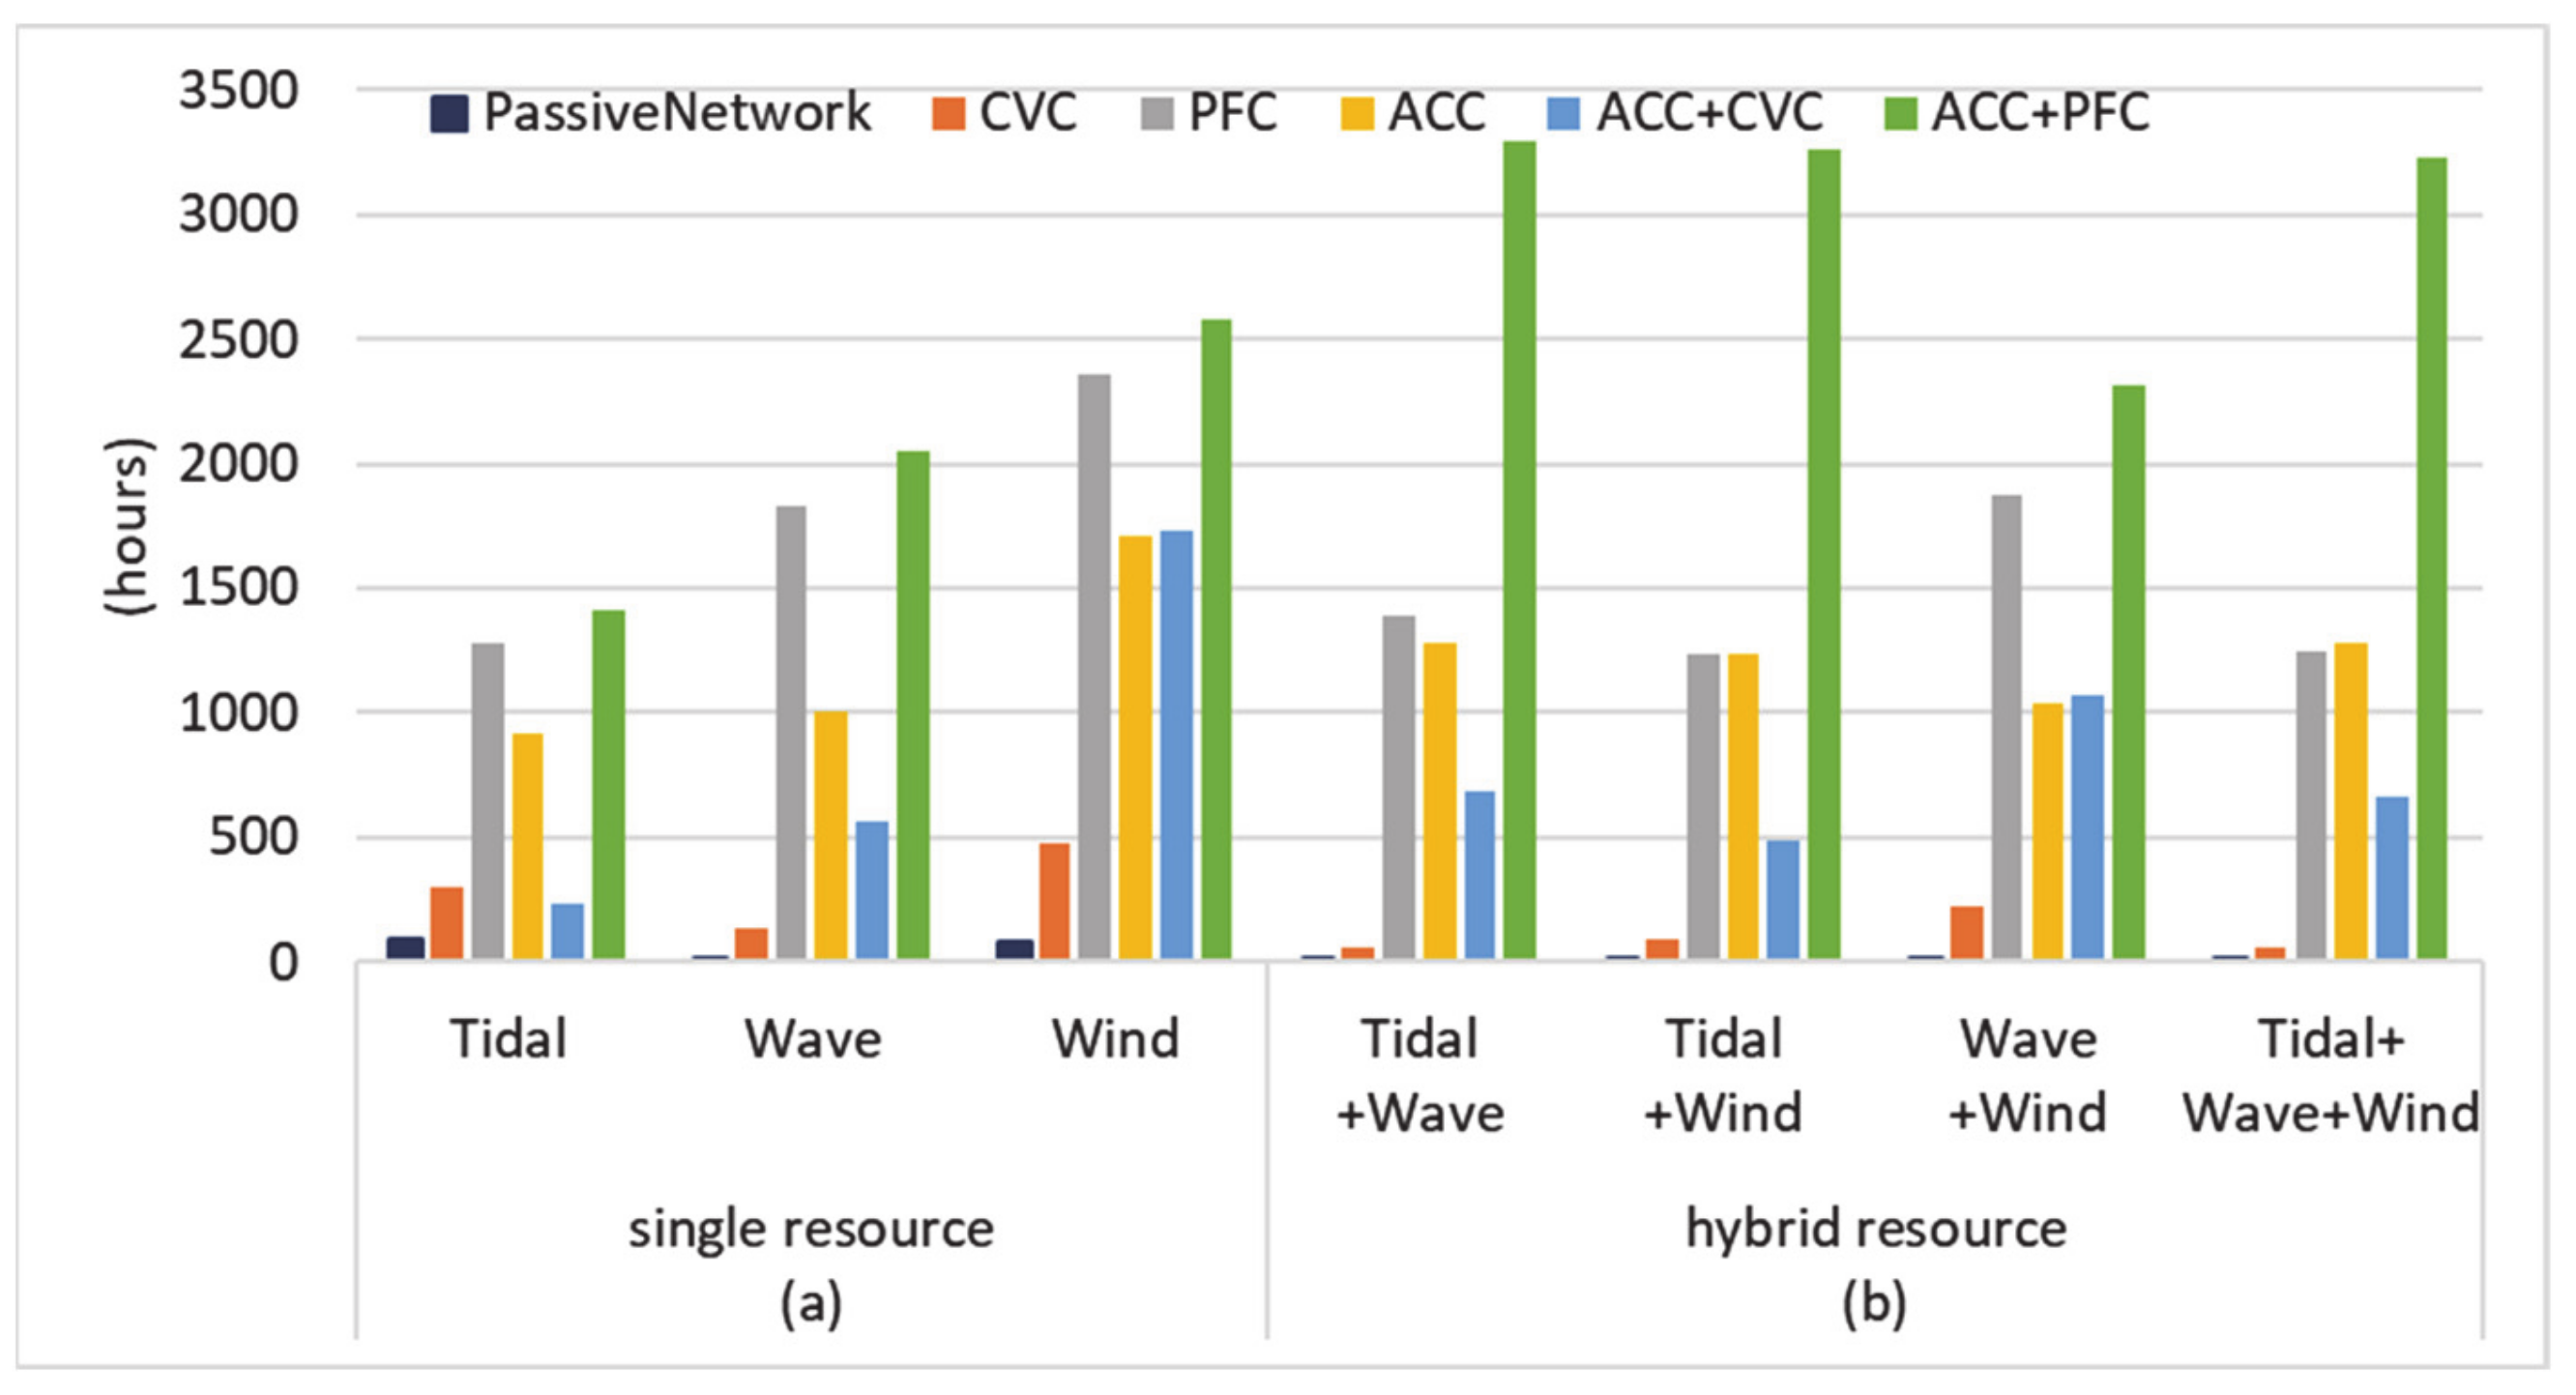
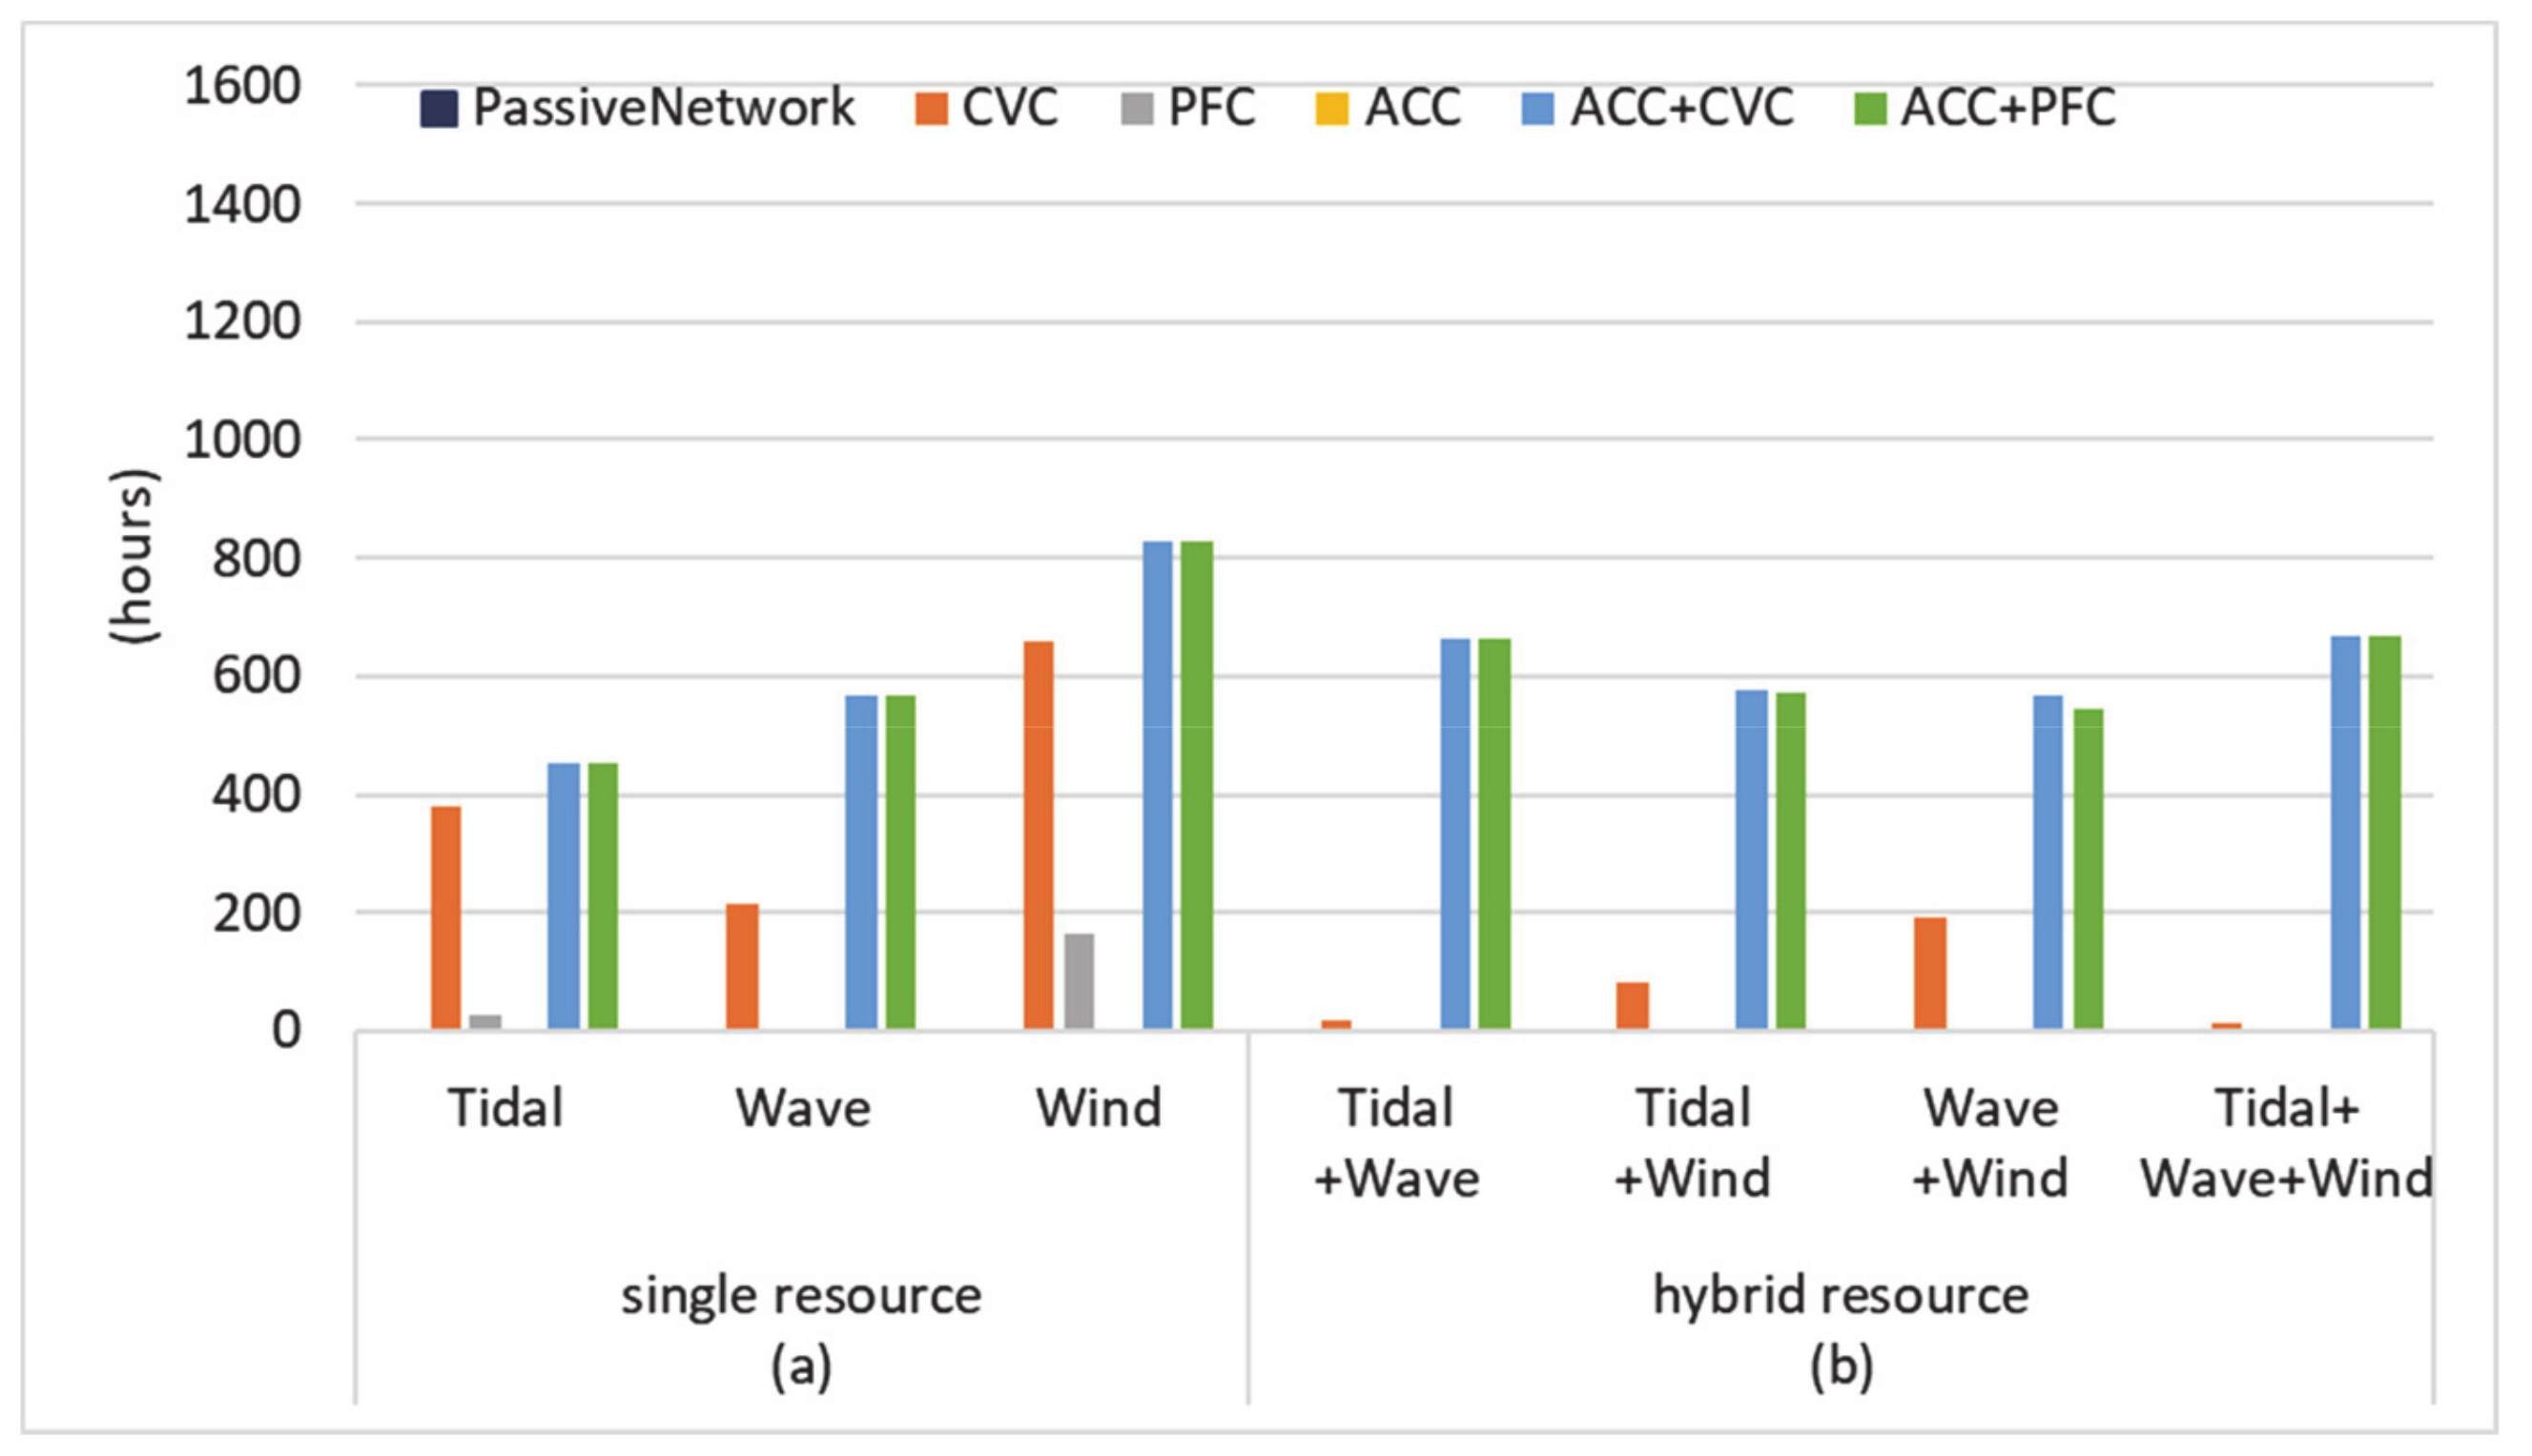
To investigate the impact of different cases on network operation in terms of voltage and line loading variations, the total hours during the year with at least one bus voltage actively constrained by its upper limits are summarized and shown in
Figure 6, with equivalent analyses for voltage lower limits, line flow limits and average line loading given in
Figure 7,
Figure 8 and
Figure 9, respectively. The power injection of DG would generally raise the voltage profiles and could also cause line overloading when the injection largely exceeded local demand. The maximum voltage rise occurs during high generation-low demand periods, which ultimately determine the capacities of DG. While the voltages and line loadings are constrained by the optimisation to prevent any limit violation, the frequency of them reaching their limits and the average values over a whole year could indicate the effective use of the network headroom for connecting renewable capacity.
4.1. Hosting Capacity for Single Renewable Type
Table 5a shows that for all single resource cases in passive networks (i.e., no ANM) the capacity is constrained to the same value due to the same worst case scenario event (maximum generation-minimum demand), irrespective of the duration. There is however difference in the energy delivered (
Table 6a), which reflects the variation in the capacity factor of each generation type at the location analysed.
Voltage rise during this scenario is the limiting factor to hosting capacity in this passive network and which occurs at the points of connection of the DG (i.e., buses gC and gE). It can be concluded that voltage control schemes would release additional connectable capacity and CVC and PFC control are successful for all renewable types. The increased capacity pushed the voltages in non-worst-case periods towards the upper voltage limits, so the total hours where voltages reach the maximum allowed values increased considerably, as shown in
Figure 6a. Additionally, the large reverse power flows along the feeders resulted in lines’ thermal limits being reached (
Figure 8a) in the lower rated sections between buses A to gC and D to gE with overall loading levels raised considerably (
Figure 9a). The PFC controlled network cases recorded more hours constrained by voltage and reached the inductive power factor limits (while attempting to lower voltage at the DG buses), but experienced fewer periods with constrained lines. CVC is the most successful single ANM scheme in increasing DG capacity and energy delivery due to the highest line usage. The network wide effects of CVC were more effective than the more localised impact of PFC.
Although the ACC cases did not enable as high connection capacity as the previous two control cases, it did distinguish between resource types. By implementing ACC, the sporadic peaky nature of the wave profile allowed curtailment to remove its irregular peaks (as its maximum peak only coincided with the low demand for 15 h, as shown in
Table 3) allowing greater capacity than the tidal or wind cases. Curtailment was less effective for both the tidal and wind case, which had more regular maximum and other high production states. Despite the 22% extra capacity, the lower capacity factor means wave still delivered 7% less energy (
Table 6a).
Combining ACC with another control scheme makes much more effective use of network capacity with the combination of ACC and CVC showing higher overall capacity and energy delivery than with PFC. The difference was particularly stark with the wave profile, where it was possible to connect almost six times the wave capacity than in the passive case, nearly matching the energy delivery by the equivalent wind case (
Table 6a). The combined control schemes stretched the power flow limits substantially and with PFC in particular, there was very frequent occurrence of upper voltage limits.
Figure 7a shows that lower voltage limits were occasionally met in the tidal and wind cases with ACC and CVC control, because high demand coincided with low generation and the range of the voltage set-point at the GSP OLTC restricted the network capacity. This did not occur with the wave case where maximum demand never coincided with zero generation.
The high overall capacity factor of the wind resource enabled the wind cases to deliver the most energy in all cases. The choice of control was highly influential on the wave cases as outlined above and the tidal cases were consistently lower and the scope for capacity increases derived from ACC was lessened by the regular peaks and troughs associated with the resource. Despite differences in capacity and energy delivery among these single resources cases, their effective capacity factors in
Table 7a show the same trend: without ACC it was the same as the capacity factor of the resource; when ACC was involved, it was lower and the percentage reduction from its resource capacity factor was equal to the given curtailment limit, i.e., 10%.
4.2. Hosting Capacity for Hybrid Generation
Table 5b and
Table 6b show the corresponding capacity and energy delivery for cases with multiple resources and
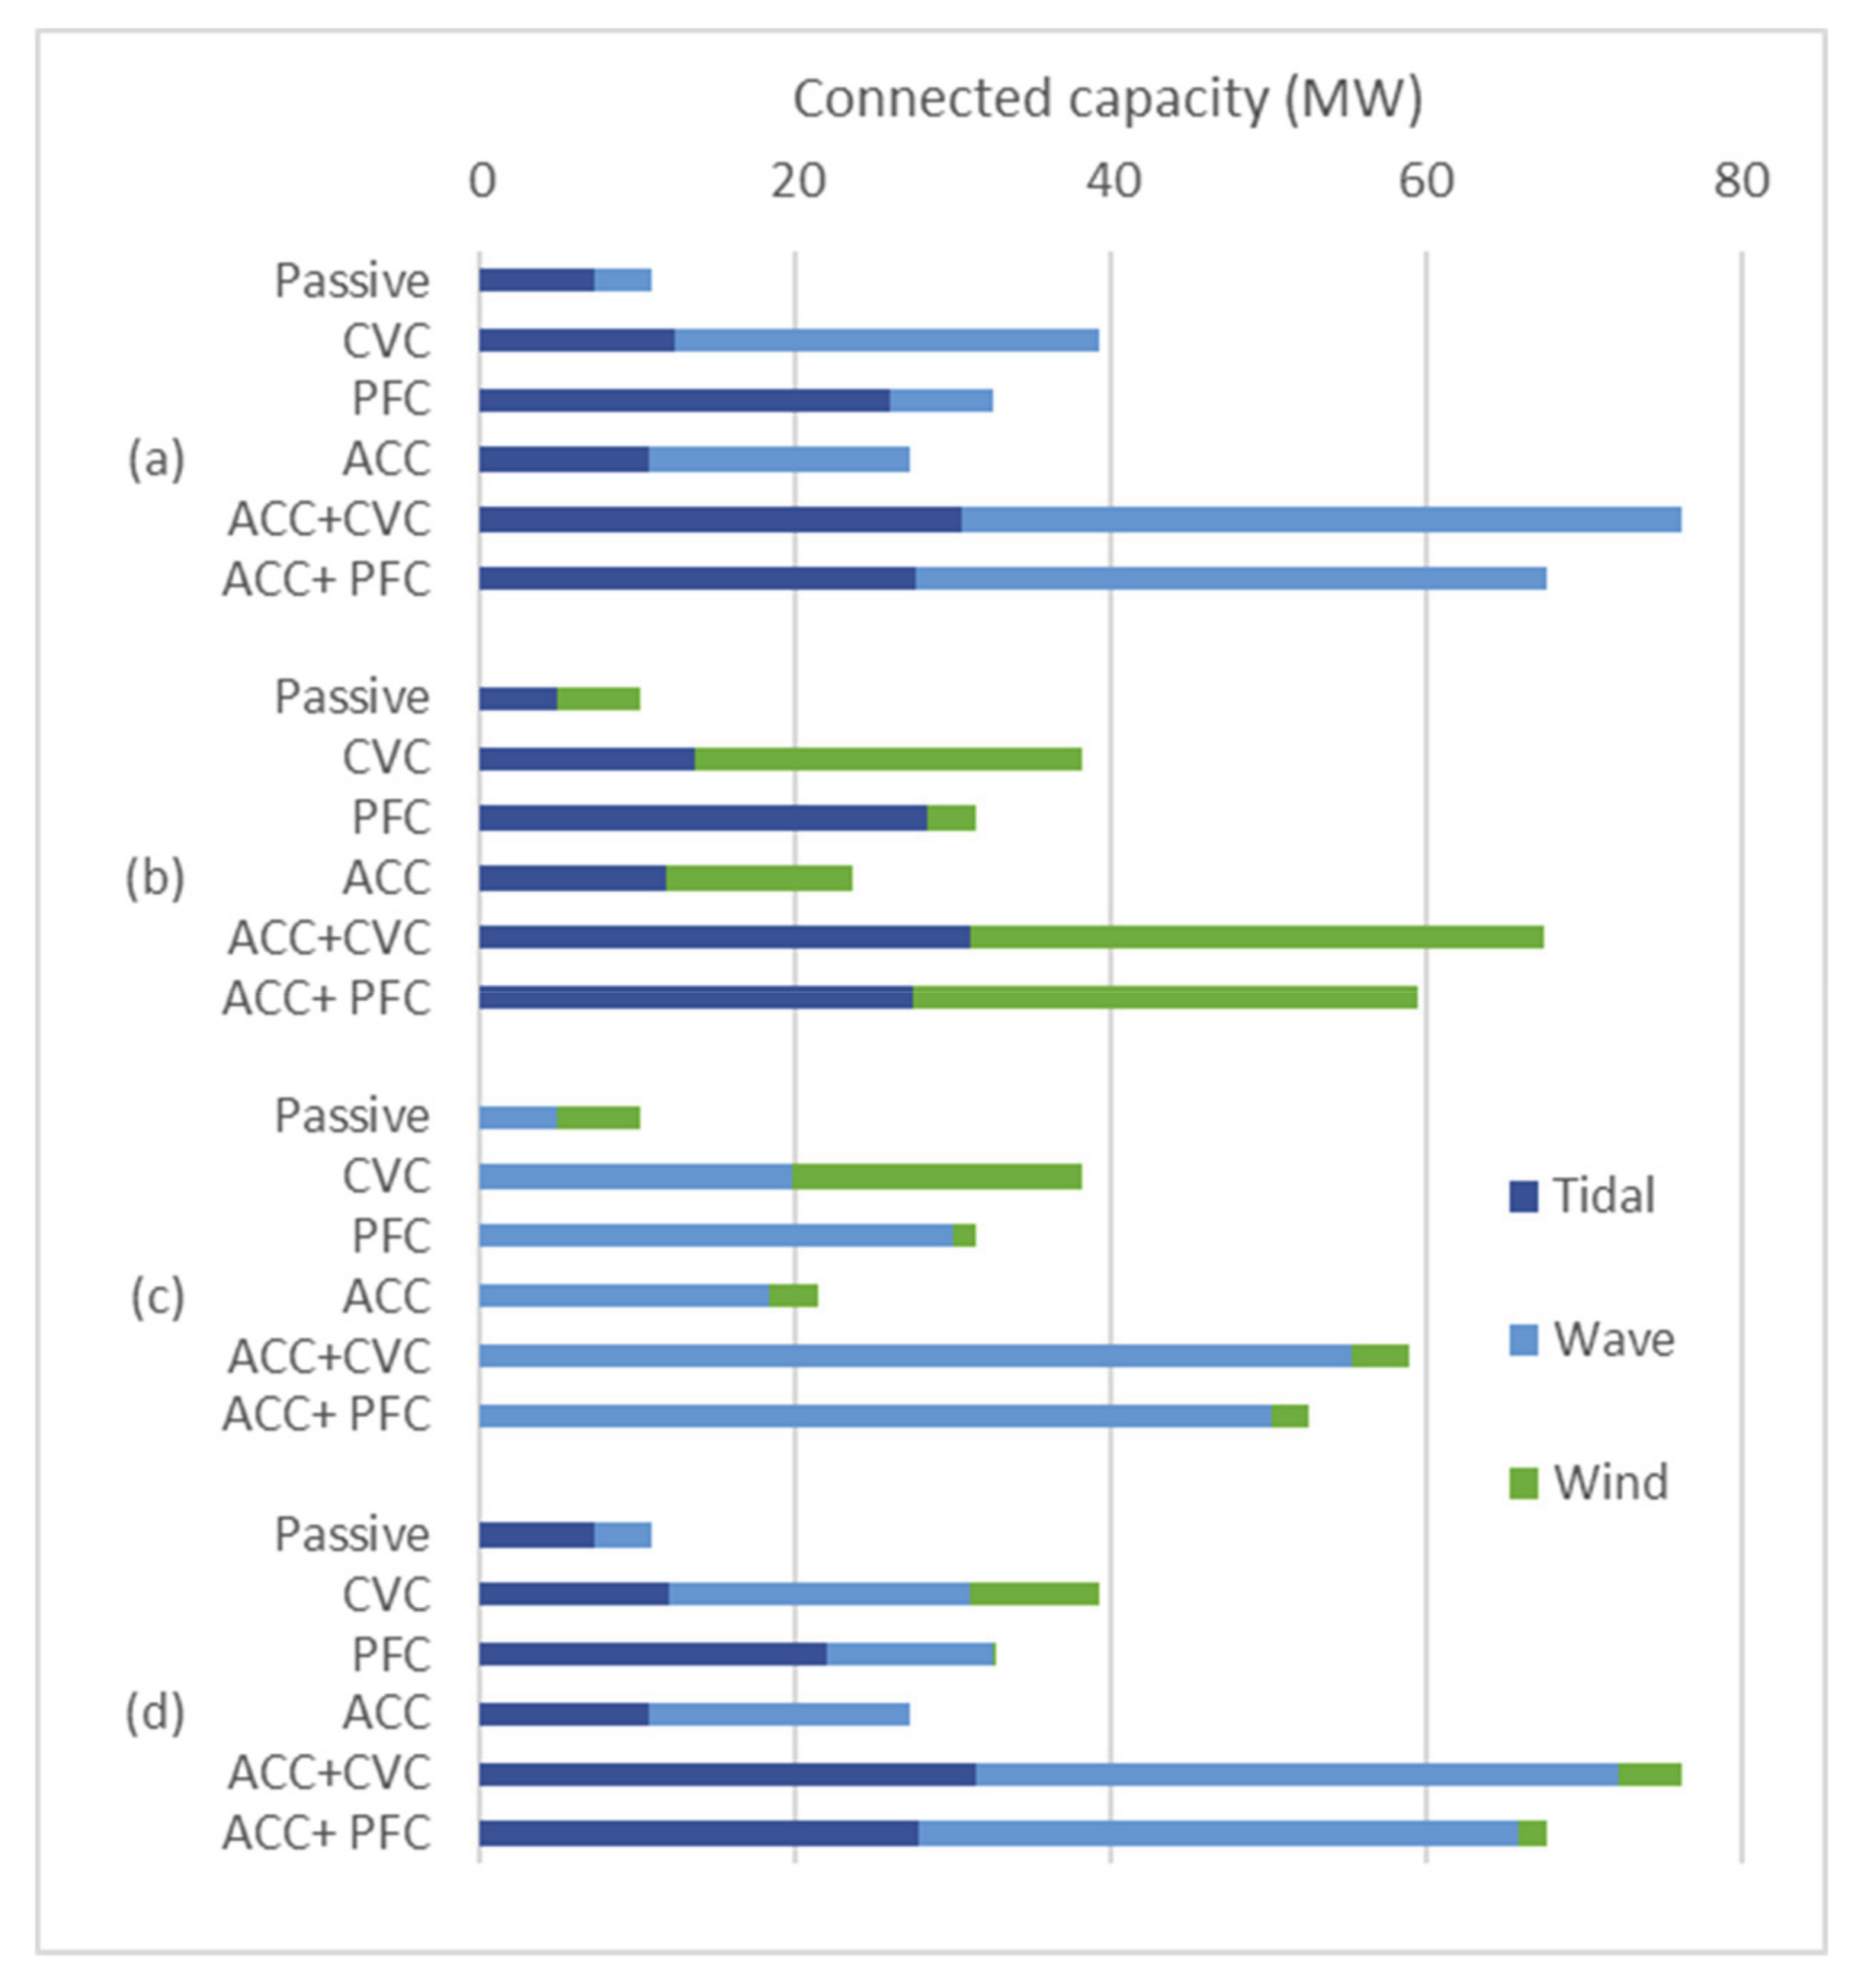
Figure 10 shows the considerable variation in capacity split between resources in each case. In the passive cases, the tidal + wind and wave + wind combinations had overall capacity that precisely matched that of the individual resources; in both cases the wind represented 52% of the overall capacity suggesting the wind profile had the critical characteristic as far as limiting the hosting capacity. There was a small (7%) capacity increase from connecting tidal + wave as the joint generation maximum never coincided with minimum demand; here the capacity split was 67% tidal meaning that the effective capacity factor was around 31%. The tidal + wave + wind case recorded an identical capacity split as no wind was allocated as this would introduce a further constraint due to the coincidence of maximum generation. The energy delivery from each combination was the weighted average of their resource capacity factors and all were lower than wind alone and higher than tidal alone. Overall, the passive network appeared to be unable to exploit resource complementarity: neither capacity nor energy delivery fundamentally increased relative to single resources cases.
With CVC and to a lesser extent PFC there were considerable increases in capacity relative to the passive cases delivering higher capacity factors and energy delivery. Both control schemes were again not able to fully exploit resource diversity as overall capacity increases were similar to single resource cases, although the tidal + wave and triple resource cases again had marginally higher capacity (2–4%). There was more variation in capacity split between cases. With CVC wind became relatively more significant in the tidal + wind case, marginally less in the wave + wind case and did considerably better in the tidal + wind and triple resource cases. Wave improved its share while tidal decreased in all cases. With PFC, tidal became more dominant with wind almost disappearing from the tidal + wind case and not featuring in the triple resource case. The network-wide approach of CVC facilitated greater exploitation of wind capacity than the more limited impact of PFC. The hosting capacity of hybrid resources in passive and CVC/PFC hybrid networks was limited by the same constraining factors that limit their single resource counterparts; the effect of CVC was clearly seen in
Figure 7b with the occurrence of the low voltages at the GSP OLTC.
The first major benefit of hybrid generation is seen in the ACC cases. Complementarity was found to support up to 60% increased capacity and energy delivery relative to single resource cases, particularly the tidal + wave case. The worst performing hybrid case (wave + wind) had slightly greater capacity than the highest for single resources (i.e., wave,
Table 5b) and its energy production was around 5% higher (
Table 6b). Interestingly, with the exception of the wave + wind case, all other cases produced more energy than the wind only case, albeit with considerably greater capacities. While the increase in capacity relative to the passive case was lower for ACC than for either the CVC or PFC case due to less effective management of voltage constraints, selective curtailment delivered capacities and energy production that were more balanced between resources (
Figure 10); wave capacity became dominant, particularly when combined with wind.
The combination of control schemes (ACC + CVC and ACC + PFC) facilitated greater exploitation of the complementarity observed between resources. Both sets of cases see a similar pattern of capacity split between resources with very balanced splits except in the triple resource and tidal+wind cases where there was, respectively, little or no wind. The capacity gains over single resource cases was again at most 60% (
Table 5b) with all but the wave + wind cases producing more energy than wind alone (
Table 6b). The most effective was combining ACC with CVC: with ACC suppressing the peaks of the wave profile and CVC managing voltage rise issues, the tidal + wave case made greater use of network line capacity than any other control configurations, pushing the average line loading closer to its full value (
Figure 9b). With ACC+PFC, voltage limits constrained the network more than other cases in
Figure 6 and inductive power factor limits were regularly met as the generators attempted to lower voltages.
While the capacity split between resources, as shown in
Figure 10, indicates complex variation between cases, it did allow indicative outcomes regarding complementarity among resource types. The less similar the profiles, the better the complementarity with higher total capacity and a more even split. Despite suggestions that wave and wind complementarity will smooth the power output on useful timescales due to offsets of a number of hours [
20], the regular co-occurrence of maximum generation levels here means their complementarity was lower. In the case of wave + wind, considerably more capacity was allocated to the wave whose profile sees fewer worst-case periods and benefits more from curtailment at peak output than wind. Alternatively, the combination of the more independent tidal resource with either wave or wind supported higher capacity and a more even allocation between generators due to the lower occurrence of high generation-low demand periods. Despite tidal + wind connecting less capacity than tidal + wave, the large fraction of wind supported the largest energy delivery of any case, almost 5 times more than the passive wind case (
Table 5b).
The cases with full hybrid (tidal + wave + wind) capacity replicated or rose slightly above the best capacity obtained from the two-resource cases. Capacity was mainly allocated to tidal and wave, and a small amount of wind capacity was only seen in the CVC, ACC + CVC and ACC + PFC cases (
Figure 10d). This was because the complementarity between tidal and wave was better than with wind and introducing wind added undesirable periods of constraints. As a result, in terms of delivered energy, the tidal + wave + wind case was outperformed by a two-resource combination in the ACC + CVC and ACC + PFC cases. Overall, compared with the best performing two-resource cases, there was little benefit seen from a combination of all three resources. Despite differences in capacity and energy delivery, the same trend in constraining factors applied to the tidal + wave + wind case regarding the effectiveness of control configurations: ACC + CVC reached voltage limits less than ACC + PFC (
Figure 6).
5. Discussion
As far as we know this is the first analysis to consider these specific resources with regard to hosting capacity analysis and demonstrated some benefit from resource complementarity in terms of exploiting network capacity and energy delivery and very considerable benefits from active network management.
The complementarity level among resource types determines the level of capacity that can be connected. The less similar the profiles are the better. Despite suggestions that wave and wind complementarity will smooth the power output on useful timescales [
20], offset from one another by a number of hours, this study finds the regular co-occurrence of both maximum generation levels would reduce the benefit from hybridisation. Instead, the combination of the independent tidal resource with either wave or wind supports higher capacity and energy delivery, due to their fewer occurrences of high generation-low demand periods.
The only comparator analysis is for solar and wind [
19], and although the location, networks and specifics of the analysis were different, some qualitative comparison is possible. This showed that solar and wind exhibited greater complementarity and a more significant benefit in terms of additional hosting capacity and energy delivery. Further work looking at a wider portfolio of renewables would therefore be valuable.
While the focus here was very much on network capacity, recognising the value of resource diversity is a matter not just of local diversity in an individual network, but also the effect of geographical diversity and the operational and planning impacts on the wider power system. This takes the value well beyond a view that more capacity is better towards a more nuanced assessment of efficiency in terms of energy per unit of capacity and value for money, particularly given the earlier developmental stage of tidal and wave. The application of this hybridisation involving tidal, wave and offshore wind depends on the development of effective tidal and wave generator arrays. While solar and wind currently offers a more mature alternative, for the best use of hosting capacity, renewable combinations should be based on their complementary characteristics and not simply their current industrial development.
There are a number of qualifications to the results that are worth stating. First, the analysis covers only a year of data, meaning that it does not capture interannual variations in overall resource levels nor the specific timings of each resource, which do vary from weather system to weather system. Some difference would be expected should a different year or longer period be used, although the fundamental principles will hold. The framework was well set up to do a longer analysis. Secondly, the resource levels and the statistical relationships between them will vary depending on the location being affected by local geography and large scale wind, wave and tidal forcings. It would be valuable to repeat the analysis at other locations to identify if the benefits of complementarity change particularly as the relative level of capacity factors varied. Thirdly, the specific topology of the network, local demand and the control systems will have a considerable impact on the local value of complementarity.
6. Conclusions
In this work, the complementary value of three local offshore renewable resources—tidal, wave and wind—for increasing network hosting capacity was evaluated. A generic AC OPF based hosting capacity model was established to find the maximum connectable capacity for multiple renewable resources. A scenario reduction technique was adapted to effectively consider long-term variation and complementarity of the renewables in the NLP optimisation model.
The novel introduction of three resource types to the hosting capacity evaluation saw a complex picture of increased network utilization through diversity. A second resource tended to increase network hosting capacity and energy delivery but there was little benefit seen from a combination of all three resources arising from co-occurrence of high generation with low demand that could not be fully overcome by active network management. The analysis confirms that traditional passive control schemes make inefficient use of network hosting capacity irrespective of the resource combination. Although all active network control schemes made substantially more effective use of the network, those involving active curtailment exploited coincidence characteristics among demand and multiple renewable types well. Without curtailment the value of complementarity is quite modest for this location although it should be emphasized that additional analysis was warranted to better understand the phenomenon.
In future work, integration options such as energy storage and demand response can be incorporated into the model to further assess the hosting capacity for the offshore renewable resources. Considering that grid integration of variable renewable generation could also cause issues with power quality, fault level and frequency, these technical challenges are worthy of further research.
