Toward a Survey-Based Assessment of Wind Turbine Noise: The Impacts on Wellbeing of Local Residents


 ,
,
Abstract
1. Introduction
2. Research Methodology
2.1. Study Setting and Framework
2.2. Questionnaire Development
3. Analysis and Discussion
3.1. Background Analysis
3.2. Exploratory Factor Analysis
3.3. Reliability Assessment
3.4. Validity Assessment
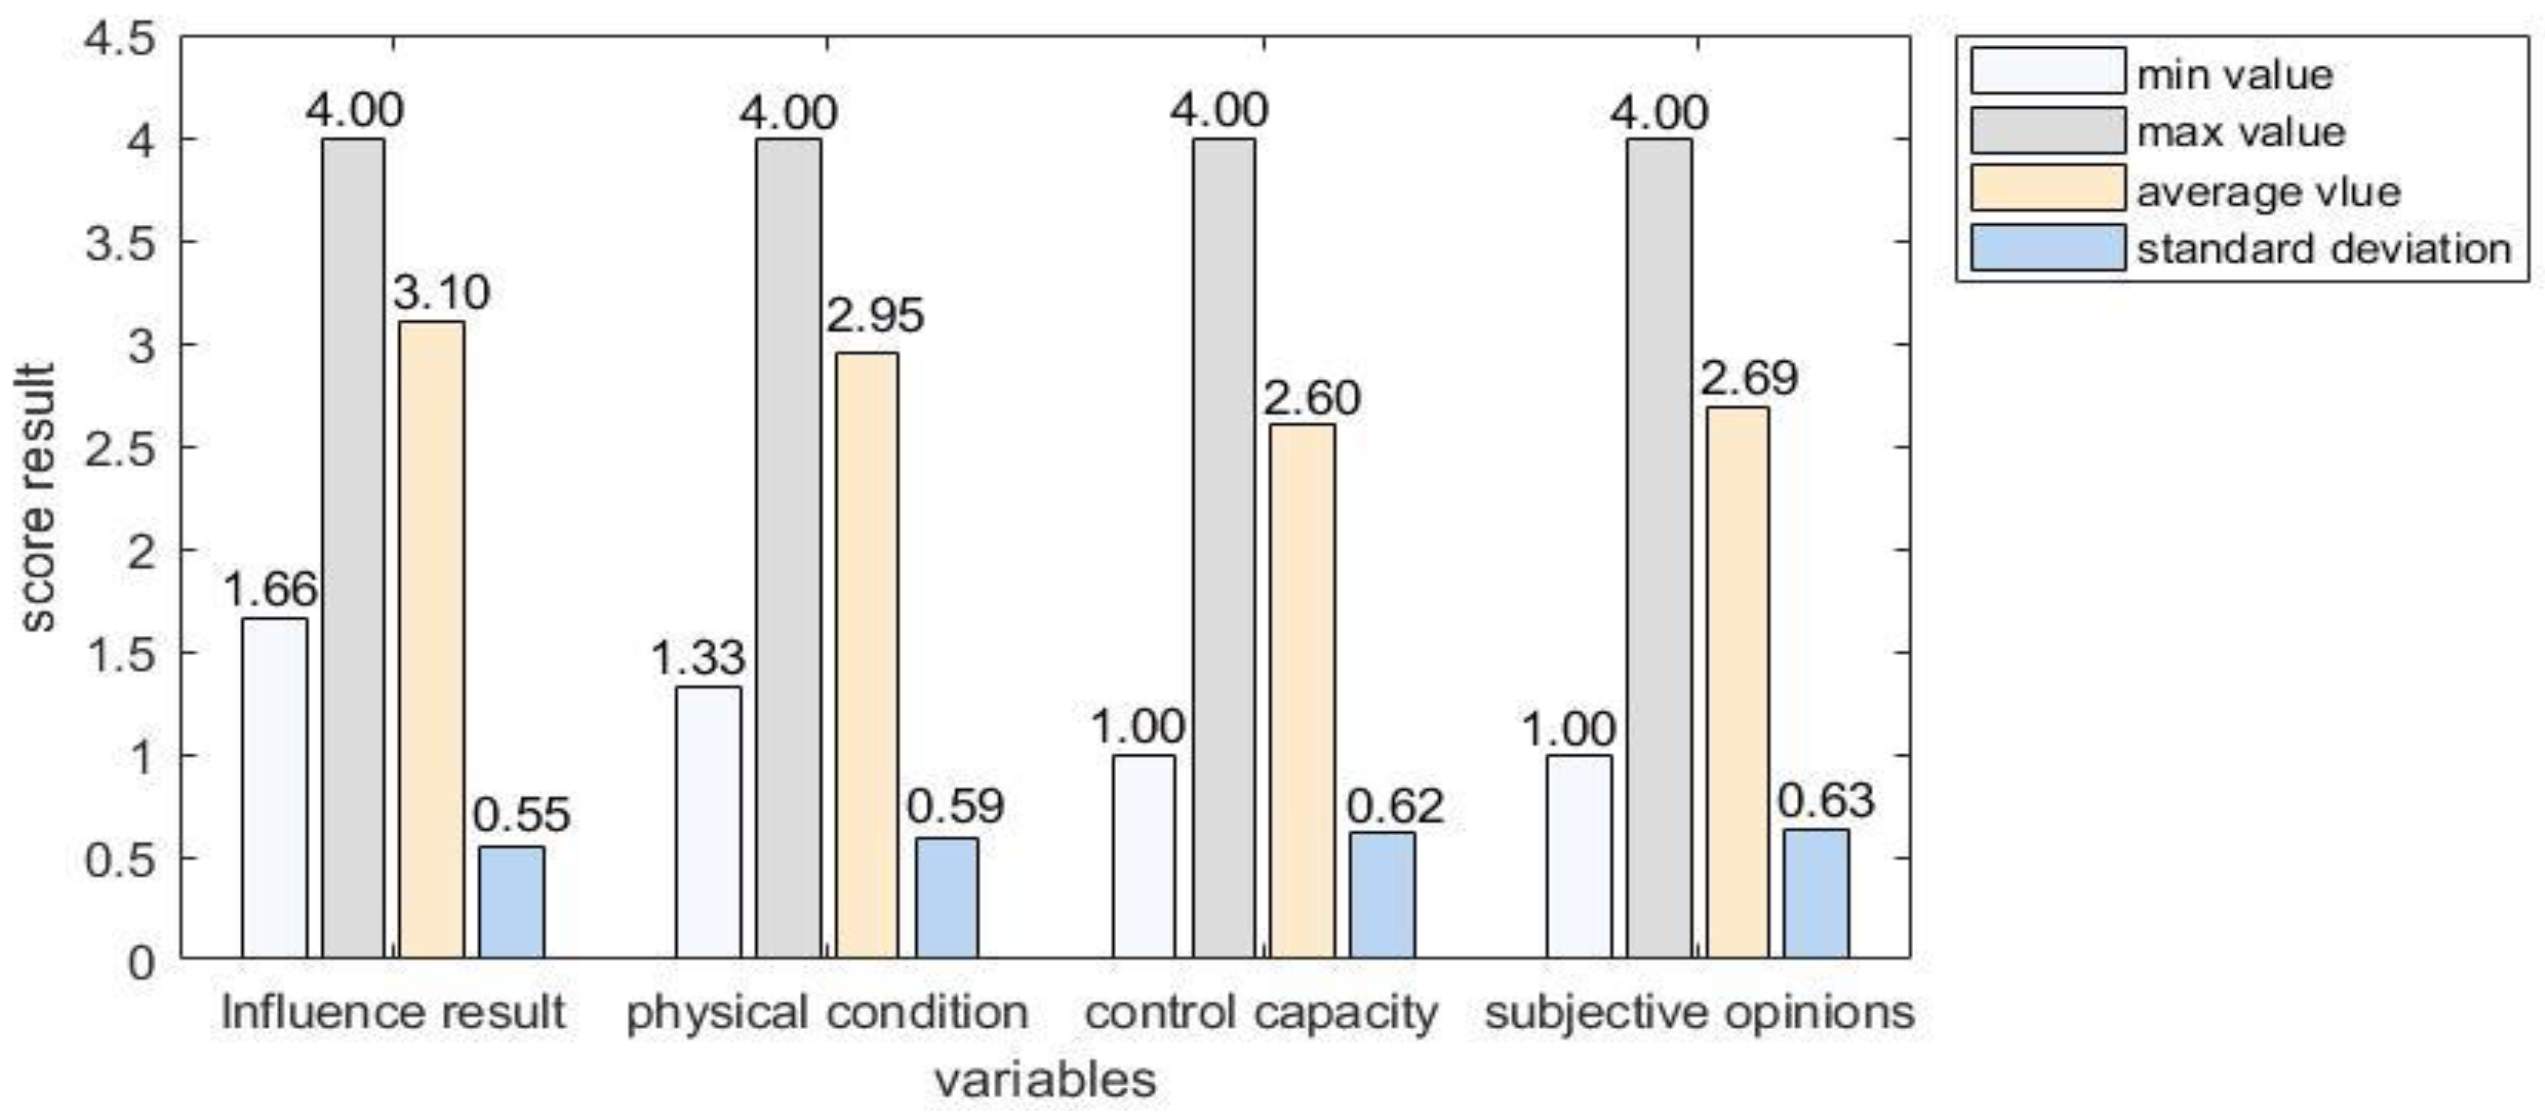
3.5. Descriptive Analysis
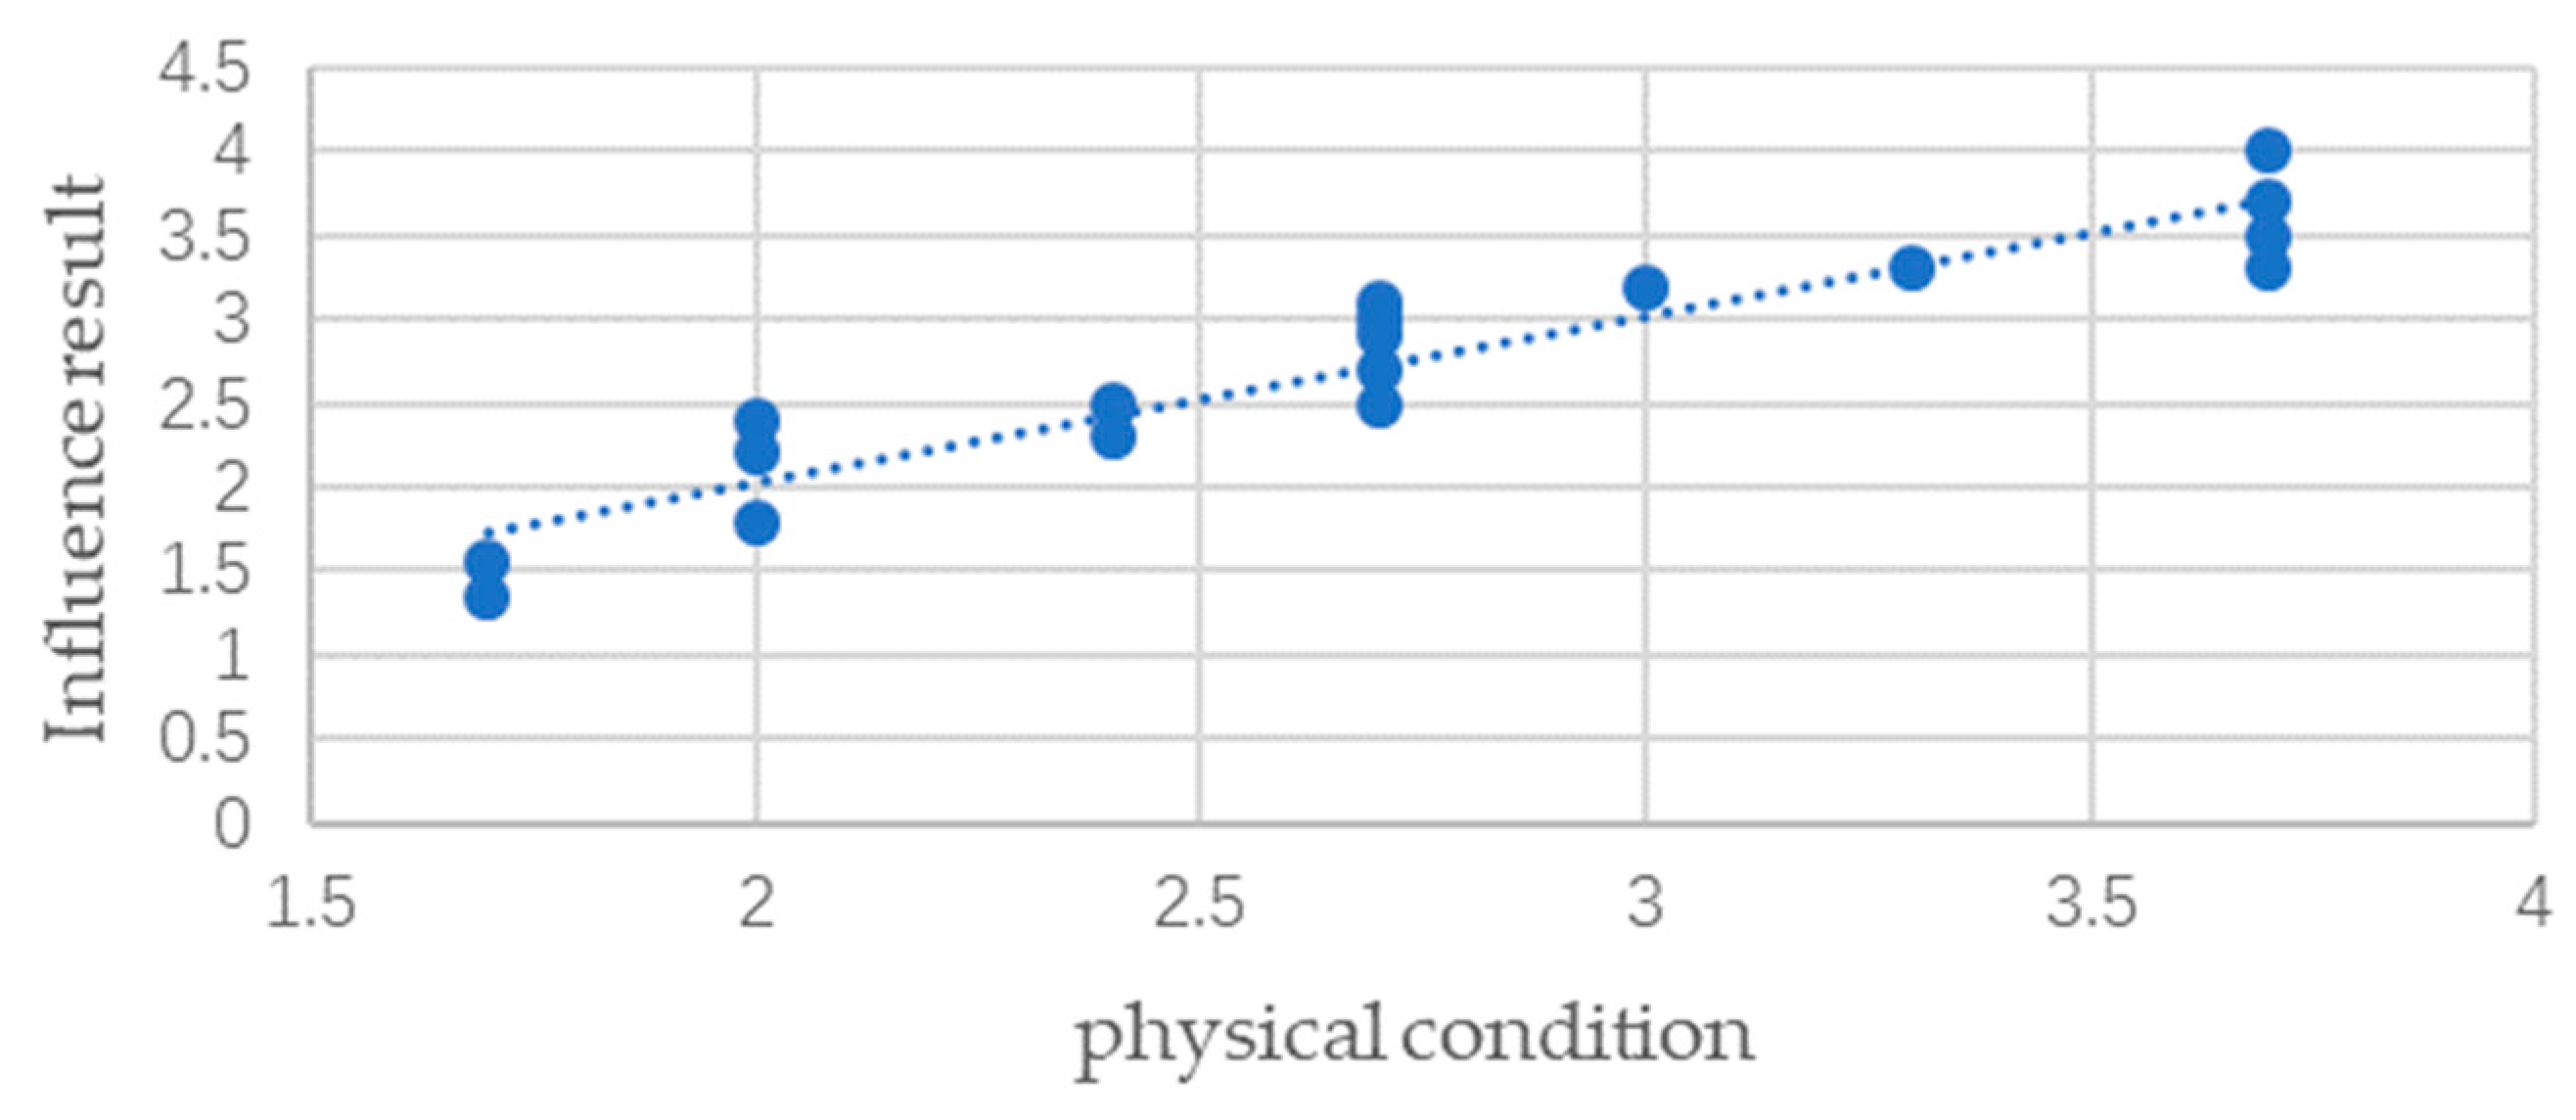
3.6. Correlation Analysis
3.7. Regression Analysis
4. Conclusions and Future Studies
Author Contributions
Funding
Acknowledgments
Conflicts of Interest
Nomenclature
| A | answer |
| cov | covariance |
| CITC | corrected item-total correlation |
| DOF | degrees of freedom |
| E | mathematical expectation value |
| residual | |
| EFA | exploratory factor analysis |
| corresponding model prediction values | |
| common factor variance (common degree) | |
| K | number of items in the questionnaire |
| KMO-value | simple correlation coefficients between comparison variables |
| factor loading matrix | |
| P | statistical significance |
| PCA | principal component analysis |
| Q | question |
| determination coefficient | |
| intra-question variance of the score for each item | |
| SPSSAU | statistical product and service software automatically |
| summation of squares | |
| regression summation of squares | |
| summation of squared residuals | |
| the total score variance of all items. | |
| tr(R) | the trace of the correlation matrix |
| VIF | variance inflation factor |
| mean observation value | |
| data set | |
| Pearson correlation coefficients | |
| eigenvalue of the sample correlation coefficient matrix | |
| standard orthogonal feature vector |
Appendix A

| Questions | Item Content with Response Results |
|---|---|
| Pre-Experiments | |
| Q1 A1 | The condition of your body at this moment? A. very poor (0) B. poor (9) C. good (109) D. perfect (50) |
| Q2 A2 | Your hearing status in the current environment? A. very poor (0) B. poor (3) C. good (106) D. perfect (59) |
| Q3 A3 | You can control your annoyances when exposed in a noisy environment. A. disagree (0) B. neutral (9) C. agree (109) D. strongly agree (50) |
| Q4 A4 | Can you please endure the influence of noise in your daily life? A. absolutely no (2) B. less (73) C. neutral (87) D. significant (6) |
| Q5 A5 | Your attitude on wind turbine deployment around residential zones? A. very negative (3) B. negative (73) C. positive (65) D. very positive (27) |
| Q6 A6 | Do you get angry when you are exposed in noise in your daily life? A. extremely (2) B. a little (28) C. neutral (120) D. no at all (18) |
| Q7 A7 | Do you agree that wind turbine noise is a kind of hazard? A. agree (22) B. neutral (94) C. to some extent (33) D. disagree (19) |
| After-Experiments | |
| Q8 A8 | Did you feel dizzy during the testing? A. strongly agree (0) B. agree (4) C. to some extent (45) D. not at all (119) |
| Q9 A9 | How did you feel about your hearing at this moment? A. very poor (0) B. poor (10) C. good (117) D. perfect (41) |
| Q10 A10 | Did you feel annoyed during the noise testing? A. extremely (1) B. a little (4) C. normal (75) D. no at all (88) |
| Q11 A11 | How did you feel about your mental state at this moment? A. very poor (3) B. poor (14) C. normal (125) D. good (26) |
| Q12 A12 | Your attitude wind energy harvesting at this moment? A. very negative (3) B. negative (35) C. positive (104) D. very positive (26) |
| Q13 A13 | Do you agree that wind turbine noise is a kind of hazard after the testing? A. agree (30) B. neutral (21) C. to some extent (87) D. disagree (30) |
References
- Renewables 2019 Global Status Report. Available online: http://www.globalwomennet.org/wp-content/uploads/2019/06/gsr_2019_full_report_en.pdf (accessed on 10 April 2020).
- Qin, H.; Li, Y. Wind Power in China: Current State and Future Outlook. In Annual Report on China’s Response to Climate Change (2017); Wang, W., Liu, Y., Eds.; Springer: Singapore, 2020; pp. 111–127. [Google Scholar]
- IEA. Renewables 2018, IEA, Paris. Available online: https://www.iea.org/reports/renewables-2018 (accessed on 10 April 2020).
- van Kamp, I.; van den Berg, F. Health effects related to wind turbine sound, including low-frequency sound and infrasound. Acoust. Aust. 2018, 46, 31–57. [Google Scholar] [CrossRef]
- Poulsen, A.H.; Raaschou-Nielsen, O.; Peña, A.; Hahmann, A.N.; Nordsborg, R.B.; Ketzel, M.; Brandit, J.; Sørensen, M. Impact of long-term exposure to wind turbine noise on redemption of sleep medication and antidepressants: A nationwide cohort study. Environ. Health Perspect. 2019, 127, 1–9. [Google Scholar] [CrossRef]
- Abbasi, M.; Monazzam, M.R.; Akbarzadeh, A.; Zakerian, S.A.; Ebrahimi, M.H. Impact of wind turbine sound on general health, sleep disturbance and annoyance of workers: A pilot-study in Manjil wind farm, Iran. J. Environ. Health Sci. Eng. 2015, 13, 71. [Google Scholar] [CrossRef] [PubMed]
- Michaud, D.S.; Feder, K.; Keith, S.E.; Voicescu, S.A. Exposure to wind turbine noise: Perceptual responses and reported health effects. J. Acoust. Soc. Am. 2016, 139, 1443–1454. [Google Scholar] [CrossRef] [PubMed]
- Onakpoya, I.J.; O’Sullivan, J.; Thompson, M.J.; Heneghan, C.J. The effect of wind turbine noise on sleep and quality of life: A systematic review and meta-analysis of observational studies. Environ. Int. 2015, 82, 1–9. [Google Scholar] [CrossRef] [PubMed]
- Van Renterghem, T.; Bockstael, A.; De Weirt, V.; Botteldooren, D. Annoyance, detection and recognition of wind turbine noise. Sci. Total Environ. 2013, 456, 333–345. [Google Scholar] [CrossRef]
- Kurpas, D.; Mroczek, B.; Karakiewicz, B.; Kassolik, K.; Andrzejewski, W. Health impact of wind farms. Ann. Agric. Environ. Med. 2013, 20, 595–604. [Google Scholar]
- Devine-Wright, P. Beyond NIMBYism: Towards an integrated framework for understanding public perceptions of wind energy. Wind Energy: Int. J. Prog. Appl. Wind Power Convers. Technol. 2005, 8, 125–139. [Google Scholar] [CrossRef]
- Schäffer, B.; Pieren, R.; Hayek, U.W.; Biver, N.; Grêt-Regamey, A. Influence of visibility of wind farms on noise annoyance–A laboratory experiment with audio-visual simulations. Landsc. Urban Plan. 2019, 186, 67–78. [Google Scholar] [CrossRef]
- Pawlaczyk-Łuszczyńska, M.; Dudarewicz, A.; Zaborowski, K.; Zamojska-Daniszewska, M.; Waszkowska, M. Annoyance related to wind turbine noise. Arch. Acoust. 2014, 39, 89–102. [Google Scholar] [CrossRef]
- Radun, J.; Hongisto, V.; Suokas, M. Variables associated with wind turbine noise annoyance and sleep disturbance. Build. Environ. 2019, 150, 339–348. [Google Scholar] [CrossRef]
- Leventhall, G. Low Frequency Noise. What we know, what we do not know, and what we would like to know. Journal of Low Frequency Noise. Vib. Act. Control. 2009, 28, 79–104. [Google Scholar]
- Arezes, P.M.; Bernardo, C.A.; Ribeiro, E.; Dias, H. Implications of wind power generation: Exposure to wind turbine noise. Procedia-Soc. Behav. Sci. 2014, 109, 390–395. [Google Scholar] [CrossRef]
- Moorhouse, A.T.; Waddington, D.C.; Adams, M.D. Proposed Criteria for the Assessment of Low Frequency Noise Disturbance. Available online: http://usir.salford.ac.uk/id/eprint/491/1/NANR45-criteria__rev1_23_12_2011_(2).pdf (accessed on 10 April 2020).
- Pedersen, E.; Van den Berg, F.; Bakker, R.; Bouma, J. Can road traffic mask sound from wind turbines? Response to wind turbine sound at different levels of road traffic sound. Energy Policy 2010, 38, 2520–2527. [Google Scholar] [CrossRef]
- Maffei, L.; Iachini, T.; Masullo, M.; Aletta, F.; Sorrentino, F.; Senese, V.P.; Ruotolo, F. The effects of vision-related aspects on noise perception of wind turbines in quiet areas. Int. J. Environ. Res. Public Health 2013, 10, 1681–1697. [Google Scholar] [CrossRef] [PubMed]
- Norris, M.; Lecavalier, L. Evaluating the use of exploratory factor analysis in developmental disability psychological research. J. Autism Dev. Disord. 2010, 40, 8–20. [Google Scholar] [CrossRef]
- Lever, J.; Krzywinski, M.; Altman, N. Points of significance: Principal component analysis. Nat. Methods 2017, 14, 641–642. [Google Scholar] [CrossRef]
- Yong, A.G.; Pearce, S. A beginner’s guide to factor analysis: Focusing on exploratory factor analysis. Tutor. Quant. Methods Psychol. 2013, 9, 79–94. [Google Scholar] [CrossRef]
- Cattell, R.B. The scree test for the number of factors. Multivar. Behav. Res. 1966, 1, 245–276. [Google Scholar] [CrossRef]
- Taherdoost, H. Validity and Reliability of the Research Instrument; How to Test the Validation of a Questionnaire/Survey in a Research. Available online: https://ssrn.com/abstract=3205040 (accessed on 10 April 2020). [CrossRef]
- Chi, C.G.Q.; Qu, H. Examining the structural relationships of destination image, tourist satisfaction and destination loyalty: An integrated approach. Tour. Manag. 2008, 29, 624–636. [Google Scholar] [CrossRef]
- Glynn, S.M.; Brickman, P.; Armstrong, N.; Taasoobshirazi, G. Science Motivation Questionnaire II: Validation with Science Majors and Nonscience Majors. J. Res. Sci. Teach. 2011, 48, 1159–1176. [Google Scholar] [CrossRef]
- Moghaddam, M.B.; Aghdam, F.B.; Jafarabadi, M.A.; Allahverdipour, H.; Nikookheslat, S.D.; Safarpour, S. The Iranian Version of International Physical Activity Questionnaire (IPAQ) in Iran: Content and construct validity, factor structure, internal consistency and stability. World Appl. Sci. J. 2012, 18, 1073–1080. [Google Scholar]
- MacCallum, R.C.; Zhang, S.; Preacher, K.J.; Rucker, D.D. On the practice of dichotomization of quantitative variables. Psychol. Methods 2002, 7, 19. [Google Scholar] [CrossRef]
- De Winter, J.C.; Gosling, S.D.; Potter, J. Comparing the Pearson and Spearman correlation coefficients across distributions and sample sizes: A tutorial using simulations and empirical data. Psychol. Methods 2016, 21, 273. [Google Scholar] [CrossRef]
- Chok, N.S. Pearson’s Versus Spearman’s and Kendall’s Correlation Coefficients for Continuous Data. Master’s Thesis, University of Pittsburgh, Pittsburgh, PA, USA, 2010. [Google Scholar]
- Tonidandel, S.; LeBreton, J.M. Relative importance analysis: A useful supplement to regression analysis. J. Bus. Psychol. 2011, 26, 1–9. [Google Scholar] [CrossRef]
- Nimon, K.F.; Oswald, F.L. Understanding the results of multiple linear regression: Beyond standardized regression coefficients. Organ. Res. Methods 2013, 16, 650–674. [Google Scholar] [CrossRef]
- Wooldridge, J.M. Introductory Econometrics: A Modern Approach, 6th ed.; Cengage Learning: Melbourne, Australia, 2016. [Google Scholar]
- Glantz, S.A.; Slinker, B.K.; Neilands, T.B. Primer of Applied Regression and Analysis of Variance; McGraw-Hill: New York, NY, USA, 1990. [Google Scholar]
- Devore, J.L. Probability and Statistics for Engineering and the Sciences, 8th ed.; Cengage Learning: Melbourne, Australia, 2011. [Google Scholar]
- Altman, N.; Krzywinski, M. Points of significance: P values and the search for significance. Nat. Methods 2017, 14, 3–4. [Google Scholar] [CrossRef]


| KMO | 0.851 | |
|---|---|---|
| Bartlett test | Approx. Chi-Square | 1452.580 |
| DOF | 21 | |
| p-value | 0.000 | |
| Factor | Eigen Values | % of Variance (Unrotated) | % of Variance (Rotated) | ||||||
|---|---|---|---|---|---|---|---|---|---|
| Eigen | % of Variance | Cum.% of Variance | Eigen | % of Variance | Cum.% of Variance | Eigen | % of Variance | Cum.% of Variance | |
| 1 | 5.481 | 78.295 | 78.295 | 5.481 | 78.295 | 78.295 | 2.359 | 33.699 | 33.699 |
| 2 | 0.603 | 8.614 | 86.909 | 0.603 | 8.614 | 86.909 | 2.346 | 33.519 | 67.218 |
| 3 | 0.551 | 7.296 | 94.204 | 0.511 | 7.296 | 94.204 | 1.889 | 26.986 | 94.204 |
| 4 | 0.157 | 2.243 | 96.447 | - | - | - | - | - | - |
| 5 | 0.103 | 1.468 | 97.915 | - | - | - | - | - | - |
| 6 | 0.085 | 1.214 | 99.129 | - | - | - | - | - | - |
| 7 | 0.061 | 0.871 | 100.000 | - | - | - | - | - | - |
| Variable | Items | Corrected Item-Total Correlation (CITC) | Cronbach α if Item Was Deleted | Cronbach α |
|---|---|---|---|---|
| Influence results | Q8 | 0.728 | 0.921 | 0.926 |
| Q9 | 0.815 | 0.912 | ||
| Q10 | 0.751 | 0.917 | ||
| Q11 | 0.833 | 0.908 | ||
| Q12 | 0.901 | 0.896 | ||
| Q13 | 0.864 | 0.918 | ||
| Physical condition | Q1 | 0.911 | 0.831 | 0.912 |
| Q2 | 0.848 | 0.887 | ||
| Q7 | 0.873 | 0.920 | ||
| Subjective opinions | Q3 | 0.809 | 0.928 | 0.936 |
| Q5 | 0.892 | 0.904 | ||
| Q6 | 0.892 | 0.912 | ||
| Q7 | 0.869 | 0.921 | ||
| Control capacity | Q3 | 0.894 | - | 0.936 |
| Q4 | 0.894 | - |
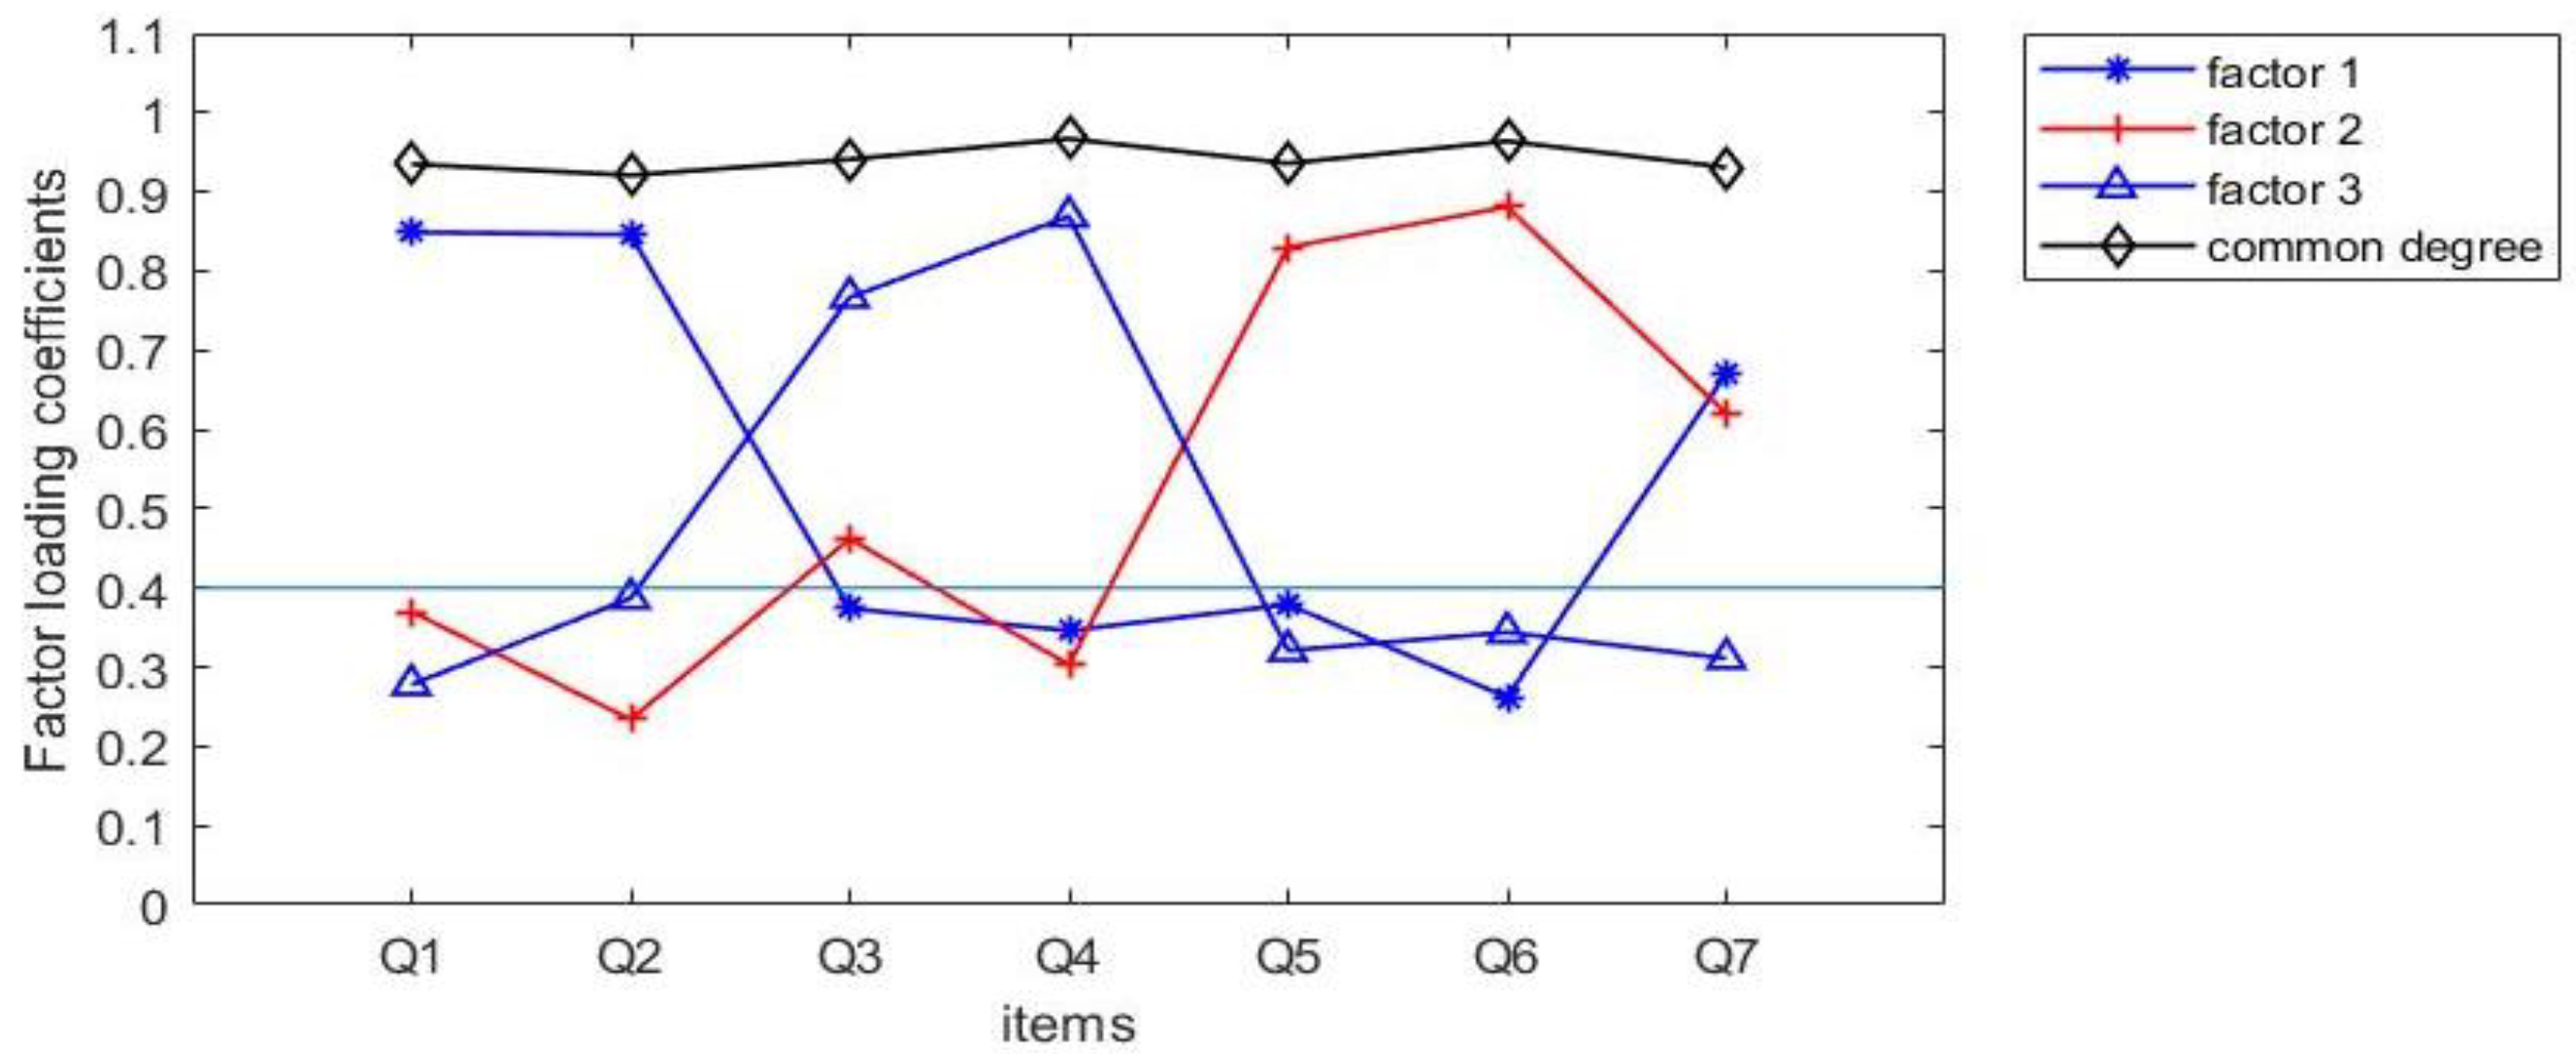
| Items | Factor Loading | Communalities | ||
|---|---|---|---|---|
| Factor 1 | Factor 2 | Factor 3 | ||
| Q1 | 0.849 | 0.370 | 0.278 | 0.933 |
| Q2 | 0.846 | 0.234 | 0.387 | 0.927 |
| Q3 | 0.374 | 0.462 | 0.767 | 0.931 |
| Q4 | 0.346 | 0.303 | 0.869 | 0.955 |
| Q5 | 0.379 | 0.830 | 0.321 | 0.938 |
| Q6 | 0.262 | 0.881 | 0.344 | 0.972 |
| Q7 | 0.680 | 0.620 | 0.311 | 0.947 |
| Eigen values (Unrotated) | 5.481 | 0.603 | 0.511 | - |
| % of Variance (Unrotated) | 78.295% | 8.614% | 7.296% | - |
| Cumulative % (Unrotated) | 78.295% | 86.909% | 94.204% | - |
| Eigen values (Rotated) | 2.39 | 2.346 | 1.889 | - |
| % of Variance (Rotated) | 33.699% | 33.519% | 26.986% | - |
| Cumulative % (Rotated) | 33.699% | 67.218% | 94.204% | - |
| KMO | 0.851 | - | ||
| Bartlett Test of Sphericity | 1452.580 | - | ||
| DOF | 21 | - | ||
| p-value | 0.000 | - | ||
| Influence | |
|---|---|
| Physical condition | 0.912 ** |
| Control capability | 0.855 ** |
| Subjective opinions | 0.960 ** |
| Regression Coefficient | VIF Value | |
|---|---|---|
| Constant | 0.642 | - |
| Physical condition | 0.246 | 5.172 |
| Control capacity | 0.080 | 4.112 |
| Subjective opinions | 0.566 | 8.512 |
| 0.936 | ||
| F-value | F (3.164) = 800.389; p = 0.000 ** | |
| Dependent variable: Influence results | ||
Publisher’s Note: MDPI stays neutral with regard to jurisdictional claims in published maps and institutional affiliations. |
© 2020 by the authors. Licensee MDPI, Basel, Switzerland. This article is an open access article distributed under the terms and conditions of the Creative Commons Attribution (CC BY) license (http://creativecommons.org/licenses/by/4.0/).
Share and Cite
Liao, L.; Ling, Y.; Huang, B.; Zhou, X.; Luo, H.; Xie, P.; Wu, Y.; Huang, J. Toward a Survey-Based Assessment of Wind Turbine Noise: The Impacts on Wellbeing of Local Residents. Energies 2020, 13, 5845. https://doi.org/10.3390/en13215845
Liao L, Ling Y, Huang B, Zhou X, Luo H, Xie P, Wu Y, Huang J. Toward a Survey-Based Assessment of Wind Turbine Noise: The Impacts on Wellbeing of Local Residents. Energies. 2020; 13(21):5845. https://doi.org/10.3390/en13215845
Chicago/Turabian StyleLiao, Lida, Yuliang Ling, Bin Huang, Xu Zhou, Hongbo Luo, Peiling Xie, Ying Wu, and Jialiang Huang. 2020. "Toward a Survey-Based Assessment of Wind Turbine Noise: The Impacts on Wellbeing of Local Residents" Energies 13, no. 21: 5845. https://doi.org/10.3390/en13215845
APA StyleLiao, L., Ling, Y., Huang, B., Zhou, X., Luo, H., Xie, P., Wu, Y., & Huang, J. (2020). Toward a Survey-Based Assessment of Wind Turbine Noise: The Impacts on Wellbeing of Local Residents. Energies, 13(21), 5845. https://doi.org/10.3390/en13215845