1. Introduction
The efficient use of energy is one of the key factors of success for economies operating in modern economic conditions. The energy sector produces fuels and electricity for other industries to consume and thus it is important to support development in the energy sector. Eco-efficient and stable supply of energy resources is fundamental to both energy security and sustainable development. Therefore, energy security becomes a priority for many countries and events that take place in the world energy market once again confirm that energy security is an urgent issue facing the world. Due to globalization, energy security concerns cannot be addressed solely by only one country. Global energy security means more than just access to affordable energy that has minimal impact on the environment. It is concerned with the protection of the global economy from potential threats such as political and socio-economic destabilization.
In response to the reduction in oil and gas supply, industrialized countries seek ways to effectively use and expand their resource base and improve energy technologies. Consequently, projects that focus on liquefied gas and alternative energy become increasingly popular [
1]. Strategies of current interest are concerned with the production of gas hydrates, heavy oils, and technology-intensive innovative energy that is expected to cost less due to the use of innovative energy carriers. Innovations in the energy sector eventually will change the energy landscape. At present, the energy technology competition between technology leaders is intensifying [
2].
Between 2014 and 2016, the world witnessed an oil price war between the world’s major oil producers (Organization of the Petroleum Exporting Countries (OPEC), led by Saudi Arabia, Russia, and the US). Those oil companies competed with each other for market shares in the global oil market while seeking to maintain the high rates of oil production. This business plan was in line with the principles of neo-mercantilism and it had its consequences such as the oil price decline and reduction in oil revenue [
3]. Over the past decade, the energy sector has experienced one of the biggest changes, which is related to how and where hydrocarbon extraction is performed [
4,
5].
The current literature proposes an integrated methodology based on strengths, weaknesses, opportunities, and threats (SWOT) analysis, analytic hierarchy process (AHP), and fuzzy technique for order performance by similarity to ideal solution (F-TOPSIS) to evaluate energy strategies. The results of the evaluation show that using coal for electricity generation is the least preferred energy strategy [
6]. The challenges affecting the successful implementation of energy strategies include transportation of energy by tanker [
7] and energy price fixation by oil and gas cartels [
8]. One of the key powers in the Middle East that has been in turmoil is Syria. While ethnic and religious differences are considered to be the main source of conflict in the Middle East, one should not rule out the presence of energy conflicts [
9].
The external aspects of energy security constitute a dispute in the European Union (EU) [
10,
11]. After withdrawing from the Paris Climate Agreement and lifting the ban on crude oil export, the US shifted its priorities away from energy security to energy domination [
12,
13]. Russia’s energy policies, on the other hand, tend to emphasize technical objectives, rather than abstract, cohesive goals. Although this approach can prevent fundamental structural changes in the Russian energy sector, it also hinders the potential of renewable energy production, especially in the Arctic regions [
14]. Turkey is the fastest-growing energy market among The Organisation for Economic Co-operation and Development (OECD) countries. Therefore, Turkey is an attractive market for energy companies, and it is often engaged in energy wars [
15]. The energy policy of the Visegrad Group states ((V4): Poland, Czech Republic, Slovakia, and Hungary) is dependent on energy imports, increasing environmental pressure, and insufficient and disappointing process of energy policy Europeanisation. Therefore, the energy security of V4 states should be improved by deepening energy cooperation with partners from southern regions, in particular with the Middle East & North Africa (MENA) region [
16,
17]. To implement renewable energy strategies, to achieve and surpass the set goals with continued advances in renewable energy in the Baltic States, a certain degree of social awareness, perception, and acceptance is required [
18].
The coronavirus (COVID-19) pandemic outbreak created uncertainty and destabilized the world energy economy, increasing financial market volatility. The oil price reaction to COVID-19 gradually accommodated until March 2020, when, 49 days after the release of the first coronavirus monitoring report by the World Health Organization (WHO), Saudi Arabia flooded the market with oil. As a result, international prices dropped more than 20% in one single day [
19,
20].
Given all of the above, it seems that today, the co-dependence between energy producers, consumers, and transporters becomes increasingly stronger. Hence, a single participant in the energy market can affect other players. This puts the global energy sector at great risk [
21]. The main way to prevent negative consequences is to improve energy security. The modern energy market, however, requires participants to build relationships in order to prevent conflicts and enter geopolitical competition. From this perspective, the aim of this work is to identify the potential initiators of energy wars and determine their boundaries of influence through the prism of energy dependency.
In order to achieve this goal, several tasks are to be done:
Analysis of energy wars prerequisites by studying the world energy supply, consumption, and production in previous years;
Determination of the current level of energy dependence in the studied countries by constructing an energy dependence matrix;
Identification of energy dependence indicators and definition of their possible deviations and threshold values to make the energy dependence forecast.
2. Materials and Methods
This study addresses factors that can confirm the impact of energy wars on the economic development of countries. There were two types of indicators used in the factor analysis: dependent indicators and independent indicators. The dependent indicators are import quota, energy intensity, and energy consumption per capita. The independent indicators include Gross Domestic Product (GDP) per capita, energy production per capita, resource consumption per capita, resource imports per capita, industrial production per capita, exports per capita; and energy intensity.
The homogeneous sample of countries with a similar normative division of labor was evaluated through correlation-regression analysis. For this, the coefficient of variation (CV) of each factor was calculated. The results are expected to be less than 33%. To check the second condition, the three-sigma rule was used, according to which the maximum three-sigma value should be less than
and the minimum three-sigma value should be less than
[
22].
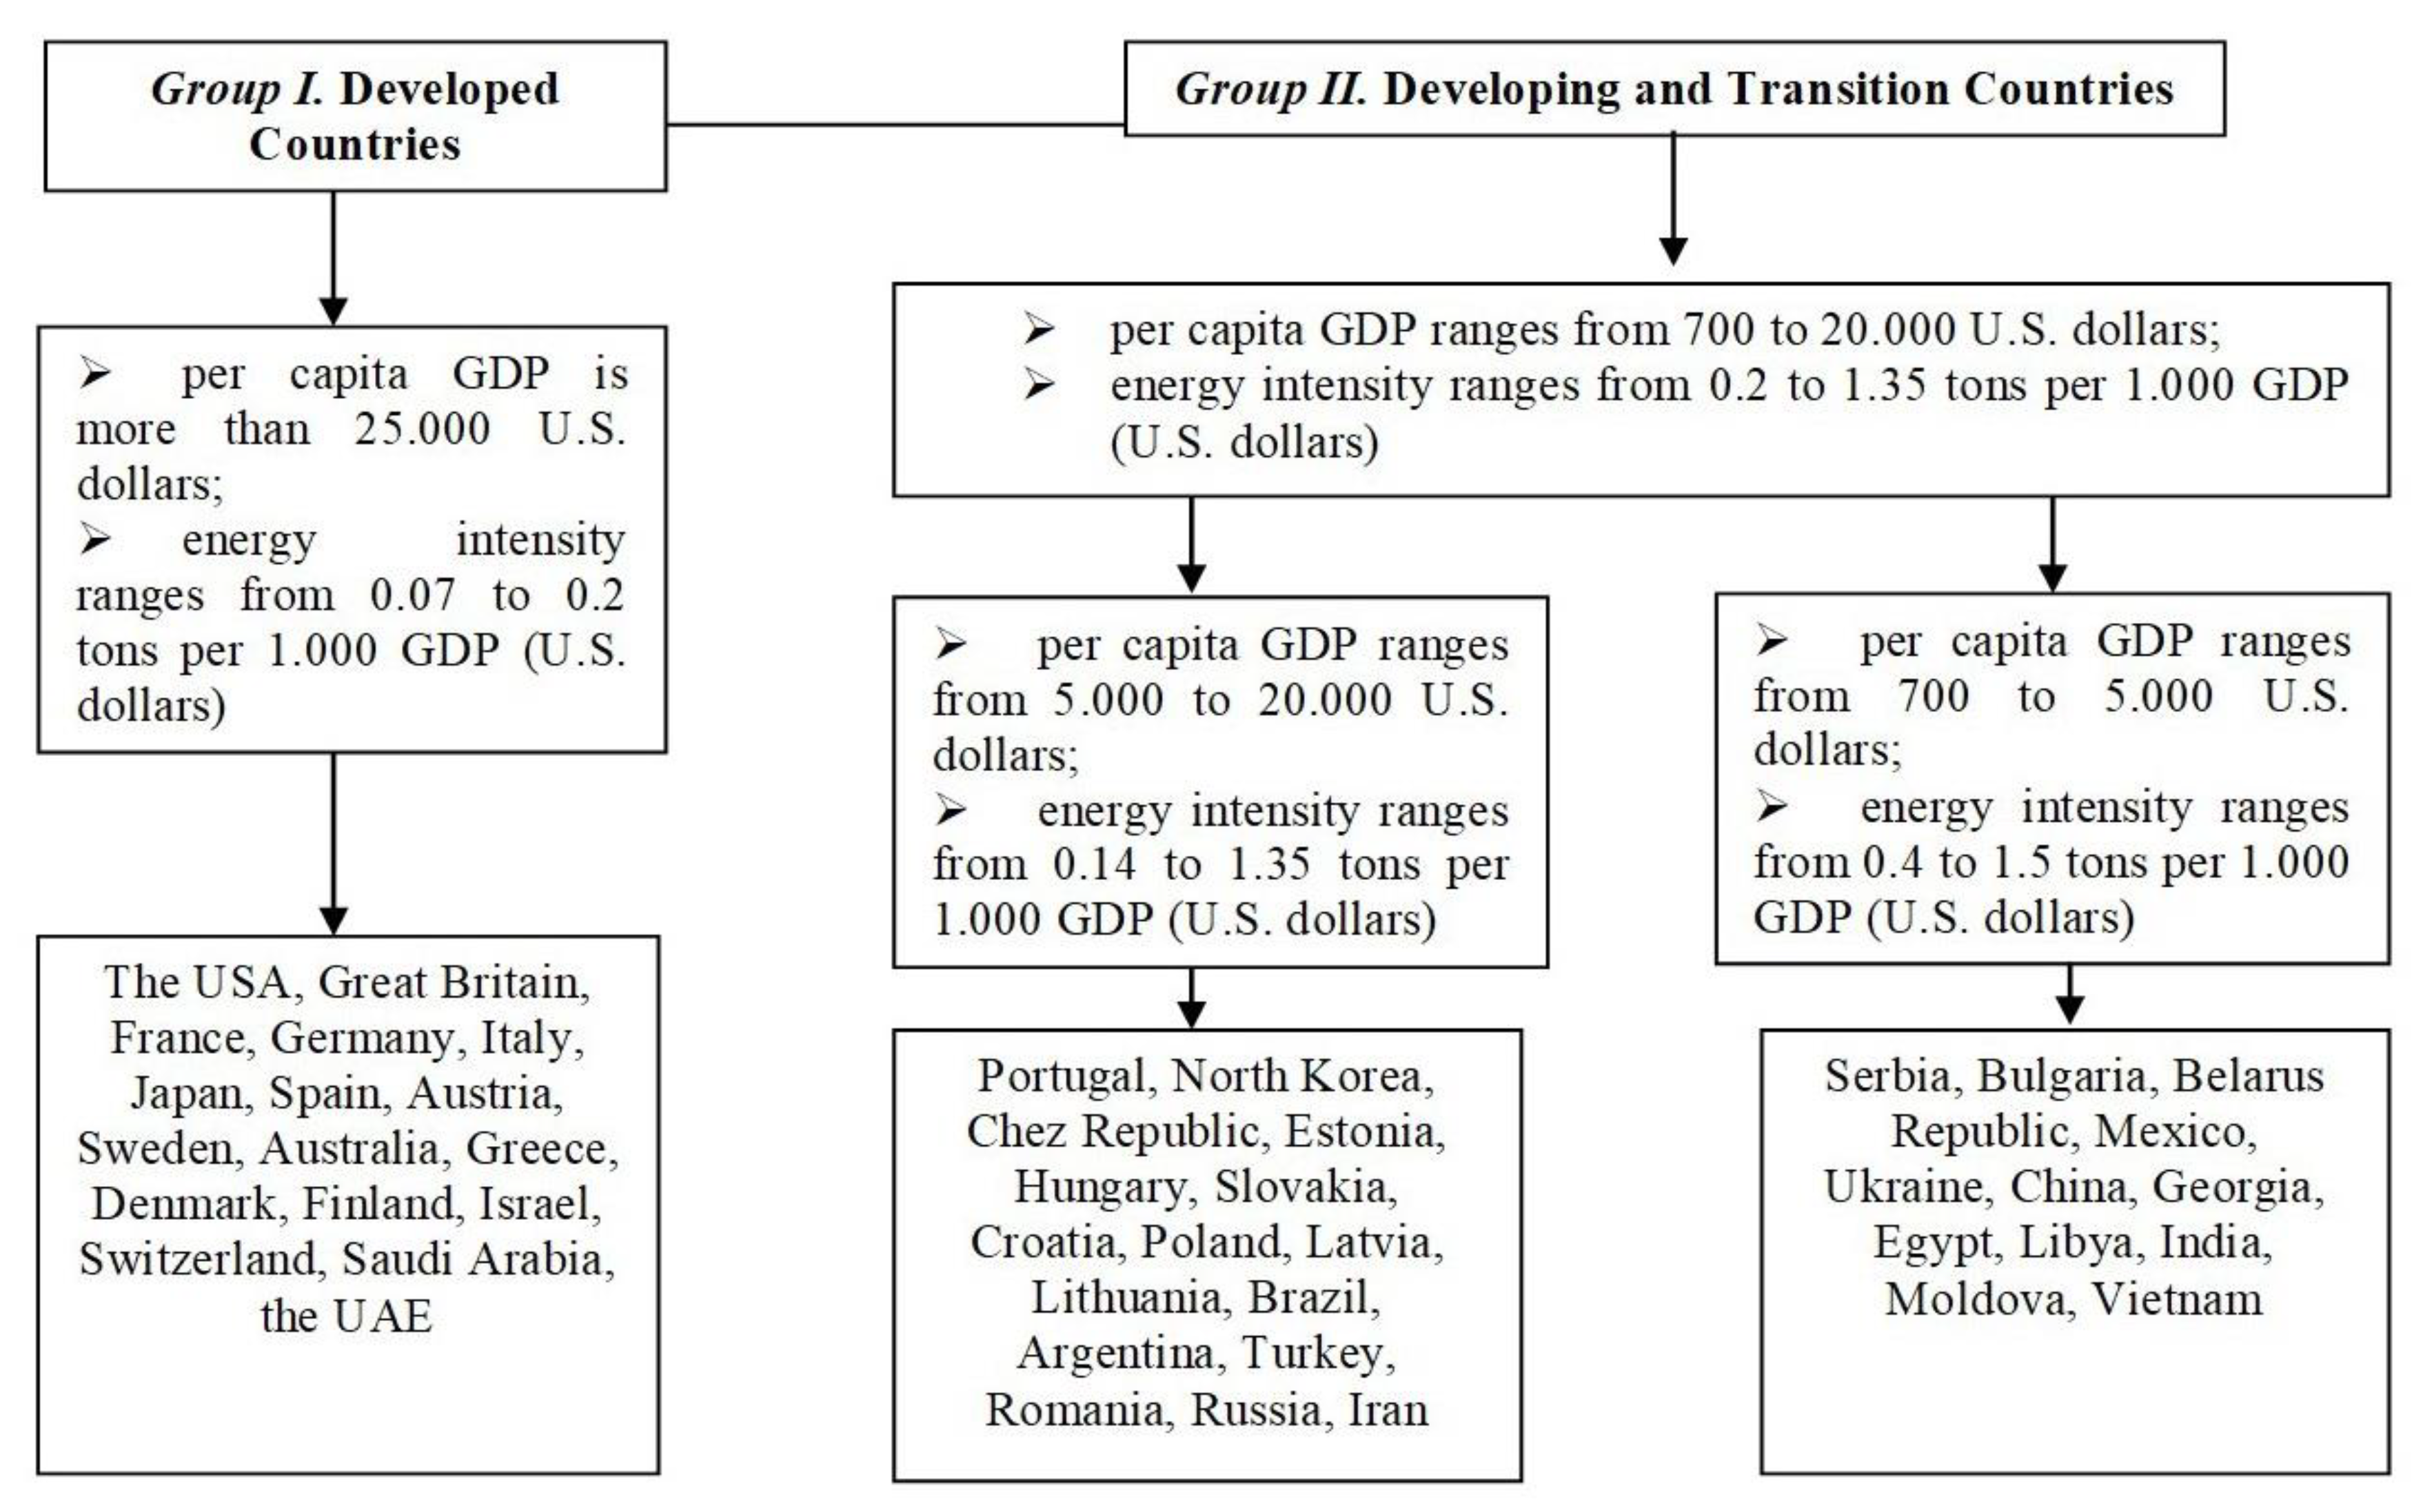
All countries under examination were divided into groups based on GDP per capita and energy intensity (
Figure 1).
The relatedness of variables was evaluated through pairwise correlation analysis. The resultant correlation matrix shows which pairs of variables have the strongest relationship. The study also evaluated the impact of energy resources on economic development. The development priorities of each group of countries were substantiated through modeling the dependence of energy intensity on indicators reflecting the impact of energy resources on economic development, such as per capita energy consumption, per capita GDP, imports/exports per capita, industrial production per capita, and import quota (
Table 1). In addition, the study articulated the energy security strategies for those groups. The relationship between import quota and other factors (per capita GDP, per capita energy production, and energy imports per capita) was established through pairwise correlation analysis.
The model of dependence between energy intensity and indicators reflecting the impact of energy resources on economic development can be expressed as follows:
where:
is GDP per capita (U.S. dollars);
is total energy production per capita (in metric tons);
is energy consumption per capita (in metric tons);
is energy imports per capita (U.S. dollars);
is total industrial production (U.S. dollars per capita);
is energy exports per capita (U.S. dollars); and
is import quota imposed on energy resources (%).
The dependence between per capita energy consumption and indicators reflecting the impact of energy resources on economic development can be described by the following equation:
where:
is GDP per capita (U.S. dollars);
is total energy production per capita (in metric tons);
is energy intensity (tons per 1000 U.S. dollars);
is energy imports per capita (U.S. dollars);
is total industrial production (U.S. dollars per capita);
is energy exports per capita (U.S. dollars); and
is import quota imposed on energy resources (%).
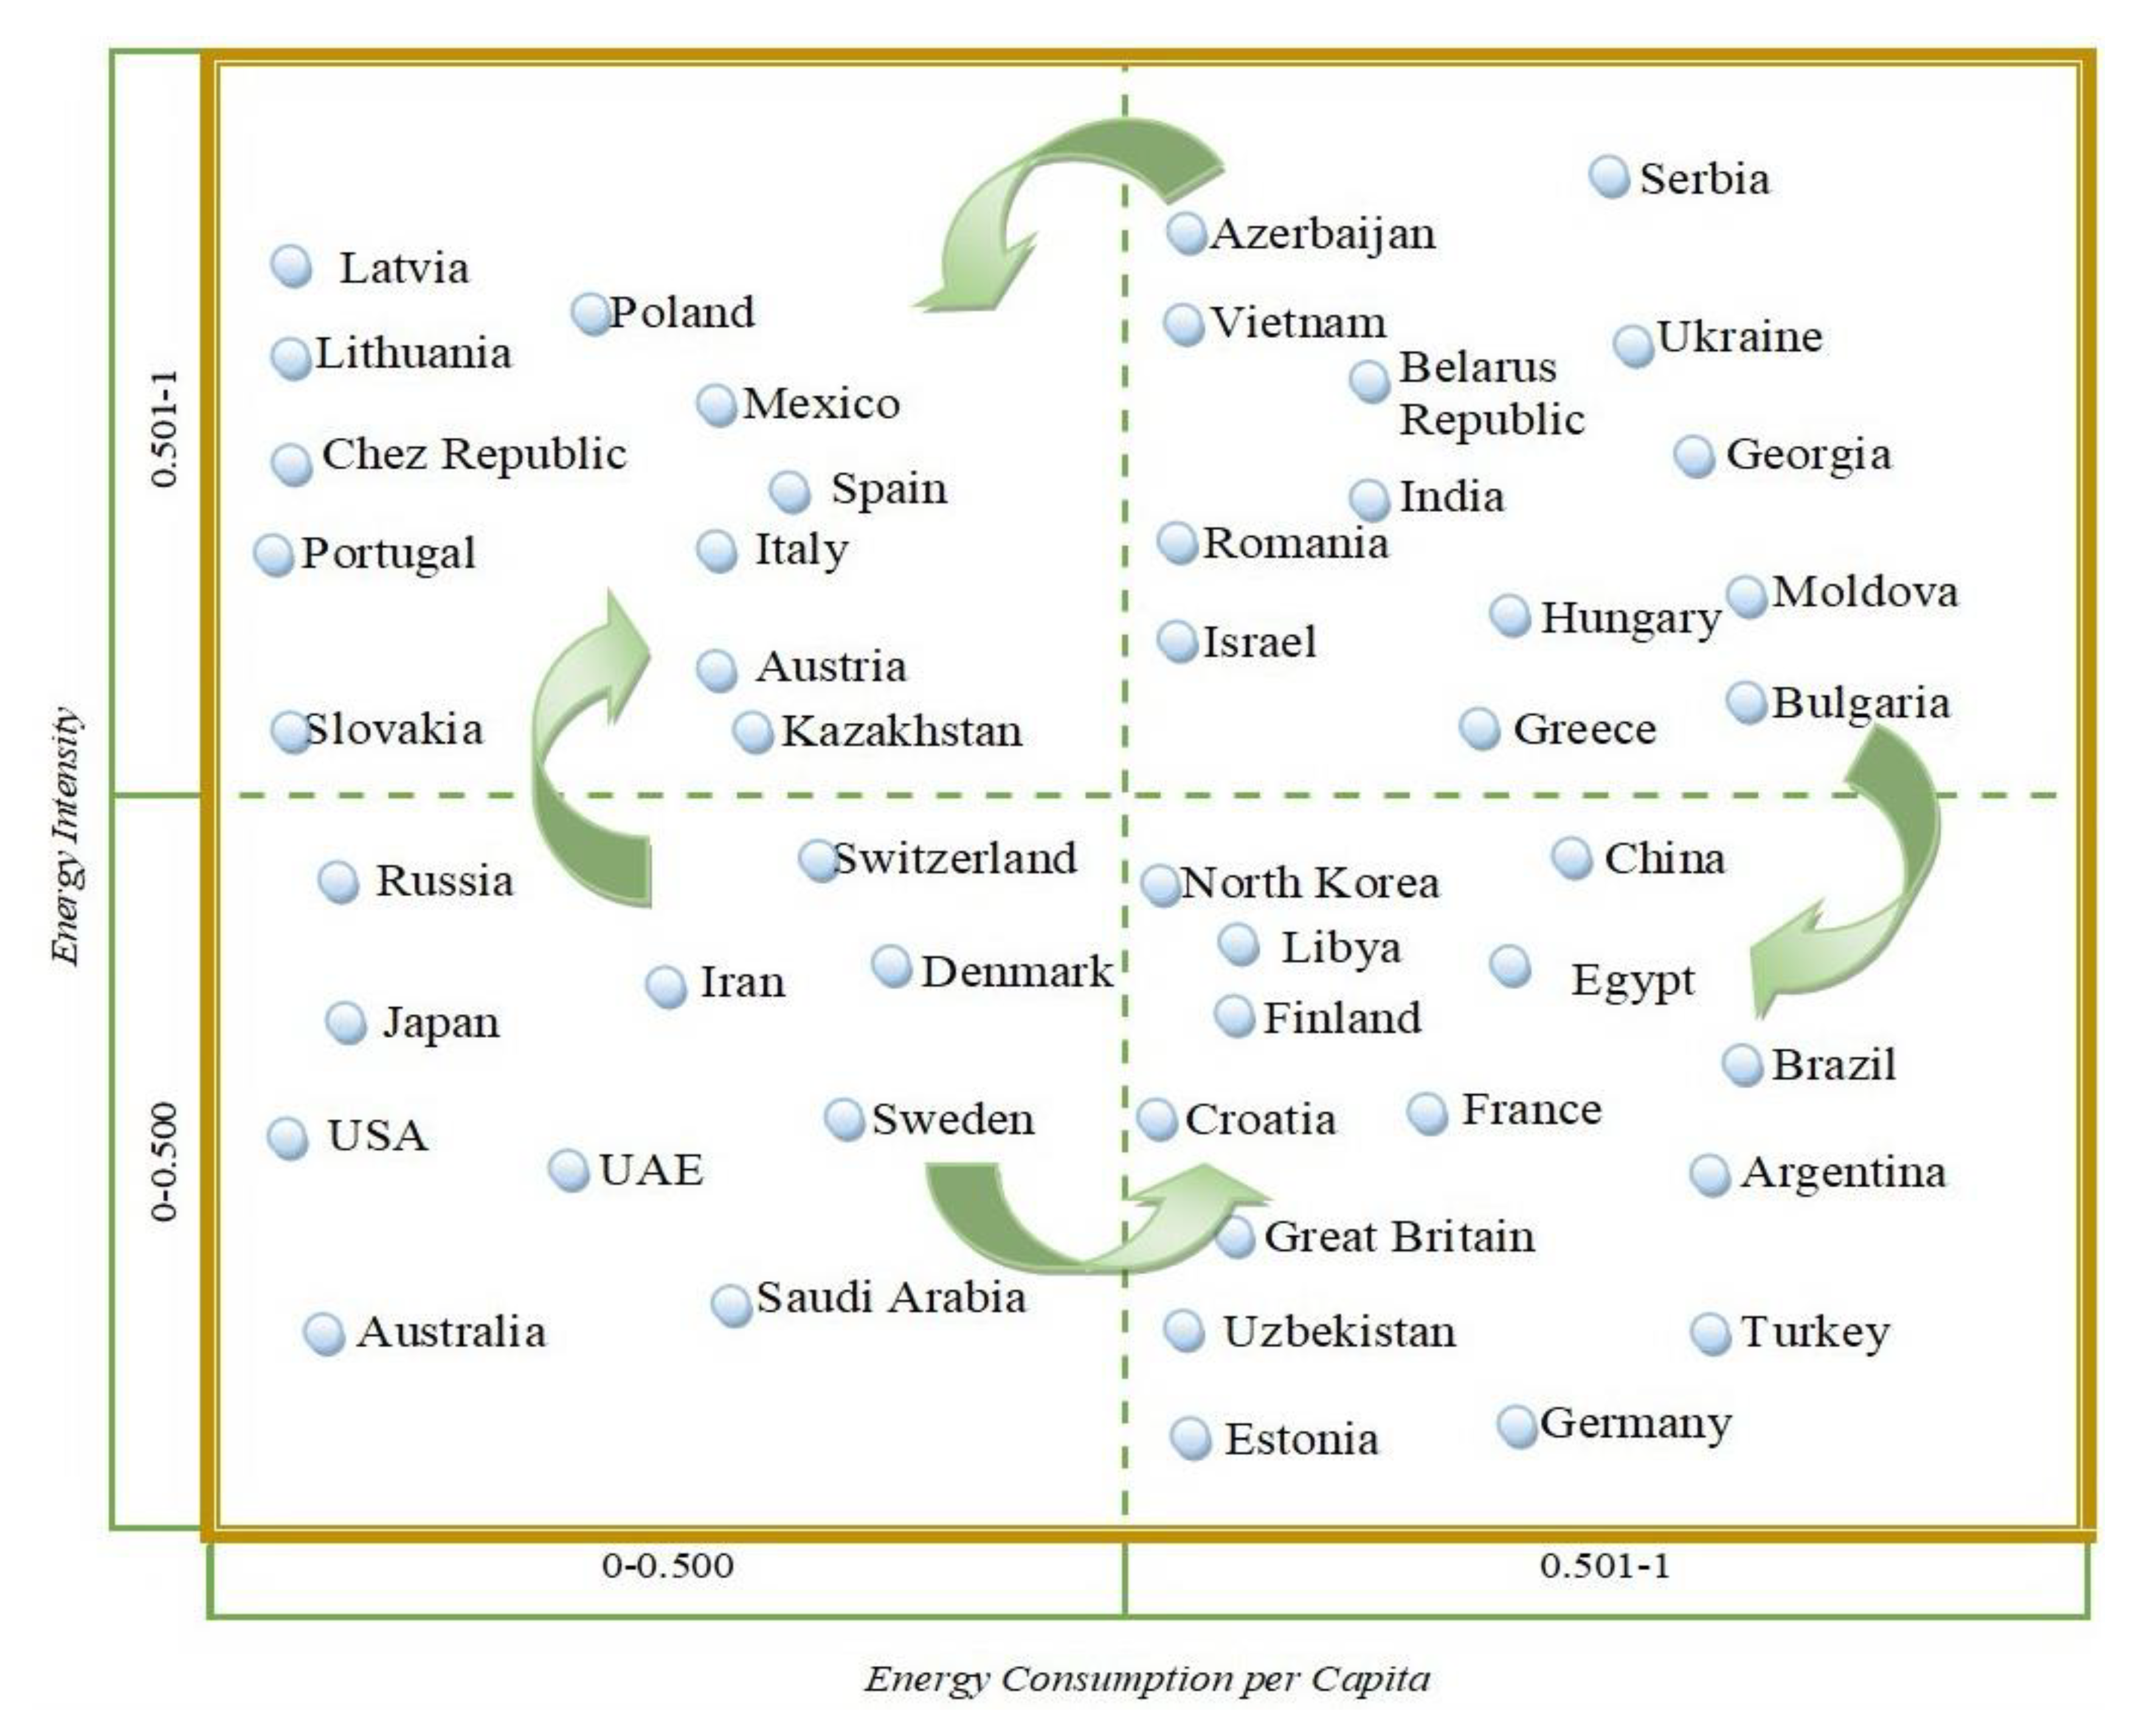
Based on data obtained, an energy dependence matrix was built. Countries that are most dependent upon energy resources go into the upper right quadrant of the matrix. The economic development of those countries hinges on the result of energy wars. Those in the upper left and lower right quadrants have advantages to overcome their dependency on energy resources. Those countries can participate in energy wars and influence the outcome of the energy war. The lower left quadrant is represented by countries that are most independent and can initiate an energy war.
Using data from the matrix and integrative analysis of energy dependence indicators, the energy dependence forecast was made. The forecast presents optimistic, realistic, and pessimistic scenarios for the short-term (up to 2025) and long-term (up to 2030) impacts of energy wars. In order to assess the impact of changes in the external environment, indicators of the possible deviation of the forecasted energy dependence level and threshold values were used. The study proposes a novel approach to assessing the impact of energy wars, which implies that the consequences of energy-induced conflict should be evaluated based on forecasted and threshold values. Research goal achievement is also possible via linear regression models and multilinear regression models with independent variables. Nevertheless, linear models with dependent variables sometimes can also provide analytical solutions [
23,
24]. However, beyond these few cases, more improved methodologies are needed to assess the level of countries’ energy dependence and possible deviations from forecasted scenarios. There are several approaches for calculating these indicators in economic models [
25,
26,
27]. Most of them are developed for Monte Carlo methods, according to which the margin of error is not precisely defined but implies randomness to some degree. Therefore, the rest of this section considers the methods for determining the integrative coefficient of energy dependence and variance in energy dependence levels.
The integrative coefficient of energy dependence can be measured by the following equation:
The model equation for variance in energy dependence levels
would be:
where:
is the integrative coefficient of energy dependence obtained under a certain scenario;
is the expected integrative coefficient of energy dependence;
is the probability of getting the desired integrative coefficient of energy dependence in the given scenario.
The expected integrative coefficient of energy dependence can be defined by the following formula:
The threshold level of energy dependence would be:
Using the novel approach, this study explored the impacts on energy security resulting from changes in the energy market, including energy wars and COVID-19. The comparison of short-term and long-term results was conducted to project future trends in the energy sector and opportunities for using energy strategies of the examined countries.
3. Results
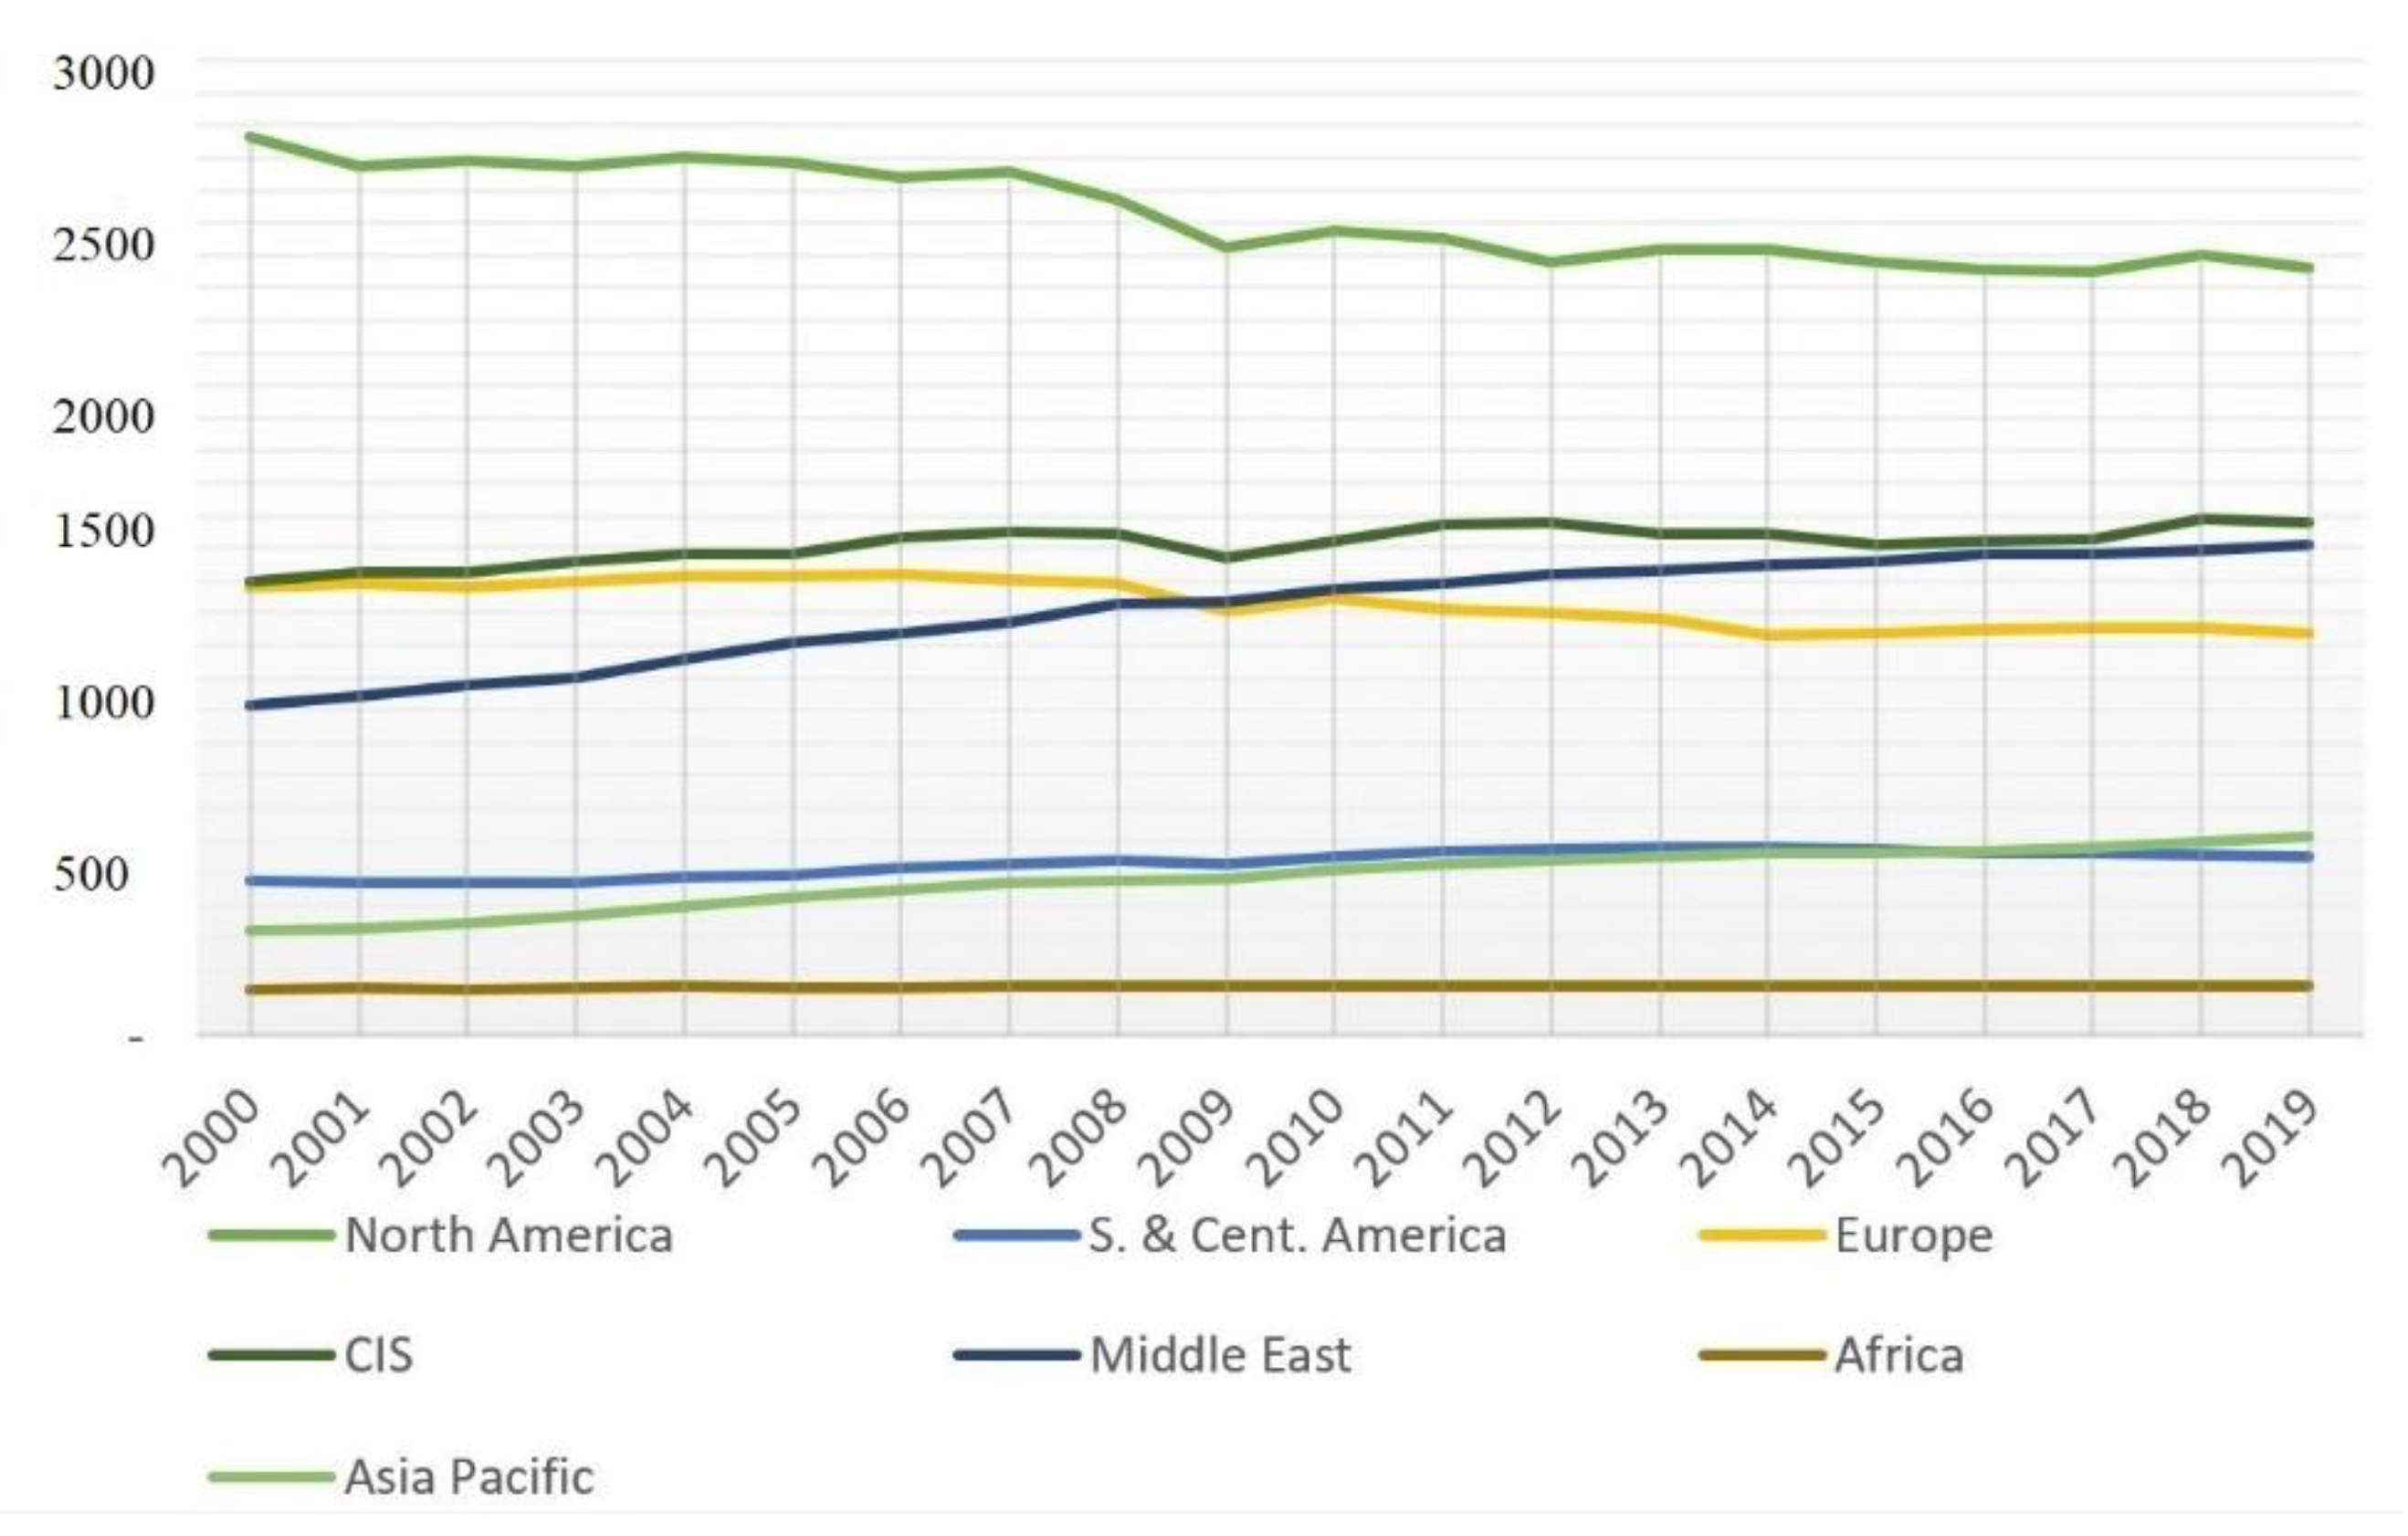
The largest consumers of primary energy are highly developed countries, such as the USA and European Union member states (
Figure 2). Developing countries with growing population attempt to keep up in order to accelerate their socio-economic development.
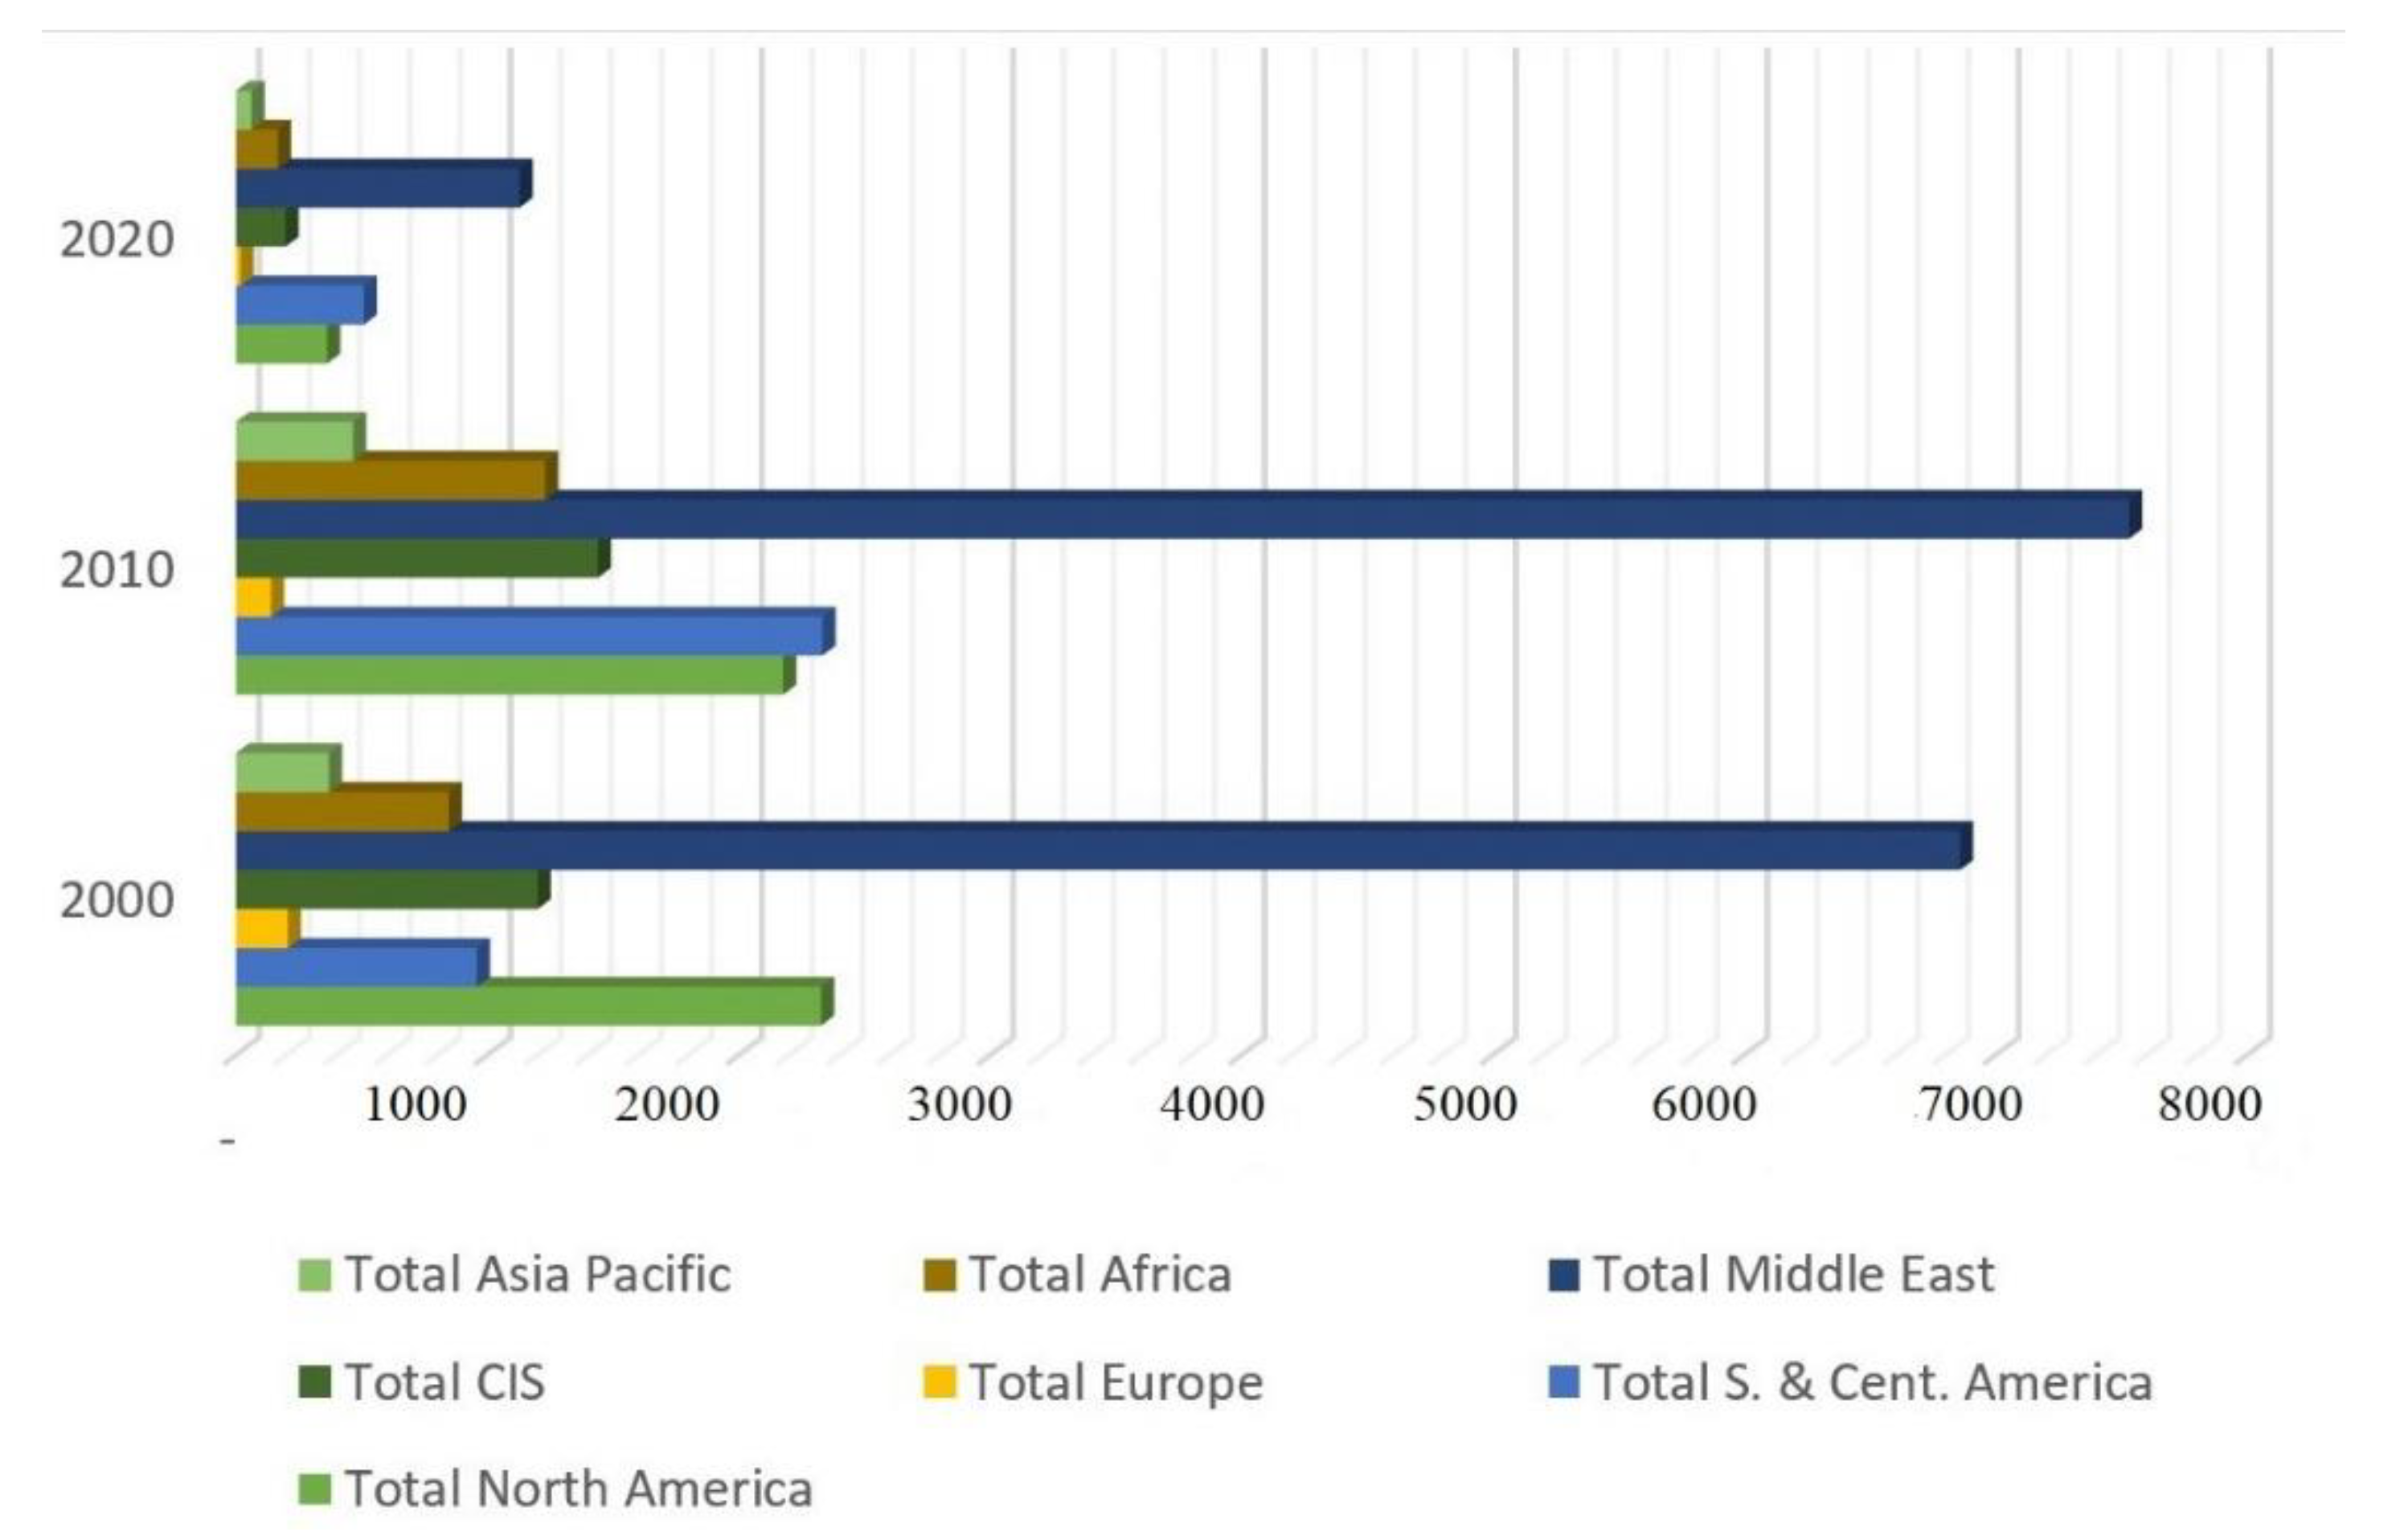
The global energy demand is projected to grow more than a third by 2035. China, the Middle East, and India would likely account for 60% of the total demand for energy, contrasting to the decreasing demand in developed countries [
29]. The Middle East is expected to have the biggest oil reserve, with 112.9 billion barrels accounting for 48.1% of the global total (
Figure 3).
Over the years, the top countries by oil reserves and oil production were Saudi Arabia, Venezuela, Iraq, USA, Canada, and Russia. Saudi Arabia was the largest reserve holder among the OPEC countries for a long time but was squeezed out by Venezuela in 2011. Currently, Venezuelan has 48 billion barrels of proved oil reserves, most of which are located in the Orinoco belt. Saudi Arabia’s reserves of 40 billion barrels rank second. The third position was taken by Canada with 27.3 billion barrels of reserves. Russia has 14.7 billion barrels of reserves or 6.2% of the world’s total [
28].
In 2019, Russia surged ahead of Saudi Arabia in oil production with a daily output that was higher by one million barrels. According to forecasts, Iraq with its potential to more than double its oil production by 2030 could overtake Russia. In this way, Iraq could become the world’s second-largest oil exporter. The COVID-19 pandemic and the oil price war; however, made most of these forecasts fail.
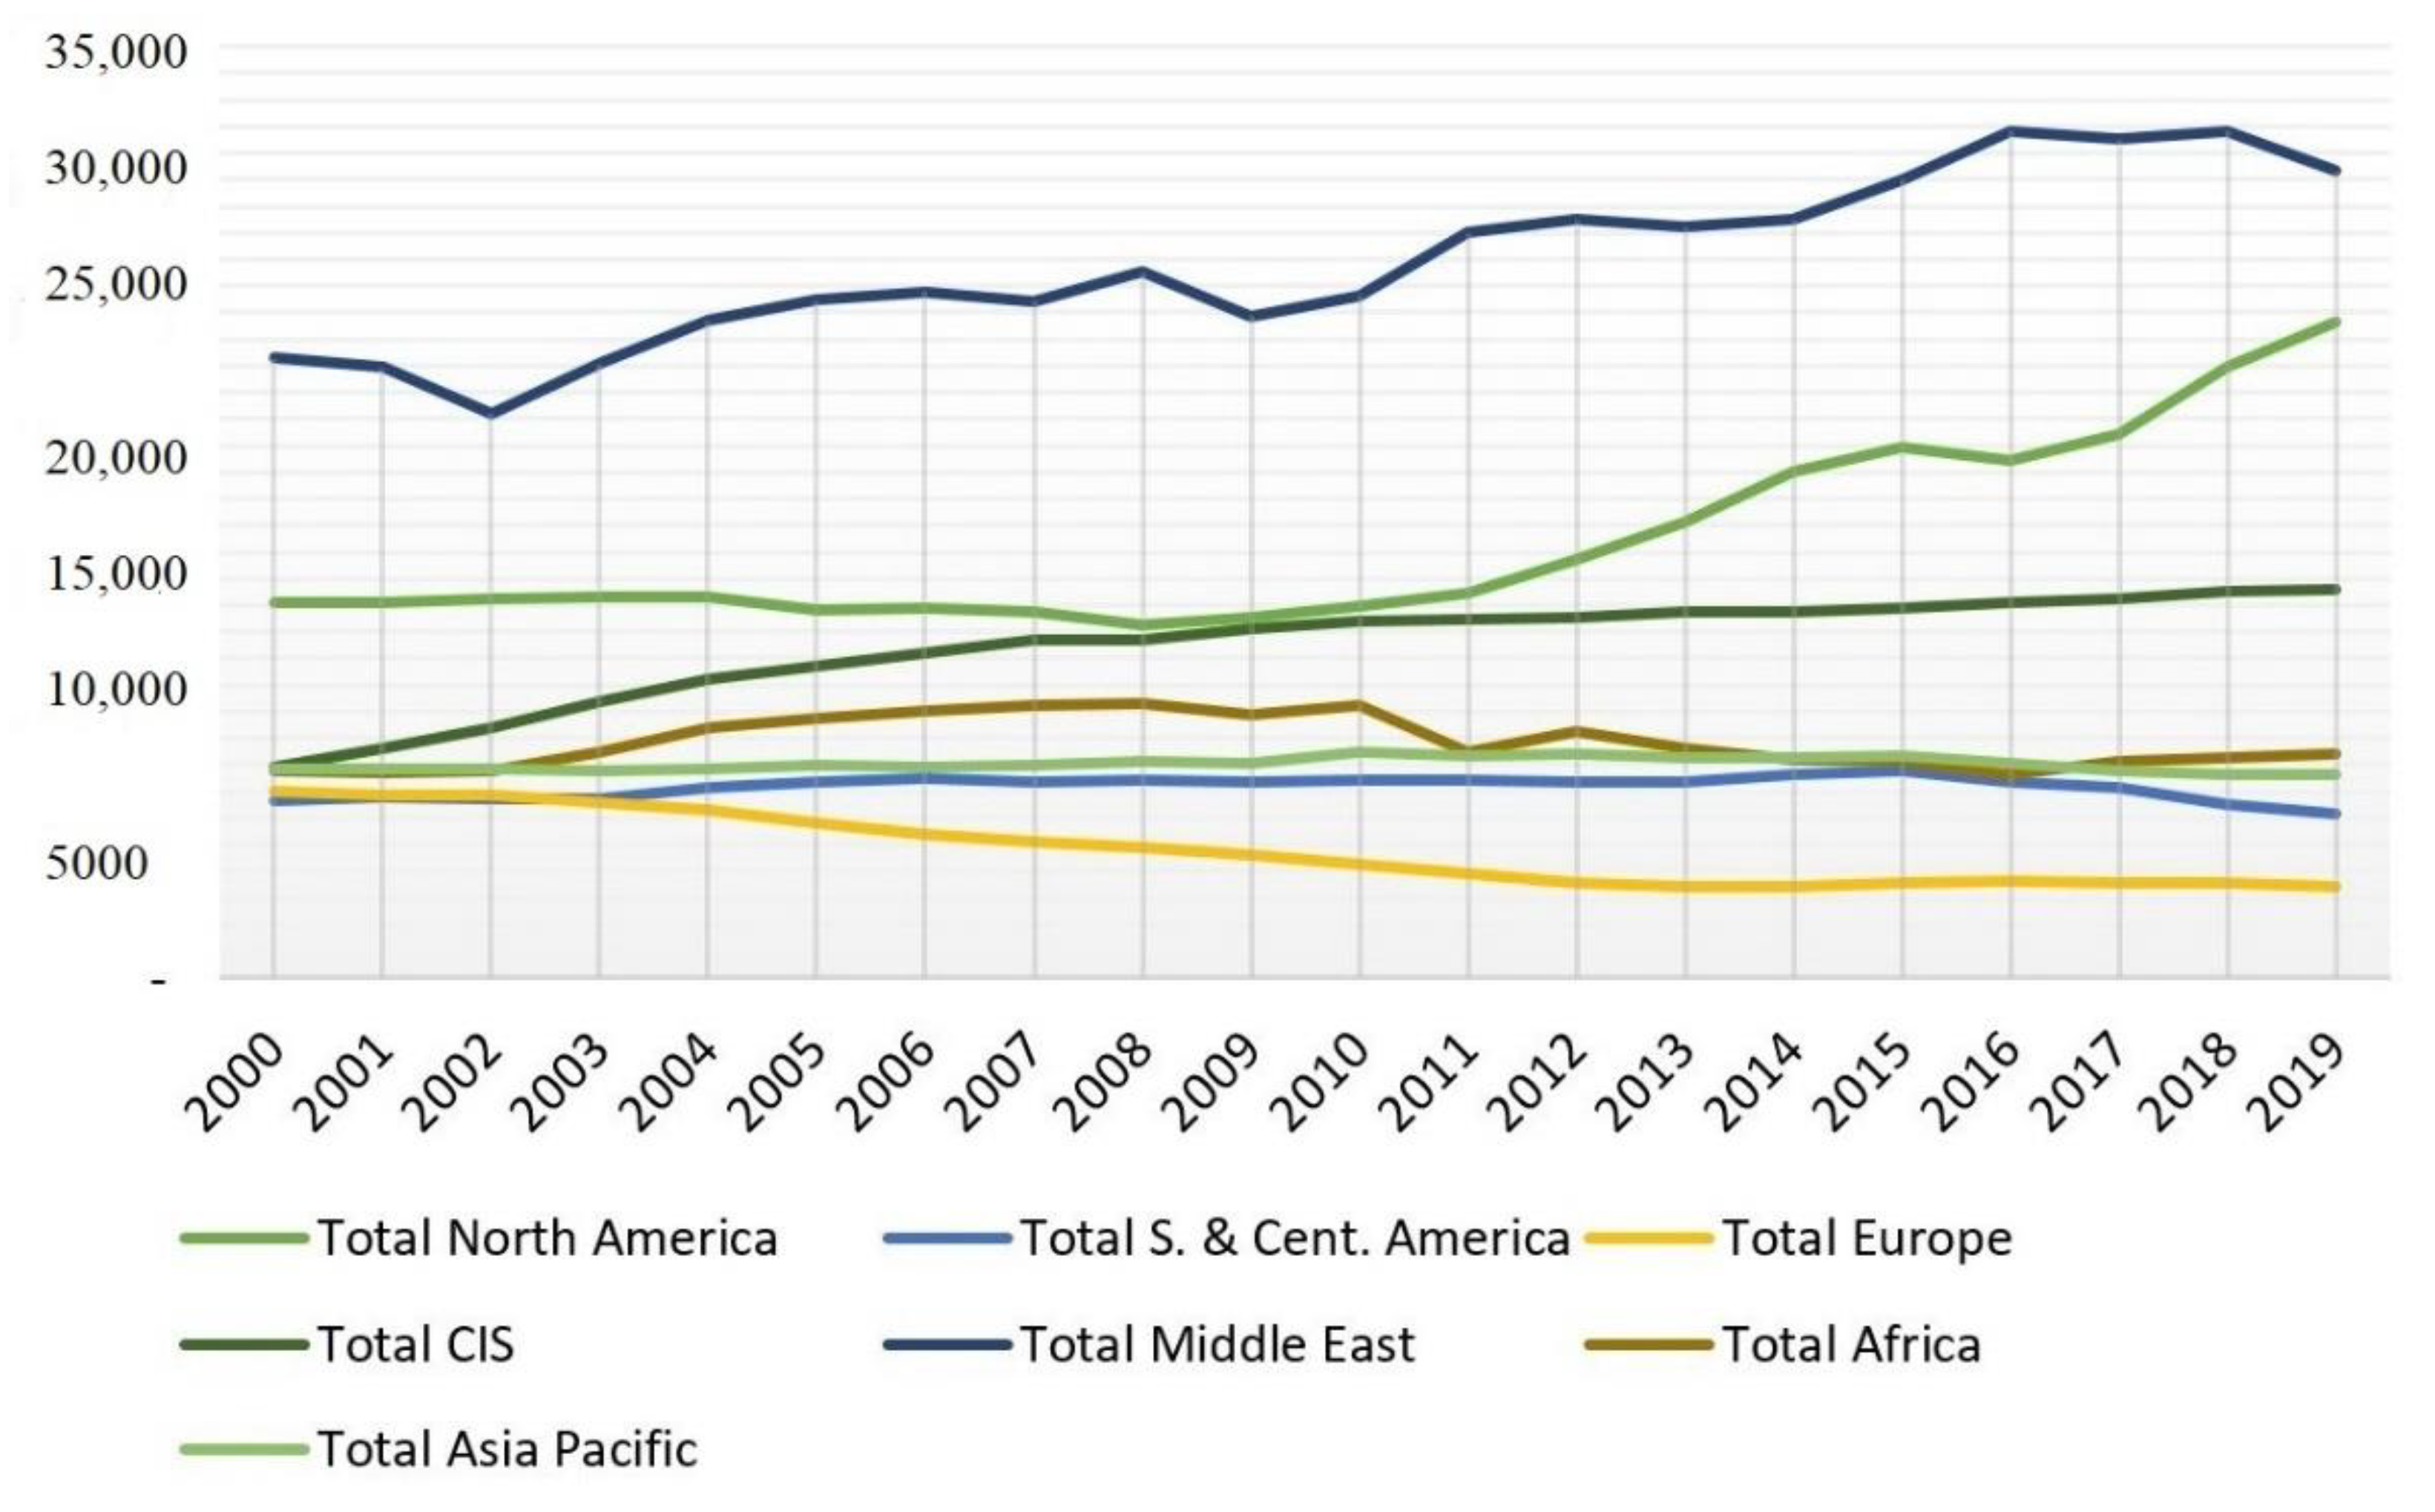
As shown in
Figure 4, the world’s largest oil suppliers are North Africa and the Middle East.
Political instability in the bulk of energy-secured regions poses a major threat to the global energy market. There is a risk of armed conflicts and terrorist attacks on energy infrastructure in the African continent, the Middle East, and the Caspian region. Eight out of twelve OPEC member countries (Iran, Saudi Arabia, United Arab Emirates, Algeria, Kuwait, Libya, Iraq, and Qatar) have to deal with unstable internal situations. Because these countries export around 22.8 billion barrels of oil per day (approximately a quarter of global supply), their participation in political and other conflicts can lead to significant destabilization of the global energy market.
The oil-bearing and oil-transit regions affected by military-political instability and armed conflicts are the Middle East (Iraq, Kuwait), the North Caucasus (Chechnya, Dagestan), Transcaucasia (Nagorno-Karabakh, Abkhazia), and more. The examples of nationalism and extremism in oil-producing countries, which resulted in international isolation, are Iran, Iraq, and Libya. One of the sources of tension in the Caspian region is the unclear legal governance over the Caspian Sea. Since there are no reliable legal documents to govern the division of the Caspian Sea into national sectors [
30,
31], every case concerning the distribution of resources within the Caspian Sea is a potential source of conflict. Unresolved conflicts, terrorism, and the risk of oil and gas pipeline blockage pose a threat to energy transportation infrastructure. The choice of a particular transport route or method can also cause destabilization because those countries that control the pipelines provide advantages to countries through which these pipelines pass. Therefore, there is sufficient competition on oil and gas routes.
The global reserves of natural gas increased to 7019 trillion cubic meters in 2019. Given the current rates of gas production, it will continue to increase during the following 64 years. The world’s largest reserves of natural gas are located in Russia, which produced 1,340.5 trillion cubic meters of gas in 2019 (19.1% of world production), of which 169 billion cubic meters were exported [
28]. For most European countries, natural gas is a dominant component of the national energy mix. In recent years; however, the natural gas consumption in Europe has dropped by a record 12% due to advances in renewable and unconventional energy production.
The world’s oil and gas reserves have grown over the past few years thanks to the exploration of unconventional sources. Technological breakthroughs enabled companies to explore and drill in places that were previously inaccessible, such as deep-water fields, Canadian oil sands, and shale gas reserves in the United States. By taking advantage of new possibilities, the United States surpassed Russia in gas production in 2011. At the same time, the potential to become a powerful exporter of relatively cheap gas is a strong argument for the adjustment of natural gas prices. Russia’s largest reserves of technically available shale oil are estimated at 75 billion barrels, followed by the United States (58 billion barrels) and China (32 billion barrels). The top ten countries include Libya, Argentina, Mexico, Venezuela, Canada, Pakistan, and Indonesia. Unconventional gas fields in Europe can be nearly as fruitful as those in the United States [
32]. From this perspective, Poland and Ukraine are especially promising candidates for unconventional gas extraction. However, there are challenges associated with deposit development in those countries, such as difficulties in conducting geological exploration, dense population, environmental issues, developed infrastructure, legislation, and the lack of investments. Therefore, European countries cannot expect to reach the same successes that the United States has achieved.
Countries that have the ability to influence the energy market and actively participate in energy wars were identified by building an energy dependence matrix (
Figure 5). Using this matrix, least-to-most reliant countries were identified.
The energy market is largely influenced by two effective factors: import quota and energy consumption. An import quota in industrialized countries that import energy resources changes with GDP, per capita energy production, and energy imports. For middle-developed countries, the most influential factors are energy consumption, energy imports, and energy exports. In low-income countries, import quotas are linked to clean energy production, energy imports, and energy intensity. In regard to energy intensity, it was found that in high-income countries, it is affected by fluctuations in energy production and consumption, whereas transition and developing economies can offer an additional factor of influence (i.e., energy exports). Alterations in energy intensity in 33% of low-income countries can be associated with shifts in energy imports. Another effective factor is energy consumption, which in developed countries changes with energy production. In middle-developed countries, the key factors affecting energy consumption are GDP, energy imports/exports, and industrial production. In low-income countries, per capita energy consumption is linked to many indicators, such as GDP, energy production, energy imports and exports, and industrial production. The above suggests that energy strategies of energy-independent countries have an impact on both the global energy market and the national energy sectors of individual countries. The results of the analysis confirmed that the import quota is heavily dependent upon indicators, such as GDP per capita, energy production per capita, and energy imports per capita. Therefore, countries need to improve their organizational and economic frameworks for energy security in order to take into account the impact of exogenous and endogenous factors.
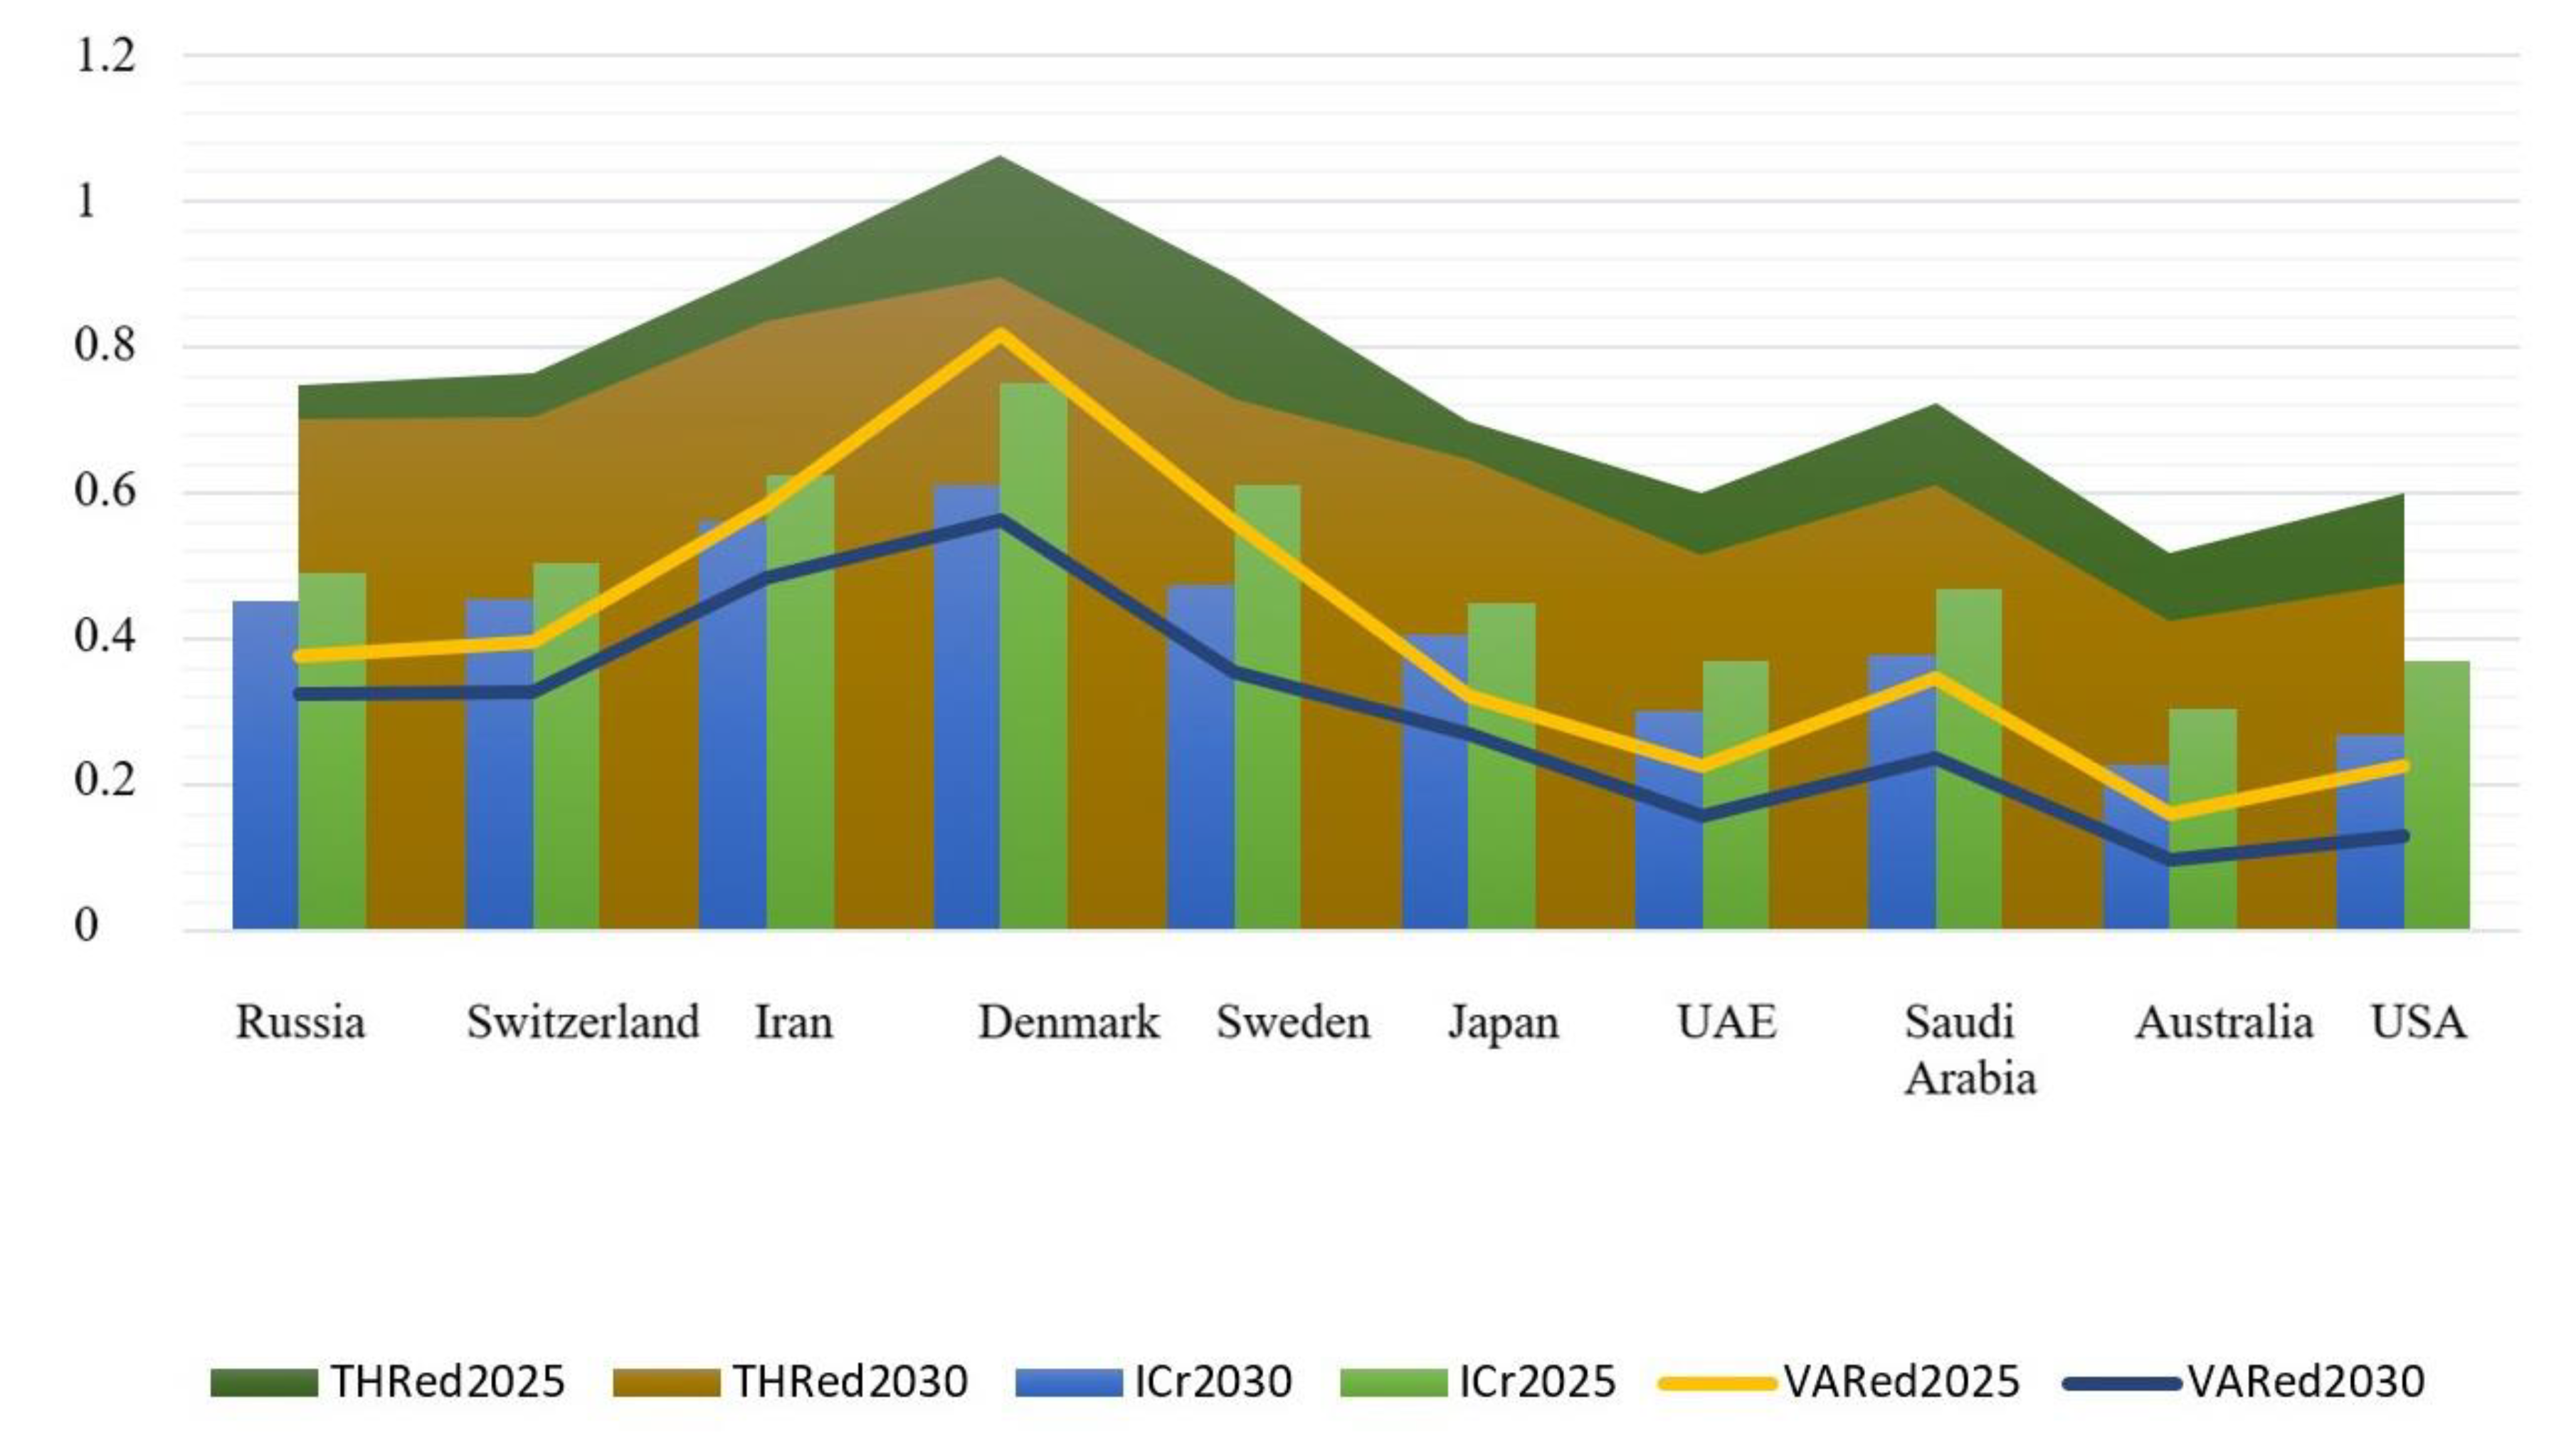
Based on the integrative coefficient of energy dependence, the short-term (up to 2025) and long-term (up to 2030) forecasts were made. There were three scenarios for how the situation with energy dependency will look in the future. Under the optimistic scenario, the most energy-dependent countries will reduce their dependency by 15%, contrasting to 25% growth in the pessimistic scenario. The thresholds and variances between a baseline and a forecast were also computed. The forecasts were made separately for energy-independent (
Figure 6), promising (
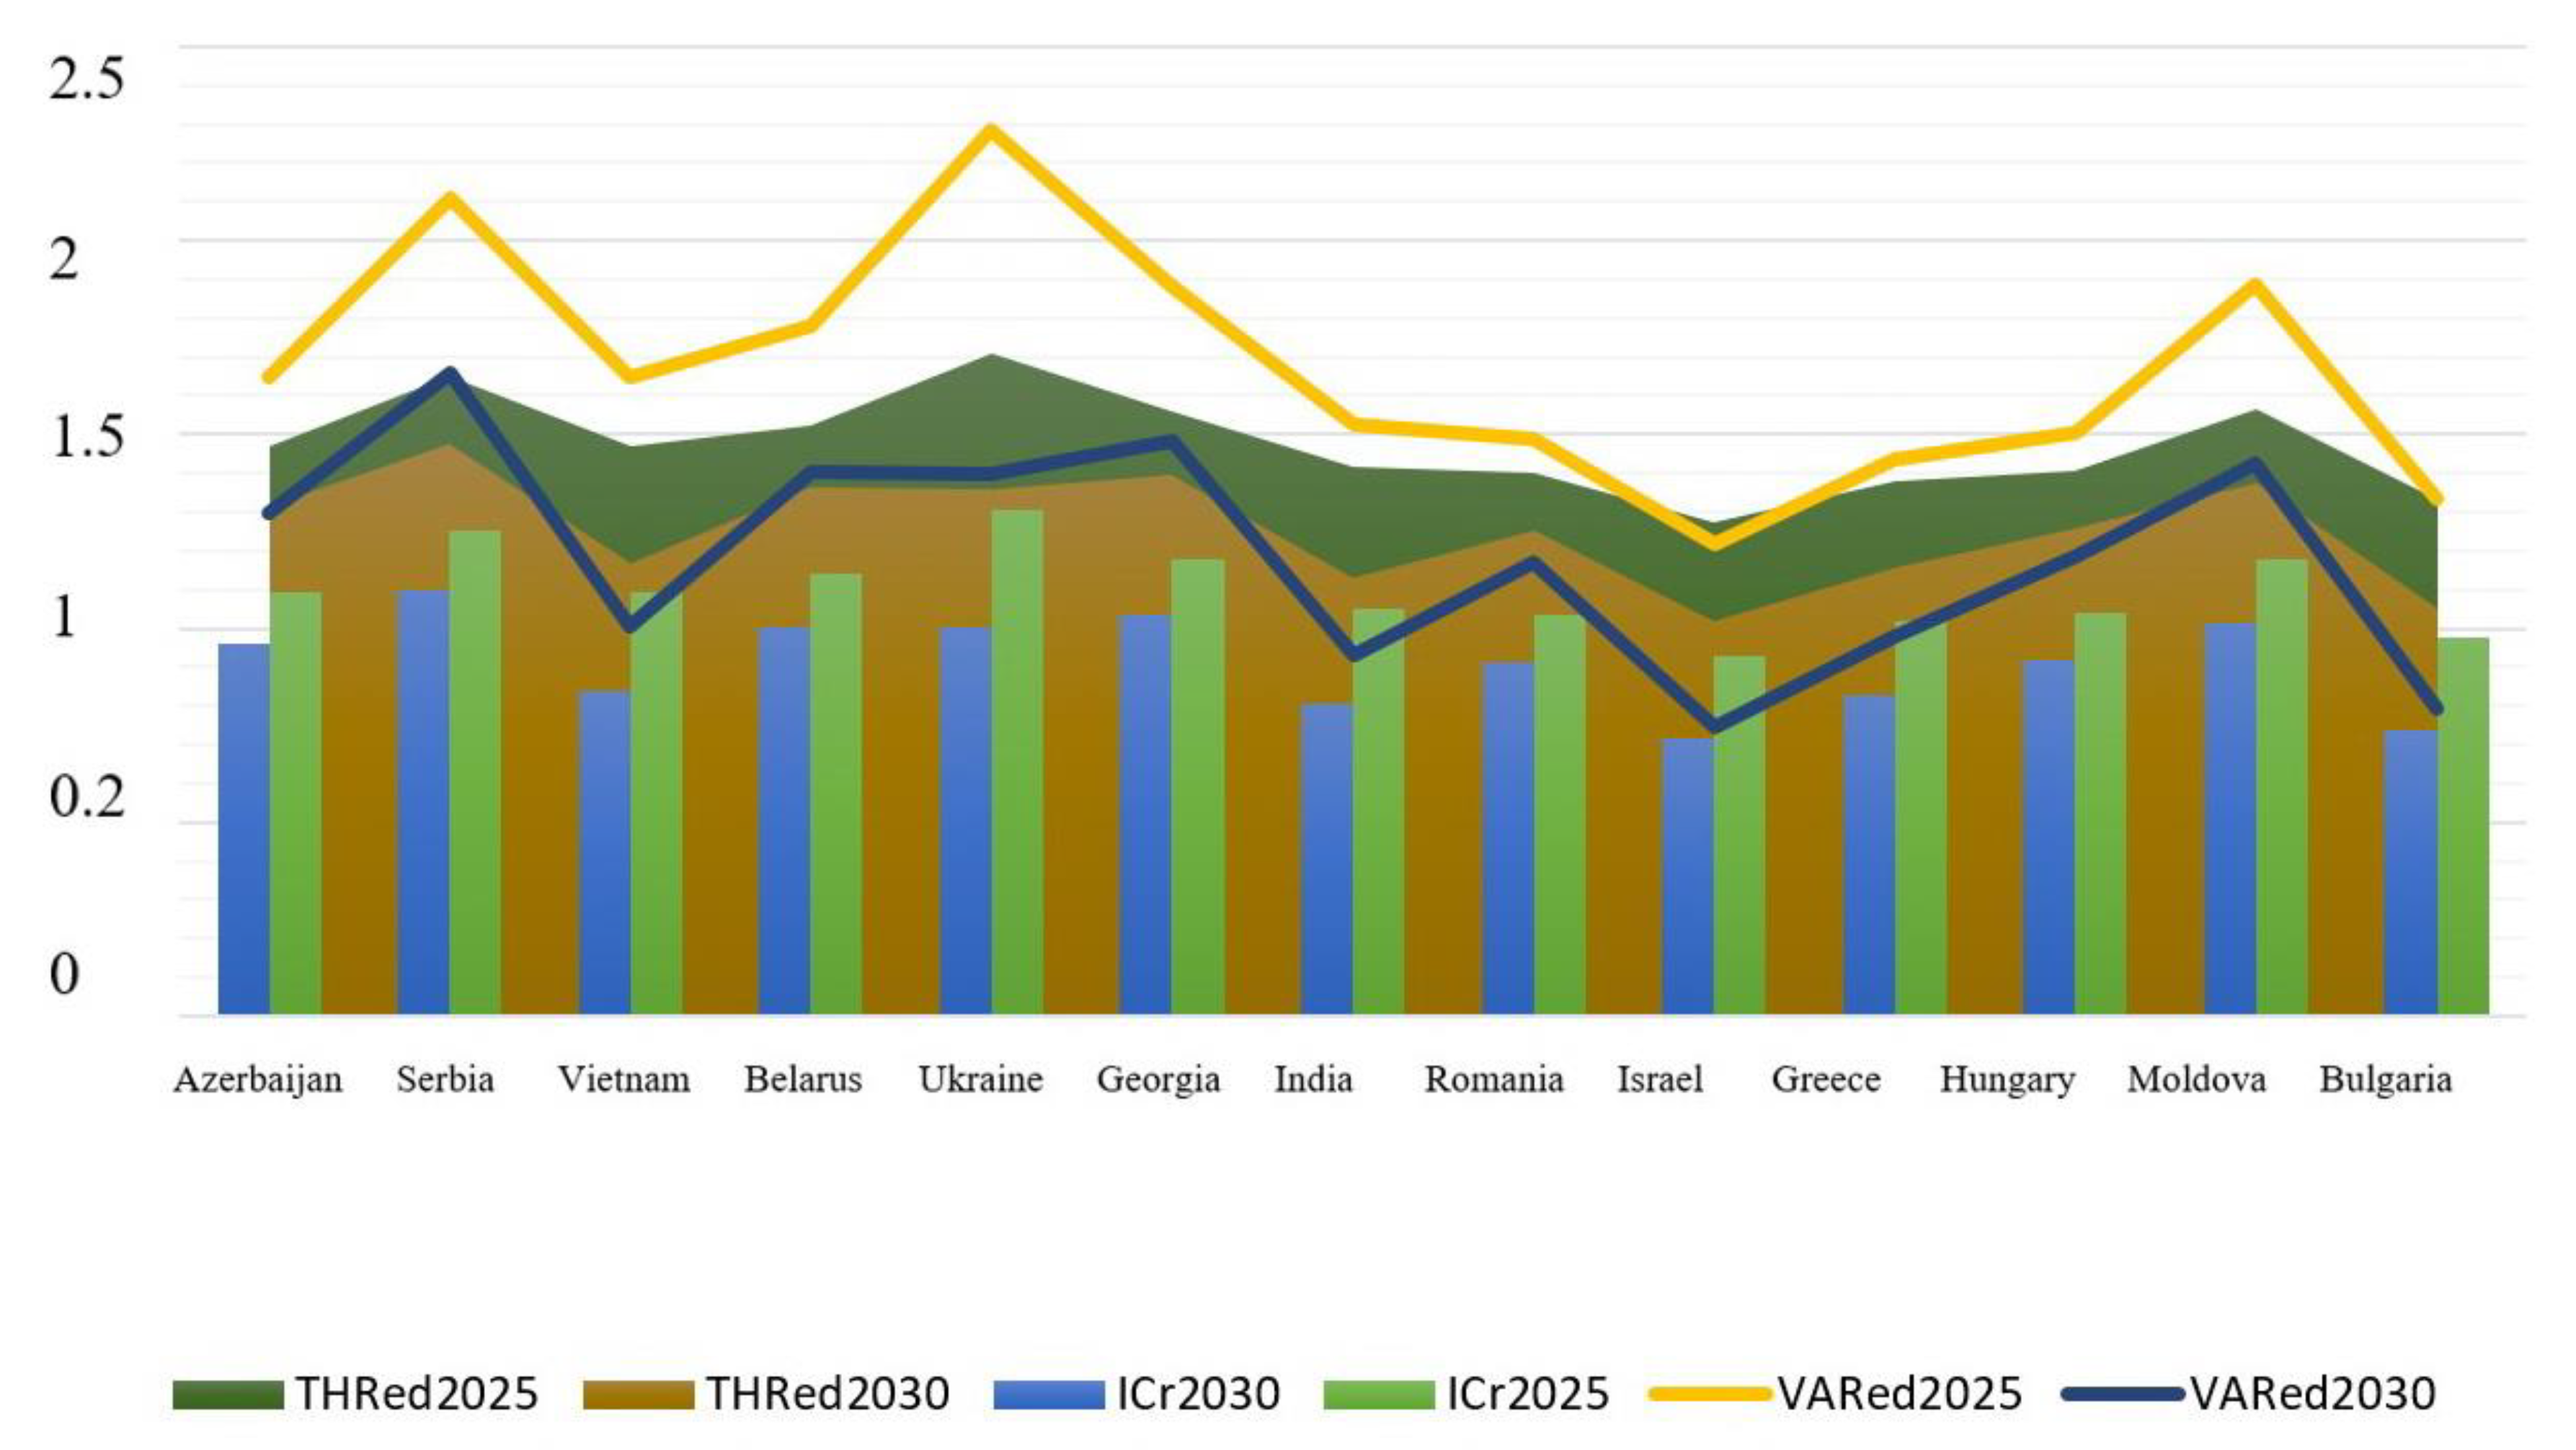
Figure 7), and the most energy-dependent (
Figure 8) countries.
Based on the above forecast, Denmark is likely to show a negative trend by 2025, that is, the growth of energy dependency is expected. Yet, Denmark has the potential to struggle and reduce its energy dependency by 9% by 2030. Iran exhibits the smallest growth of energy independence amongst influential countries, largely due to political factors. Australia demonstrates significant improvement in energy dependency in both the short term (by 48%) and long term (56%). The reason behinds this is the advancement of the renewable energy sector. The United States and the UAE are projected to become more energy independent. Russia’s level of energy independence will also become higher but at a slower pace when compared with that of the US and the UAE. Perhaps, such a slowdown is due to fluctuations in exchange rates. The positive trend in the energy dependency of Russia may be linked to solar growth over the past five years.
For energy-independent countries, the energy security threshold is rather high; it exceeds the forecasted value in both the short term and long term. This confirms that energy-independent countries are market leaders and their energy strategies can influence the overall energy situation.
Comparing to energy-independent actors, countries with the potential to become energy-independent are more affected by price wars and pandemic outbreaks. For example, countries, such as China, Egypt, Brazil, Argentina, Turkey, and Latvia are at risk until 2025, as evidenced by the fact that the forecasted level of energy dependence has a value close to the threshold value. Other countries, such as Croatia, Great Britain, Uzbekistan, Germany, Estonia, Italy, Portugal, Austria, Kazakhstan, and Slovakia, exhibit a small positive variance between baseline and forecasted levels of energy dependency. This confirms that a non-leading country can have a high level of energy independence. At the same time, the baseline dependency levels of countries, such as Uzbekistan, Kazakhstan, Germany, and Poland are higher than those forecasted, which indicates that these countries have the opportunity to significantly increase their levels of energy independence by 2030. Despite an 11% increase in energy dependence in 2025, Poland can strengthen its positioning as an energy-independent player by 2035 through renewable energy integration. Overall, Poland’s dependence on energy supply from Russia is expected to fall by 21% compared to 2019. The major steps that Poland took towards energy security were: (1) Poland put efforts to construct a liquefied natural gas (LNG) terminal to receive gas shipments from Qatar rather than Russia; (2) Poland signed a long-term contract with Qatar to receive LNG deliveries; (3) Poland invested in a pipeline network connected with the natural gas transmission systems of Germany, the Czech Republic and Slovakia; (4) finally, Poland prioritized the development of its shale gas reserves. Poland’s proposals to reform the EU’s energy policy and influence Russia do not always resonate with the EU member states because deterioration in relations with Russia can affect the position of those countries that are still dependent upon Russian gas.
The majority of economies that are most reliant upon energy imports are at risk of increasing their dependency by 2025. The only exception is Israel, which level of energy dependence will not exceed the threshold value. The consequences of such an increase may be irreparable. The most energy-dependent countries are Georgia, Moldova, Ukraine, and Serbia. By 2035, however, the situation described above may change somewhat in a positive direction. In particular, countries, such as Bulgaria, Greece, Israel, Hungary, Romania, India, Vietnam, and Azerbaijan, are likely to strengthen their energy independence.
Based on the above, it can be concluded that the level of energy dependence directly affects national security. The higher the energy dependence, the stronger the market instability and the higher the likelihood of energy wars between countries. Note that if the value of energy dependence exceeds the threshold value, the consequences may be negative. The energy-independent country can lose its leading position and become heavily reliant upon other players, but when the most dependent country strengthens its energy independence, it can only become partly independent. Therefore, the future study can focus on exploring the possibilities of gaining/losing energy independence and chain reactions that can occur as a result of that shift.
4. Discussion
The indicators in the proposed methodological approach are somewhat linked. For example, there is a weak inverse relationship between import quota and indicators, such as per capita energy consumption and total industrial production per capita [
33]. There is practically no connection between import quota and indicators, such as energy intensity and energy exports per capita [
34]. A moderate inverse relationship was found between import quota and variables, such as GDP and per capita energy production [
35]. There is a strong relationship between energy imports per capita and import quota [
36]. At the same time, the value of energy consumption not only affects the human development index, but it also serves as an important factor in measuring the level of sustainable development [
37].
Based on the analysis of threats from energy strategies existing within the energy sector, it can be stated that there is a need for a well-balanced policy on global energy security to overcome the formation challenges of national energy balances. The energy balance is at the core of national security in many countries across the world, this fact made it possible to develop a conceptual framework for ensuring energy security on a global scale [
38].
The proposed approach for predicting energy dependence levels of countries serves the following functions: (1) it allows achieving transparency, predictability, and stability of global energy markets; (2) it helps investors decide where to invest their funds; (3) it helps economies to choose energy-efficiency strategies; (4) it provides a basis for the achievement of environmental safety in the energy sector; (5) it enables countries to overcome the burden of energy dependence; and (6) it facilitates diversification across the global energy market based on the fundamental principles underlying energy security, such as accessibility, availability, and affordability [
39]. The previous forecasts of energy dependence emphasized how strong the pandemic’s impact on energy demand is [
40].
Although energy conflicts affect oil prices, their impact is less strong than that of the dollar. The negative effect of the dollar’s exchange rate was exacerbated after the global economic crisis. Furthermore, U.S. oil production has less influence on the oil market than energy conflicts and exchange rate [
41]. In general, the U.S. energy strategy plays a vital role in the oil market, especially in energy conflicts and in the formation of dollar values. Understanding the effect of different energy strategies, which can be evaluated using the proposed methodological approach, countries will be able to draw energy policies and stabilize the oil market [
42], and investors will be able to adjust their investment decisions and diversify their assets.
When selecting indicators for a model of energy dependence assessment, one should keep in mind that countries holding the largest amount of hydrocarbon reserves make up a rather small group [
43,
44,
45]. This group includes developing and transition economies [
43,
46,
47], which can provide access to their resources based on political intentions. This increases the level of international tension, a precondition for energy wars.
Future research can define energy strategies for various types of energy resources. Furthermore, the findings obtained might be extended by means of a more comprehensive methodological toolkit, in particular, through the use of different types of forecasting models and via the comparative analysis method. The research performed can be beneficial for policymakers or individuals governing the energy sector who are to respond to changing market conditions as fast as possible.
5. Conclusions
The lack of a stable political setting in the bulk of energy-producing countries poses a major threat to the global energy market. For instance, there is a risk of armed conflicts and terrorist attacks on energy infrastructure in the African continent, the Middle East, and the Caspian region. This study offered an energy dependence matrix, which shows which market players can actively participate in energy wars. It was found that energy-related decisions of energy-independent countries have an impact on both the global energy market and the national energy sectors of individual countries. The energy-independent economies are the United States, Russia, Saudi Arabia, the United Arab Emirates, Japan, Sweden, Switzerland, Australia, Denmark, and Iran. For these countries, the energy security threshold is rather high; it exceeds the forecasted value in both the short term and long term. This confirms that energy-independent countries are market leaders and their energy strategies can influence the overall energy situation.
In spite of the projected growth of energy dependency in short term, Denmark is likely to restore its position as a leader by 2030. Iran exhibits the smallest growth of energy independence amongst influential countries. Australia with its renewable energy policy is expected to significantly strengthen its energy independence. Forecasts for the United States and the UAE are also favorable. Russia’s level of energy independence will also become higher but at a slower pace when compared with that of the US and the UAE, largely due to fluctuations in exchange rates.
Economies with the potential to become energy-independent are more affected by price wars and pandemic outbreaks than energy-independent ones. For example, countries, such as China, Egypt, Brazil, Argentina, Turkey, and Latvia are at risk until 2025, as evidenced by the fact that the forecasted level of energy dependence has a value close to the threshold value. Other countries, such as Croatia, Great Britain, Uzbekistan, Germany, Estonia, Italy, Portugal, Austria, Kazakhstan, and Slovakia, exhibit a small positive variance between baseline and forecasted levels of energy dependency. Countries, such as Uzbekistan, Kazakhstan, Germany, and Poland have the opportunity to significantly strengthen their energy independence by 2030.
The least favorable forecast relates to countries most dependent upon energy imports. The only exception is Israel, which level of energy dependence will not exceed the threshold value. The most energy-dependent economies are Georgia, Moldova, Ukraine, and Serbia. At the same time, countries, such as Bulgaria, Greece, Israel, Hungary, Romania, India, Vietnam, and Azerbaijan, are likely to strengthen their energy independence by 2030.
Since energy-independent actors can affect the energy security of other countries, the level of energy dependence can serve as a key indicator for determining negative shifts in the energy market caused by market instability and energy conflicts. If the value of energy dependence exceeds the threshold value, the consequences may be negative. Energy-dependent and energy-independent economies both can move along the spectrum of energy dependency. Energy-independent countries can completely or partly lose their energy independence if chose an ineffective energy strategy. However, when the most dependent country strengthens its energy independence, it can only become partly independent. The proposed methodological approach is suitable for all groups of countries and allows preventing negative consequences of energy wars through minimizing the level of energy dependence.


