Article

Feasibility for Damage Identification in Offshore Wind Jacket Structures through Monitoring of Global Structural Dynamics

1
Department of Naval Architecture, Ocean & Marine Engineering, University of Strathclyde, Glasgow G4 0LZ, UK
2
Offshore Wind New Services Department, Ramboll, 20095 Hamburg, Germany
*
Author to whom correspondence should be addressed.
Energies 2020, 13(21), 5791; https://doi.org/10.3390/en13215791
Submission received: 9 October 2020 / Revised: 29 October 2020 / Accepted: 3 November 2020 / Published: 5 November 2020
(This article belongs to the Special Issue Risk and Integrity Management of Energy Assets)

Abstract

:
The modal response of a four-legged jacket structure to damages are explored and resulting considerations for damage detection are discussed. A finite element model of the Wikinger (Iberdrola) jacket structure is used to investigate damage detection. Damages, such as cracks, scour, corrosion and more, are modelled in a simulation environment. The resulting modal parameters are calculated, these parameters are compared to those from an unaltered structure and metrics are calculated including frequency change, modal assurance criterion and modal flexibility. A highly detailed design-model is used to conduct a sensitivity study on modal parameters for a range of changes. By conducting this on the same structure, this acts as a useful reference for those interested in the dynamic response of offshore wind jacket structures. Additionally, this paper addresses the issue of changes in mode parameters resulting from turbine yaw. This paper also considers the challenge of mode-swapping in semi-symmetric structures and proposes several approaches for addressing this. Damage typically results in a reduction of frequency and change in mode shapes, but in ways which can be distinguished from other structural changes, given the extent of this model. These findings are important considerations for modal-based damage detection of offshore wind support structures.

1. Introduction

Operation and maintenance activities make up a large portion of the levelized cost of energy for offshore wind power. Operators spend this money because the cost of failure is larger and comprises the cost of repairs, loss of productivity and loss of remaining fatigue life caused in the time the asset still operates while the structure is in a condition of exceeded design parameters. These exceeded design parameters could either be caused by damage, such as a crack, or environmental parameters, such as excessive scour. Detecting the exceedance of design parameters quickly can save a lot of money, identifying the type of damage and assessing its severity can provide considerable further benefits. For example, it was found in a cost-benefit analysis that implementing structural health monitoring on offshore wind support structures significantly reduced the operational expense [1,2].
The idea of modal analysis is that a damage or some other change to the structure causes a measurable change in the modal parameters. An example of where it can be particularly important to detect damage is after a seismic event, which can cause significant change in the structure’s dynamic response. This is a problem facing offshore wind as it expands to locations with seismic activity [3,4]. While a single earthquake can cause notable damage, there are often repeated, sequential incidents which are even more impactful [5]. The action of earthquakes on offshore structures is also very complex, involving seismic waves and non-linear structural responses [6], so using measured data can provide valuable insights into these situations [7]. Damage detection of structures can either be in an experimental modal analysis, where a load is applied, or operational modal analysis (OMA), where operational loads provide excitation to the structure [8]. In OMA, the excitation energy comes from operational loads. The operational excitation should be uniform in terms of frequency domain, and therefore, any non-uniformity in the measured response is due to the structure itself. This assumption of frequency domain uniformity is generally not consistent with wind energy but can be approximately satisfied enough to discern structural modes [9].
Vibration based damage detection has been developed since the 1970s, and a broad range of detection methods have been derived, however, choosing a method for offshore wind structures should be done with the limitations in mind. With many newer constructions, ‘virgin state’ modal data is collected, so there is an ‘intact’ condition to compare to. This comparison can be done either on derived modal parameters [10,11,12] or directly on the measured signal [13,14], although the latter is challenging due to the signal’s direct dependence on environmental conditions.
A limitation, however, is that, due to the expense and challenge of recording data from offshore wind turbines, usually only a handful of sensors are placed. For vibration approaches, these sensors are usually accelerometers [15,16] but can sometimes be fiber Bragg grating [17,18]. This small number of sensors makes methods such as curvature-based methods [19], or the Rayleigh quotient-based methods [20], impractical, despite their promise. Thus, any method used must work with only a few sensors. There have been studies aimed at using a combination of data sources to assist in damage detection; an example is Cevasco et.al. investigated the potential for damage detection using typical SCADA (Supervisory Control And Data Acquisition) data and found that the approach showed promise given the right machine learning models were used [21]. Additionally, a data fusion approach was proposed in another paper, which combined accelerometer with inclinometers and found that doing so greatly improved the effectiveness in damage detection [22].
However, if only a few accelerometer signals are recorded, then damage detection can be dependent on the ability to discern certain modes of the structure and hence calculate mode-based metrics. Some suitable approaches include eigenfrequencies, modal assurance criterion (MAC) and modal flexibility. Some methods, such as multiple damage location assurance criteria (MDLAC) [23] compare numerically calculated modes to measured modes, to identify a damage, one would then take the case which maximized the MDLAC value. Following such an approach, of comparing to a numerical model, necessitates a good numerical model. The modal parameters can be attained with solving the eigenvalue problem.
Although real data can be used for lifetime extension [24], there are very limited data on already failed structures. The lifetime of the structure is dependent on complex, stochastic loading [25] and there is also significant interdependence between failure modes, for example corrosion, in particular pitting corrosion, plays a role in both the initiation and propagation of cracks [26]. To overcome the lack of existing cases of identified structural damage, in exploring damage detection approaches, researchers have used numerical models of offshore jacket structures with a simulated damage and calculated damage metrics. These structures have predominantly been oil and gas platforms, but some include wind energy structures. The aims have typically been evaluation of the metric and its suitability for a generic structure. Some researchers did so with the aim of evaluating effectiveness given measurement noise; for example, Malekzehtab et al. used mode shapes and natural frequency in an objective function, combined with a penalty term to avoid false positives [27]. Liu et al found, in a Monte-Carlo simulation, that using modal flexibility in a damage detection problem could still be successful with 3% noise [28]. Other researchers aimed for a method robust to environmental factors. Wang et al. used Modal Strain Energy Decomposition to detect damage with temperature variations [29], while others used a residual strain energy-based approach [11,12]. Neural networks have also been employed for damage detection, for example [14,30], both of which found this to achieve even higher accuracy than other methods.
This paper can be of significant value for those looking to conduct modal-analysis based work on offshore wind jacket structures, as it gives a detailed view of the response of these structures to several potential damages and changes in parameters. By having several damage effects presented in a single paper, this can act as a reference for either mode-based damage detection or further study. This work differs from other studies in this area in four ways. (1) This paper uses a more detailed model to investigate damages which can not only capture their effects in a more realistic way, but also allows for the investigation of other aspects. (2) Other works have typically not included the mass and moment of inertia for the rotor nacelle assembly (RNA), however, this aspect is important for wind turbines, as it makes the modal properties not rotationally symmetric around the tower and makes a substantial difference to the mode shapes—it is found that for jacket structure, the orientation of RNA must be considered. (3) A broader range of ‘damages’ are simulated including global scour, corrosion and marine growth, as well as a sensitivity study to various soil parameters. By having this broad range applied to the same structure and in one paper allows for a clear reference. (4) Mode switching is a known and troublesome phenomenon in the mode-based damage detection of pseudo-symmetrical structures; this paper explores ways of overcoming it.
In terms of damage identification, there are four levels: damage detection, damage localization, damage severity assessment and damage consequence/progression [31]. Simply knowing that a damage has occurred—damage detection—can be of great benefit for an offshore wind jacket structure, as inspection teams can be sent to investigate. Further benefit can be gained through knowing where damage has occurred, as time and resources can be saved in planning the repair of the damage. Quantification of damage can provide more benefit still, allowing judgements to be made about the criticality of the damage and how it affects future operation. To achieve all four levels, it is required to have both direct sensing and dedicated models [32]; this can be very expensive. A more cost-effective approach is to use a detailed model which was used for the design of the structure to conduct virtual sensing. By using Operational Modal Analysis (OMA), combined with a numerical solution to the eigenvalue problem, information can be obtained on both the current state of the structure as well as how it might respond to damage.
This paper aims to show what information can be gained from a numerical, structural model and what lessons can be learned and applied to OMA in the hopes of achieving the four damage detection levels.
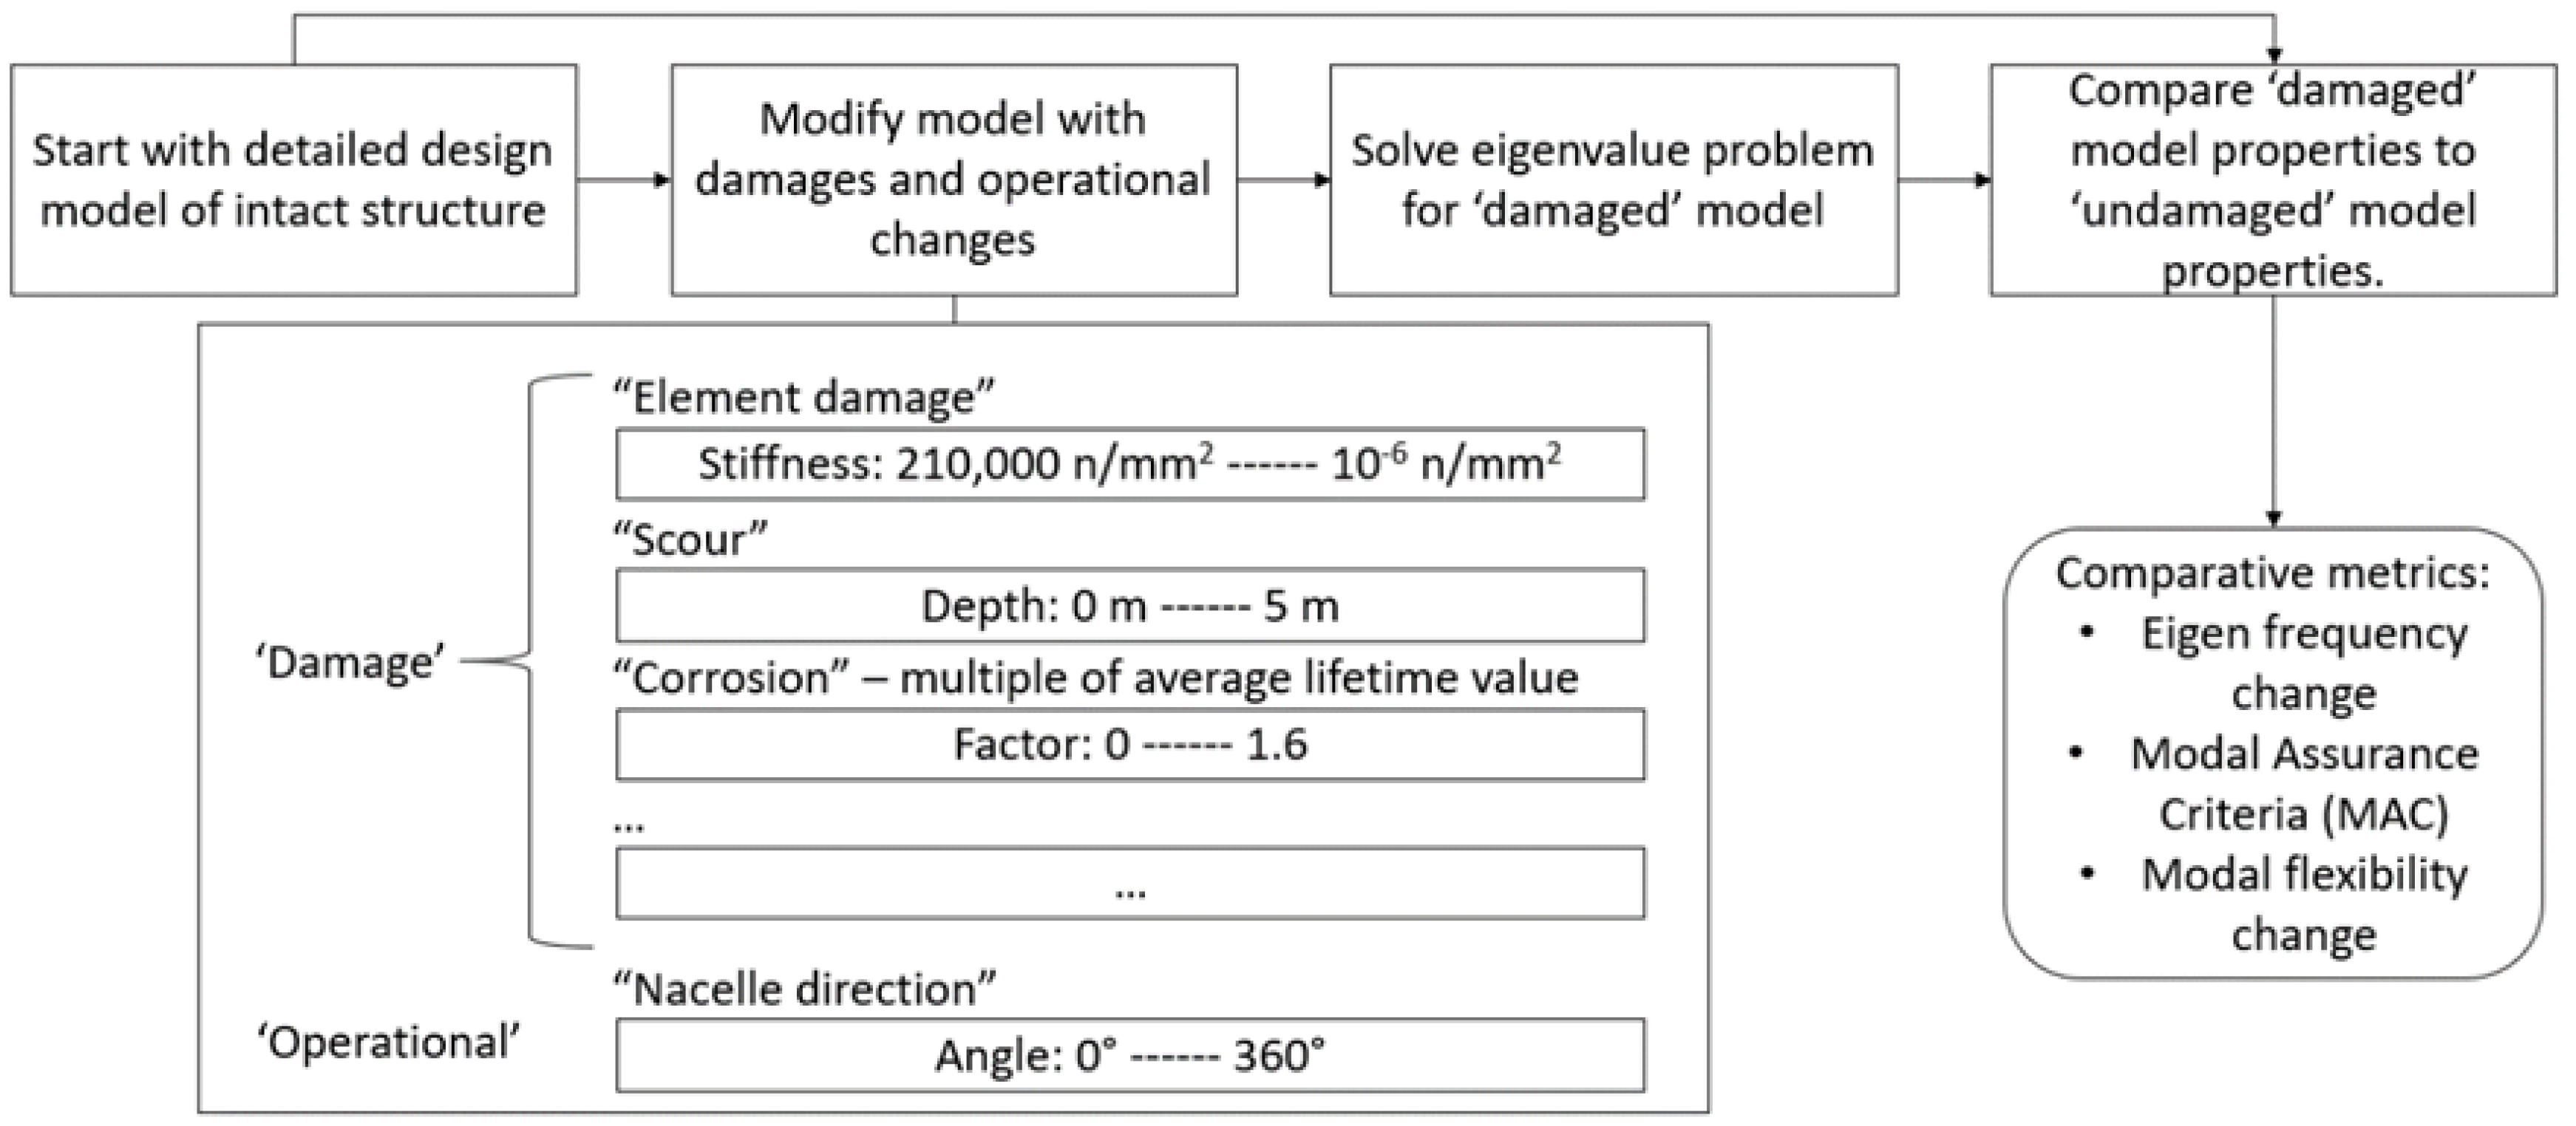
The approach followed in this paper is presented diagrammatically in Figure 1. The process followed is to alter a detailed design model with simulated damages, solve the eigenvalue problem for that model and compare the modal properties to the unaltered model. ‘Damages’ include element damage, global scour and corrosion. The operational condition altered is the nacelle direction.
A limitation of this paper is that there are no laboratory tests or operational data for comparison. This is unfortunate, but unavoidable. The real structure from which the model was based is not damaged, so no damaged operational data is available. Additionally, because so many parameters are investigated in this paper, and the model incorporates so many details, a laboratory model of all of this would be unfeasible. There are other published publications in this field with the same limitation, for a few examples: [11,15,33].
The paper begins with the damage quantification approach in Section 2, which presents the metrics used and the equations for calculating them. In Section 3, the structure evaluated in this case study is presented along with information about the numerical model used. The types of damage replicated in the numerical model and the method for implementing them are given in Section 4. Results are presented in Section 5 and Section 6; the results in Section 5 are presented separately, because they are useful for understanding Section 6, which is the outcomes from each damage case. Finally, a discussion is given in Section 7 and a conclusion in Section 8.

2. Damage Identification Approach

2.1. Metrics and the Modal Assurance Criterion Equation

Two of the fundamental modal parameters of the structure are the natural frequency and the mode shape. The natural frequency is the frequency at which each mode shape occurs, and the mode shape is the vector in which the structure oscillates. The natural frequencies can easily be compared as they are scalar quantities; however, the mode shapes are vectors and so require an additional step for comparison.
MAC is commonly used to compare mode shapes, not only in numerical modelling, but also in OMA. The equation for calculating the MAC, for two vectors { φ A } and { φ X } , is given in Equation (1) [34]. This gives a value ranging from 1 to 0, where a value of 1 indicates that the mode shapes are fully consistent, while a value of zero indicates that they are totally inconsistent.
M A C ( A ,   X ) =   { φ A } T { φ X } 2 ( { φ A } T { φ A } ) ( { φ X } T { φ X } )

2.2. Algorithms, MAC vs. Frequency

When solving the eigenvalue problem, a set of natural frequencies and their corresponding mode shapes are determined. For a set of mode shapes, the convention is to assign these modes labels based on the order of low to high natural frequency. It is observed that damage can cause the dynamics of a system to change, resulting in a shift of both natural frequency and mode shapes. As each ‘damaged’ case is distinct and not tied through some time history to an ‘undamaged’ case (and the same for two observations in an OMA situation), making comparisons based only on mode number is not always appropriate, as will be shown in the results of this paper. This mode switching, which is an issue for pseudo-symmetrical structures, raises the question of which comparison should be made for a reliable identification of damage. This is important because in this study, the wrong pairing could show that a type of damage is easily detected, when it is not or that changes in the wrong modes indicate a certain type of damage. If the wrong pairing is chosen in an OMA situation, then it could lead to a false alarm.
An approach that is used in this paper is to select mode pairings such that the total sum of MAC values is maximized, thus, assuming the minimum change in the system. This assumption is not always valid so care is taken when applying it–in this paper it is found to be not appropriate when there is a very large change in the mode shape. To maximize the MAC value selection, a Kuhn-Munkres algorithm, sometimes called the ‘Hungarian algorithm’, is used [35]. This method reliably selects the highest total MAC value. Both this method and the method of selecting the diagonal elements are used, but often only one is shown.

2.3. Modal Flexibility Based Damage Metric

The approach of using modal flexibility for damage detection was presented by Liu et al. [28]. Modal flexibility presents an attractive means of deriving a damage index, as it is calculated as a combination of mode shapes and frequencies, there is no need for matching of mode shapes between damaged and intact. Additionally, as will be shown in the results, it is also relatively unaffected by changes to the turbine direction compared to the MAC values. One downside is that modal flexibility is affected more by lower modes than higher ones; in this case, changes only observed in higher modes cause less of a change in the modal flexibility. With virtual sensing the global modes 1–5 are targeted to reduce the number of sensors required in a potentially real case. In this study, the damage index used is the Frobenius norm of the modal flexibility residuals. This is calculated using the following equations. First, the modal flexibility is:
F =   i = 1 n φ i φ i T ω i 2
where φ i is the mode vector and ω i the natural frequency for each i mode. A modal flexibility residual is then calculated as the difference between the intact and damaged cases.
F R e s i d u a l = F H e a l t h y F D a m a g e d
A single damage index is then derived using the Frobenius norm of this residual.
| | F | | F = i = 1 m j = 1 m F R e s i d u a l 2
This approach is useful to indicate the level of damage but since the damage index is only a single value, it does not give enough information to diagnose the damage. Used in combination with MAC and change in natural frequency, more information about the effect of the damage can be ascertained.

3. Case Study Structure and Model

The structure being evaluated is a four-legged jacket structure from the Wikinger wind farm, which is owned by Iberdrola. These jackets are situated in the Baltic Sea with a 39–42 m water depth. Their footprint is 23 m by 23 m, and the jacket is 62 m tall. The turbine is a 5 MW, Adwen AD 5–135 turbines [36]. The structure is fixed to the seabed using 40 m long pile foundations at each leg [37]. The 67 m long blades are not modelled; however, the structure is modelled with the moment of inertia and mass to represent the blades and nacelle.
Ramboll’s in-house software package, ROSAP (Ramboll Offshore Structural Analysis Package), is used to conduct the eigen value analysis. Ramboll have developed this over the past 30+ years. Version 53 is used in this case [38]. The ROSAP package, and the module ROSA, has been used for the design of the majority of offshore wind turbine foundations worldwide [39].
ROSA (Ramboll Offshore Structural Analysis) is design software which uses beam elements for frames, truss structures and piping systems. The transition piece is modelled as a ‘super element’ where the complex shape is analyzed in ANSYS and the results are used as an element in this model. The soil structure interaction is conducted considering each soil layer and in accordance with API (American Petroleum Institute) standards [40].
Only the first five mode shapes and corresponding eigenfrequencies are investigated in this paper and the reasons for this come from the rationalization that the aim is to reflect practical measurement of operational global dynamics. While a coupled dynamics analysis will result in modes from sources such as the blades [41], this eigen analysis only gives structural modes, and so, the first five modes are major structural modes. The reason for not using higher modes is that in practice, in an OMA situation for offshore wind structures, lower modes can more reliably be detected and the most significant are first and second order fore-aft and side-side modes [
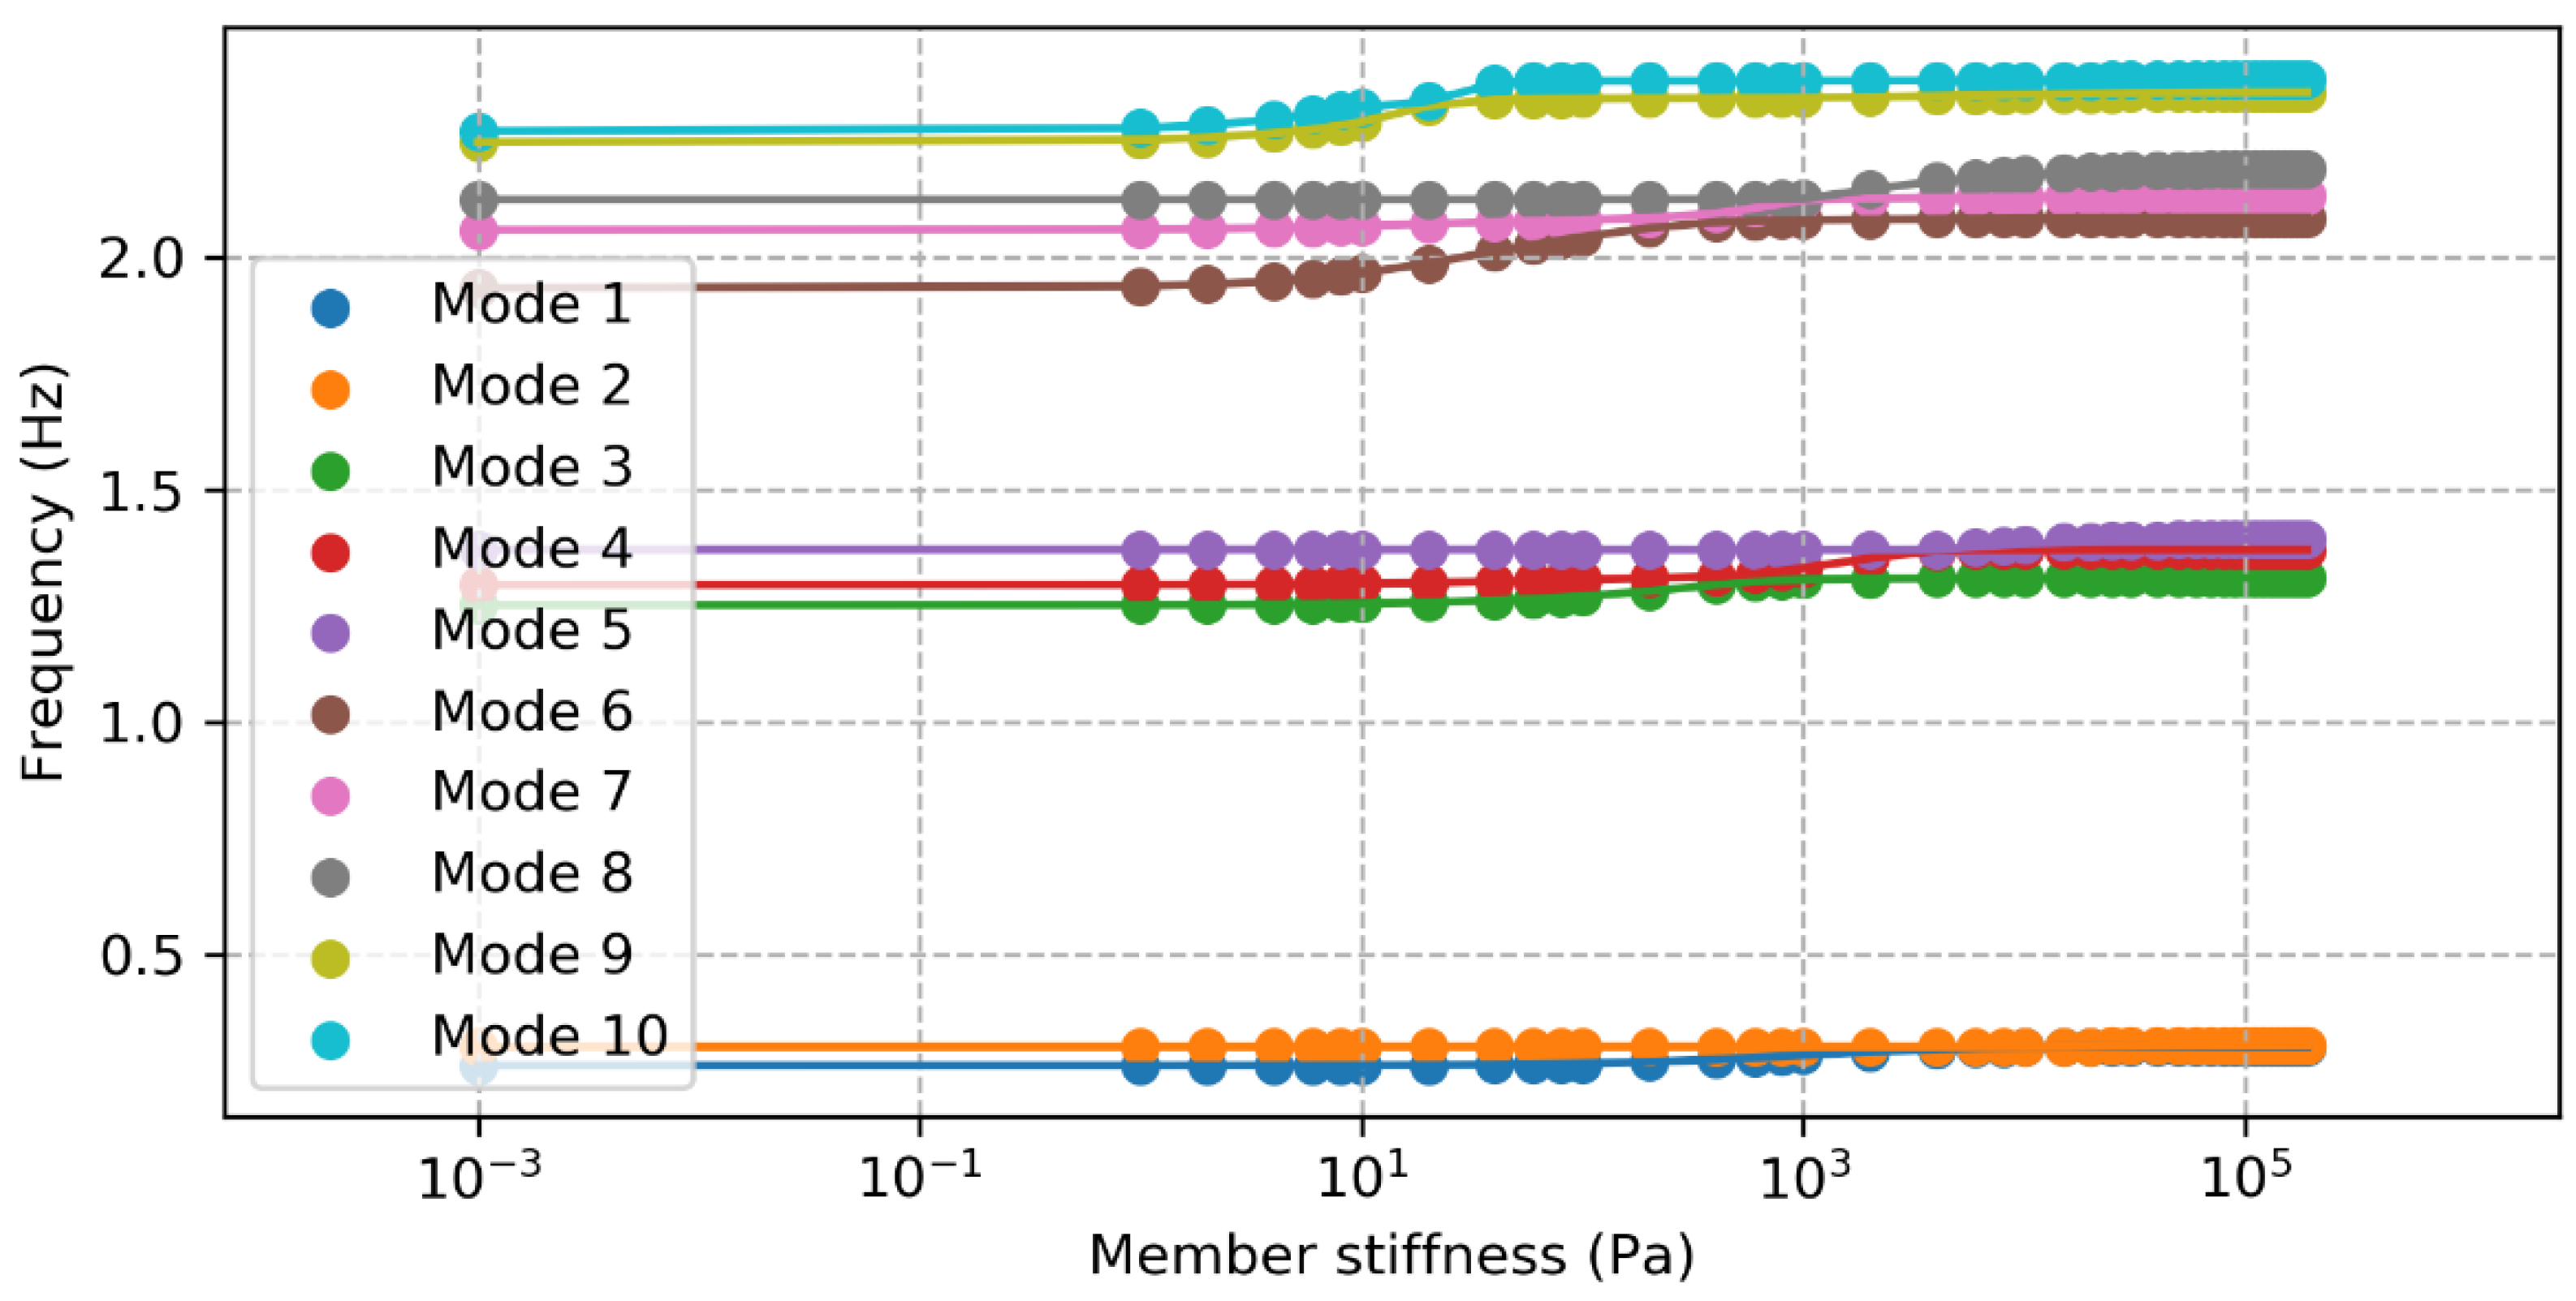
16]. In this structure, the frequency of the sixth mode is much higher than the fifth, and so even with significant damage the frequencies do not change enough for a mode 6 or higher to be mistaken for mode 5 or lower. An example demonstrating the difference in eigenfrequencies can be seen in Figure 2, which shows the eigenfrequencies of the first 10 modes as a leg element is damaged. This demonstration shows that even after a large change in the structure, the sixth eigenfrequency is still much higher than the fifth.
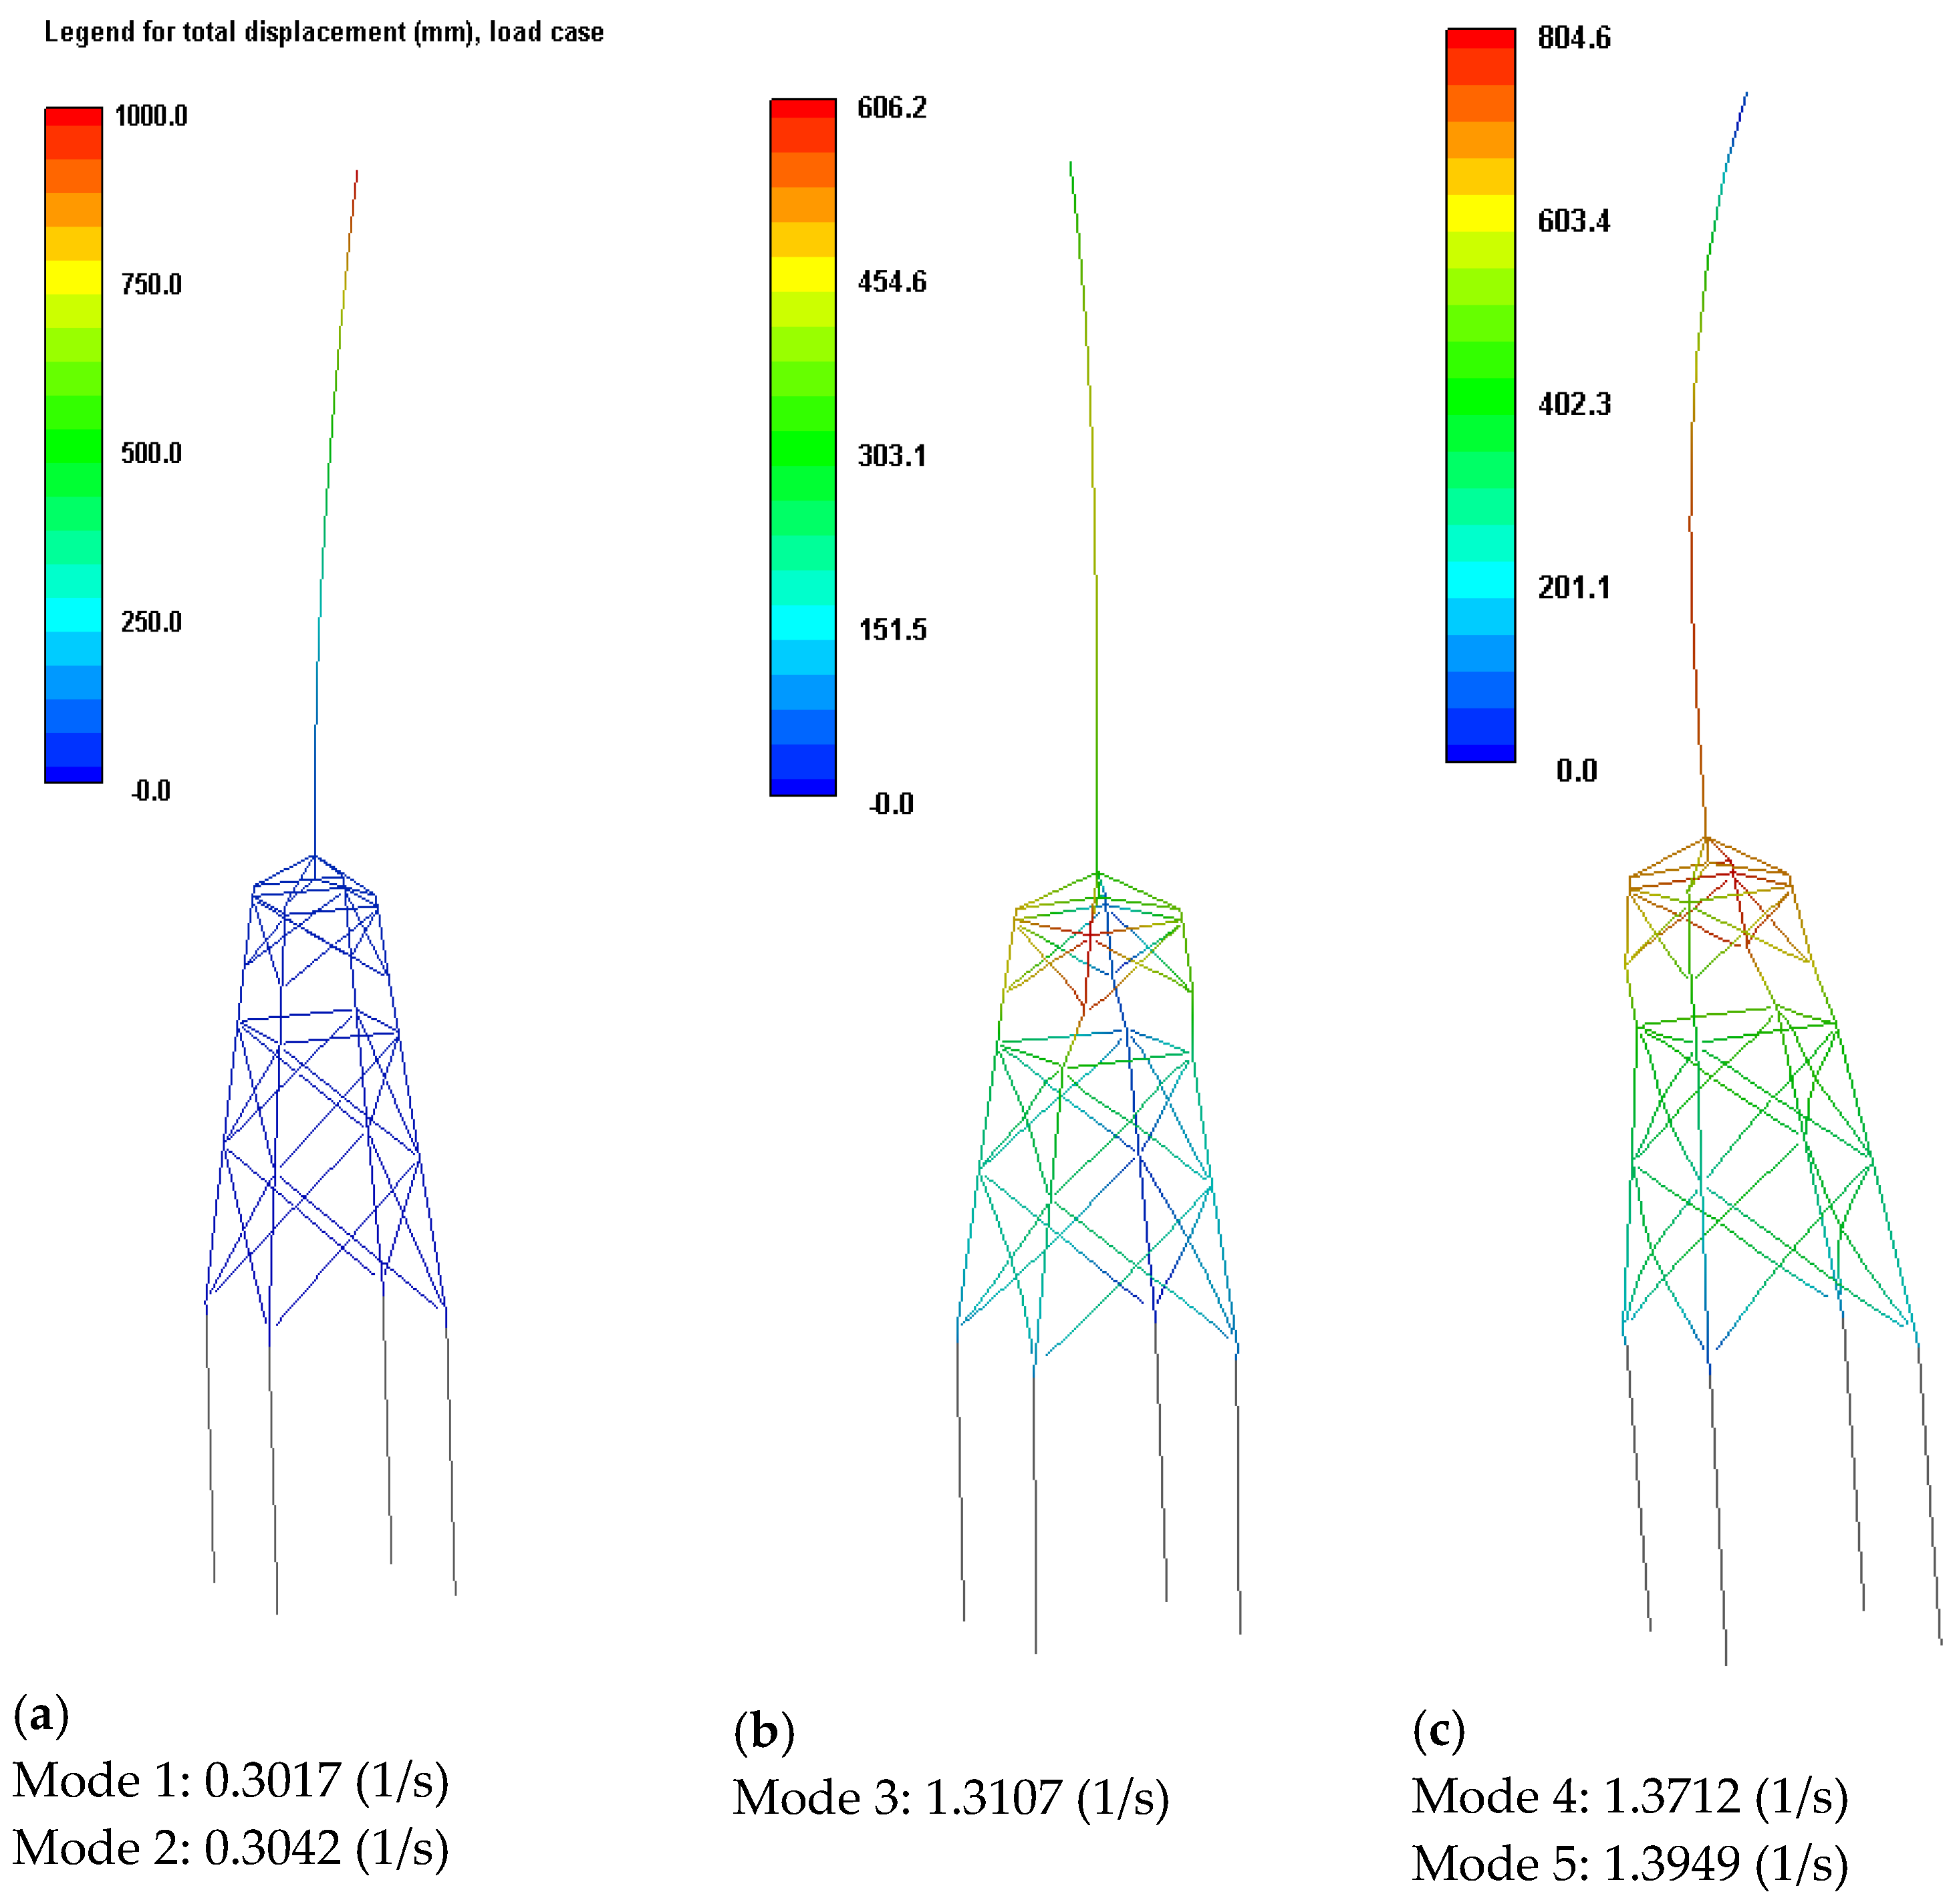
Of the five modes calculated, the first two are both tower modes which are tower fore-aft and side-side. The third mode is a torsional mode while the fourth and fifth are both tower-swaying modes. Plots of these modes along with their respective frequencies, are shown in 
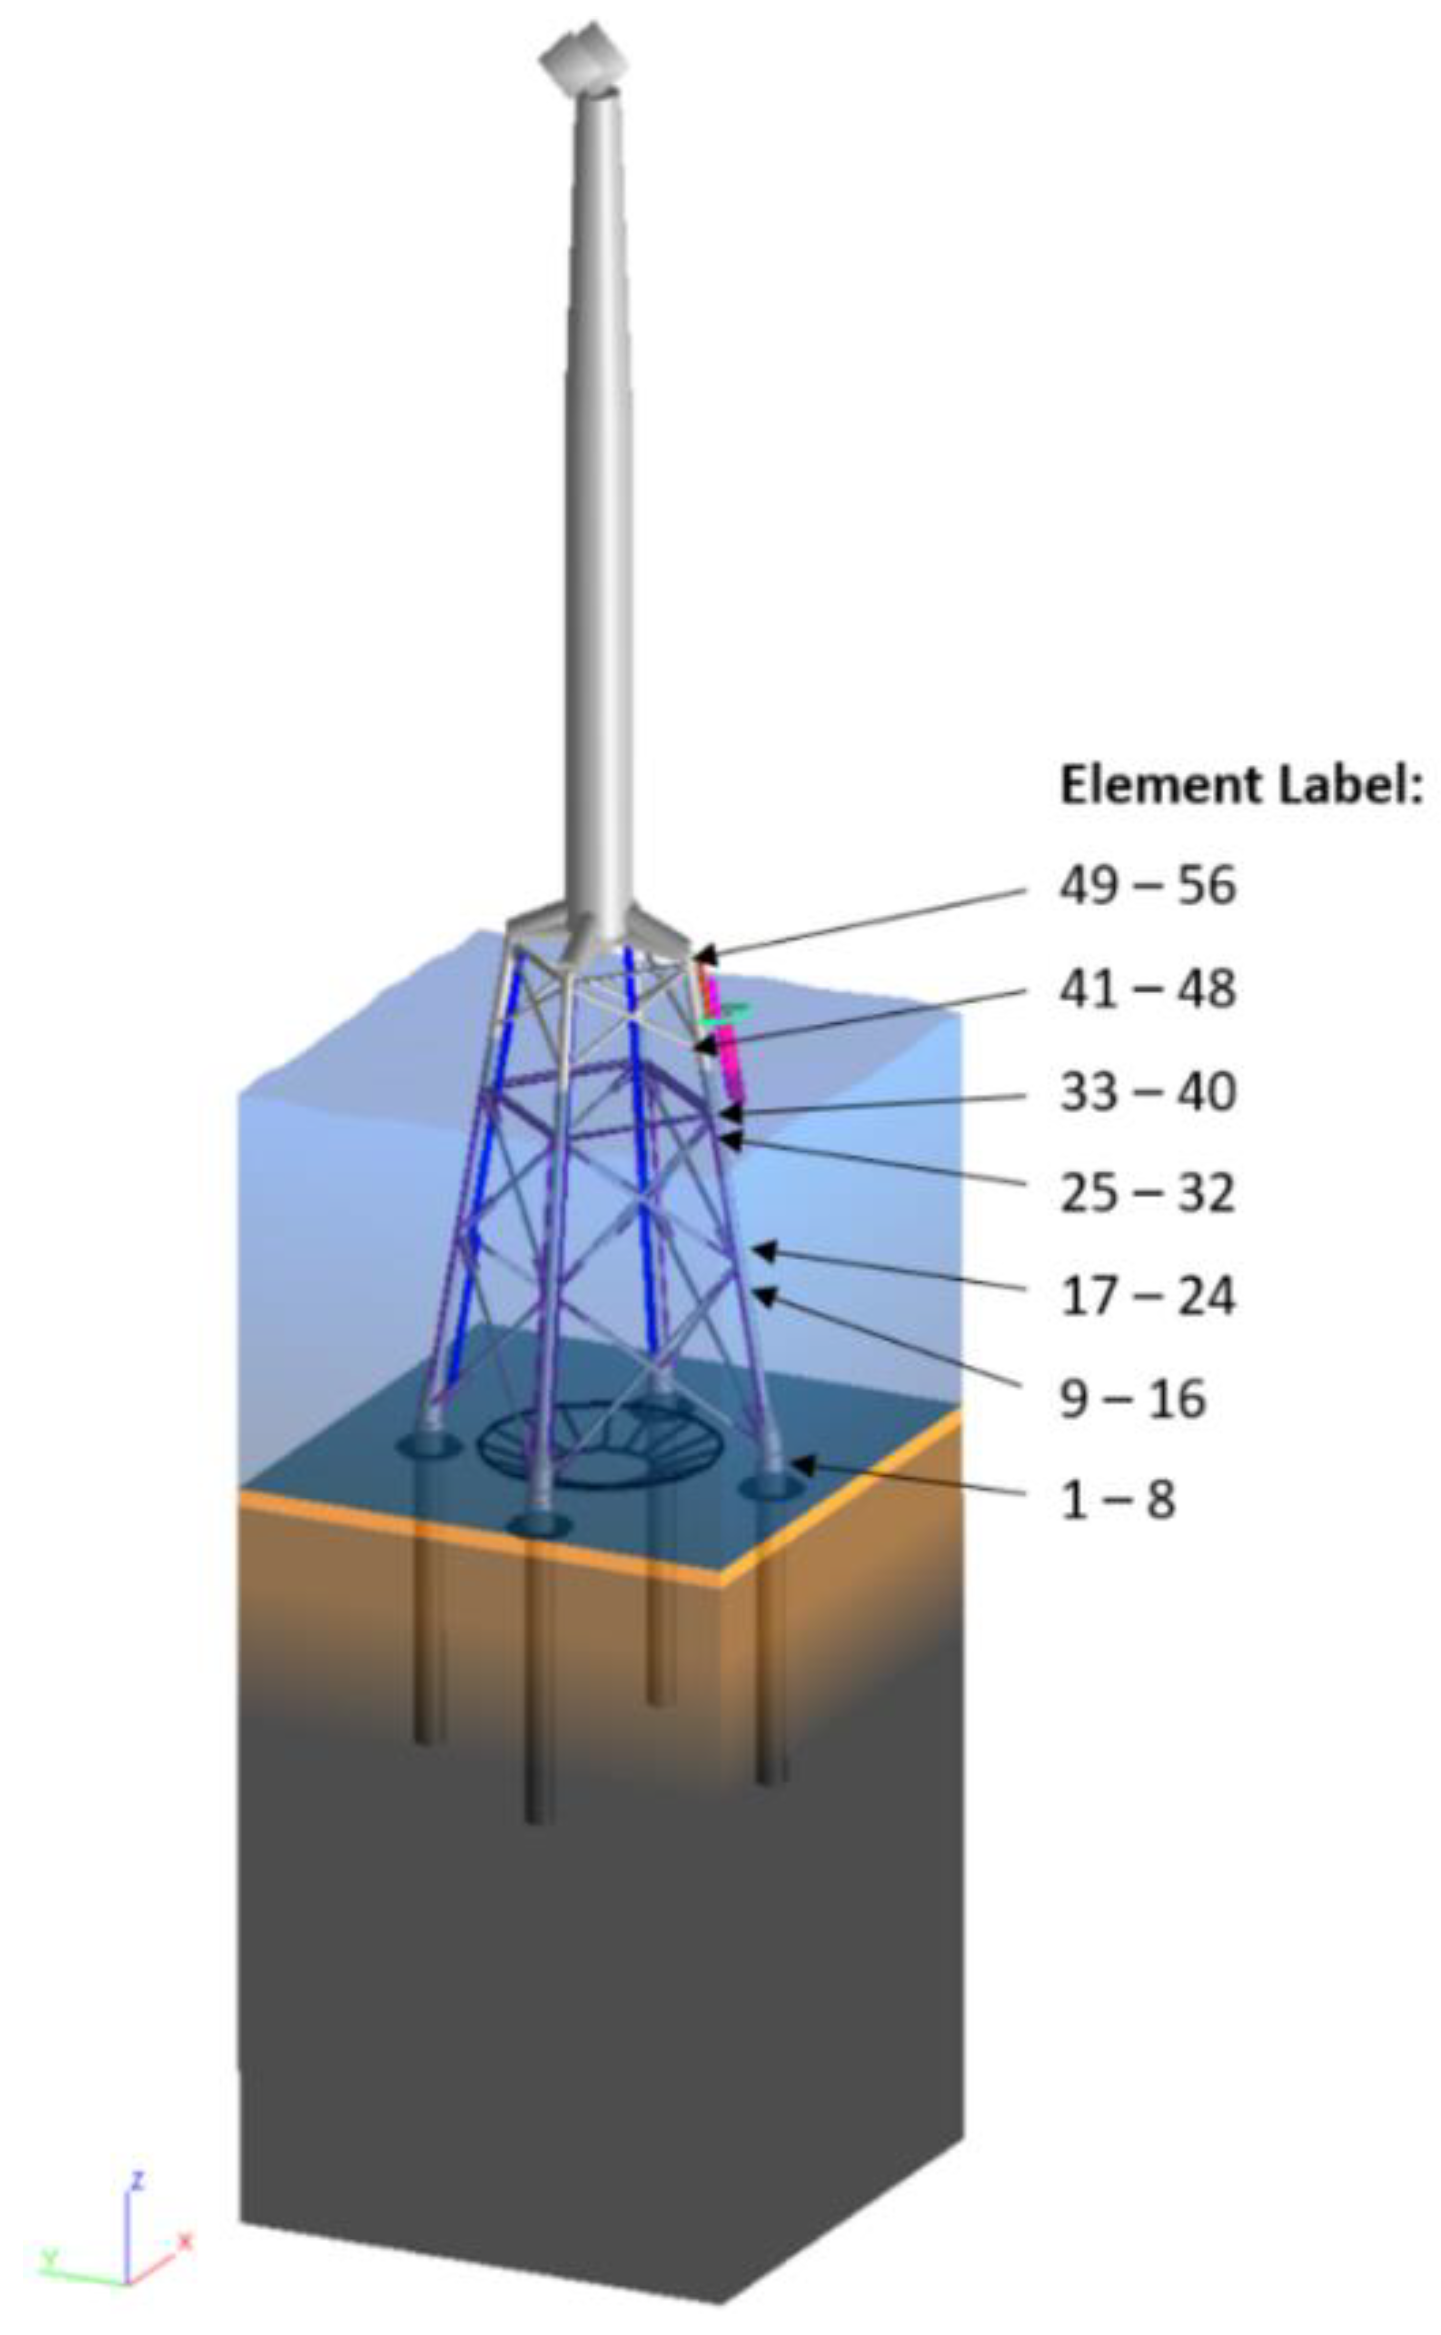
Figure 3, with modes 1 and 2, as well as modes 4 and 5 shown together. A representation of the structural model is shown in Figure 4.
Fundamentally, ROSA works in the same way as any beam-element based structural model which solves the eigenvalue problem and so these results can be reproduced with other, similar software.
A wide range of relevant parameters are included in ROSA, and can be adjusted by the user in ‘cards’ within the text-based input file. Some of these parameters include element and joint stiffness; corrosion; scour, both global and local in addition to a range of other items. The parameters changed are discussed in more detail in the following section.
There are several failure mechanisms which are time dependent and expected to occur, such as marine growth, scour, corrosion and some others [42,43]. The model includes these at the level which they are generally expected, or an average amount over the lifetime of the structure. In cases when one of these parameters is varied, they might be given as a multiple of this expected value or as a measurable value, as appropriate. For example, corrosion is defined as a profile with respect to depth, and so, this is varied as multiplied by a factor, however, global scour can be quantified with just scour depth and so this value is given.

4. Structural Model and Damage Modelling

4.1. General Approach

Each case is an eigen value solution from the ROSAP model. This has both advantages and disadvantages and it is important to be aware of them. The disadvantage is that environmental impacts, such as damping from wind or waves is not considered as they would be in a coupled dynamics simulation. The advantages are that it is possible to consider a wide range of damage cases and focus on the direct impact to the structural dynamics. Environmental impacts are not considered here, because they can be measured in a real structure without causing any damage and so real measurements can be referenced for this [15]. Some examples of these measurements in the literature, which include temperature variation, can be found at these references [16,44]. Frequency based measurements are temperature dependent and so when results of frequency changes are presented in this paper, the reader should bear in mind this change.
As each damage case is implemented, only one damage is implemented at a given time. There is an average, expected state, which has some level of scour and corrosion at values which are expected, and everything is changed relative to this.

4.2. Joint Damage

Previous research into damage detection have used models which implement a damage in a finite element analysis (FEA) model typically have focused on damage of joints [27]. The element stiffness has typically been reduced in order to simulate the damage. Considering typical equations used in deriving equations of motion, change in stiffness and change in area result in proportional results. An example of this is shown using Lagrange equation given for reference in Equation (5).
U =   1 2 E A 0 L ( u x ) 2 d x  
where U is the strain energy, x is the length along the element and u is the displacement, while E is modulus of elasticity and A is cross-sectional area. The assumption that a change in stiffness is proportional to a change in area, due to the growth of a crack is not always strictly realistic, but for investigating the first five natural frequencies this assumption has been made by other authors [29,45].
Two types of joint damage are implemented: complete loss of the joint and gradual loss. The jacket structure is composed of four legs and the legs are joined by cross members. The cross members are less significant to the modal properties than the legs and so all of them are tested in a complete loss. The legs are integral to the structural integrity of the jacket and their complete loss is typically not survivable. Instead of modelling the complete loss of the legs, the gradual reduction in stiffness of two leg elements is modelled. This is done with the idea of determining whether the reduced stiffness impacts the modal properties in a noticeable enough way that the impending loss can be detected through OMA before complete loss occurs. This is modelled in multiple stages where, at each stage, the stiffness of the joint is altered and then the modal properties are determined.
Based on the previous discussion in this section, the physical meaningfulness of these changes in Young’s Modulus is representative of a crack at two general values: (1) relatively low reductions in E, where the effect is roughly proportional to reduction in area due to the crack; and (2) reduction of E to 0, where the joint no longer supports load. The range of E where it is significantly reduced, but not yet 0, is too large to draw a direct reference to a crack growth.

4.3. Pile Interaction

Multiple parameters are modelled and can be changed in ROSA. The soil-structure interaction is modelled using the approach recommended by the API recommended practice RP 2A [40] and dynamic loading. The soil is modelled as springs with stiffness dependent on displacement factors which can be applied to these curves to either compress or elongate them. The soil itself is modelled in layers, each with a characteristic strength. Both local and global scour are modelled.
The parameters investigated are scour, P-Y/Z/W displacement factors and characteristic soil strength. Scour is varied from 0 m to 5.5 m, which, in this case, is removing the top layers, exposing pile length. The displacement curves are multiplied by a factor which either compresses or elongates the curves. This is not representative of any physical process but rather investigates the possibility of uncertainty in this parameter. All characteristic strength values are multiplied by a factor from their original, ‘expected’ value—this is also not representative of a process but an investigation of variation.

4.4. Bolted Connection

The tower is connected to the transition piece through a bolted flange connection, where tightness of the bolted connection must always be ensured. Loosening can be detected with sensors on the bolts or with an inspection, but this study investigates if this can be detected in modal parameters.
The individual bolts are not modelled in ROSA but rather the interface between the tower and transition piece is modelled as a node with a stiffness value. To model the loosening of the bolts, the stiffness of this node is gradually reduced from its original values down to 0. The physical meaningfulness of this is not a reduced joint stiffness with the members in contact, but rather points at which separation of the clamped members occurs resulting in a lower stiffness. The equation for the stiffness, k f r , of an individual bolted connection (frustum) is given in Equation (6) and the total joint stiffness, k g r i p , is given in Equation (7) [46]. Where d is the inner diameter of the frustum, D is the smallest value of the frustum outer diameter, t is the frustum thickness and α is the pressure angle of the cone. The tension in the bolt does not come into these equations and so, based on this, as the tension is lost, there would be no change in joint stiffness. However, when significant load is applied, there is a point of separation between the two bolted members and all the load is then carried in the bolts, which have a lower stiffness than the members. It is this stiffness after separation which might be observed by the change in modal parameters.
k f r =   π E d t a n ( α ) l n [ ( 2 t tan ( α ) + D d ) ( D + d ) ( 2 t tan ( α ) + D d ) ( D + d ) ]
k g r i p =   1 1 k f r 1 + 1 k f r 2 + + 1 k f r N

4.5. Corrosion and Marine Growth

In ROSA, corrosion is modelled as a reduction in material thickness with both internal and external corrosion, but with the mass of the corroded material still included in calculations. The equivalent outside diameter is unaffected by this. The amount of corrosion is set based on the elevation, since the level of corrosion is driven by variables that change with depth. A certain amount of expected corrosion is included in the model, the values used in the model are a multiple of this expected level of corrosion by a factor, assuming a linear growth. The expected values for corrosion are both internal and external and range from around 1 to 12 mm, depending on height on the structure and exposure zone. One of the main concerns of marine corrosion is that it can exacerbate the initiation and growth of cracks and so detecting it is important [47].
Marine growth affects the mass as well as the surface roughness height, thereby affecting structural mass as well as damping due to changed fluid dynamics [48,49,50]. As with corrosion, the values are set based on depth. The values are plotted as a multiple of an expected value.

5. Detectability Considerations

5.1. Dependence on Nacelle Direction of Modal Properties in Intact Condition

The turbine blades and nacelle have a large mass and moment of inertia and, as a result, their position relative to the rest of the structure has a significant impact on the modal parameters of the structure, which is particularly apparent, due to the structure’s lack of rotational symmetry. Therefore, it is necessary to investigate the effect from changing nacelle yaw direction.
The nacelle and blades are modelled here as point masses with pre-assigned moment of inertia values. To model the nacelle yawing from the original reference direction, the point masses are moved around the tower by 1 degree each iteration, and the moment of inertia components are transformed correspondingly. This process of changing the direction is then repeated for a ‘damaged’ case, with joint loss at the middle of a leg element.
To determine the response of the structure with the nacelle yawed away from the original direction and compare it back to the original reference direction, the mode shapes are then transformed back to the original reference direction and compared to the ‘intact’ case at the original direction; the transformation is conducted using elementary coordinate rotation as shown in Equation (8) [51], which is applied for both translation and rotation values. An alternative approach is to compare ‘damaged’ at θ degrees to ‘intact’ at θ degrees where θ is each change from the reference. The first method is used here rather than the second as this would make future comparison to operational data more convenient since the directional values in operational data are effectively continuous. This method also allows them to use more of the data rather than only comparing subsets.
( x y z ) = ( c o s   θ s i n   θ 0   s i n   θ c o s   θ 0 0 0 1 ) ( x y z )
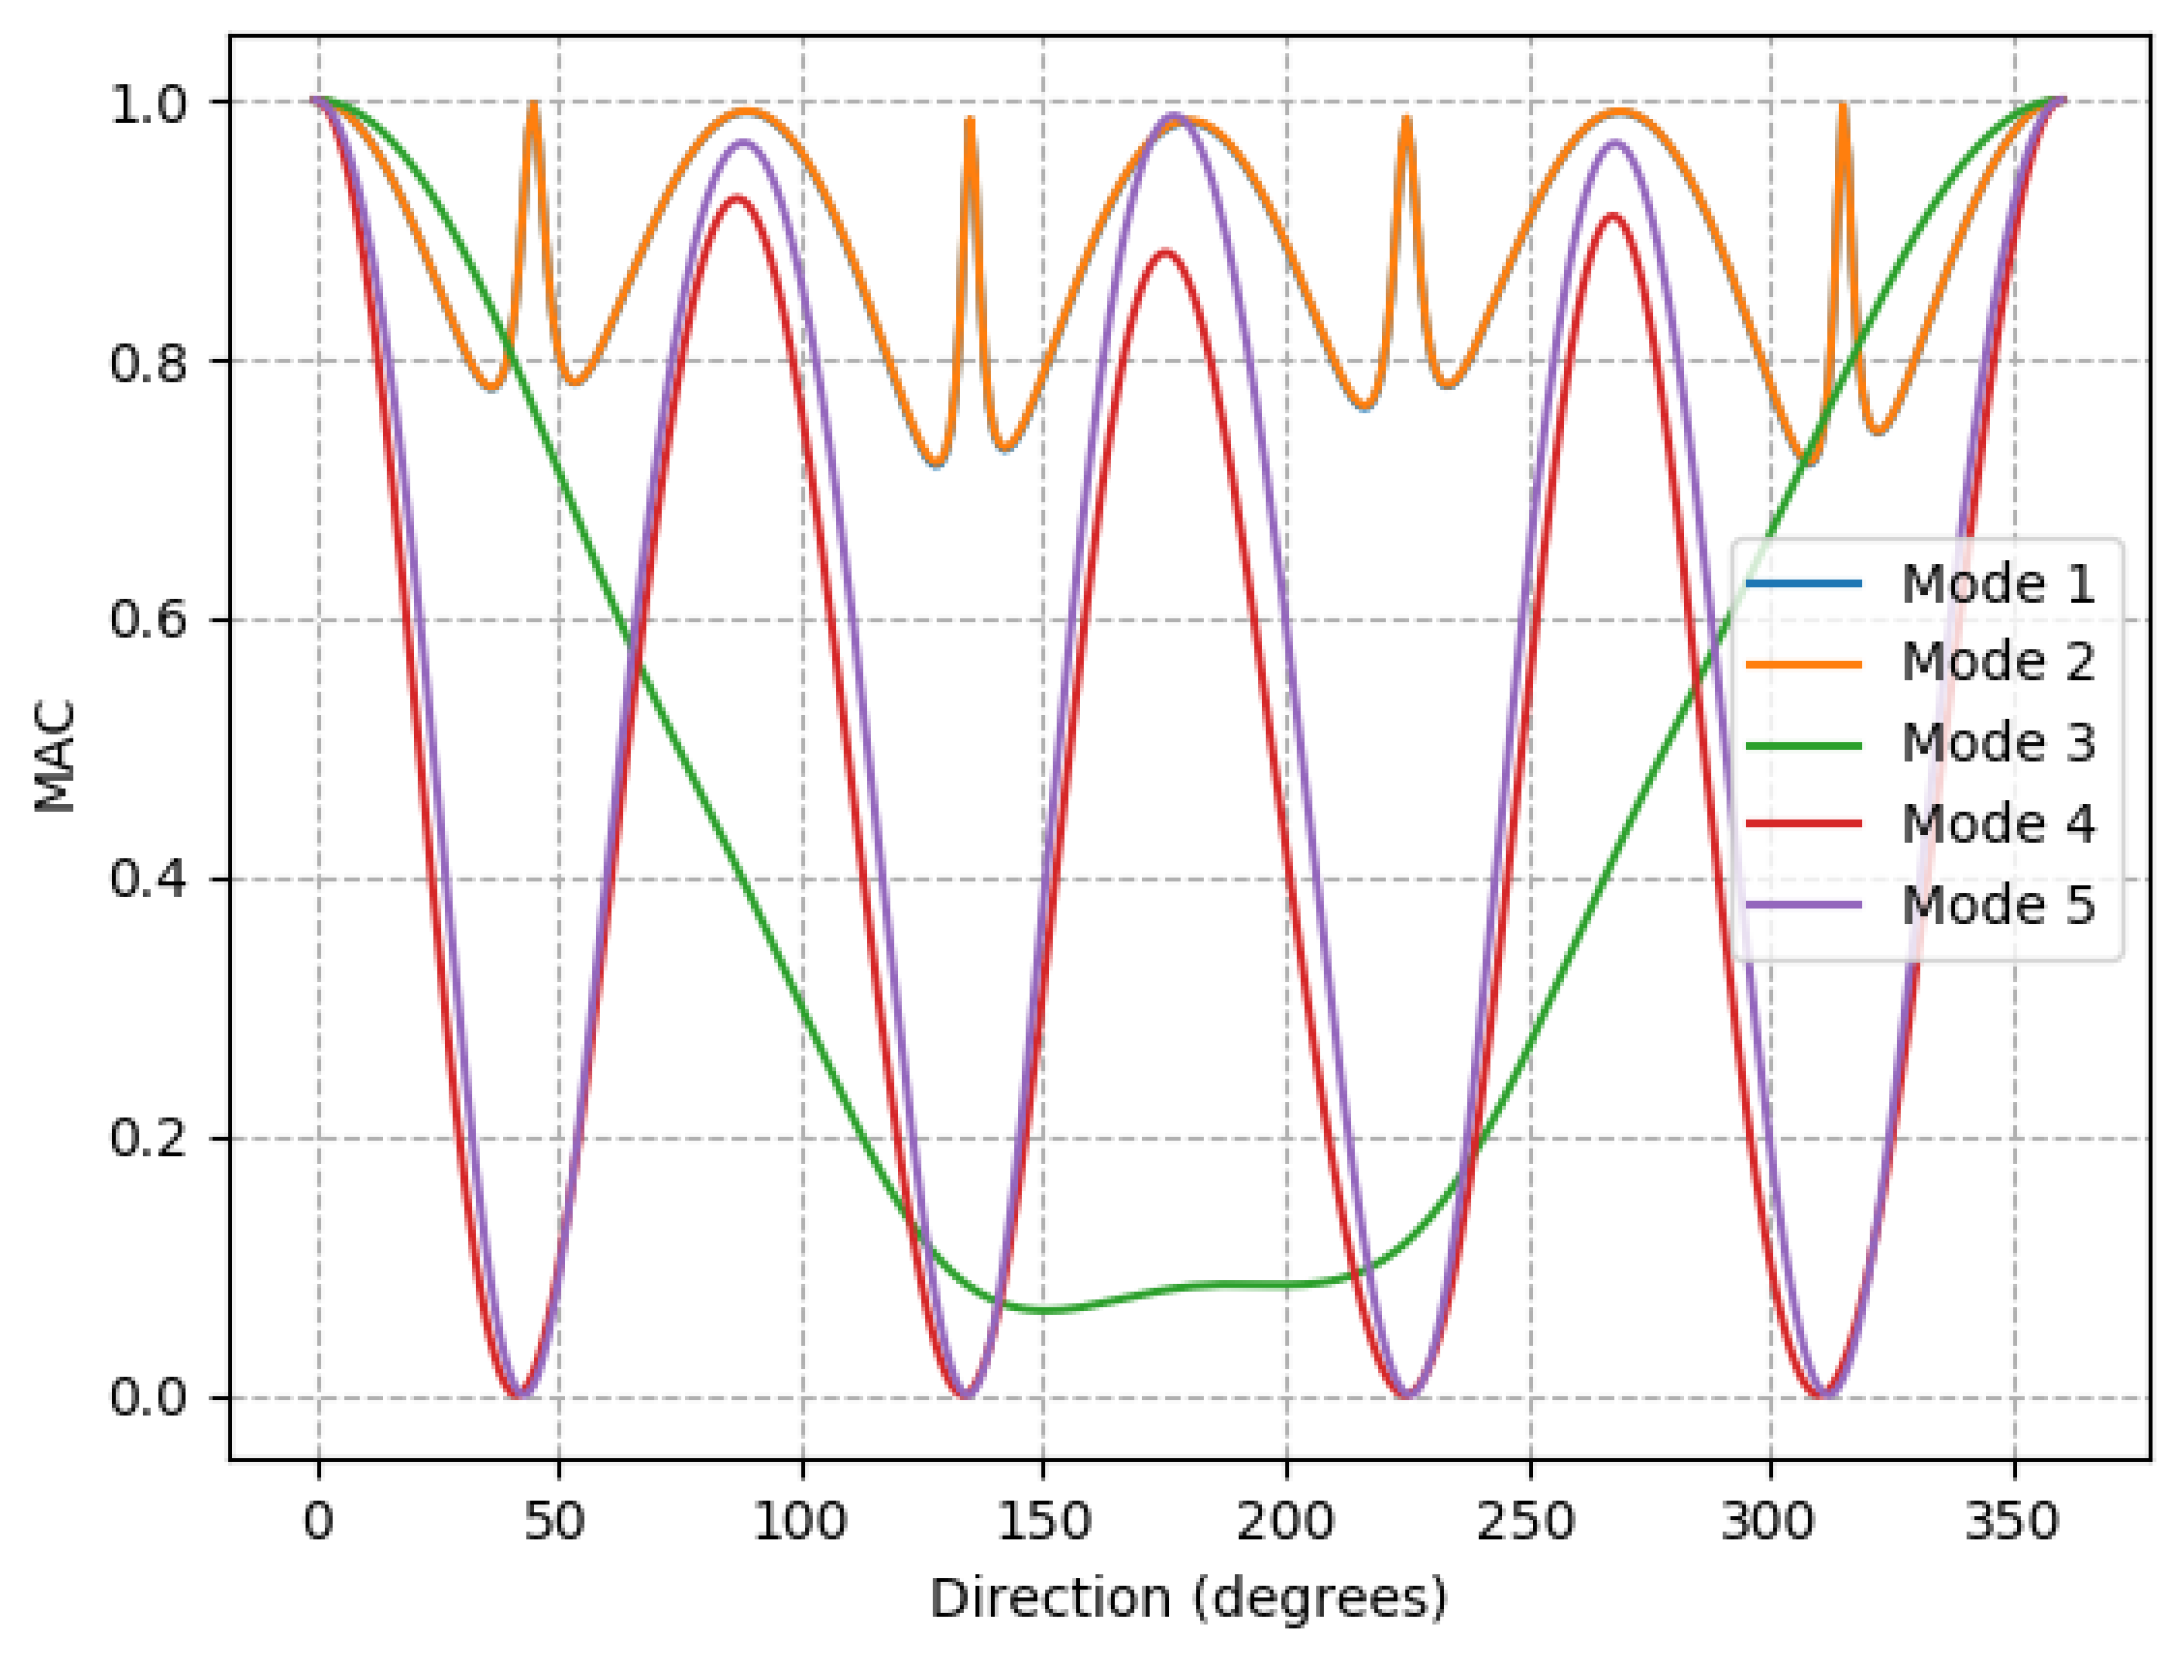
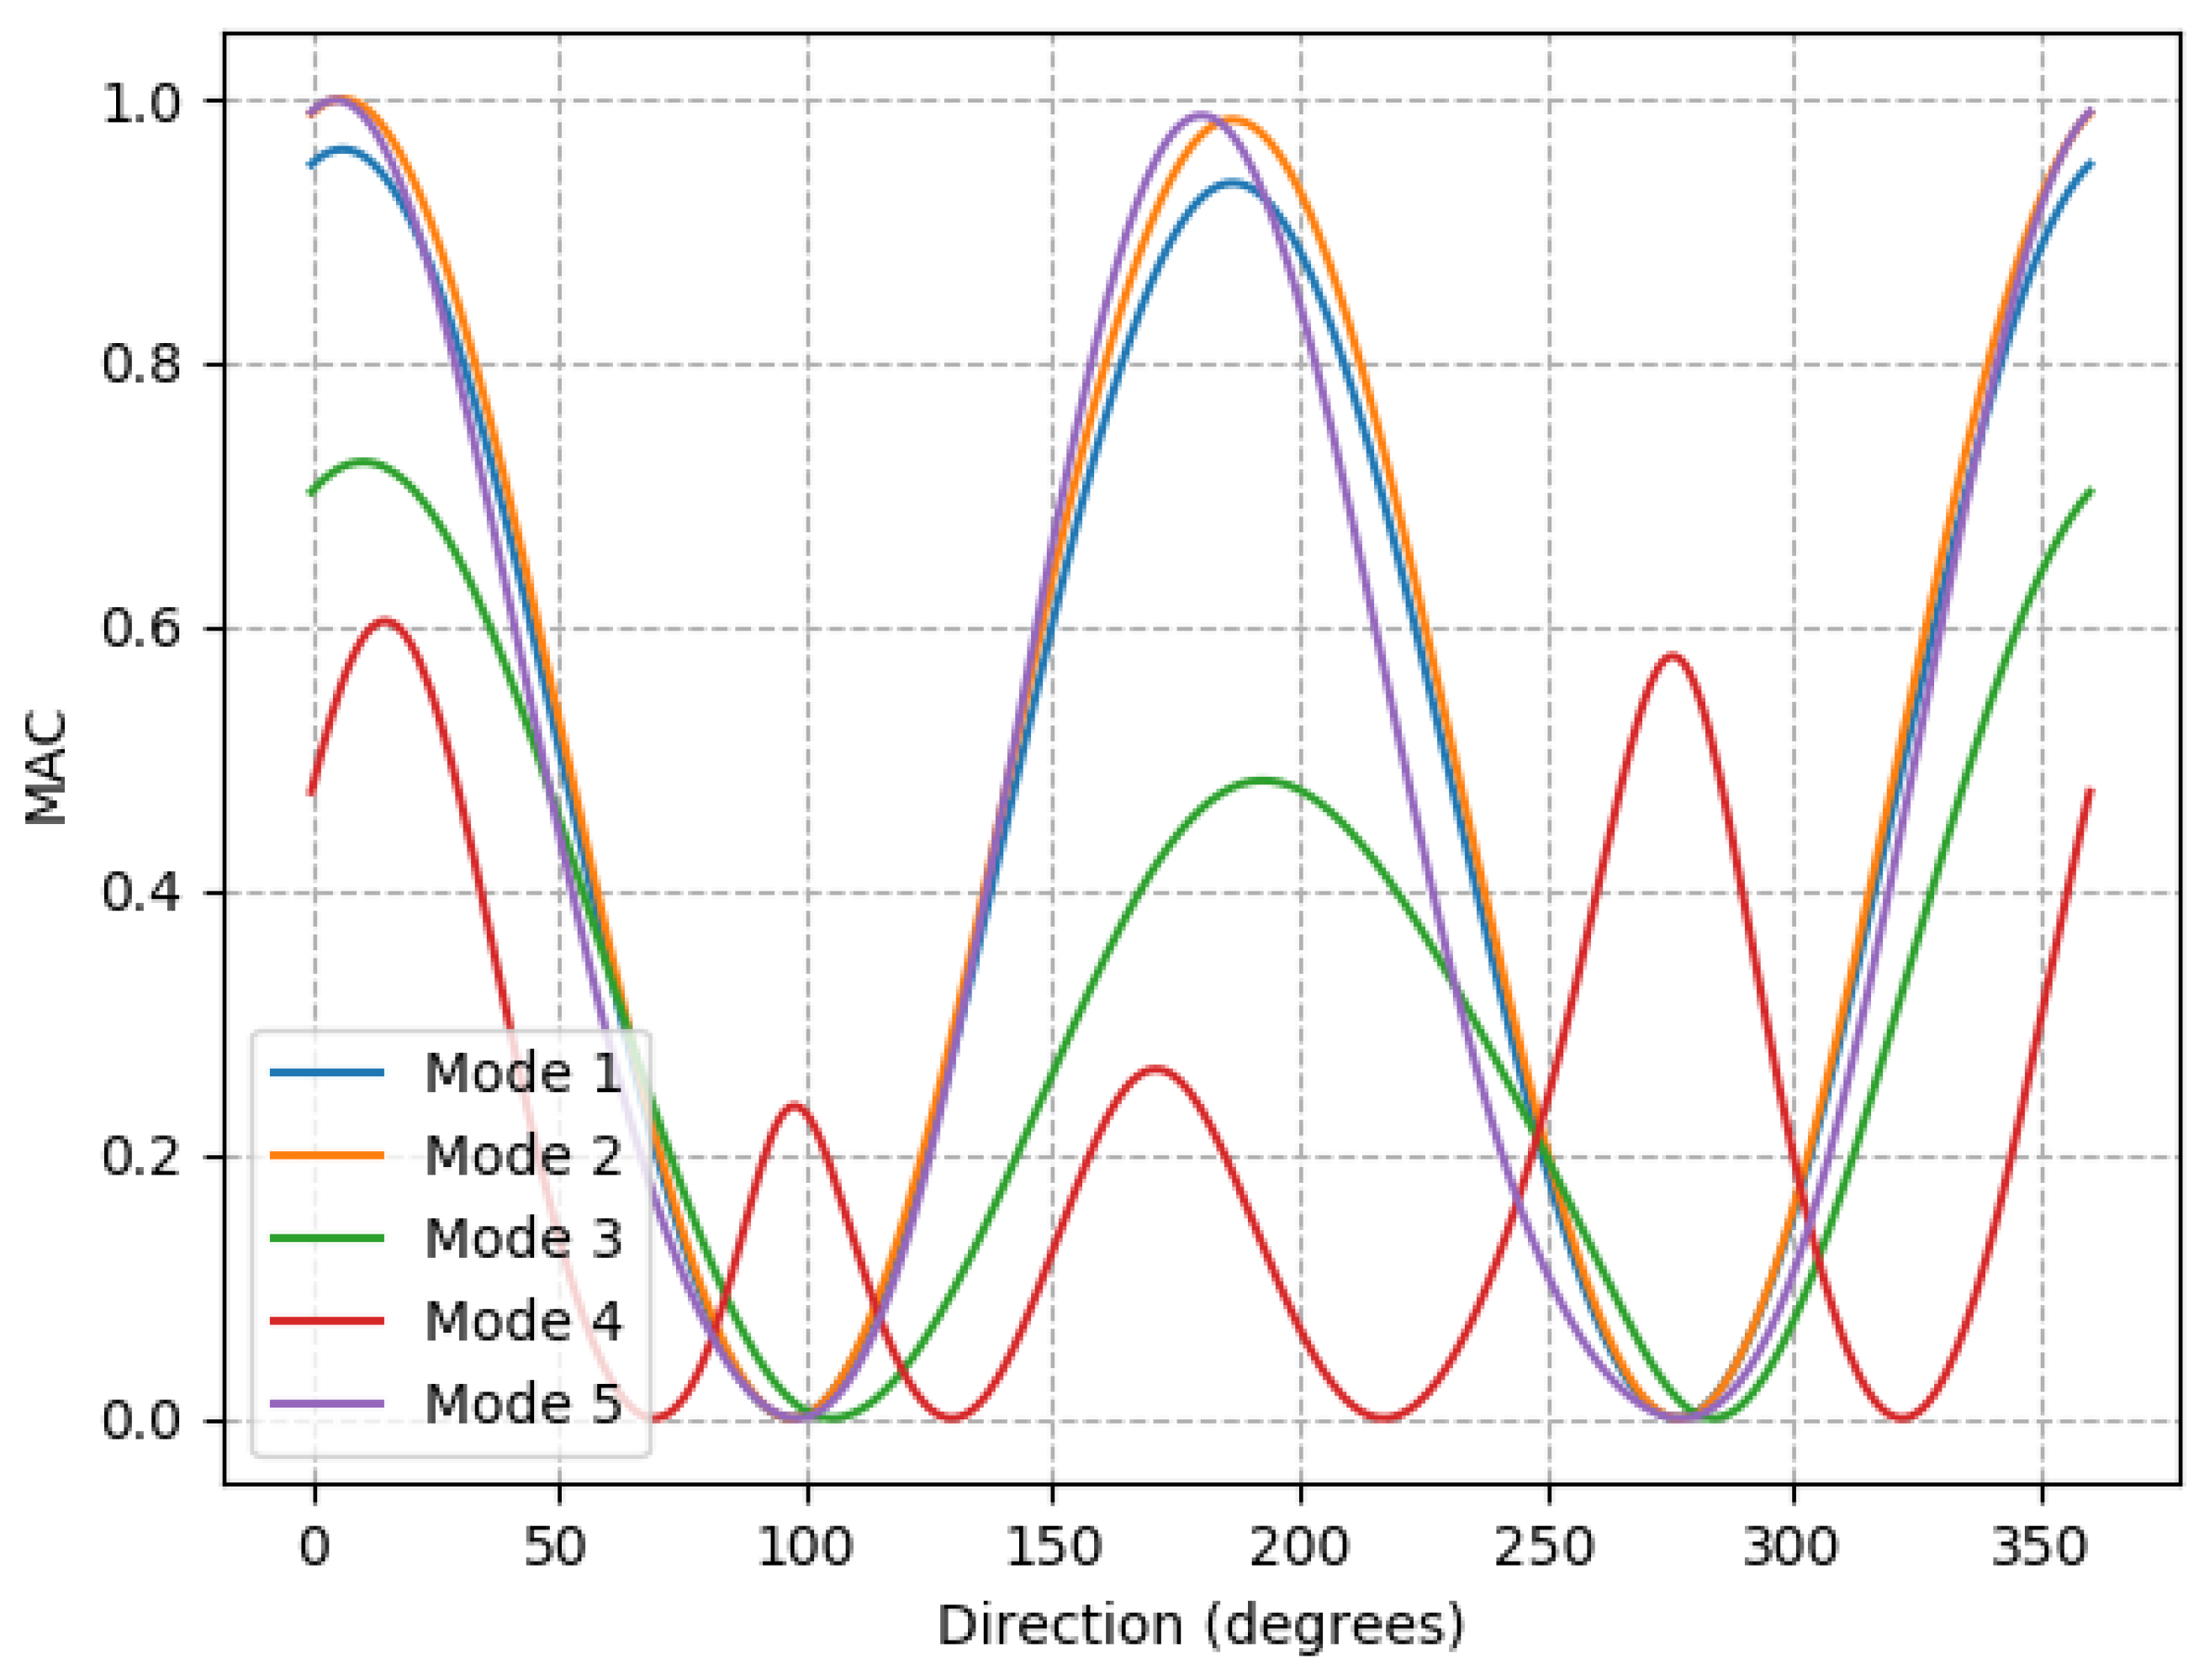
As the turbine direction yaws to make a complete rotation, the natural frequency does not change by an amount that exceeds a 4% threshold, where it would be considered detectible. The maximum change in frequency calculated using the ROSA model, normalized by the original frequencies, for the first five modes are: 0.002, 0.009, 0.002, 0.022, 0.024, respectively. However, the mode shapes, as quantified by the MAC values, change considerably. Figure 5 shows the MAC values for the first five mode shapes, as calculated after the shapes have been transformed back to the original reference. MAC is calculated in comparison to 0 degrees case.
The first two modes are the tower fore-aft and side-side modes. In the first two modes, the tower always oscillates roughly in the direction of the jacket legs. There is an edge-case exception to this which is when the nacelle is pointed equally between two jacket legs, which is the case for 45 degrees, 135 degrees, 225 degrees and 315 degrees. In cases when the nacelle is pointed equally between jacket legs, there appears to be a transition as the direction of the first two modes swap with each other. The MAC value for 45 degrees, 135 degrees, 225 degrees and 315 degrees is 1, because of the transformation approach. Without the mode shape being transformed, the MAC values in the leg directions are 0.5 as the MAC changes between 1 and 0.
Mode 3 is a torsional mode with the otherwise vertical axis of oscillation offset slightly in the direction of the nacelle. As the nacelle turns, the axis about which mode 3 oscillates also moves.
Modes 4 and 5 are tower swaying modes and their direction rotates at the rate of the nacelle yaw, but in the opposite direction (in a sense of clockwise/counterclockwise about the tower centerline). At 0 degrees of yaw, mode 5 is in line with the nacelle and 4 is perpendicular. At 45 degrees of yaw, mode 4 is in line with the nacelle yaw and mode 5 is perpendicular.
The change in mode vectors resulting from RNA yaw is important to be aware of, because without accounting for it, even an intact structure would appear damaged using MAC. However, being aware of this, MAC can be used effectively to detect and identify damage.
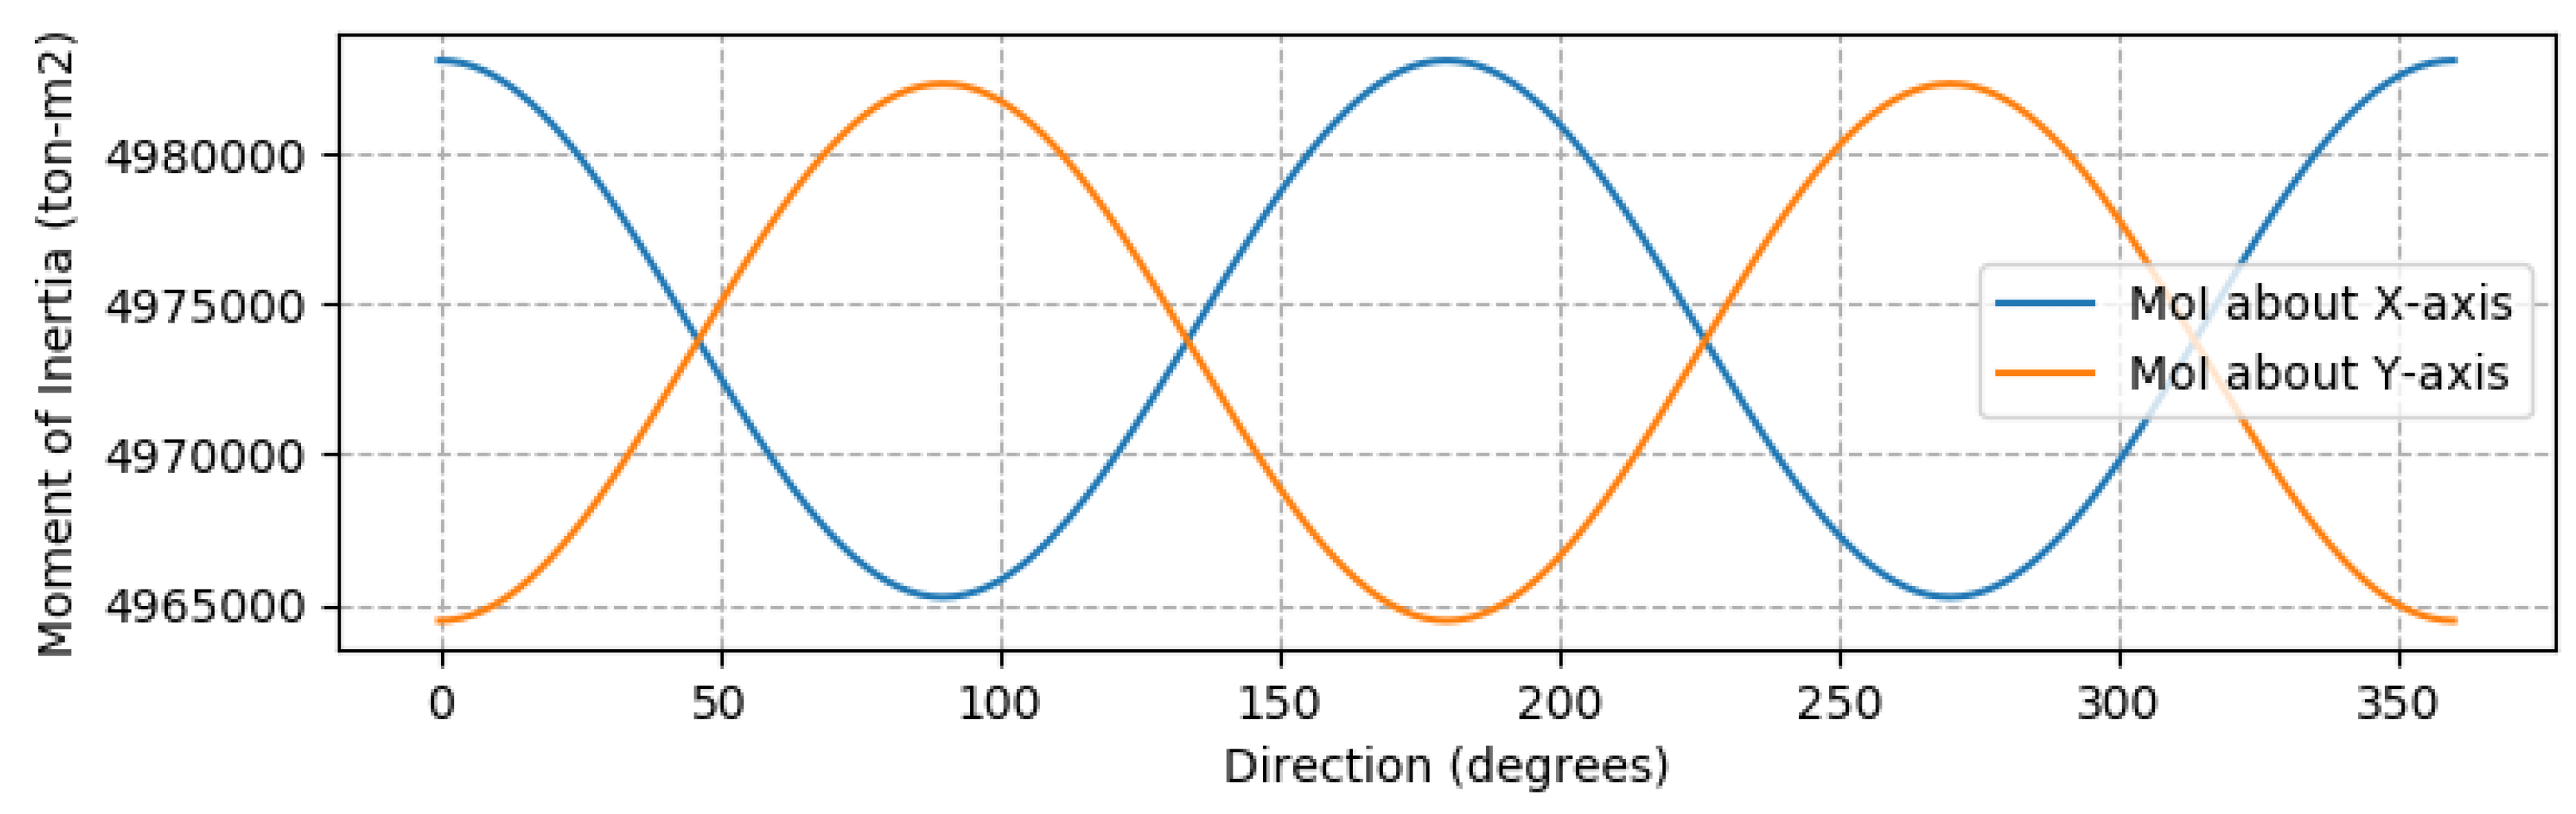
Figure 6 shows the dynamic moment of inertia of the structure calculated by the model. This shows a smooth change in moment of inertia with nacelle direction which gives some indication that the model is performing as expected. We also see that the spikes in the first and second modes seen in Figure 5 correspond to directions when the x-axis and Y-axis moment of inertia are equal; this is where the change in oscillating direction occurs.
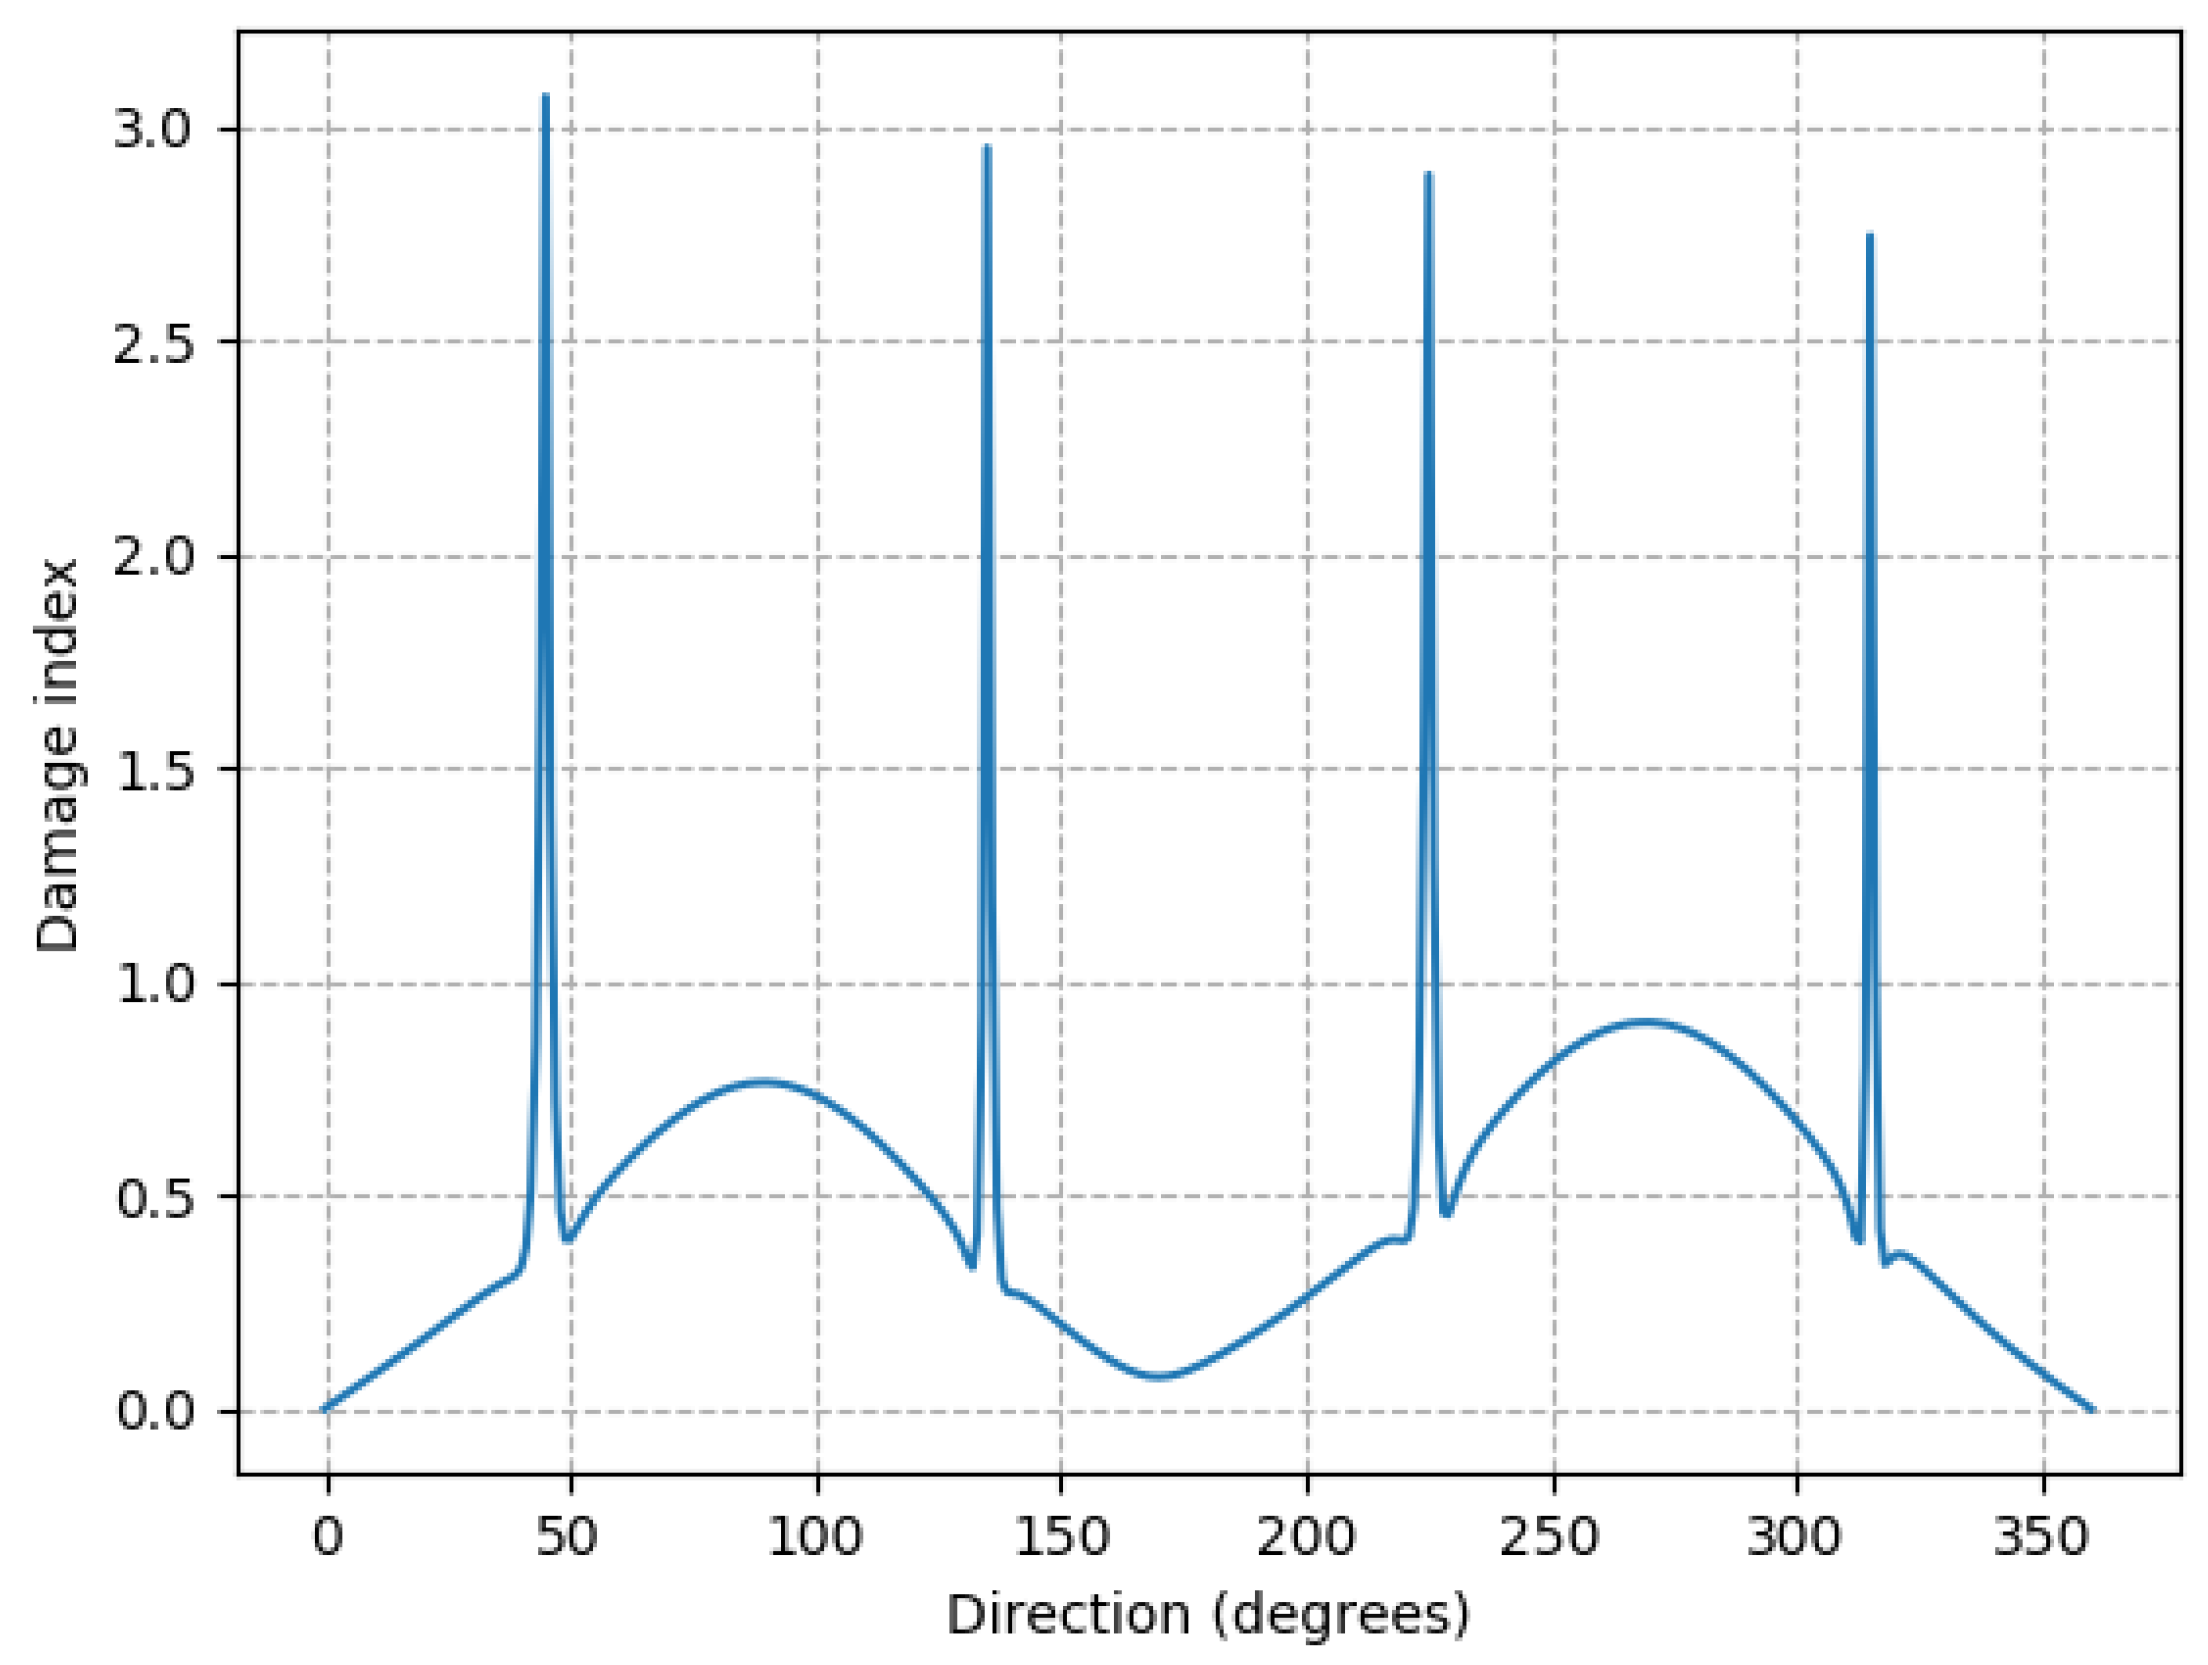
The ‘damage index’ value calculated using modal flexibility varies less with direction, except for the four peaks. This damage index is not quantifying a damage in this case, there is no damage, it is showing the effect on this metric of an operational behavior-it is a difference in the flexibility of the structure, due to this operational behavior. Besides the peaks, the values are all under 0.9, which, by itself, does not mean much but can be used as a reference when quantifying damage cases. The seemingly anomalous results in this plot are the peaks at 45 degrees, 135 degrees, 225 degrees and 315 degrees. The modal flexibility, and hence damage index seen in Figure 7 is more affected by lower modes and these peaks correspond with the rapid change in MAC seen in Figure 5, which are changes in mode shape between the first and second modes. It is possible that these four peaks are an artefact of the numerical solution process, and might not be seen in measurements of a real structure, so this aspect should be taken with caution.

5.2. Choice of Damage Metric

The MAC is a comparative value between two observations. If an observation is made at two points in time, there is not necessarily any time history linking these two observations, instead, there are a set of modes to be compared with another set of modes. This raises the question of how that pairing should be done to best represent the change. This is particularly important in the case of mode switching, where the labelling of modes can change, due to changes in frequency. This is important for the task of damage identification, as well as potentially in sensor placement when determining which mode shapes need to be identified. Although each numerical model represents a discreet state, gradually induced change in the model can help give an indication of whether a comparison makes logical sense.
To illustrate the problem, as well as a potential solution to the problem, a leg element is gradually damaged, meaning the stiffness at a joint is gradually reduced. This is also useful from the perspective of damage identification to determine when a damage becomes detectible. In this case, the leg element is halfway up the structure. 
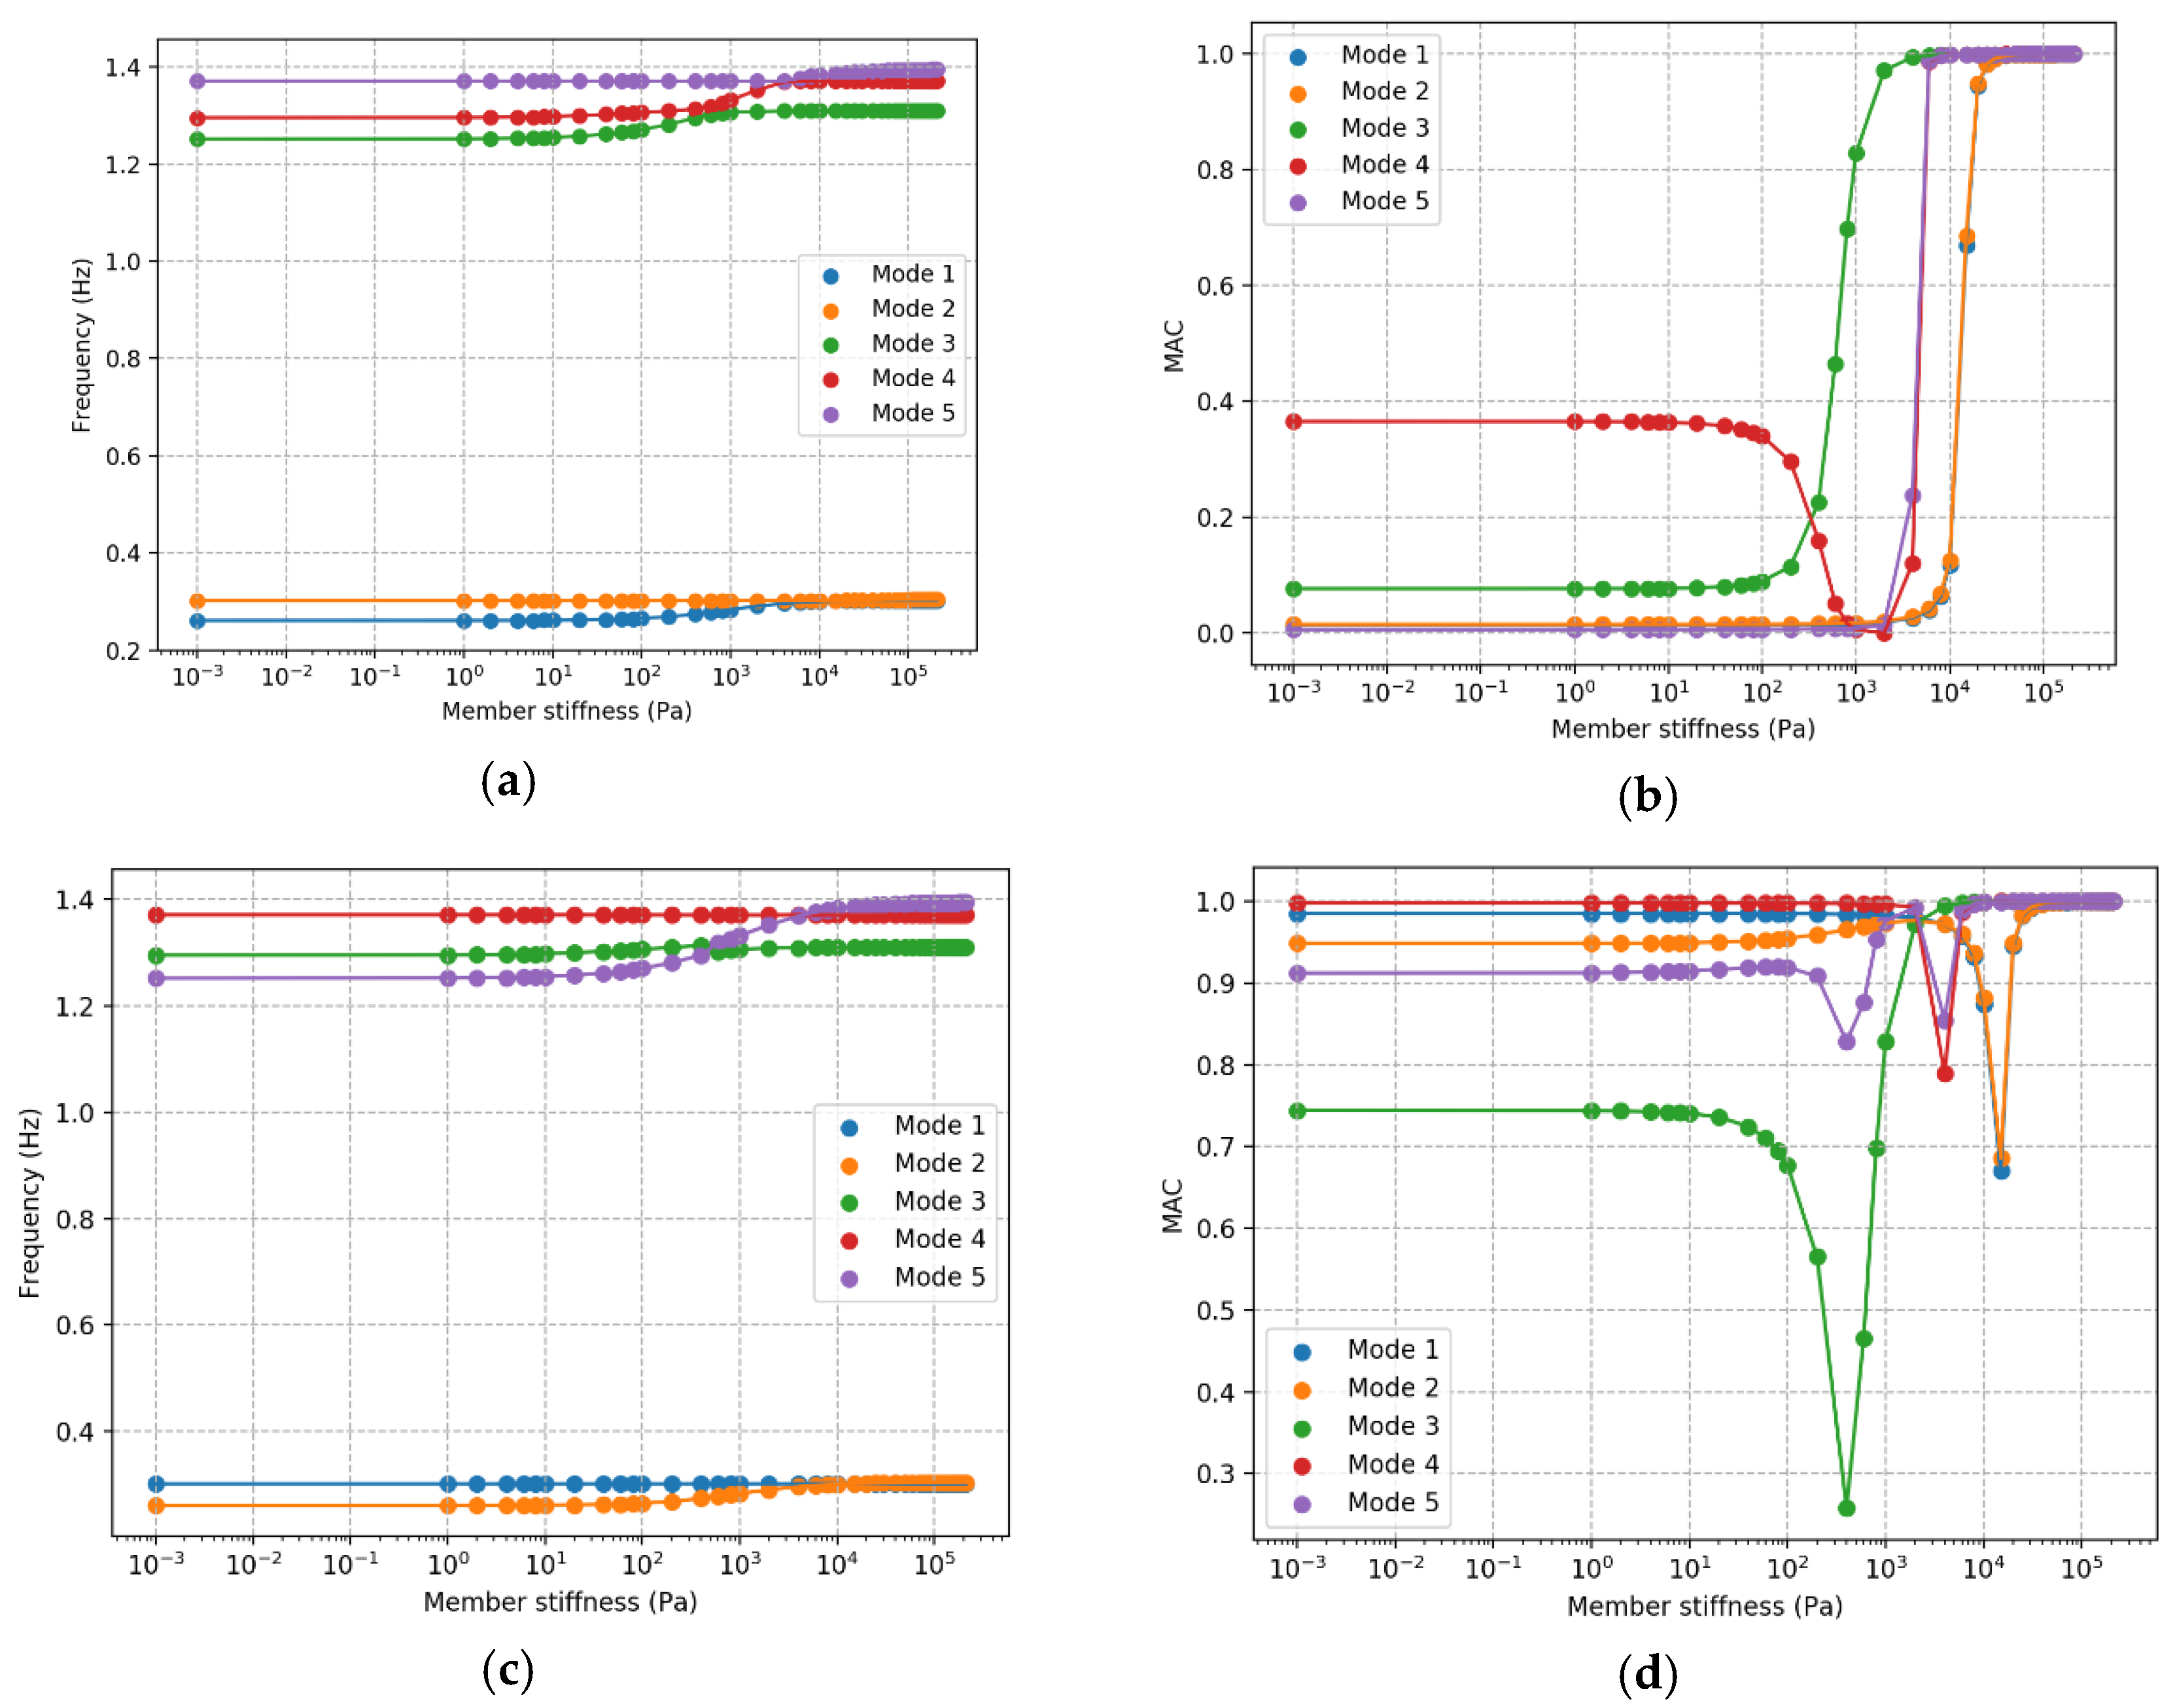
Figure 8a,c show the mode frequencies as simulated damage is gradually induced. Figure 8a shows comparisons made where the order is based on frequency order, as is the established approach. Choosing the modes to compare based on the order of frequencies is not always the correct approach. Some of the modes have a gradual reduction in frequency, but the reduction stops when it becomes the same as the next mode down, but then the frequency of the next mode down continues the downwards trend–when one frequency passes another, the comparison changes. Figure 8c shows comparisons made where the sum MAC value is maximized using the Hungarian algorithm. With this approach, one frequency can go below the other without the comparison changing. The implication when comparing frequency is that rather than determining the frequency for mode 1 changes by 14% from start to finish, instead mode 2 changes 14% and mode 5 changes 10%.
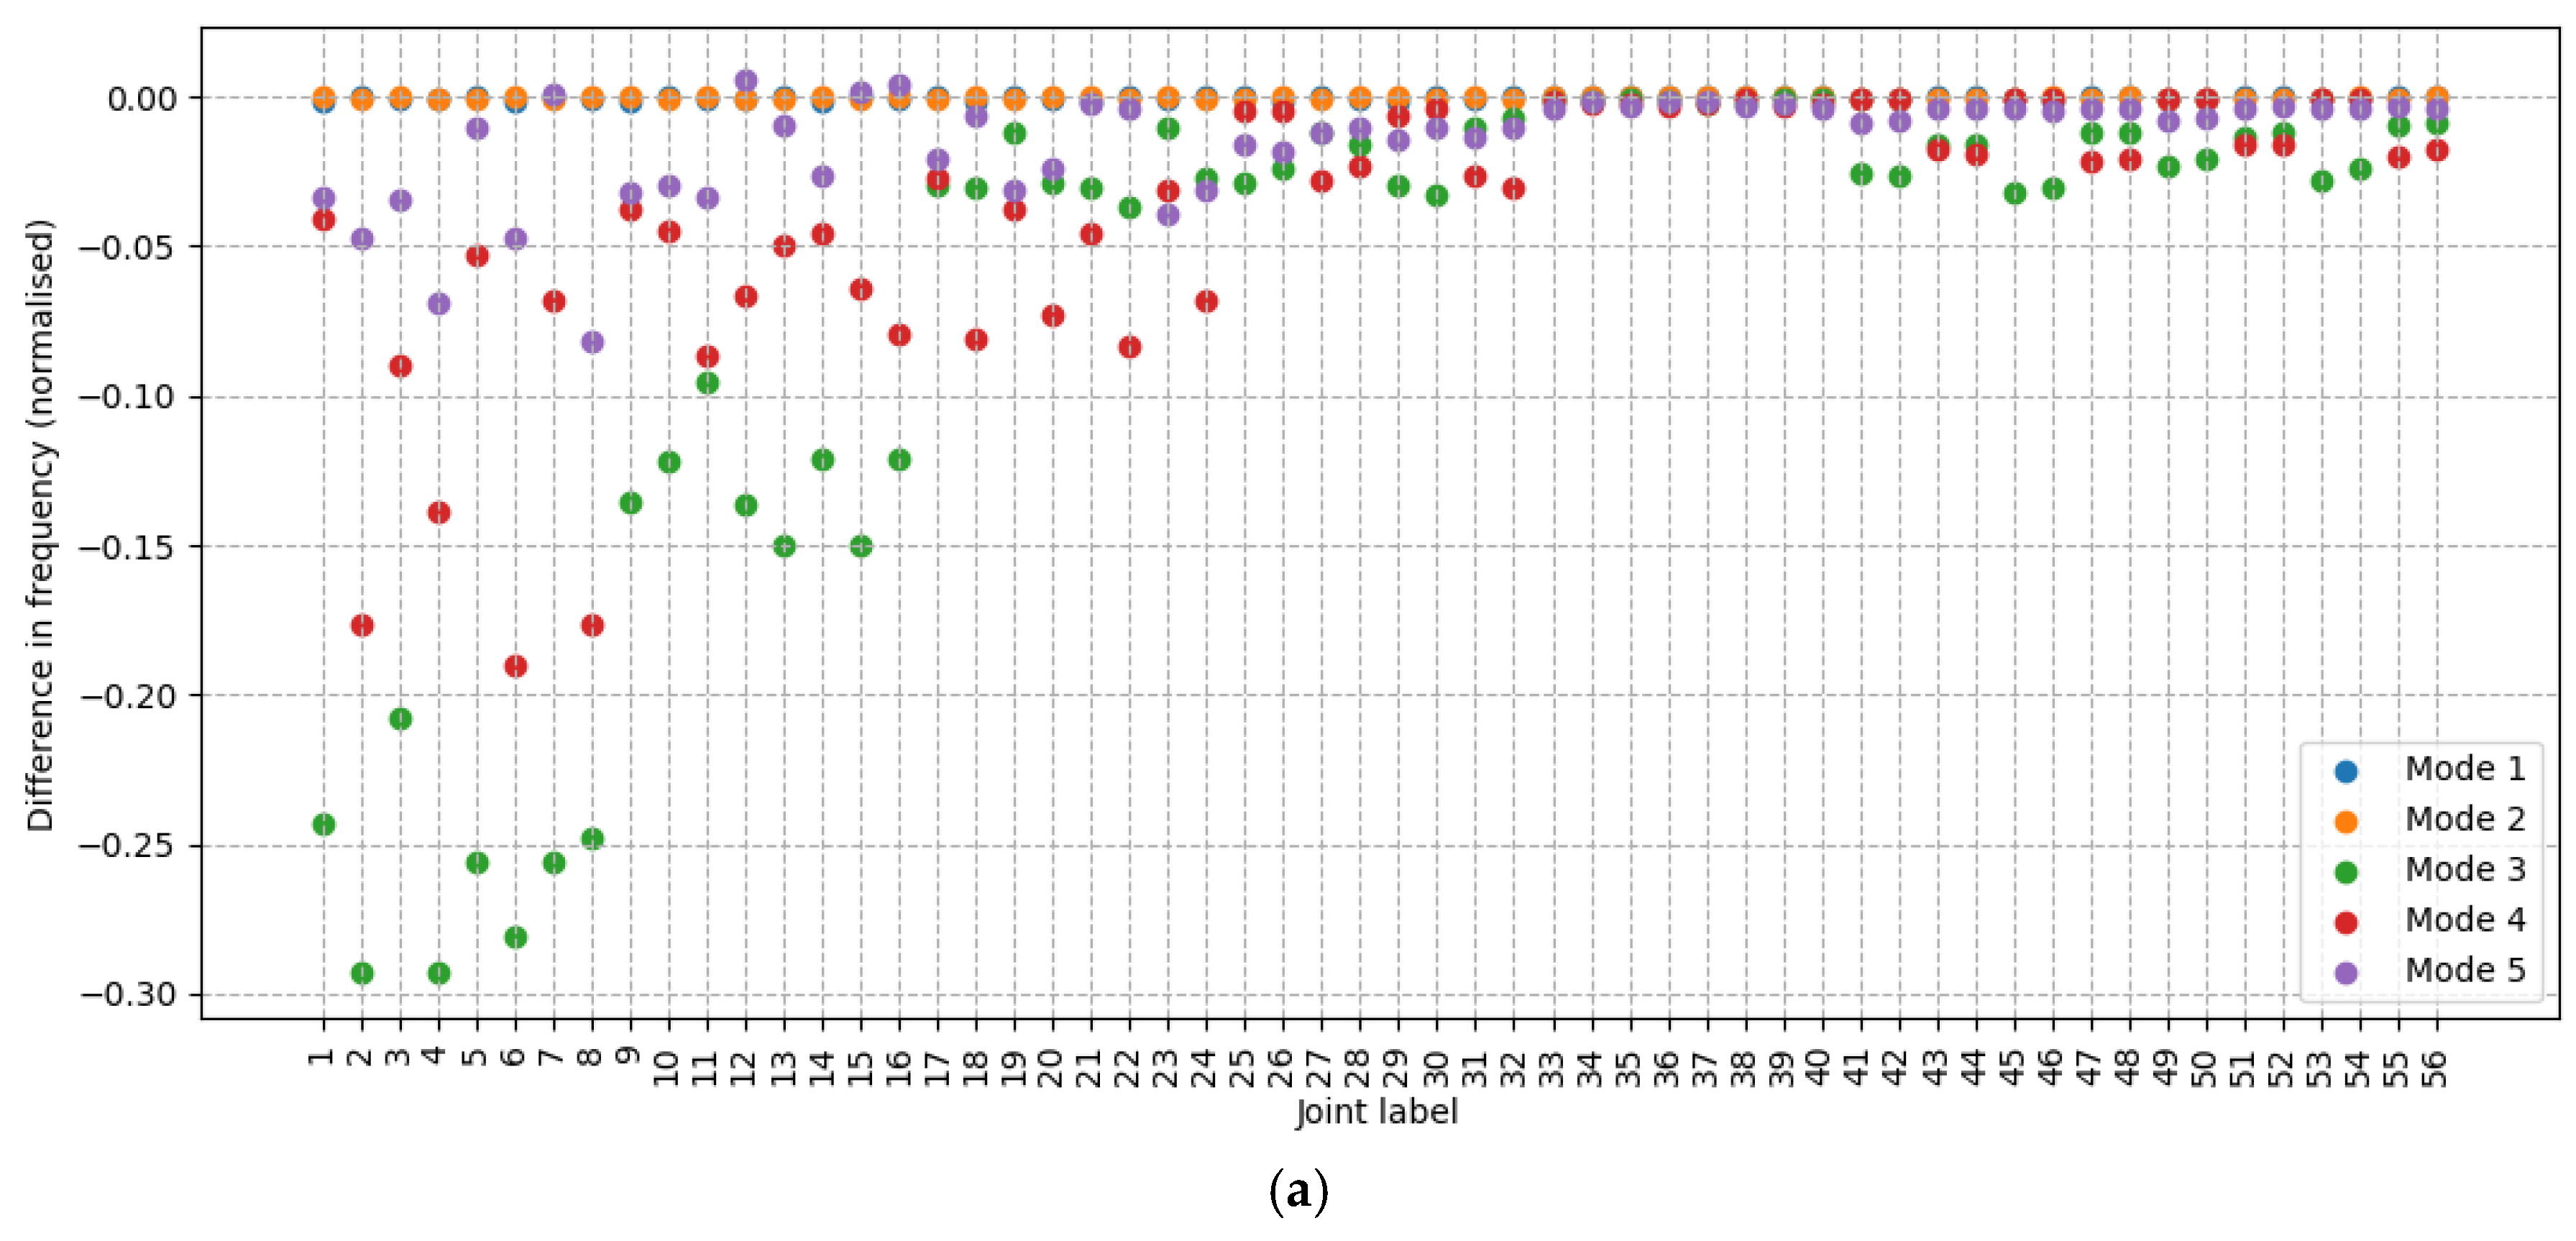
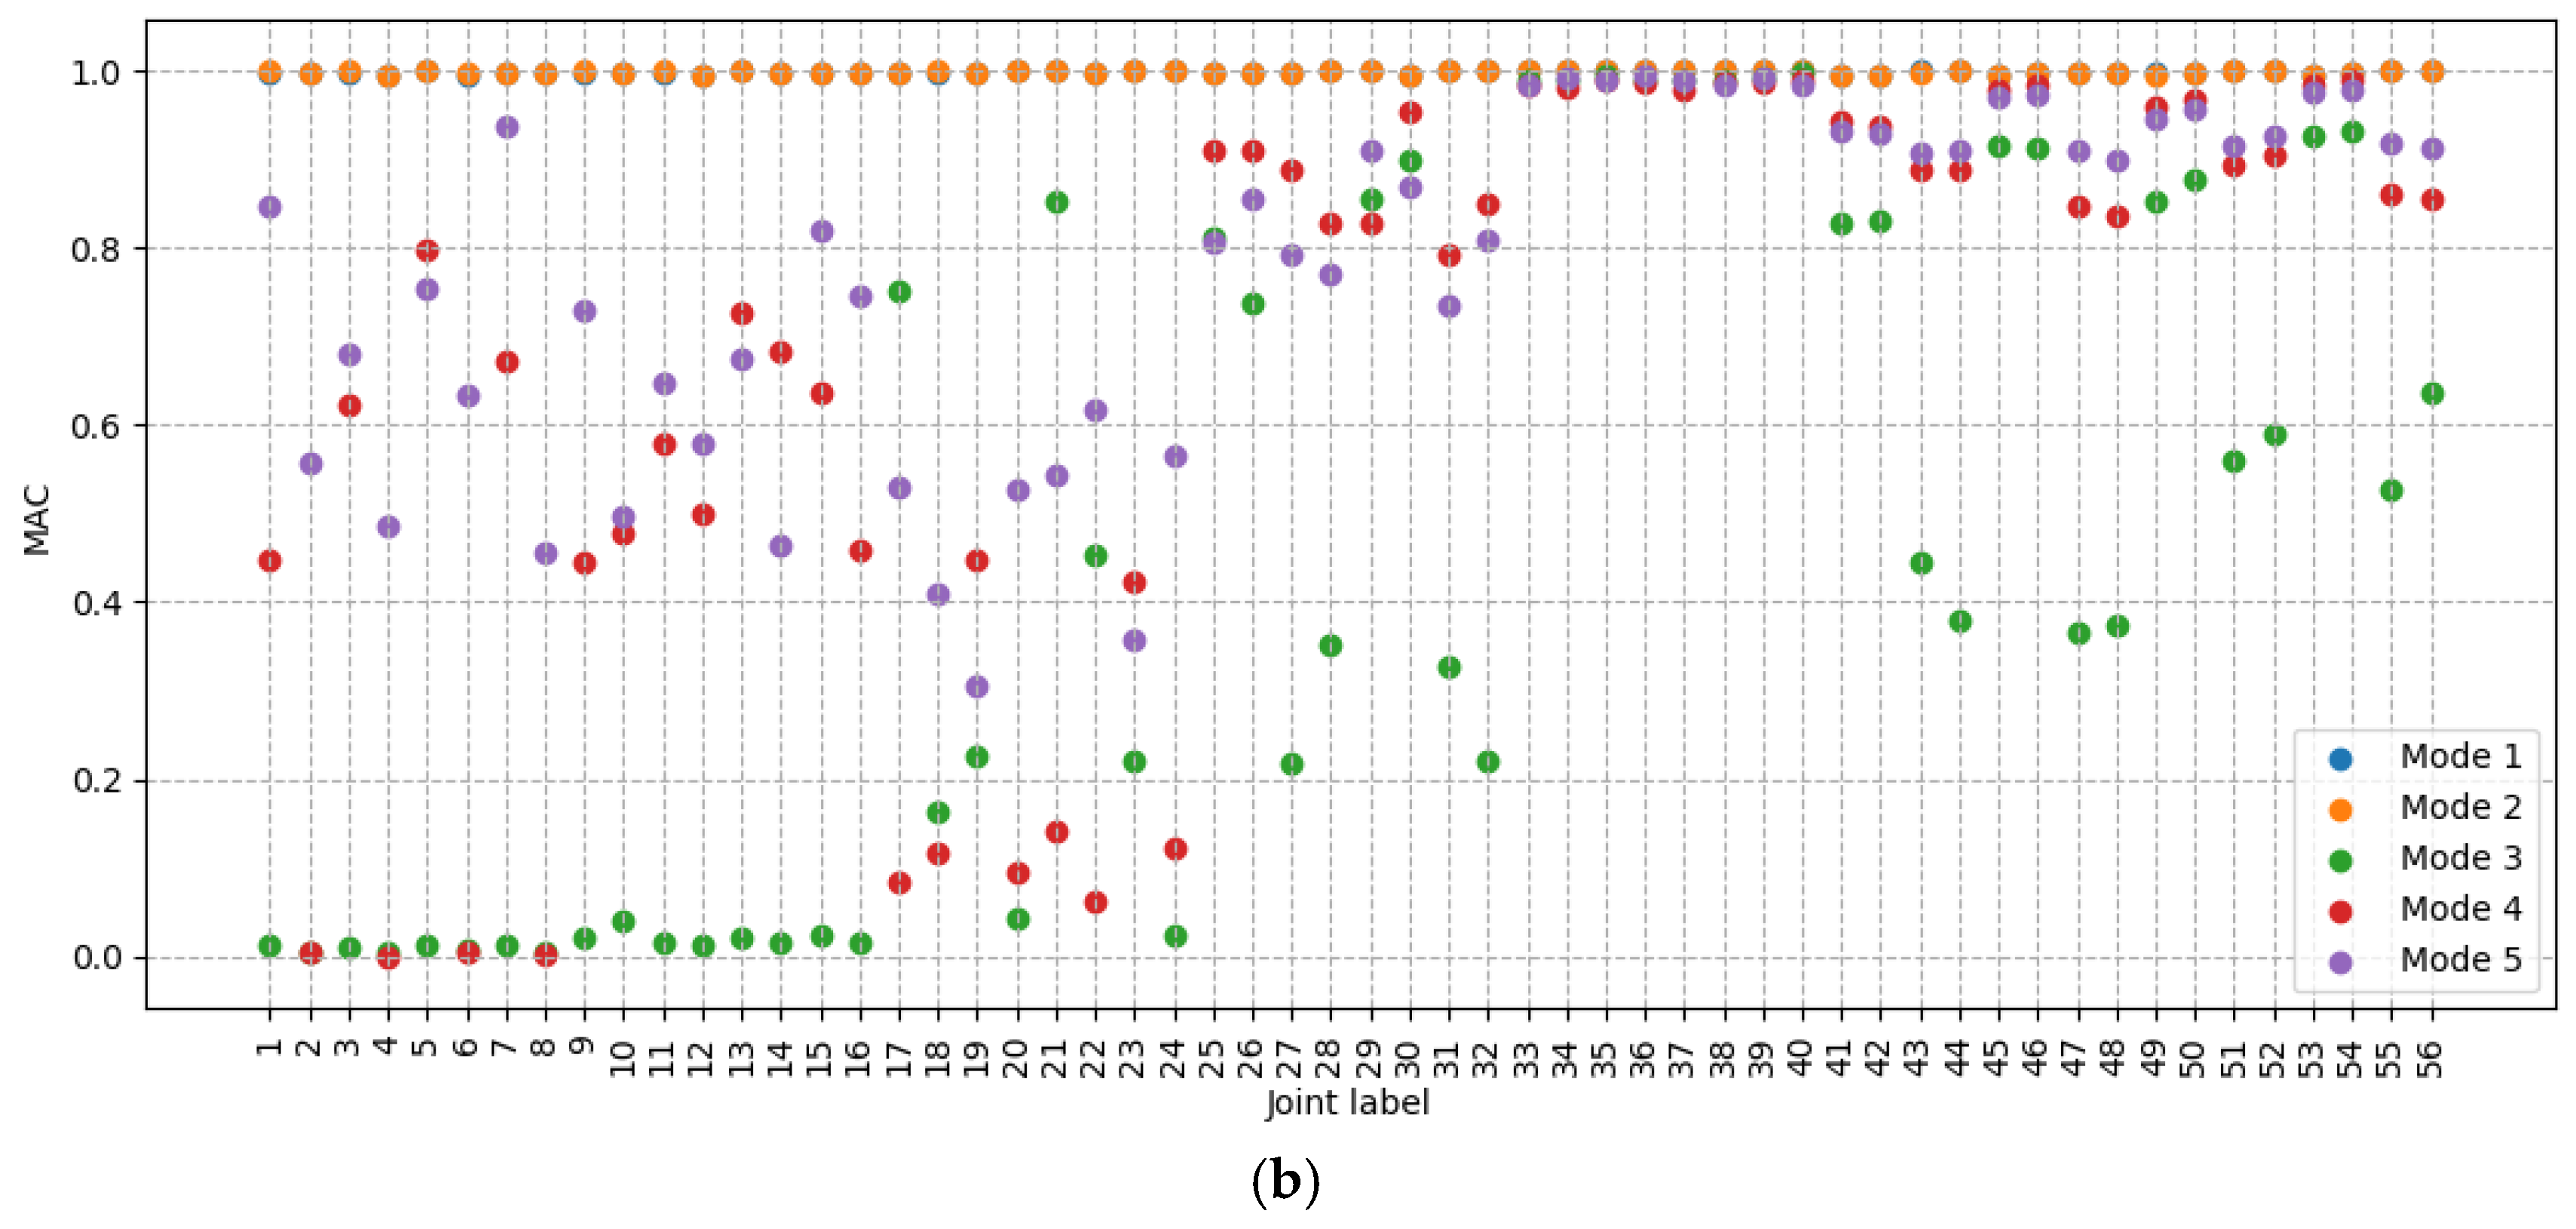
The effect of this change is even more apparent looking at MAC values. Figure 8b,d show the MAC values calculated with these two approaches. If the comparison is made based on frequency order, then all modes have points where they become completely inconsistent with the undamaged mode. If the comparison is made based on maximizing the sum of MAC, then these drops happen only briefly before the MAC returns to a relatively high value. The drops occur when two frequencies approach equality. If there is a mode shape that is so close to being consistent with an intact mode shape, such as a MAC of greater than 0.9, then that is a strong argument that this pairing is what should be considered. This also gives more information for determining which damage has occurred, since, if all MAC values are roughly 0, then this may also be the case for many types of damage.
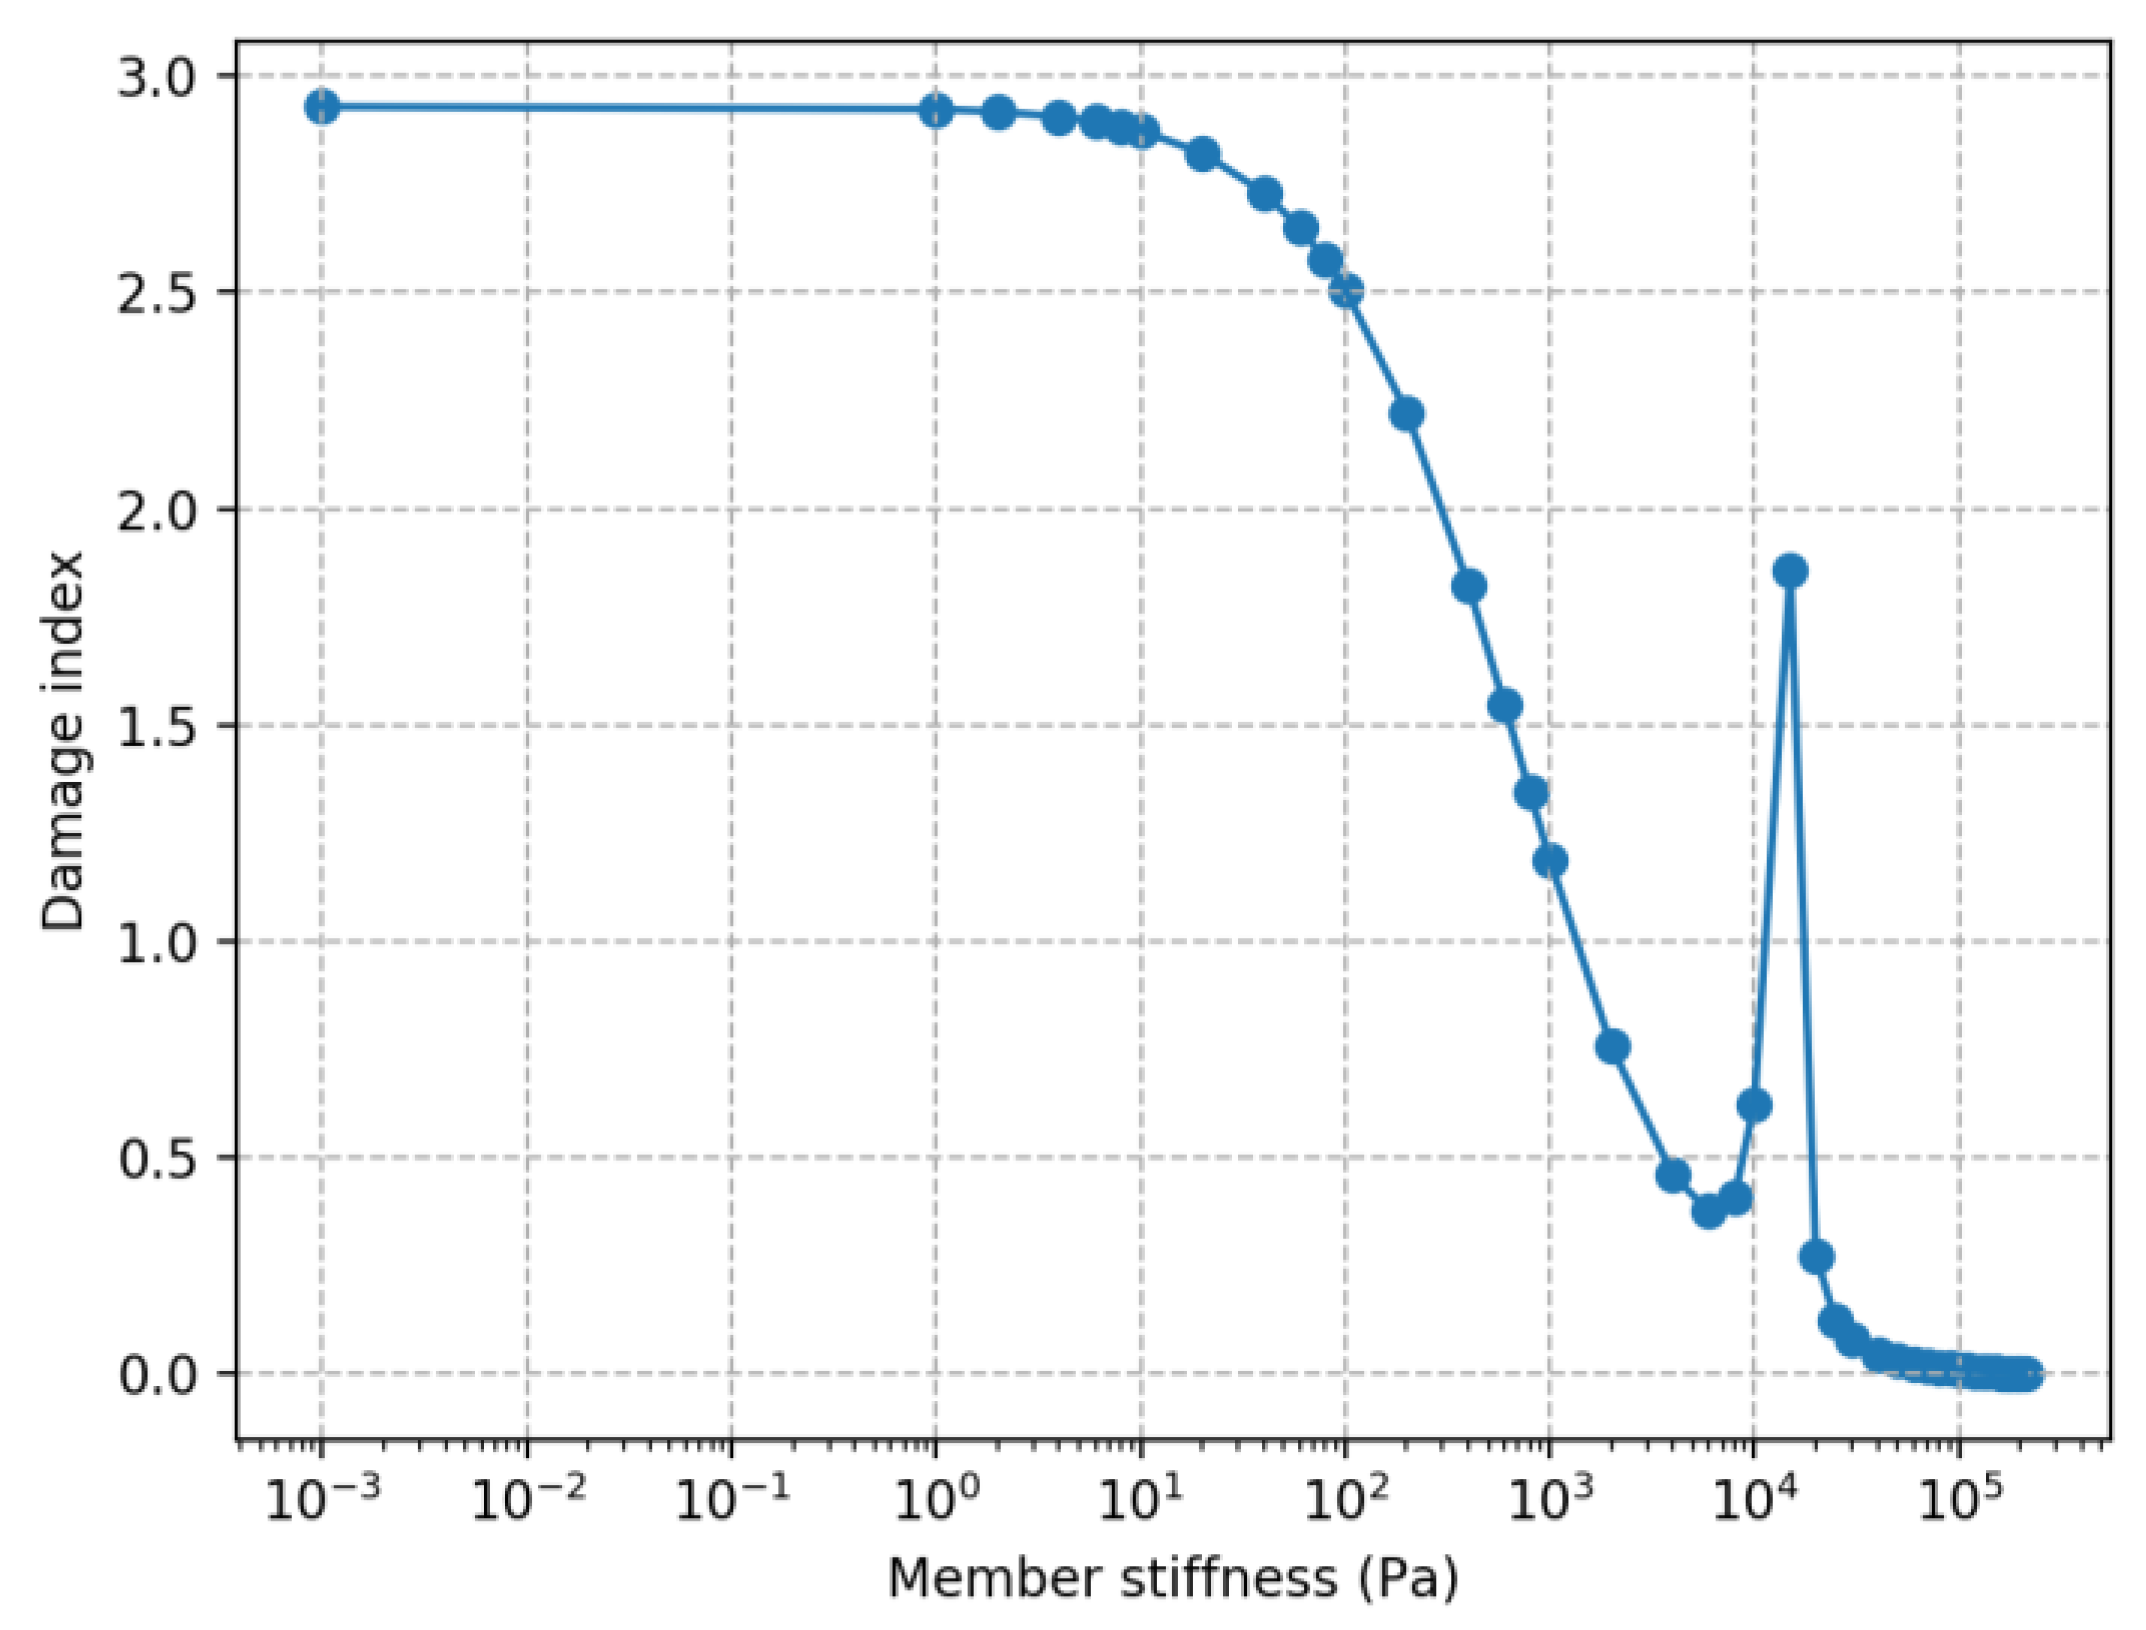
The damage index calculated through the modal flexibility does not have this same question of which modes to compare as all modes are combined before damaged and intact are compared. The damage index calculated for this gradual implementation of damage is shown in Figure 9. This figure shows a peak at the same time modes 1 and 2 have a sharp reduction at 2 × 10⁴, but not any of the other similar sharp reductions. While the MAC returned to a relatively high value, the damage index continued to increase as more damage was implemented, therefore, the damage index is a better choice for quantifying the level of damage.

6. Results

6.1. Joint Damage

6.1.1. Joint Loss

This section gives the results for complete loss of joints (Young’s Modulus equal to zero). In the first section, this is shown for all joints in the structure, with no change in nacelle yaw angle. In the second section, the focus is on the impact of nacelle yaw angle to damage detectability. Figure 10a shows the change in natural frequency of the first five modes, normalized by the intact natural frequency, for all cross-member joints. Figure 10b shows the MAC values for the structure with the loss of each joint, calculated relative to the intact structure. These results are all relative to the intact, 0-degree nacelle yaw case and does not include any leg member joints, only cross-member joints, leg member joints are addressed later. Only a single damage is implemented at a time. Normalization is the change from the intact frequency, which is typically negative, divided by the intact frequency.
Frequencies for modes 1 and 2, the tower side-side and fore-aft shapes, are not significantly affected for any cross-member joint. However, the other three modes are changed noticeably. Based on field experience, frequency changes larger than 4% and a MAC value less than 0.8 are detectable, in that it can be discerned clearly from the standard variation caused by environmental and other factors. However, more study is needed to clearly establish detectability bounds, as this depends on sensor quality, placement and site characteristics, among other factors. The joints lower down in the structure have generally more of an impact than joints higher up, as has been found in other studies [29]. Based on these graphs, no damage on cross members above 25 m is detectible through frequency, and joints above 50 m, elements 40 upwards, are only detectible through MAC if rotational modes are captured. There is almost no measurable effect from damage to the horizontal member joints, 33–40, since they are a relatively small part of this structure.
Using the ‘damage index’ as a metric results in the same conclusions as for the frequency and MAC plots. The one exception is that the values for the horizontal member joints are higher, between 0.2 and 0.3, which is as high as for elements which are higher than the horizontal ones. This would still be difficult, but easier to detect than through frequency or MAC.

6.1.2. Damage at Varied Nacelle Direction

It can be observed from the previous section that, for a given nacelle yaw angle, the impact of loss from a given joint is not the same as a joint on the other side of the structure at otherwise the same location. Due to the mass and momentum of the nacelle and blades, the structure is not rotationally symmetric and so joint losses on different sides have different impacts. This lack of rotational symmetry can be best demonstrated by looking at the effect of damage to a leg element. Figure 11 shows the MAC for the case where a joint halfway up the leg is damaged; the nacelle and blade point-masses are turned a full rotation with their mode shapes transformed back to the original reference. The undamaged plot which this can best be compared to is Figure 5 which is the undamaged case with transformation. The key point from this figure is that the MAC values now exhibit a sinusoidal behavior. If only the first and second modes are detected, then there are directions where the damage is not detectible by MAC, as it is above the threshold, but also nacelle directions where it is much easier to detect the damage as the MAC reaches 0. Additionally, to identify which damage has occurred then the MAC value should also be assessed knowing what direction the nacelle was pointing when the mode shapes were recorded. If a leg next to this leg, at 90 degrees, is damaged at the same height, then the plot of the MAC value for different directions looks the same except that the phase is shifted by 90 degrees.
The frequency of the modes varies more significantly by direction than in the undamaged case. The change in frequency of mode 5 ranges from −0.04 to 0 and mode 3 varies from −0.08 to −0.04. The other three, modes 1, 2 and 4, stay roughly around their 0-degree change values of −0.14, 0, and −0.04, respectively.
From these results, if the higher modes cannot be discerned in measurements, then, at some directions of the nacelle, the damage might not be detectible with the MAC values. In this case, the alternative approach of the modal flexibility can be used. The Frobenius norm of the flexibility residual stays between 0.65 and 0.25 for all nacelle directions and there are none of the peaks seen in the undamaged case. This indicates that the damage can be identified with modal flexibility, regardless of nacelle direction. In the damaged case, there are no peaks as direction is varied, unlike in the undamaged case. The peaks have disappeared, because there are no longer any sudden changes in mode shape, the transitions are now smoother.

6.2. Soil

The soil parameters investigated were global scour, variation in displacement curve scaling and variation in characteristic strength values. Global scour is a natural phenomenon that is expected to change over time, the other two parameters are not expected to change, but are investigated here as a sensitivity study of their impact on the modal properties.

6.2.1. Global Scour

For monopiles, it has been found that, for a scour to diameter ratio of 1, the first eigenfrequency changes by 5% [52]. However, monopiles and jacket foundations react differently to this, as is shown in Figure 12. The 1st eigenfrequency of this structure is not significantly changed. Also, the MAC does not become less than 0.996. The greatest change is observed in Modes 3, 4 and 5. With a scour depth just under 4 m, there is a crossing of modes 4 and 5, which results in a subsequent dip in MAC for both modes. There is a linear increase in damage index, the parameters for a linear trendline show a 0.22 damage index increase per meter. The natural frequencies will inevitably reduce after the structure is installed because come level of scour is expected [53].

6.2.2. Displacement Factor

Values of the three displacement—stiffness curves are multiplied by the displacement factor; this gives an investigation of sensitivity of modal parameters to soil stiffness. A displacement factor of 1 indicates the expected curve and other values indicate either a compressed or elongated curve. The graphs for change in frequency against factor and MAC against factor are similar between the P-Y, T-Z and Q-W curves, although the amount the response is affected by the factor varies slightly. Figure 13 shows the change in frequency and the MAC values calculated as a result of changing the displacement factor for the P-Y curves, which was found to be the most significant of the three. The largest change in natural frequency is just over 0.03 and the smallest MAC is 0.96, these values are small, and the parameter is not time dependent. This is not an observable change, but rather might act to make the measured parameters different from the ‘intact’ case.

6.2.3. Characteristic Strength

Variation in the characteristic strength of the soil has only a minor impact for this jacket structure. If the strength value is not below 0.6 of what is expected, then there is not much change to either the natural frequencies or the MAC values. Below a factor of 0.6, the MAC values drop quickly, however, even at this low value modes 1 and 2 show negligible change. This is shown in Figure 14, where the change in natural frequency is shown in (a) and MAC in (b). The effects are very similar to what is observed with a change in displacement factor.

6.3. Bolted Connection

The bolts are not specifically modelled, so instead, the stiffness of the node at the location of the bolted joint is reduced. In this model, stiffness is reduced from its original value down to nearly 0, though this range is just for the sake of exploration and not necessarily realistic, as described in Section 4.4. The change in frequency for the modes is shown in Figure 15. The largest change is in the frequencies for modes 1 and 2—these are both tower modes. This change in stiffness has almost no change on the mode shapes, the MAC values for modes 1 and 2 only reduce to a minimum of 0.999. The damage index is similarly not much changed, only going as high as 0.11 for the minimum stiffness. This is investigated further by taking the lowest stiffness case and applying a change in nacelle direction, as discussed in Section 4.4. The results from changing direction are very much like the undamaged case, except that the first and second mode frequencies are shifted down by the amount shown in Figure 15. As discussed in Section 4.4, the effect of loosened bolts would not be apparent as a gradual change but rather appearing to suddenly change between ‘intact’ and ‘damaged’, depending on the load at the time and if it exceeds the clamping strength.

6.4. Corrosion and Marine Growth

6.4.1. Corrosion

Corrosion is modelled in this case as a wall thickness reduction with the mass of the corroded material retained. This has the effect of lowering the stiffness of the structure but not the mass. There is an expected corrosion profile given in Section 4.5, and this is multiplied by the factor ‘corrosion factor’. The effect from corrosion strongly resembles the effects from scour. This similarity to the effects from scour is potentially useful, both behaviors are expected to some extent, and so the similarity of their effect potentially makes them easier to differentiate from other factors, which are not expected. The normalized change in natural frequency and the MAC values are shown in Figure 16. The frequencies of the fourth and fifth mode become the same at around a corrosion factor of 1.4, causing the dip in MAC.
The main difference between how corrosion affects modal parameters, in this model, and how scour affects it is that the frequency changes more with corrosion; at the dip in MAC for corrosion, the frequency for the fourth and fifth modes reduced more than 12%, whereas, with scour, the frequencies of these same modes changed only 6% and 8%, respectively. It would be difficult to distinguish between these two without a good understanding of the specific structure. There is a much higher damage index for corrosion due to the larger change in modal frequency, around 1.3 for the dip, while it is only around 0.7 at the dip from scour. However, this is subjective to how this is implemented and how it is modelled.

6.4.2. Marine Growth

The marine growth increases the mass of the structure and increases surface roughness, which affects hydrodynamic properties, and both factors are accounted for in this model. The effect of this is to decrease the eigen frequencies almost linearly with an increase in marine growth, Figure 17. There is no dip in the MAC values observed with other cases, as the frequencies of the modes never pass each other; this observation seems to be consistent when the nacelle is rotated.

7. Discussion

The results of this study reveal several findings about the behavior of this jacket structure and about the potential for damage detection based on these measurement values. Some consideration should be made as to the applicability of these results to other cases. In terms of similar models of similar jacket structures, it should be expected that comparable results would be achieved. It should also be expected that this is a good approximation of the real system, as this study was conducted using the design model to which the system was built. However, if a more complex model is used, such as one which explicitly models the blades, the results may differ, due to the more complex dynamic behavior. Measurement results from a real wind turbine may be different still, and so it would be important to understand this difference for any case of interest.
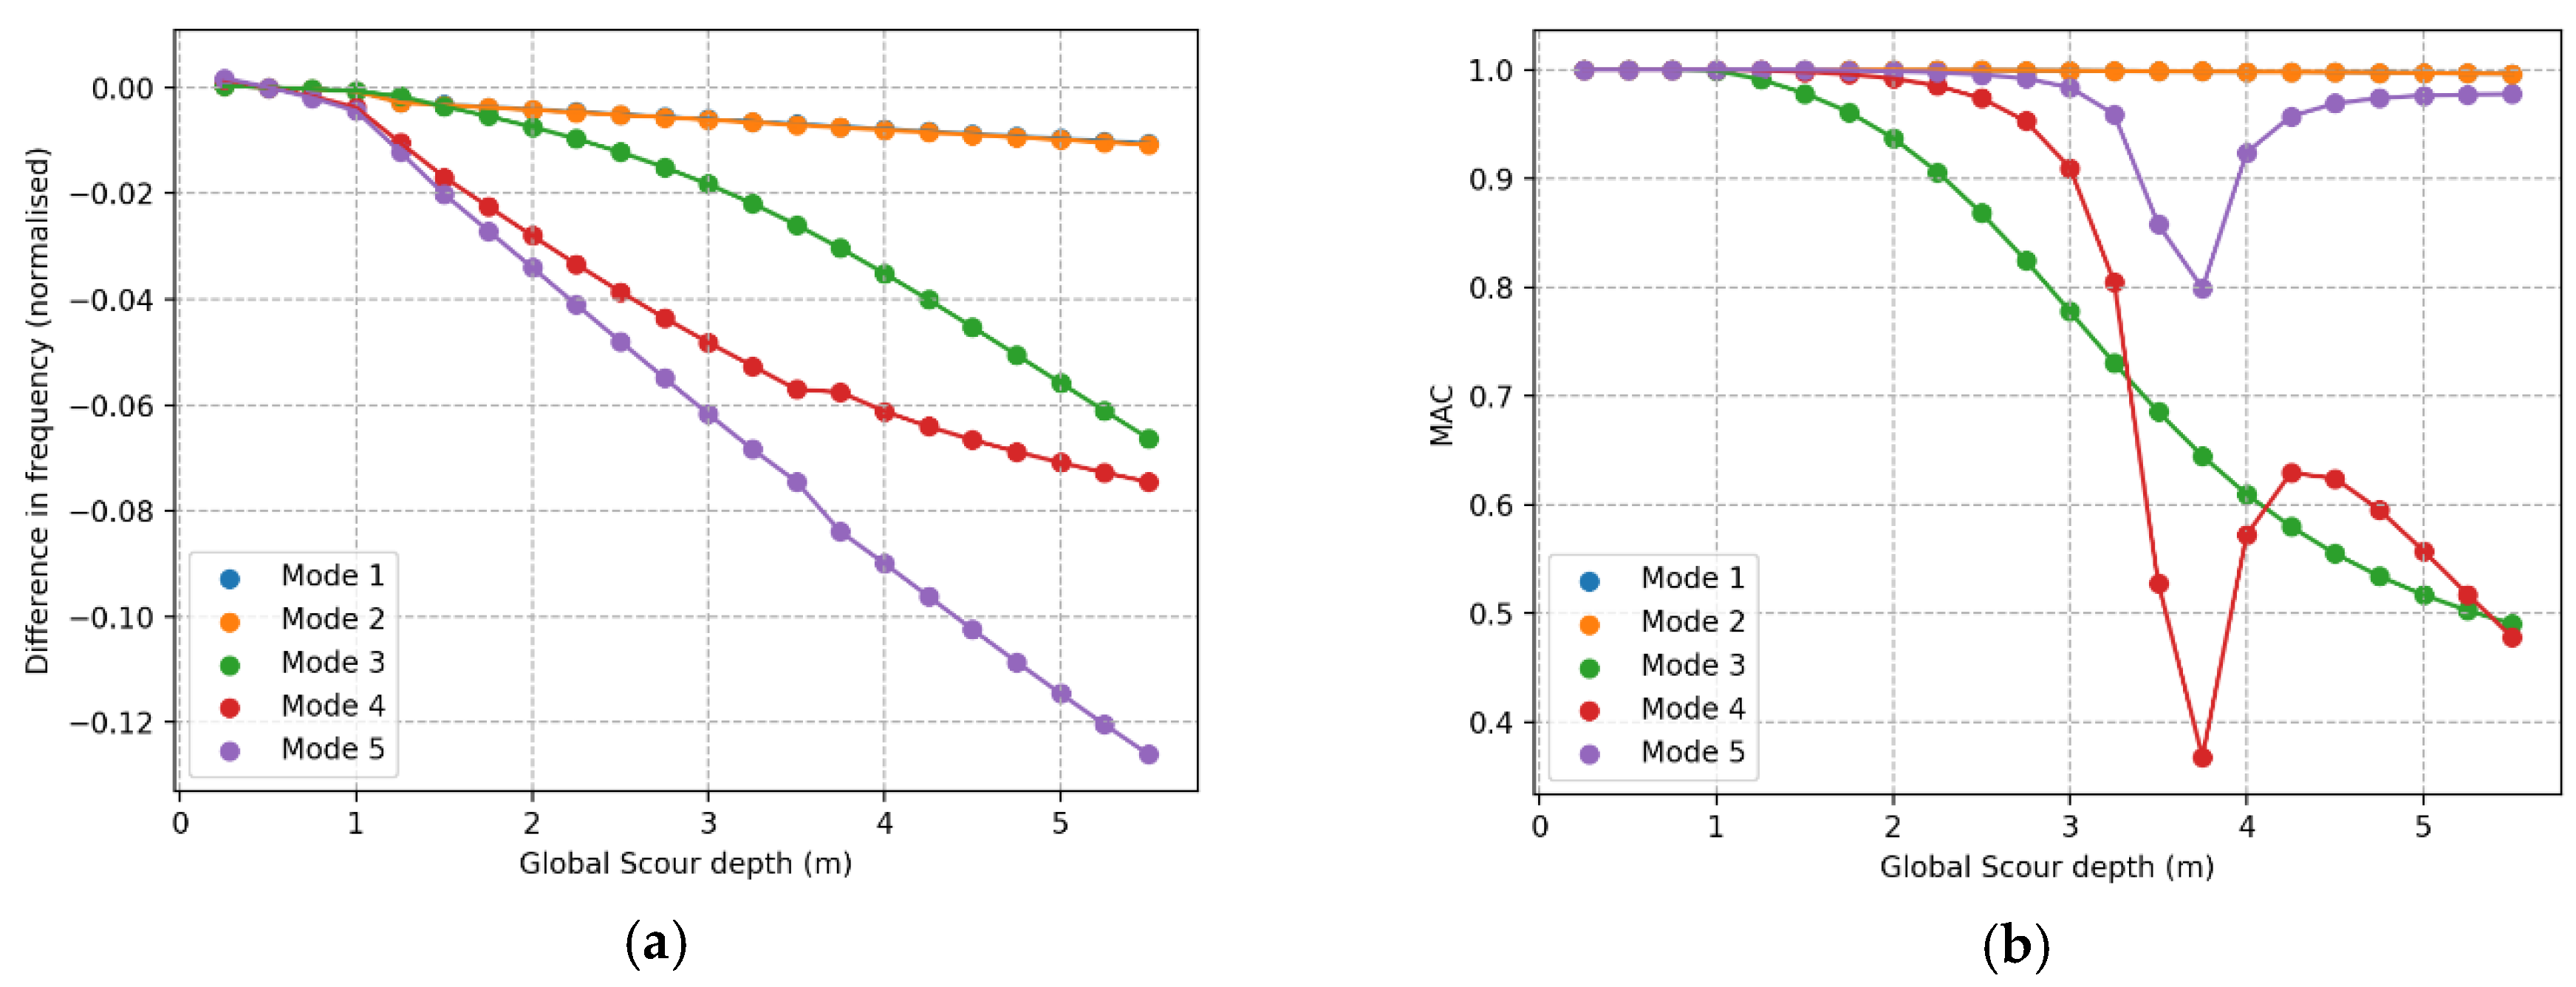
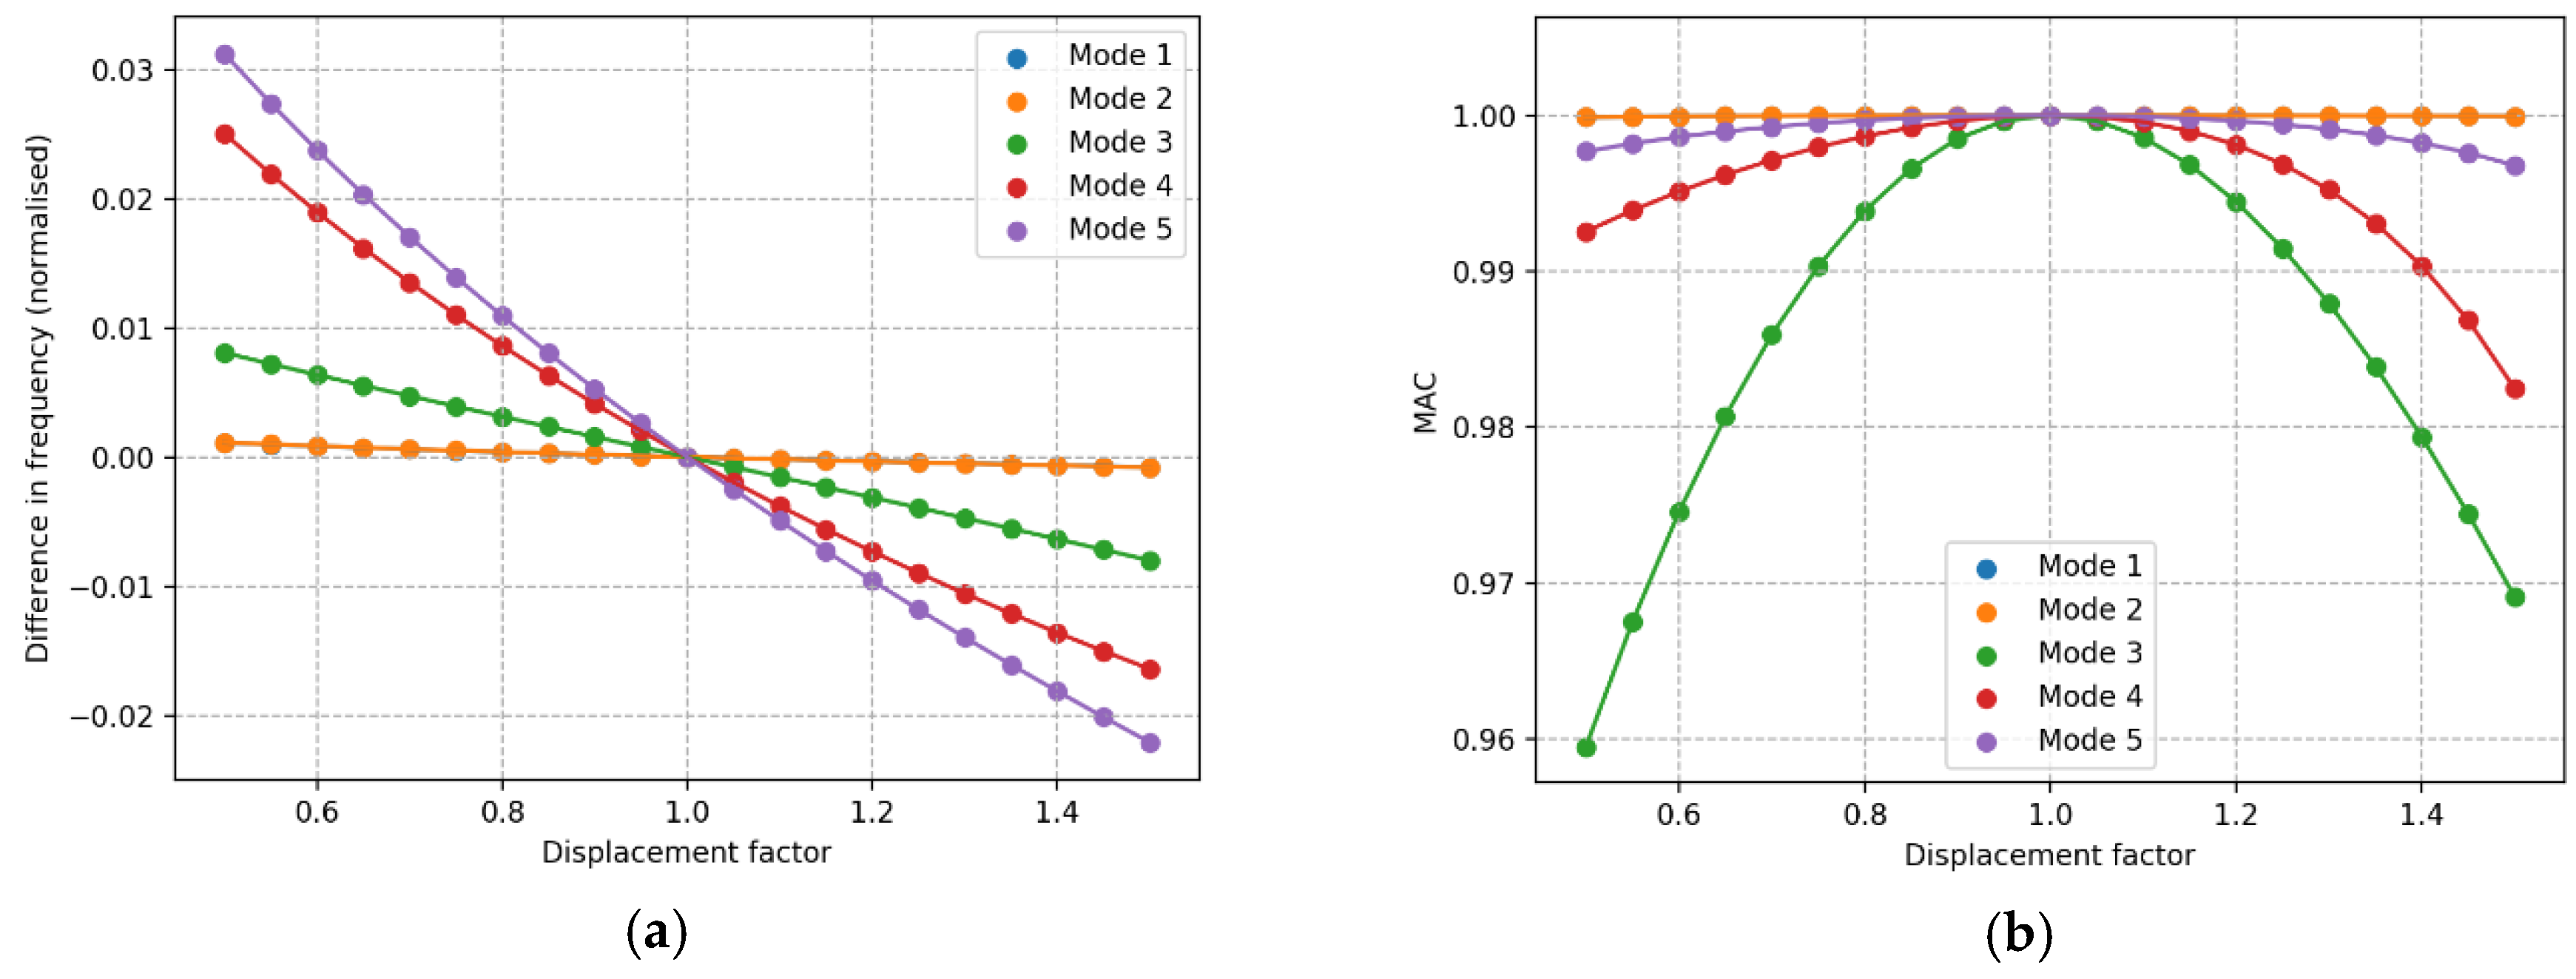
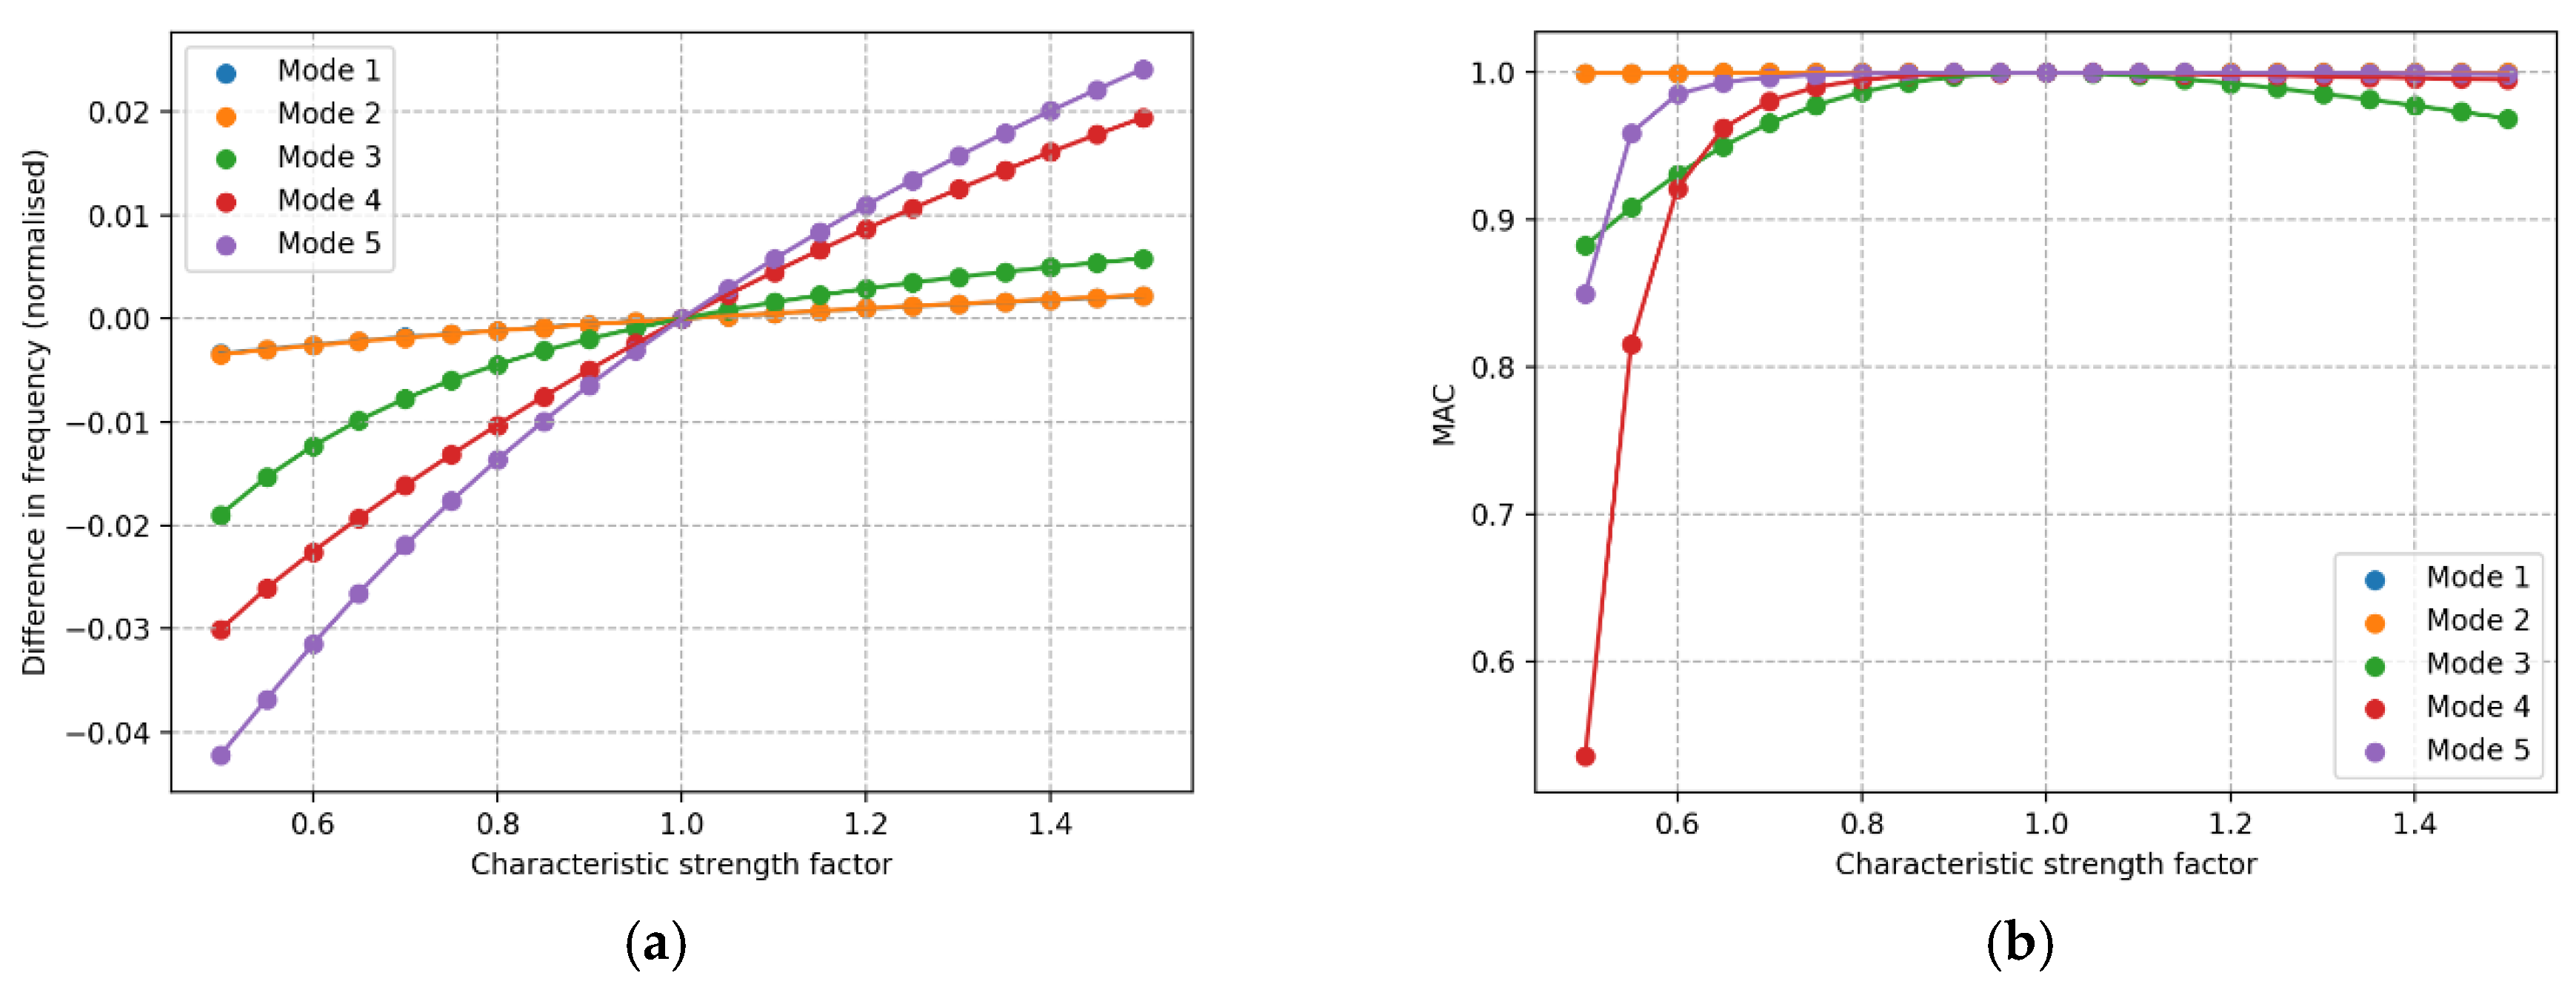
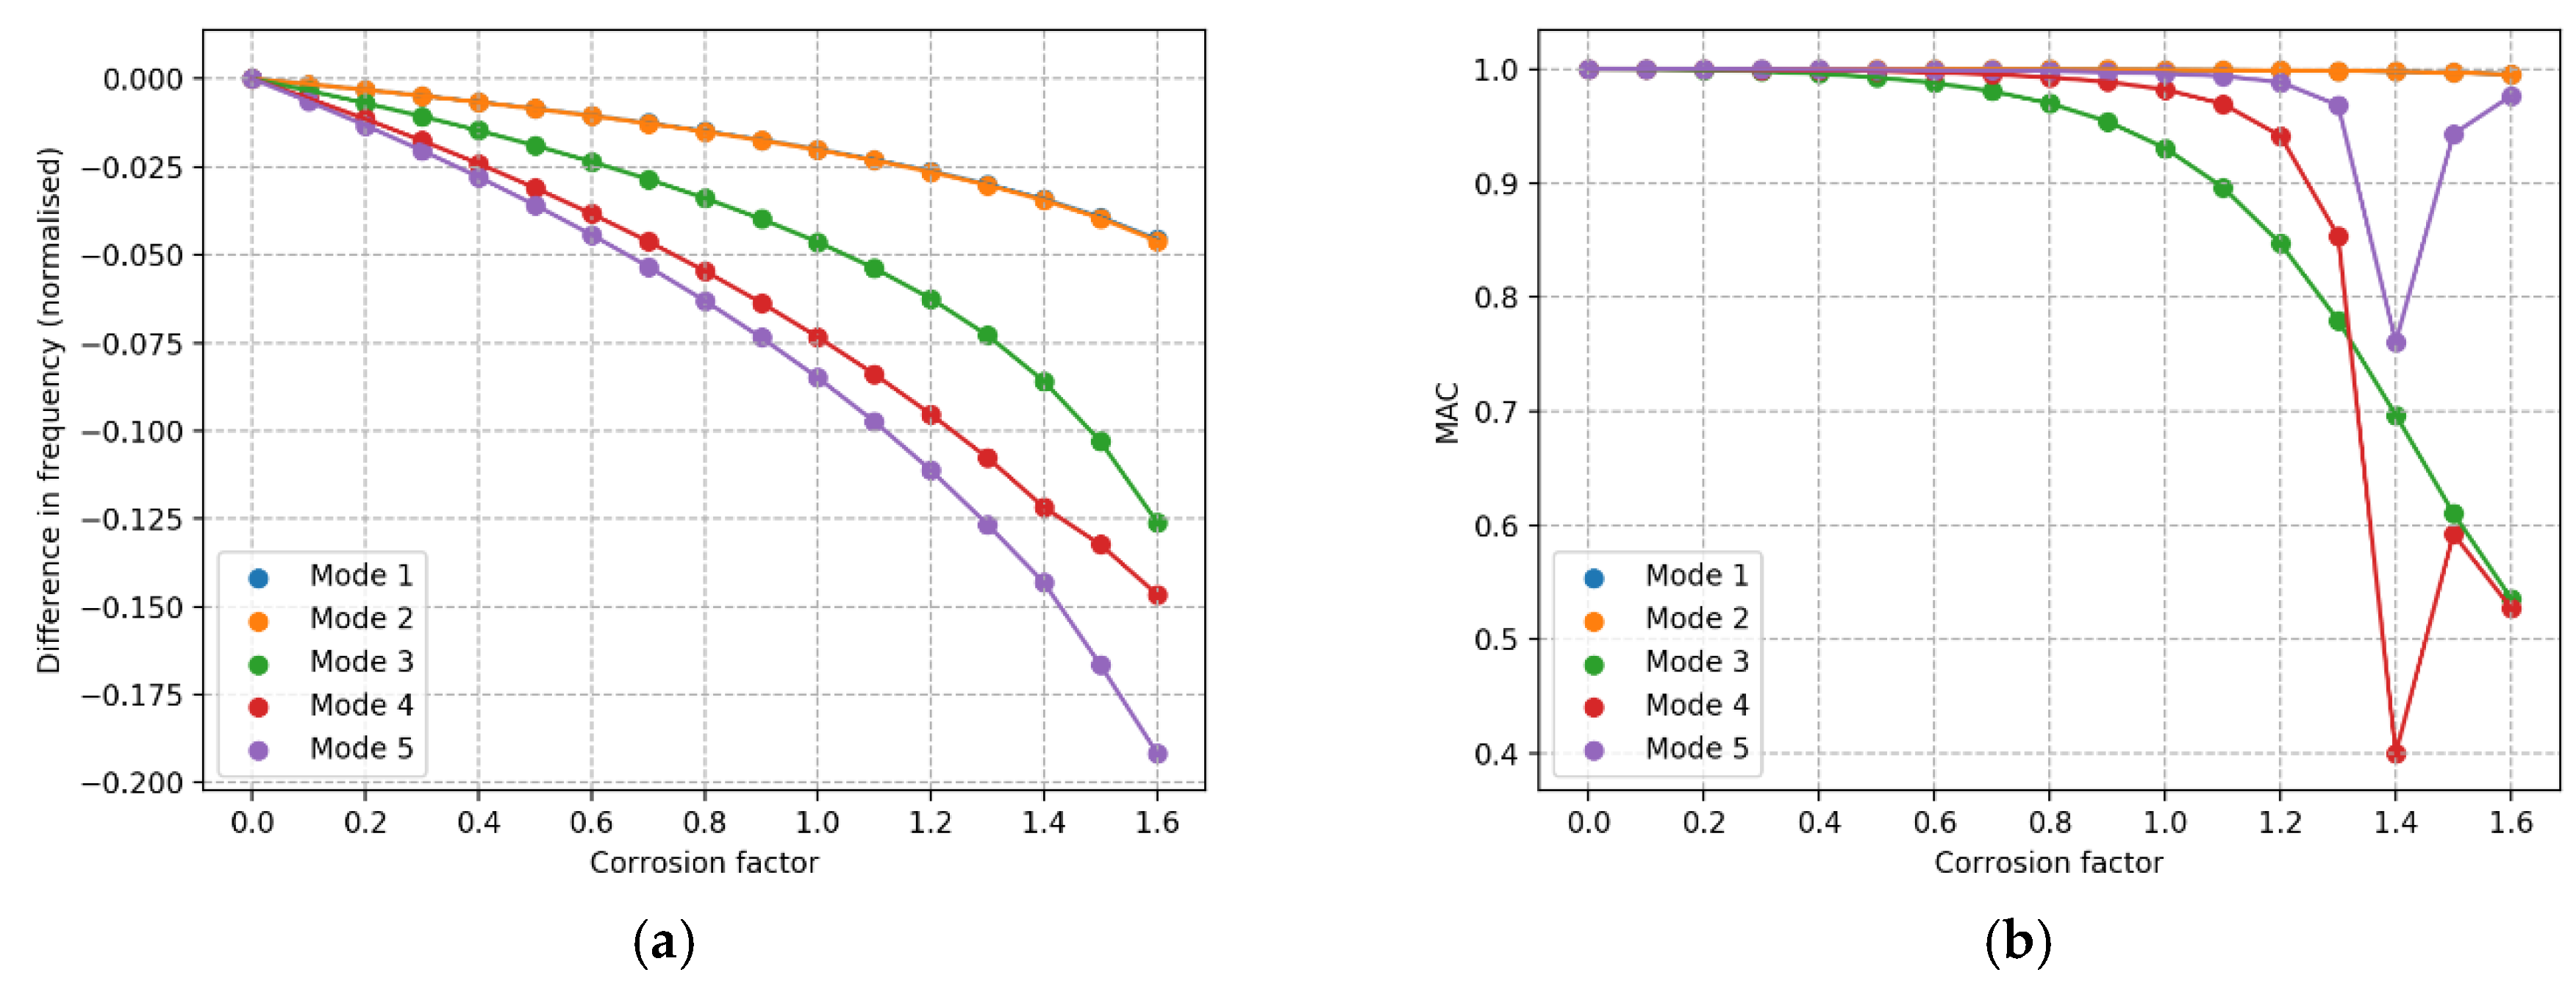
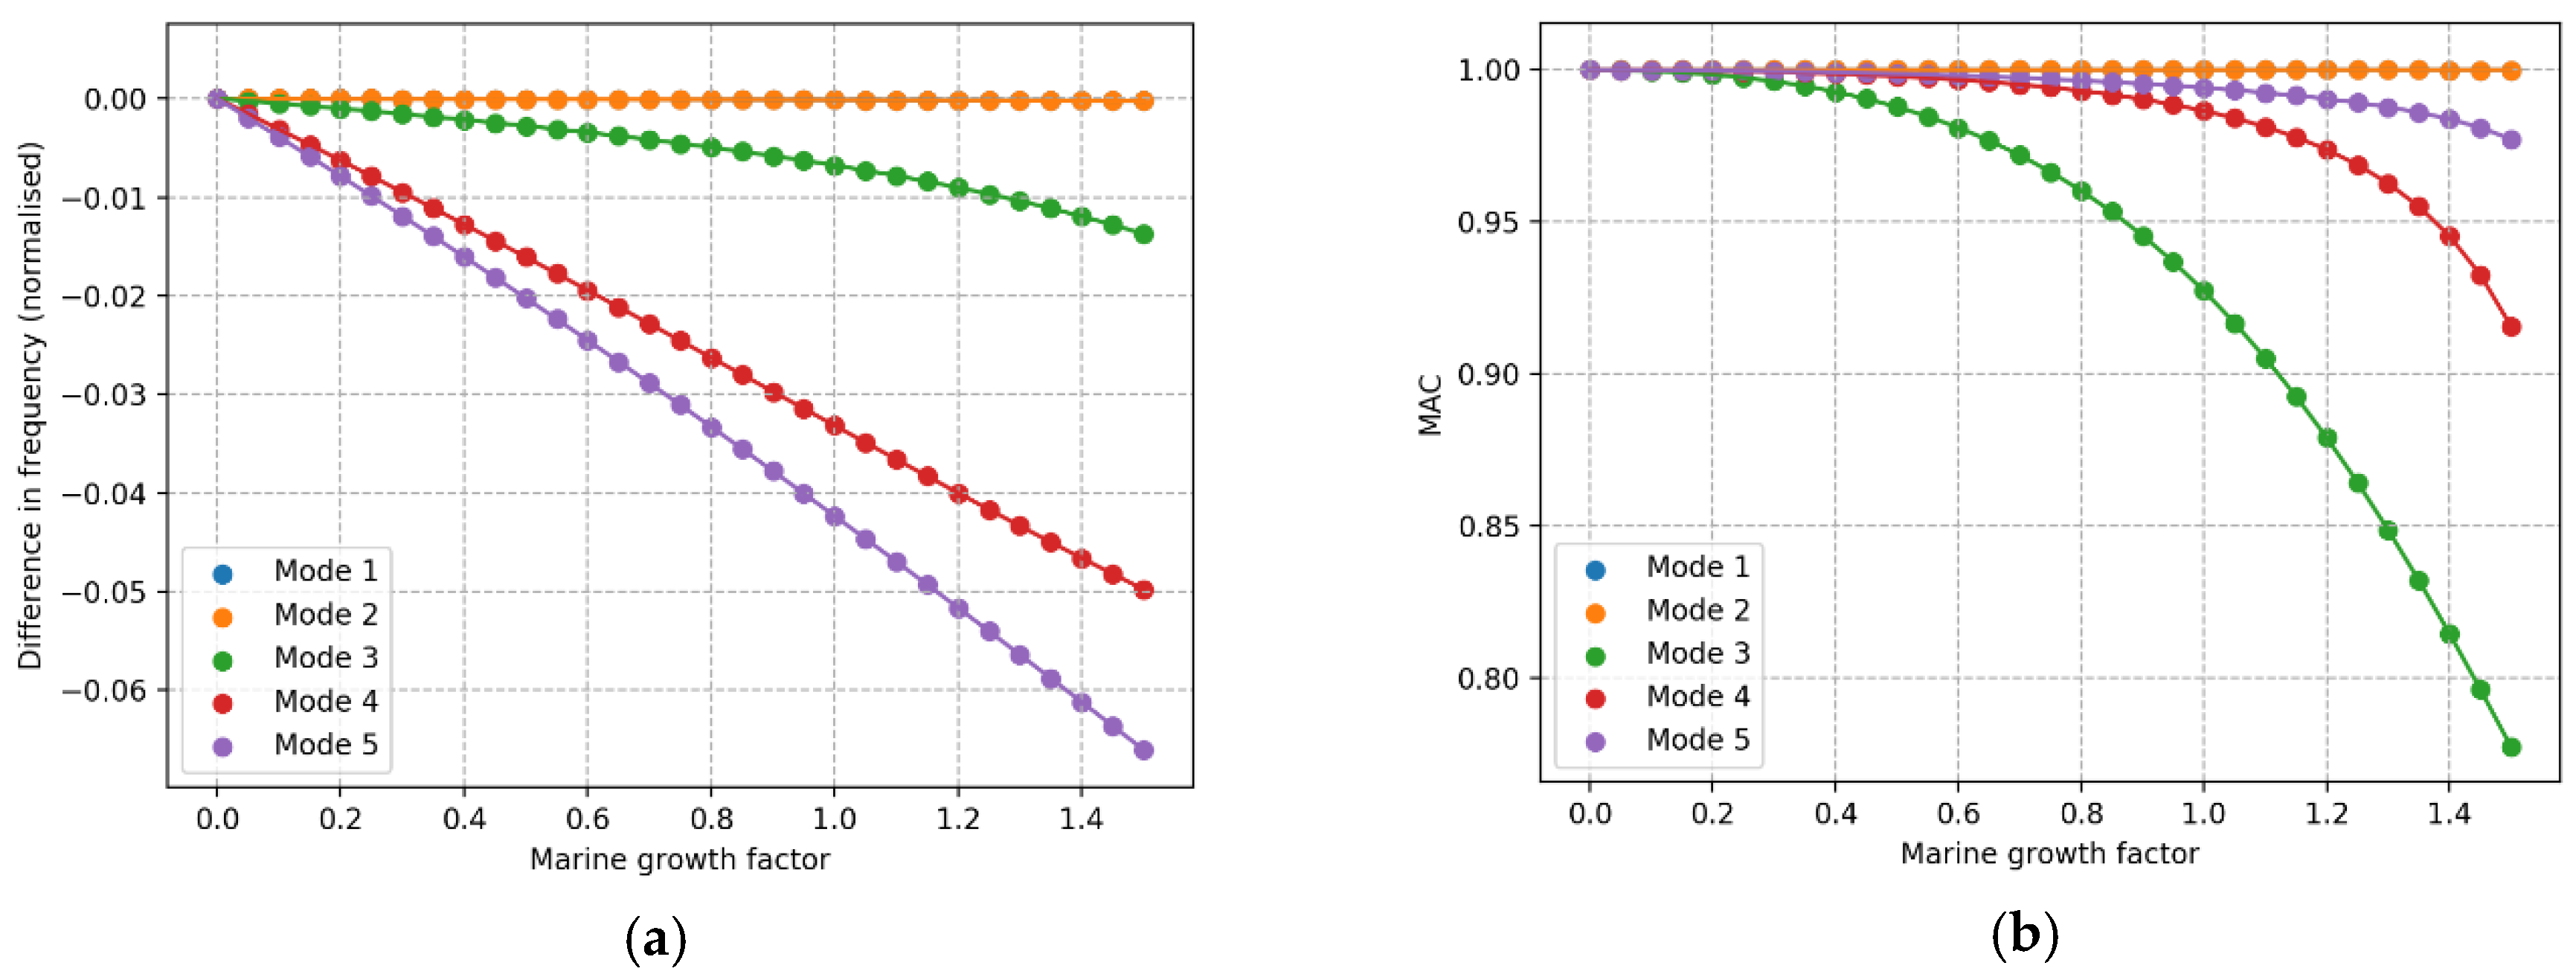
There is a consistent order in normalized change in frequency and MAC values for effects that are global on the structure, which is that all factors investigated that are not a damage to a specific structural element. The order in terms of largest change to smallest is consistently fifth, fourth, third, second, first for normalized change in frequency and for MAC, within moderate changes, the order is third, fourth, fifth, with negligible change in first and second. This order is of course dependent on how the comparison is chosen, but the conclusion is that based on the order of frequency change or MAC values, these effects cannot be distinguished. To distinguish between these effects, this can potentially be done based on the quantity of the changes with respect to each other, as well as using time history observing the development of the change.
Damages to the structural member joints have a nonsymmetric effect and therefore, the observed change in modal parameters is closely related to the nacelle direction. As a result of this directionality, the side of the structure on which the damage has occurred is identifiable. The level of effect the joint damage has can also be characterized by the height of the damage and, therefore, it should be possible to locate joint damage with reasonable accuracy.
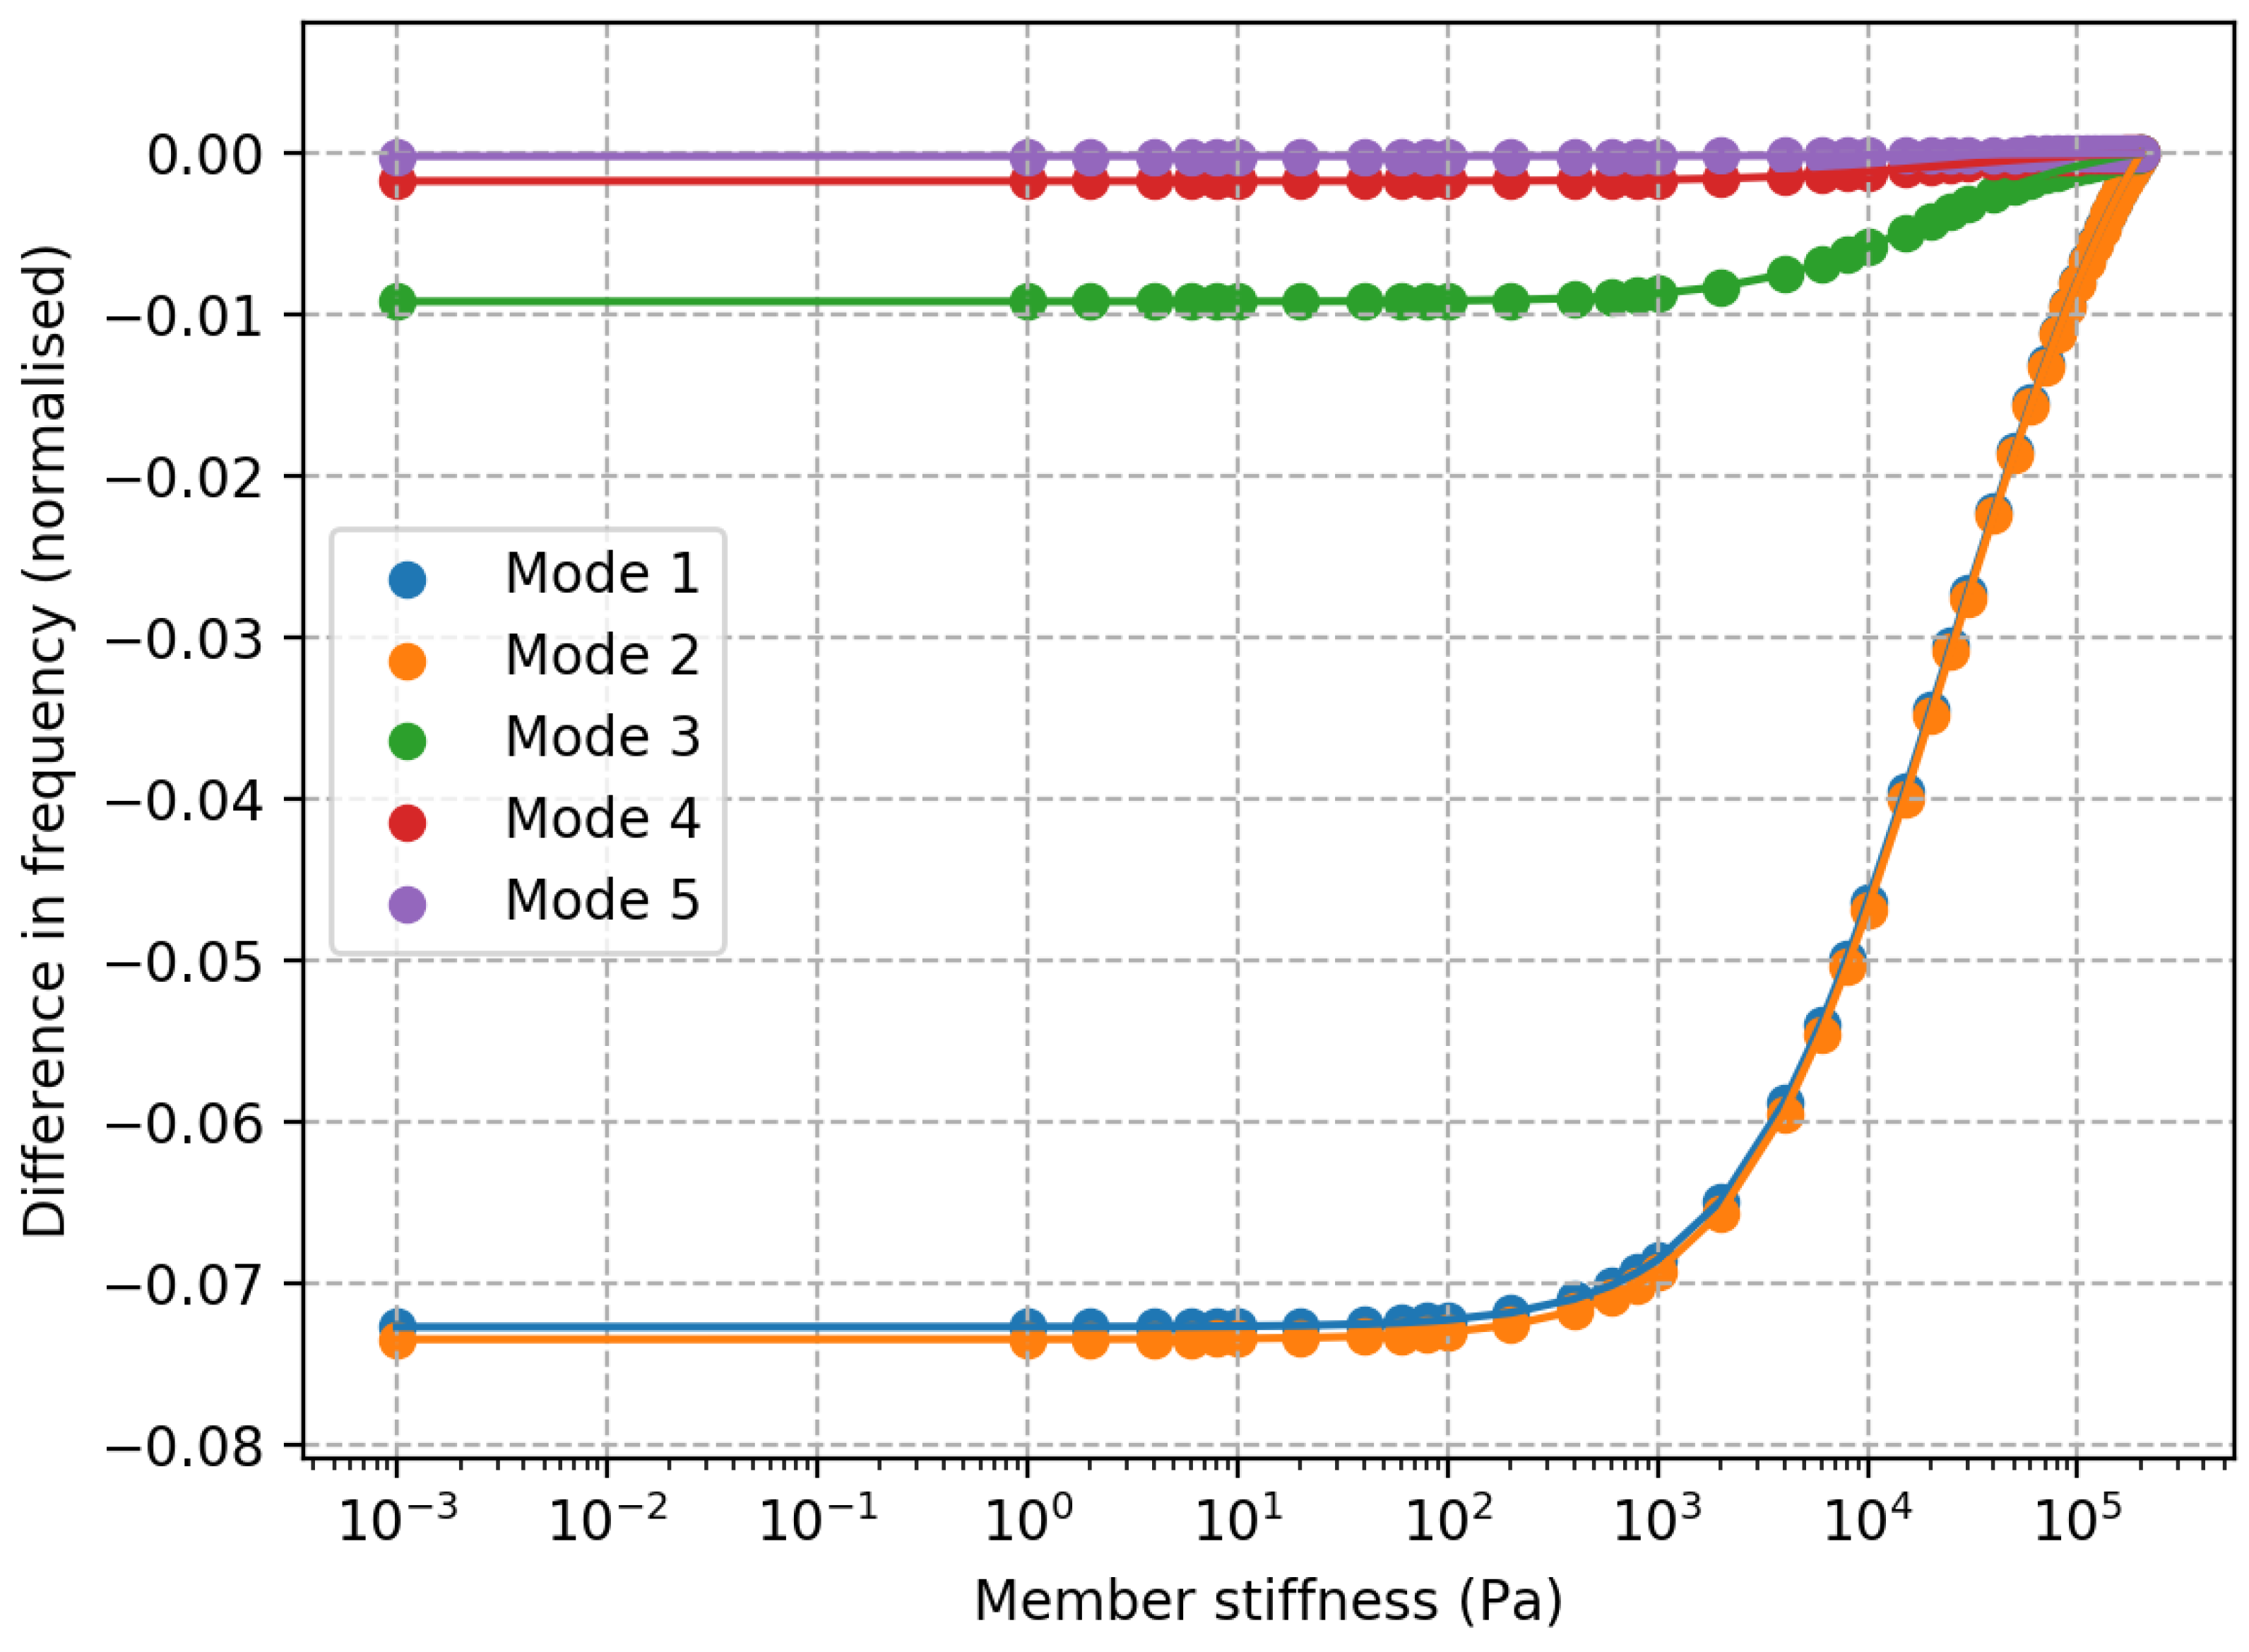
It is useful to calculate several metrics when trying to detect and identify damage. This gives more information about what change has occurred and can make the situation easier to understand. In calculations that require comparison of specific modes, it is useful to make this selection both with the order of the frequency and by maximizing the total MAC value, as it appears that neither approach is always the better choice. The damage metric calculated with the modal flexibility can be hard to interpret on its own as the value indicating ‘damage’ changes between damage types. For example, the damage index is 1.2 with 6 m of scour, 0.35 with a marine growth factor of 1.45 and 2 at a corrosion factor of 1.6, while just changing the direction of the nacelle the value can go up to 0.3. By itself, it can only show if there is a change in the structure, but it can be useful if combined with other information.
When the frequencies of two modes intersect, there is a sharp change in the shape of these two modes which is observed in the MAC values. When this happens with lower modes, the change is also observed in the modal flexibility.

8. Conclusions

This paper presented the simulated dynamic response of an offshore wind turbine jacket structure and how it changes in response to a range of situations. These situations include: (1) operational changes, the turbine nacelle yaw; (2) damage, including cracks on structural joints; and (3) exceeding design parameters for corrosion, scour, marine growth and tower bolt tension. This can serve as a useful reference for future work, as these situations were investigated on a single structure using a highly detailed design model. The structural response, and hence damage detection feasibility, based on a numerical model of damages, has been investigated. For the range of conditions, an eigenvalue solution was conducted to determine the modal properties and sensitivity studies to a range of parameter changes was conducted. There is a greater level of detail in the model used for this study than in other, similar studies. An example of the increased level of detail is including the blades and nacelle through representing them as a moment of inertia and mass including the mass and moment of inertia of the nacelle and blades. Including the cracks on structural elements, other types of damage are simulated such as scour, marine growth and corrosion. The metrics calculated are global metrics to reflect real-world limitations, these metrics are normalized frequency changes, MAC and a value derived from modal flexibility.
It was found the nacelle direction substantially alters the mode shapes and, hence, the MAC values, although the frequencies are not significantly altered. Therefore, any damage detection algorithm using mode shapes should include knowledge of the nacelle yaw direction. This also impacts how cracks in joint elements appear in terms of MAC value; the result is that, at some nacelle yaw directions, it may be hard to detect damage, but this potentially aids in locating the damage.
If there is a significant enough change in the modal properties caused by the damage, then the frequency of one mode can move below the frequency of another, this mode-switching is an issue encountered for semi-symmetric structures. Two methods for dealing with this were used and assessed, which include using the Hungarian algorithm to maximize the sum of MAC values, as well as using a modal stiffness-based damage metric. Both approaches were shown to be effective, although the Hungarian algorithm was only effective up to a limited level of change in some parameters.
There are several observations that would aid in the localization of cracks through changes in global dynamics. One of these observations confirms what is already known, which is that for cracks on elements, the severity on the structural dynamics is a function of height in the structure; lower elements change mode shape and frequency more than higher ones. This, combined with the directionality of the nacelle, can make localization of the damaged member joint possible using global metrics.
Effects which apply to the structure evenly, such as corrosion or global scour, there is a common order in which the MAC and frequencies are changed. The result of this is that these types of features may be difficult to discern from each other through modal properties alone.

Author Contributions

Conceptualization, M.R. and U.S.; methodology, M.R.; software, M.R.; validation, M.R. formal analysis, M.R.; investigation, M.R.; resources, U.S.; data curation, M.R.; writing—original draft preparation, M.R.; writing—review and editing, M.R., U.S. and A.K.; visualization, M.R.; supervision, U.S. and A.K.; project administration, M.R.; funding acquisition, U.S. and A.K. All authors have read and agreed to the published version of the manuscript.

Funding

This project has received funding from the European Union’s Horizon 2020 research and innovation program under grant agreement No. 745625 (ROMEO) (“Romeo Project” 2018) (https://www.romeoproject.eu). The dissemination of results herein reflects only the author’s view and the European Commission is not responsible for any use that may be made of the information it contains. Furthermore, this work was also supported by the sponsorship of University of Strathclyde for pursuing Doctoral Studies within the Centre for Doctoral Training in Renewable Energy Marine Structures-REMS (http://www.rems-cdt.ac.uk/).

Acknowledgments

This project has received funding from the European Union’s Horizon 2020 research and innovation program under grant agreement No. 745625 (ROMEO) (“Romeo Project” 2018). The dissemination of results herein reflects only the author’s view and the European Commission is not responsible for any use that may be made of the information it contains.

Conflicts of Interest

The authors declare no conflict of interest.

References

  1. Martinez-Luengo, M.; Shafiee, M. Guidelines and cost-benefit analysis of the structural health monitoring implementation in offshore wind turbine support structures. Energies 2019, 12, 1176. [Google Scholar] [CrossRef] [Green Version]
  2. Kolios, A.J.; Smolka, U. Risk-based maintenance strategies for offshore wind energy assets. In Proceedings of the 2020 Annual Reliability and Maintainability Symposium (RAMS), Palm Springs, CA, USA, 27–30 January 2020. [Google Scholar] [CrossRef]
  3. Wang, Y.-K.; Chai, J.-F.; Chang, Y.-W.; Huang, T.-Y.; Kuo, Y.-S. Development of seismic demand for chang-bin offshore wind farm in taiwan strait. Energies 2016, 9, 1036. [Google Scholar] [CrossRef] [Green Version]
  4. Ju, S.-H.; Huang, Y.-C. Analyses of offshore wind turbine structures with soil-structure interaction under earthquakes. Ocean Eng. 2019, 187, 106190. [Google Scholar] [CrossRef]
  5. Konstandakopoulou, F.; Konstantinidou, M.; Pnevmatikos, N.; Hatzigeorgiou, G.D. Safety and performance of offshore platforms subjected to repeated earthquakes. Infrastructures 2020, 5, 38. [Google Scholar] [CrossRef] [Green Version]
  6. Konstandakopoulou, F.D.; Evangelinos, K.I.; Nikolaou, I.E.; Papagiannopoulos, G.A.; Pnevmatikos, N.G. Seismic analysis of offshore platforms subjected to pulse-type ground motions compatible with European Standards. Soil Dyn. Earthq. Eng. 2020, 129, 105713. [Google Scholar] [CrossRef]
  7. Cevasco, D.; Koukoura, S.; Kolios, A.J. Reliability, availability, maintainability data review for the identification of trends in offshore wind energy applications. Renew. Sustain. Energy Rev. 2021, 136, 110414. [Google Scholar] [CrossRef]
  8. Luczak, M.M.; Telega, J.; Zagato, N.; Mucchi, E. On the damage detection of a laboratory scale model of a tripod supporting structure by vibration-based methods. Mar. Struct. 2019, 64, 146–160. [Google Scholar] [CrossRef]
  9. Tcherniak, D.; Chauhan, S.; Hansen, M.H. Applicability limits of operational modal analysis to operational wind turbines. In Structural Dynamics and Renewable Energy; Conference Proceedings of the Society for Experimental Mechanics Series; Springer: Jacksonville, FL, USA, 2011; Volume 1, pp. 317–327. [Google Scholar]
  10. Liu, G.; Zhai, Y.; Leng, D.; Tian, X.; Mu, W. Research on structural damage detection of offshore platforms based on grouping modal strain energy. Ocean Eng. 2017, 140, 43–49. [Google Scholar] [CrossRef]
  11. Xu, M.; Wang, S.; Li, H. A residual strain energy based damage localisation method for offshore platforms under environmental variations. Ships Offshore Struct. 2018, 14, 747–754. [Google Scholar] [CrossRef]
  12. Li, Y.; Zhang, M.; Yang, W. Numerical and experimental investigation of modal-energy-based damage localization for offshore wind turbine structures. Adv. Struct. Eng. 2018, 21, 1510–1525. [Google Scholar] [CrossRef]
  13. Fathi, A.; Esfandiari, A.; Fadavie, M.; Mojtahedi, A. Damage detection in an offshore platform using incomplete noisy FRF data by a novel Bayesian model updating method. Ocean Eng. 2020, 217, 108023. [Google Scholar] [CrossRef]
  14. Mousavi, Z.; Varahram, S.; Ettefagh, M.M.; Sadeghi, M.H.; Razavi, S.N. Deep neural networks–based damage detection using vibration signals of finite element model and real intact state: An evaluation via a lab-scale offshore jacket structure. Struct. Health Monit. 2020. [Google Scholar] [CrossRef]
  15. Oliveira, G.; Magalhães, F.; Cunha, Á.; Caetano, E. Vibration—Based damage detection in a wind turbine using 1 year of data. Struct. Control Health Monit. 2018, 25, e2238. [Google Scholar] [CrossRef]
  16. Weijtjens, W.; Verbelen, T.; Capello, E.; Devriendt, C. Vibration based structural health monitoring of the substructures of five offshore wind turbines. Procedia Eng. 2017, 199, 2294–2299. [Google Scholar] [CrossRef]
  17. Yi, J.H. Laboratory tests on local damage detection for jacket-type offshore structures using optical FBG sensors based on statistical approaches. Ocean Eng. 2016, 124, 94–103. [Google Scholar] [CrossRef]
  18. Mieloszyk, M.; Luczak, M.M.; Mucchi, E.; Telega, J.; Ostachowicz, W.M. Damage detection in laboratory scale model of the offshore support structure using two different measurement techniques. In Proceedings of the 8th European Workshop on Structural Health Monitoring (EWSHM 2016), Bilbao, Spain, 5–8 July 2016; pp. 2430–2439. [Google Scholar]
  19. Stubbs, N.; Farrar, C.; Kim, J. Field Verification of a Nondestructive Damage Localization and Severity Estimation Algorithm. In Proceedings of the SPIE—The International Society for Optical Engineering; SPIE International Society for Optical: Nashville, TN, USA, 1995; p. 210. [Google Scholar]
  20. Wandji, W.N. Rayleigh’s quotient-based damage detection algorithm: Theoretical concepts, computational techniques, and field implementation strategies. Struct. Health Monit. 2017, 17, 285–297. [Google Scholar] [CrossRef]
  21. Cevasco, D.; Tautz-Weinert, J.; Kolios, A.J.; Smolka, U. Applicability of machine learning approaches for structural damage detection of offshore wind jacket structures based on low resolution data. J. Phys. Conf. Ser. 2020, 1618, 022063. [Google Scholar] [CrossRef]
  22. Jeong, S.; Kim, E.J.; Shin, D.H.; Park, J.W.; Sim, S.H. Data fusion-based damage identification for a monopile offshore wind turbine structure using wireless smart sensors. Ocean Eng. 2020, 195, 106728. [Google Scholar] [CrossRef]
  23. Fan, W.; Qiao, P. Vibration-based Damage Identification Methods: A review and Comparative Study. Struct. Health Monit. 2010. [Google Scholar] [CrossRef]
  24. Ziegler, L.; Cosack, N.; Kolios, A.; Muskulus, M. Structural monitoring for lifetime extension of offshore wind monopiles: Verification of strain-based load extrapolation algorithm. Mar. Struct. 2019, 66, 154–163. [Google Scholar] [CrossRef]
  25. Ivanhoe, R.O.; Wang, L.; Kolios, A. Generic framework for reliability assessment of offshore wind turbine jacket support structures under stochastic and time dependent variables. Ocean Eng. 2020, 216, 107691. [Google Scholar] [CrossRef]
  26. Shittu, A.A.; Mehmanparast, A.; Shafiee, M.; Kolios, A.; Hart, P.; Pilario, K. Structural reliability assessment of offshore wind turbine support structures subjected to pitting corrosion-fatigue: A damage tolerance modelling approach. Wind Energy 2020, 23, 2004–2026. [Google Scholar] [CrossRef]
  27. Malekzehtab, H.; Golafshani, A.A. Damage detection in an offshore jacket platform using genetic algorithm based finite element model updating with noisy modal data. Procedia Eng. 2013, 54, 480–490. [Google Scholar] [CrossRef]
  28. Liu, K.; Yan, R.-J.; Guedes Soares, C. Damage identification in offshore jacket structures based on modal flexibility. Ocean Eng. 2018, 170, 171–185. [Google Scholar] [CrossRef]
  29. Wang, S.; Zhang, M.; Li, H. Damage Localization of an Offshore Platform considering Temperature Variations. Math. Probl. Eng. 2015, 2015, 954926. [Google Scholar] [CrossRef] [Green Version]
  30. Nguyen, C.U.; Huynh, T.C.; Kim, J.T. Vibration-based damage detection in wind turbine towers using artificial neural networks. Struct. Monit. Maint. 2018, 5, 507–519. [Google Scholar] [CrossRef]
  31. Rytter, A. Vibrational Based Inspection of Civil Engineering Structures. Ph.D. Thesis, Aalborg University, Aalborg, Denmark, 1993. [Google Scholar]
  32. Martinez-Luengo, M.; Kolios, A.; Wang, L. Structural Health Monitoring of Offshore Wind Turbines: A review through the Statistical Pattern Recognition Paradigm. Renew. Sustain. Energy Rev. 2016, 64, 91–105. [Google Scholar] [CrossRef] [Green Version]
  33. Song, Y.; Liang, L.; Du, Y.; Sun, B. Railway polygonized wheel detection based on numerical time-frequency analysis of axle-box acceleration. Appl. Sci. 2020, 10, 1613. [Google Scholar] [CrossRef] [Green Version]
  34. Pastor, M.; Binda, M.; Harčarik, T. Modal Assurance Criterion. Procedia Eng. 2012, 48, 543–548. [Google Scholar] [CrossRef]
  35. Kuhn, H.W. Variants of the hungarian method for assignment problems. Nav. Res. Logist. Q. 1956, 3, 253–258. [Google Scholar] [CrossRef]
  36. BLADT Industries. Wikinger Offshore Wind Farm. Available online: https://stateofgreen.com/en/partners/bladt-industries-as-make-sustainable-steel-solutions/solutions/wikinger-offshore-wind-farm-foundations/ (accessed on 4 June 2019).
  37. Wikinger, the Project that Consolidates Germany as a Strategic Market. Available online: https://www.iberdrola.com/about-us/lines-business/flagship-projects/wikinger-offshore-wind-farm (accessed on 4 June 2019).
  38. Ramboll. ROSA, Program ROSA Structural Analysis, User’s Guide; Ramboll: Copenhagen, Denmark, 2019. [Google Scholar]
  39. Passon, P.; Branner, K.; Larsen, S.E.; Rasmussen, H.J. Offshore Wind Turbine Foundation Design; Technical University of Denmark—DTU: Kongens Lyngby, Denmark, 2015. [Google Scholar]
  40. American Petroleum Institute. Recommended Practice for Planning, Designing and Constructing Fixed Offshore Platforms—Working Stress Design, 21st ed.; American Petroleum Institute: Washington, DC, USA, 2000. [Google Scholar]
  41. Jonkman, J.; Musial, W. Offshore Code Comparison Collaboration (OC3) for IEA Task 23 Offshore Wind Technology and Deployment; National Renewable Energy Laboratory: Golden, CO, USA, 2010; Volume 303. [CrossRef] [Green Version]
  42. Scheu, M.N.; Tremps, L.; Smolka, U.; Kolios, A.; Brennan, F. A systematic Failure Mode Effects and Criticality Analysis for offshore wind turbine systems towards integrated condition based maintenance strategies. Ocean Eng. 2019, 176, 118–133. [Google Scholar] [CrossRef]
  43. Luengo, M.M.; Kolios, A. Failure mode identification and end of life scenarios of offshore wind turbines: A review. Energies 2015, 8, 8339–8354. [Google Scholar] [CrossRef] [Green Version]
  44. Weijtjens, W.; Verbelen, T.; De Sitter, G.; Devriendt, C. Foundation structural health monitoring of an offshore wind turbine—A full-scale case study. Struct. Health Monit. 2015, 1–14. [Google Scholar] [CrossRef]
  45. Guo, J.; Wu, J.; Guo, J.; Jiang, Z. A Damage identification approach for offshore jacket platforms using partial modal results and artificial neural networks. Appl. Sci. 2018, 8, 2173. [Google Scholar] [CrossRef] [Green Version]
  46. Budyanas, R.G.; Nisbett, J.K. Shigley’s Mechanical Engineering Design, 9th ed.; McGraw-Hill Book Company: New York, NY, USA, 2011. [Google Scholar]
  47. Adedipe, O.; Brennan, F.; Mehmanparast, A.; Kolios, A.; Tavares, I. Corrosion fatigue crack growth mechanisms in offshore monopile steel weldments. Fatigue Fract. Eng. Mater. Struct. 2017, 40, 1868–1881. [Google Scholar] [CrossRef] [Green Version]
  48. Martinez-Luengo, M.; Causon, P.; Gill, A.B.; Kolios, A.J. The effect of marine growth dynamics in offshore wind turbine support structures. In Proceedings of the 6th International Conference On Marine Structures, Lisbon, Portugal, 8–10 May 2017; pp. 889–898. [Google Scholar]
  49. Jusoh, I.; Wolfram, J. Effects of Marine Growth and Hydrodynamic Loading on Offshore Structures. J. Mek. 1996, 1, 77–96. [Google Scholar]
  50. Pascual, G. Investigation on the Influence of Marine Growth on the Dynamics of FowT; Cranfield University: Cranfield, UK, 2018. [Google Scholar]
  51. Anton, H.; Rorres, C. Elementary Linear Algebra, 11th ed.; Wiley: Hoboken, NJ, USA, 2014; Volume 3. [Google Scholar]
  52. Weinert, J.; Smolka, U.; Schümann, B.; Cheng, P.W. Detecting Critical Scour Developments at Monopile Foundations Under Operating Conditions. In Proceedings of the European Wind Energy Association Annual Event, EWEA 2015, Scientific Proceedings, Paris, France, 17–20 November 2015; pp. 135–139. [Google Scholar]
  53. Martinez-Luengo, M.; Kolios, A.; Wang, L. Parametric FEA modelling of offshore wind turbine support structures: Towards scaling-up and CAPEX reduction. Int. J. Mar. Energy 2017, 19, 16–31. [Google Scholar] [CrossRef]
Figure 1. Diagram of damage process used to map damages implemented in a structural model with structural response caused by a change in the structure.
Energies 13 05791 g001
Figure 2. Example case showing the eigenfrequencies of the first 10 modes as the stiffness of a leg element is reduced from design stiffness to complete loss of stiffness.
Energies 13 05791 g002
Figure 3. Shapes of first five modes along with their respective frequencies. Colored by total displacement. (a) Tower modes 1 and 2, (b) torsional mode 3, (c) swaying modes 4 and 5.
Energies 13 05791 g003
Figure 4. Representation of the structure in ROSA, including appurtenance, sea and soil. Labels of joints presented.
Energies 13 05791 g004
Figure 5. Modal assurance criterion (MAC) values for the undamaged case as nacelle direction is rotated in comparison to 0 degrees. Comparison is made to the original direction at 0 degrees. Mode shapes are transformed to the original reference.
Energies 13 05791 g005
Figure 6. Total structural dynamic moment of inertia (MoI) with changing yaw direction.
Energies 13 05791 g006
Figure 7. ‘Damage index’ as a result of changing nacelle direction, with no damage implamented. This comparative value is calculated in comparison to the nacelle at 0 degree case.
Energies 13 05791 g007
Figure 8. MAC values for the first five modes as simulated damage to a leg element is implemented. (a) Mode frequency value; (b) MAC value, both with comparison based on mode frequency; (c) mode frequency value; (d) MAC value, both with comparison based on maximized MAC values.
Energies 13 05791 g008
Figure 9. Damage index as simulated leg damage is implemented.
Energies 13 05791 g009
Figure 10. Change in mode frequency (a) and MAC value (b), calculated relative to undamaged case.
Energies 13 05791 g010aEnergies 13 05791 g010b
Figure 11. MAC values for the leg damaged case at varying nacelle directions compared to undamaged case at 0 degrees. Mode shapes have been transformed back to original reference.
Energies 13 05791 g011
Figure 12. Effect of gradually increased depth of global scour, compared to 0 scour depth. Modes compared based on maximized MAC (a) Difference in natural frequency, (b) MAC value. Scour depth in meters for the 23 m × 23 m jacket.
Energies 13 05791 g012
Figure 13. Effect of displacement factor compared to a factor of 1. (a) Difference in frequency, (b) MAC value.
Energies 13 05791 g013
Figure 14. Characteristic soil strength sensitivity. (a) Difference in frequency, (b) MAC value.
Energies 13 05791 g014
Figure 15. Change in frequency from reduced node stiffness at tower base.
Energies 13 05791 g015
Figure 16. Effect of corrosion relative to the uncorroded structure. (a) Change in frequency, (b) MAC values.
Energies 13 05791 g016
Figure 17. Effect of marine growth relative to the unfouled structure. (a) Change in frequency, (b) MAC values.
Energies 13 05791 g017
Publisher’s Note: MDPI stays neutral with regard to jurisdictional claims in published maps and institutional affiliations.

