Article

Dynamic Modeling and Simulation of Non-Interconnected Systems under High-RES Penetration: The Madeira Island Case

by
Stefanos Ntomalis
1,
Petros Iliadis
1,2,*,
Konstantinos Atsonios
1,
Athanasios Nesiadis
1,
Nikos Nikolopoulos
1 and
Panagiotis Grammelis
1
1
Centre for Research and Technology Hellas/Chemical Process and Energy Resources Institute, 57001 Thessaloniki, Greece
2
Department of Electrical Engineering, Democritus University of Thrace, 67100 Xanthi, Greece
*
Author to whom correspondence should be addressed.
Energies 2020, 13(21), 5786; https://doi.org/10.3390/en13215786
Submission received: 24 September 2020 / Revised: 23 October 2020 / Accepted: 2 November 2020 / Published: 5 November 2020
(This article belongs to the Section F: Electrical Engineering)

Abstract

:
The defossilization of power generation is a prerequisite goal in order to reduce greenhouse gas emissions and transit for a sustainable economy. Achieving this goal requires increasing the penetration of renewable energy sources (RESs) such as solar and wind power. The gradual shrinking of conventional generation units in an energy map introduces new challenges to the stability of power systems as there is a considerable reduction of stored rotational energy in the synchronous generators (SGs) and the capability to control their power output, which has been taken for granted until today. Inertia and primary reserve reduction have a substantial effect on the ability of the power system to maintain its security and self-resilience during contingency events. Such issues become more evident in the case of non-interconnected islands (NII) as they have unique features associated with their small size and low inertia. The present study examines in depth the NII system of Madeira, which is composed of thermal, hydro, solid-waste, wind and solar generation units, and additional RES integration is planned for the near future. Electromagnetic transient (EMT) simulations are performed for both the current and future states of the system, including the installation of planned variable RES capacities. To alleviate the stability issues that occurred in the high-RES scenario, the introduction of a utility-scale battery energy storage system (BESS), capable of mitigating the active power imbalance due to the power system’s disturbances resultant of RES penetration, is examined. In addition, a comparison between a flywheel energy storage system (FESS) and BESS is shortly investigated. The grid has been modeled and simulated utilizing the open-source, object-oriented modeling language Modelica. The dynamic simulation results proved that battery storage is a promising technology that can be a solution for transitioning to a sustainable power system, maintaining its self-resilience under severe disturbances such as rapid load changes, the tripping of generation units and short-circuits.

1. Introduction

In 2014, the EU raised the targets of reducing greenhouse gas (GHG) emissions by at least 40% and below the levels of 1990 by 2030, increasing the renewable energy share to 32% and improving energy efficiency by 32.5% [1]. Accomplishing such a transformation is strongly related to the capability of local power systems to incorporate renewable energy technologies while keeping sufficient levels of security and reliability [2]. Variable renewable energy sources (vRESs), i.e., wind and solar, have a levelized cost of energy (LCOE) of one-and-a-half to two-times less than dispatchable RESs [3], presenting significant prospects of decreasing reliance on fossil fuel and GHG emissions in electric sectors. Efforts to reduce climate change impacts, governmental policies and end-user consciousness-raising led to increased deployments of vRES [4]. At the same time, power systems undergo considerable change in operating requirements due to the stochastic nature of these technologies [5].
The case is even more challenging for the non-interconnected island (NII) systems as they have unique features associated with their small size, low inertia, lack of external interconnections and usually high-power generation share of RES [6]. The stability of NII systems of various scales has been engaged in the research field. Several studies have been conducted since they have the potential to become places of demonstration and act as testbeds for solutions for which value is difficult to demonstrate in larger systems.
A promising solution mitigating these stability problems is the integration of energy storage systems such as batteries, supercapacitors and flywheels. Battery energy storage systems (BESSs) in particular can provide a variety of services to the grid, such as frequency control [7,8,9], voltage control in the distribution grid [10,11,12] and energy management services [13,14,15].
Although several studies have investigated the provision of ancillary services by BESSs in macro- and microgrids, studies regarding NII systems are sparse despite the weightier interest from the stability point of view. More particularly, in [16], a scheme for an enabling technology that capitalizes on the advantages of both battery energy storage and synchronous generation by combining a synchronous condenser with a battery was proposed and demonstrated in Australia’s King Island. A similar study has been conducted for the Seychelles islands [17], where solutions such as demand-side management (DSM) and diesel generators’ brief operation at lower turn-down rates—enabling the compensation of abrupt decreases of photovoltaic (PV) power generation by adding spinning reserves to the system—were evaluated. A concept combining wind and pumped storage power production, along with the appropriate operation strategy, was introduced in [18] to support El Hierro’s power grid. This concept is based on the inertial energy and reactive current to maintain stability in cases of large disturbances. Similarly, several studies have been carried out for the Bornholm island in Denmark. Specifically, Cha et al. [19] proposed a coordinated control scheme where batteries were used to supply frequency support as a fast-acting primary control and a microgrid management system acted as a second primary reserve to assist in keeping a constant frequency and voltage under islanding operation mode. Pillai et al. [20] proposed that EV battery storages can support the grid during frequency events by controlling their charging rate. Furthermore, in [21], the integration of BESS for mitigating inertia and primary frequency control issues in Sardinia island, Italy, is addressed. For similar studies, refer to [22,23,24,25,26].
The presented literature survey shows that the number of studies regarding insular NII power systems is limited. Moreover, in these works, proprietary software is utilized for conducting simulations, preventing the reader from replicating or improving the experiments. Another important point to remark is that many of these studies incorporate root mean square (RMS) modeling instead of EMT, which is crucial for low-inertia grid studies, since RMS simulations cannot always predict instabilities [27].
Dynamic models used in stability simulations are critical components of the system’s reliability assessment in planning and operational horizons [28]. Commercial proprietary tools, namely PowerFactory, NEPLAN, PSS®E, etc., offer automated calculations with closed “black box” models. On the contrary, a more transparent approach can be implemented using the Modelica language [29], allowing the simulators to customize real operating parameters and strategies in more detail. Modelica is an object-oriented, declarative, multidomain modeling language for the component-oriented modeling of complex systems. Users can define custom models utilizing its acausal equation-based nature. Modelica environments include open-source environments like OpenModelica [30] and proprietary environments like Dymola, SystemModeler, SimulationX, etc. Several open-source power system libraries have been developed, and a review can be found in [31]. The main noteworthy Modelica libraries for electric power systems modeling studies are PowerSystems [32] and OpenIPSL [33]. However, few simulation studies dedicated to islanded high-RES systems problems have been conducted using Modelica so far.
The scope of the study presented in this paper is twofold: (i) to examine the impact of the vRES penetration increase on frequency stability in a large NII system, and (ii) propose an effective solution to the frequency stability issue by utilizing a battery storage system. The island system under consideration is Madeira of Portugal, located in the Pacific Ocean, 520 km west of Morocco. Madeira constitutes a NII system with a yearly peak load of 134 MWe and incorporates various renewable sources in its energy mix. Furthermore, the island belongs to the innovator islands in terms of energy transition, and, in the near future, there are extension plans for the introduction of a high percentage of intermittent generation capacities into the HV/MV grid, supported by energy storage units [34,35,36]. For all these characteristics, Madeira’s power system is a considerably valuable case study.
The main novel aspects of the present study include:
  • The transient modeling of a complex NII power system with a wide range of renewable and conventional power generation units, utilizing exclusively open-source software. This feature enhances the innovative character of the current work, as the value of open-source software for power systems’ simulations has already been emphasized by the research community [37]. There are no publications of such complex real systems without using a commercial package, making this paper innovative.
  • A novel methodological approach for the impact assessment of high-RES penetration on the island’s frequency stability. This approach involves examining both the current and future states in terms of stability and considering all the additional RES capacities with the simultaneous reduction of fossil-based plant capacity. Furthermore, power flow analysis is incorporated as an ancillary step in the scenario determination procedure to identify extreme cases in terms of the online inertia and primary frequency reserves. The final part of the methodological approach regards the conduction of transient simulations for disturbances such as rapid load changes and the tripping of generation units and short-circuits. The comparative analysis of the results reveals the impact of increased vRES capacities, decreased inertia and limited primary frequency reserves on the system’s stability.
  • The consideration of energy storage technologies (BESS, FESS) to address the revealed instabilities in future low-inertia scenarios.
The following approach revealed the presence of stability issues in the future high-RES scenario. These issues are tackled by considering a BESS that contributes to power system inertia and primary frequency ancillary services, ensuring frequency stability. Simulations demonstrate the crucial role that such systems will play, along with the continuous increase of vRES deployment in order to support the frequency in contingency events. Additionally, a short comparison between BESS and a flywheel energy storage system (FESS) is investigated in terms of response time.
This paper is structured as follows: In Section 2, a description of the methodology used, scenarios considered and proposed BESS is presented. Section 3 presents a detailed description of Madeira’s power system as it is currently and in the near future after the scheduled installation of new RES plants. Finally, Section 4 includes the dynamic simulation results accompanied by the relevant discussion.

2. Theoretical Background

2.1. Frequency Control Ancillary Services

Frequency stability concerns the ability of the system to maintain a steady frequency after a severe system upset, leading to a considerable imbalance between power production and demand. Traditionally, the subject of frequency stability was closely related to the operation of SGs, as they were predominant generation units. SGs present particular features that have greatly affected power system planning and operation since the introduction of electric machinery. From a physics standpoint, the turbine system and rotating components of each machine present mechanical inertia, and therefore, they are able to store kinetic energy in this rotating mass. Because energy can be withdrawn by or directed to these rotating masses during system disturbances, a system of machines is capable of adequately responding to fluctuations in net load and generation [38]. Furthermore, the active power of a SG can be controlled through the shaft torque. To ensure the resilience of a power system, its frequency is tightly adjusted by a combination of fast-acting closed-loop controllers at each machine (primary frequency response through governor controls), which are constantly controlling the machine’s mechanical power [39].
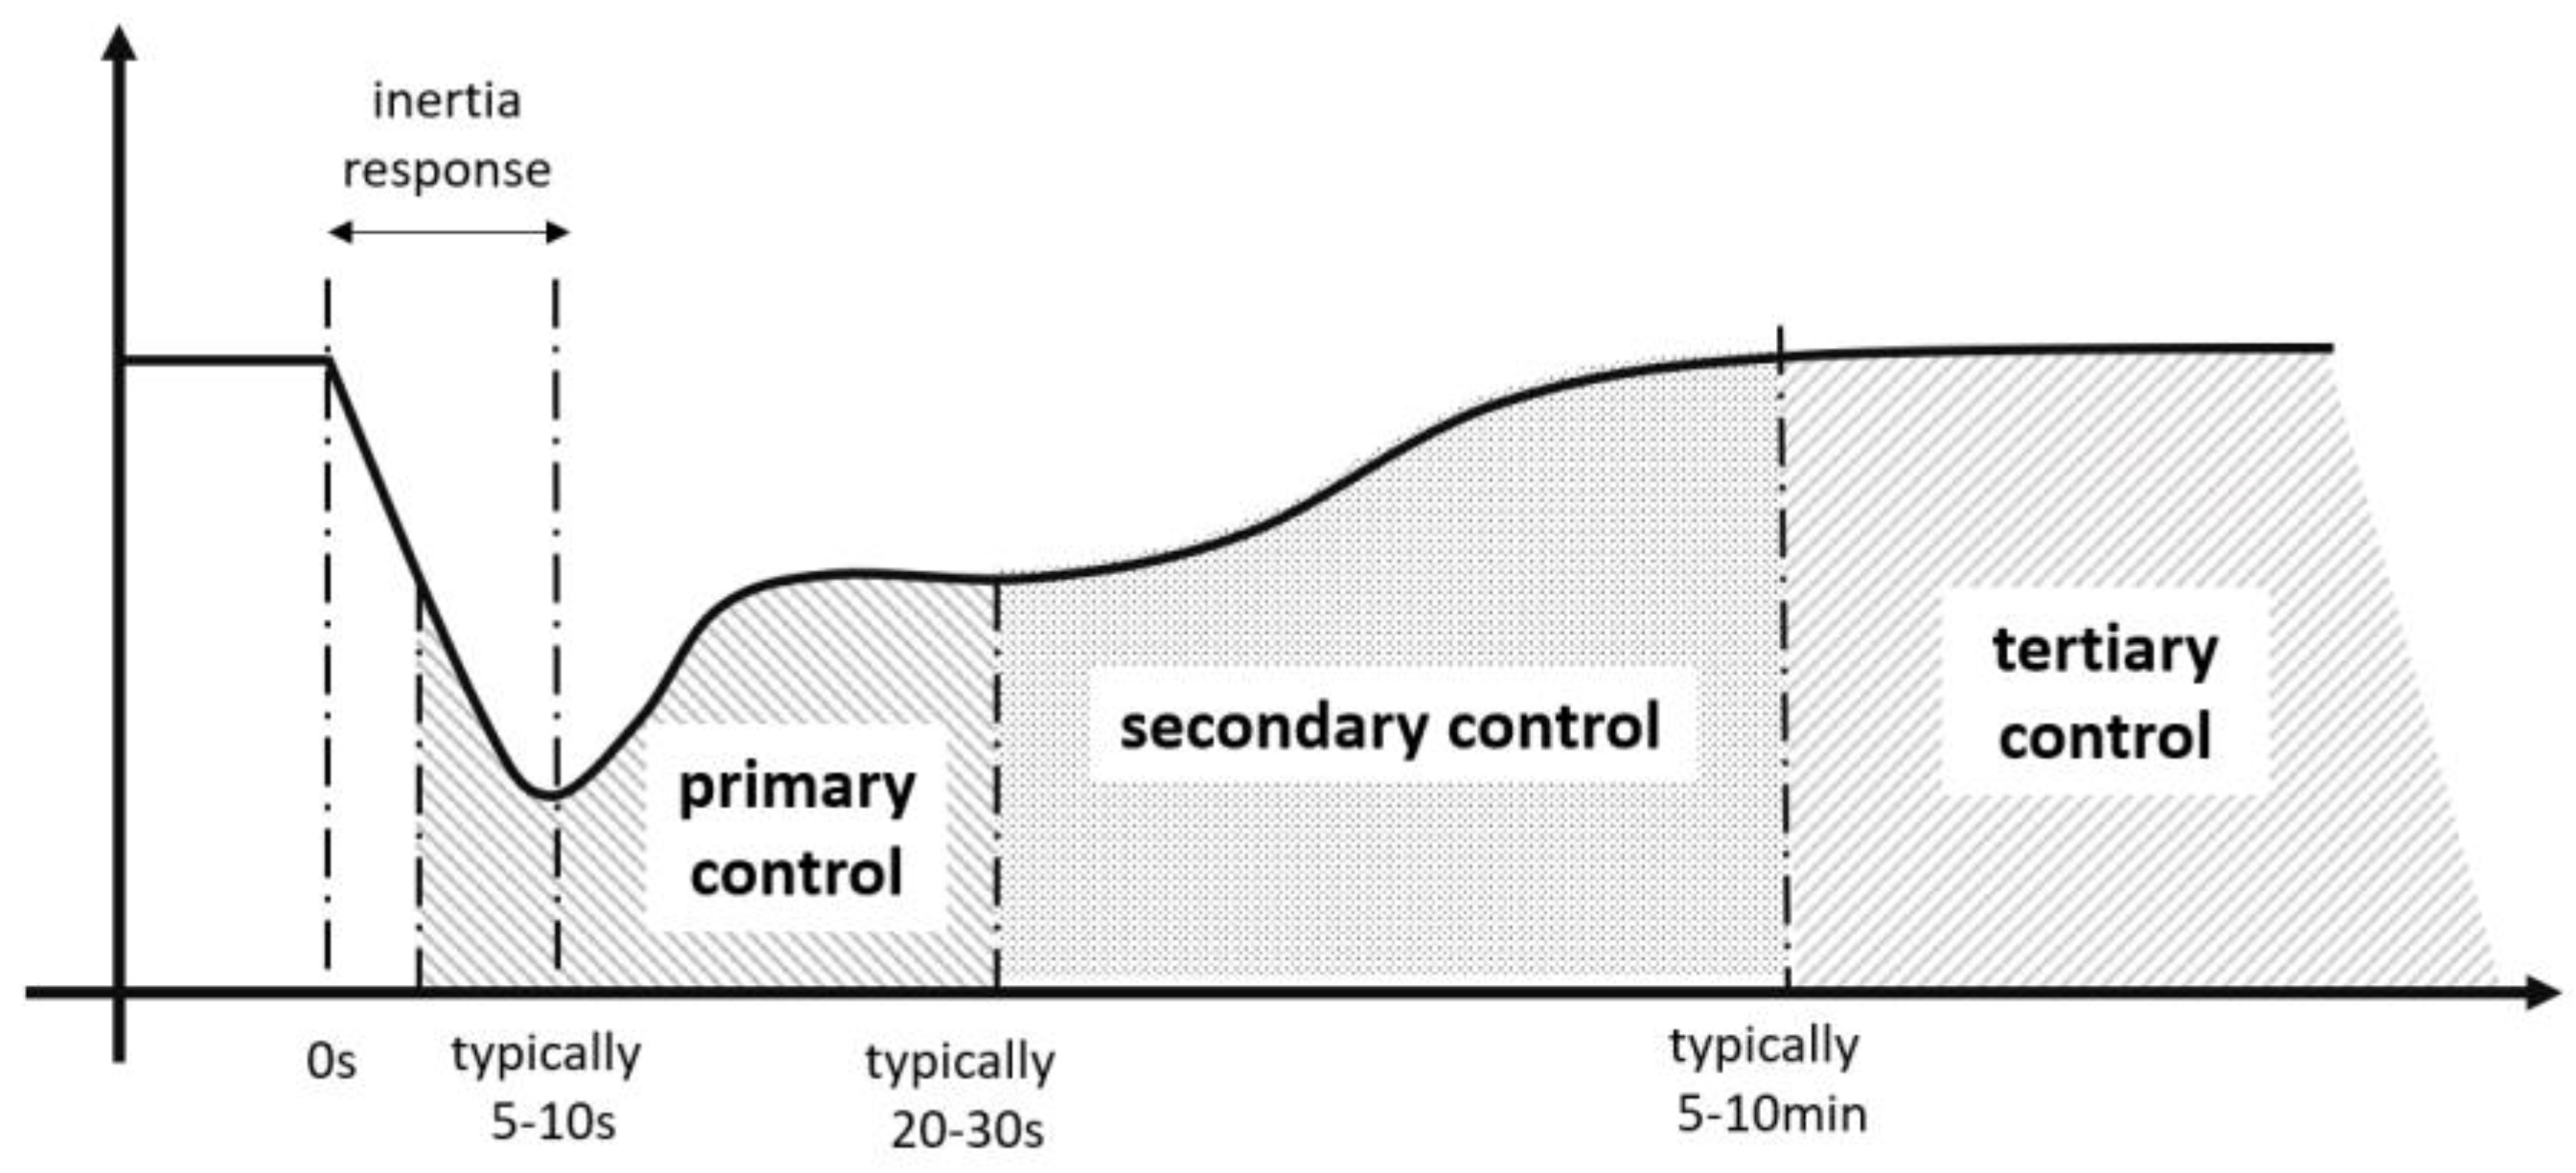
Figure 1 presents a typical frequency response of generation loss. Three main areas can be distinguished, namely inertia response, primary frequency control and secondary frequency control. Each area corresponds to different transient phenomena which require the provision of corresponding ancillary services.
Based on this categorization, conventional power plants (e.g., hydro, gas, coal) can offer the following frequency control ancillary services:
Inertia response [40]: Because of the synchronous coupling of the machines with the grid, their rotational speed (i.e., ωm) is aligned with the angular velocity of the electromagnetic field (i.e., ωe). When a disturbance occurs leading to an imbalance between the two opposing torques, their sum on the rotor is nonzero, resulting in acceleration or deceleration according to the electromechanical swing equation (Equation (1)):
J d ω m d t = T m T e = T a ,
where J represents the combined moment of inertia of the generator and the turbine (kg·m2), Tm and Te represent mechanical and electrical torque, respectively (N·m) and Ta represents acceleration/deceleration torque (N·m). From the above equation, it can be deduced that mitigating the effect of power imbalances in terms of the rate of change of frequency (RoCoF) can be realized by enhancing the system’s rotational inertia, utilizing fast reserves with RoCoF-based control.
RoCoF is a key variable in the inertia response, defined as the time derivative of the power system frequency (df/dt). This variable was considered of low importance for systems with a generation mix dominated by synchronous generators due to the high inertia presence, which inherently compensates load imbalances and checks RoCoF in these cases. Recently, RoCoF has become important during considerable load–generation imbalances (attributed to the disconnection of either large loads or generators or system splits), as higher RoCoF values may be detected. This is due to low system inertia in cases of high instantaneous penetration of inverter-based units that are not synchronously connected to generation facilities. High df/dt values may threaten reliable system operation because of mechanical limitations of individual synchronous machines (inherent capability), protection devices triggered by a particular RoCoF threshold value or timing issues related to load-shedding schemes [41].
Inverter-based generation lacking any control does not exhibit such inherent characteristics; consequently, high inverter penetration could result in higher df/dt values in a power system. The relationship between inverter penetration and RoCoF is, however, not straightforward and countermeasures, mostly in the form of control algorithms, need to be implemented carefully.
Primary control-droop control [42]: The coupling of active power to frequency forms the basis of frequency control where active power is adjusted according to linear characteristics, based on the following control equation (Equation (2)):
P = f 0 f r p + P 0 ,
where f is the system frequency, f0 the nominal frequency, rp the droop gain, P is the active power of the unit and P0 to the initial active power.
Secondary control: The secondary control is responsible for restoring the frequency value to nominal (i.e., 50 or 60 Hz). This operation is needed, as the new operating point gained by the primary control has a steady-state frequency error, which must be reset. This method of control is called secondary control and is achieved through an integrator.

2.2. BESS Primary Frequency Ancillary Services

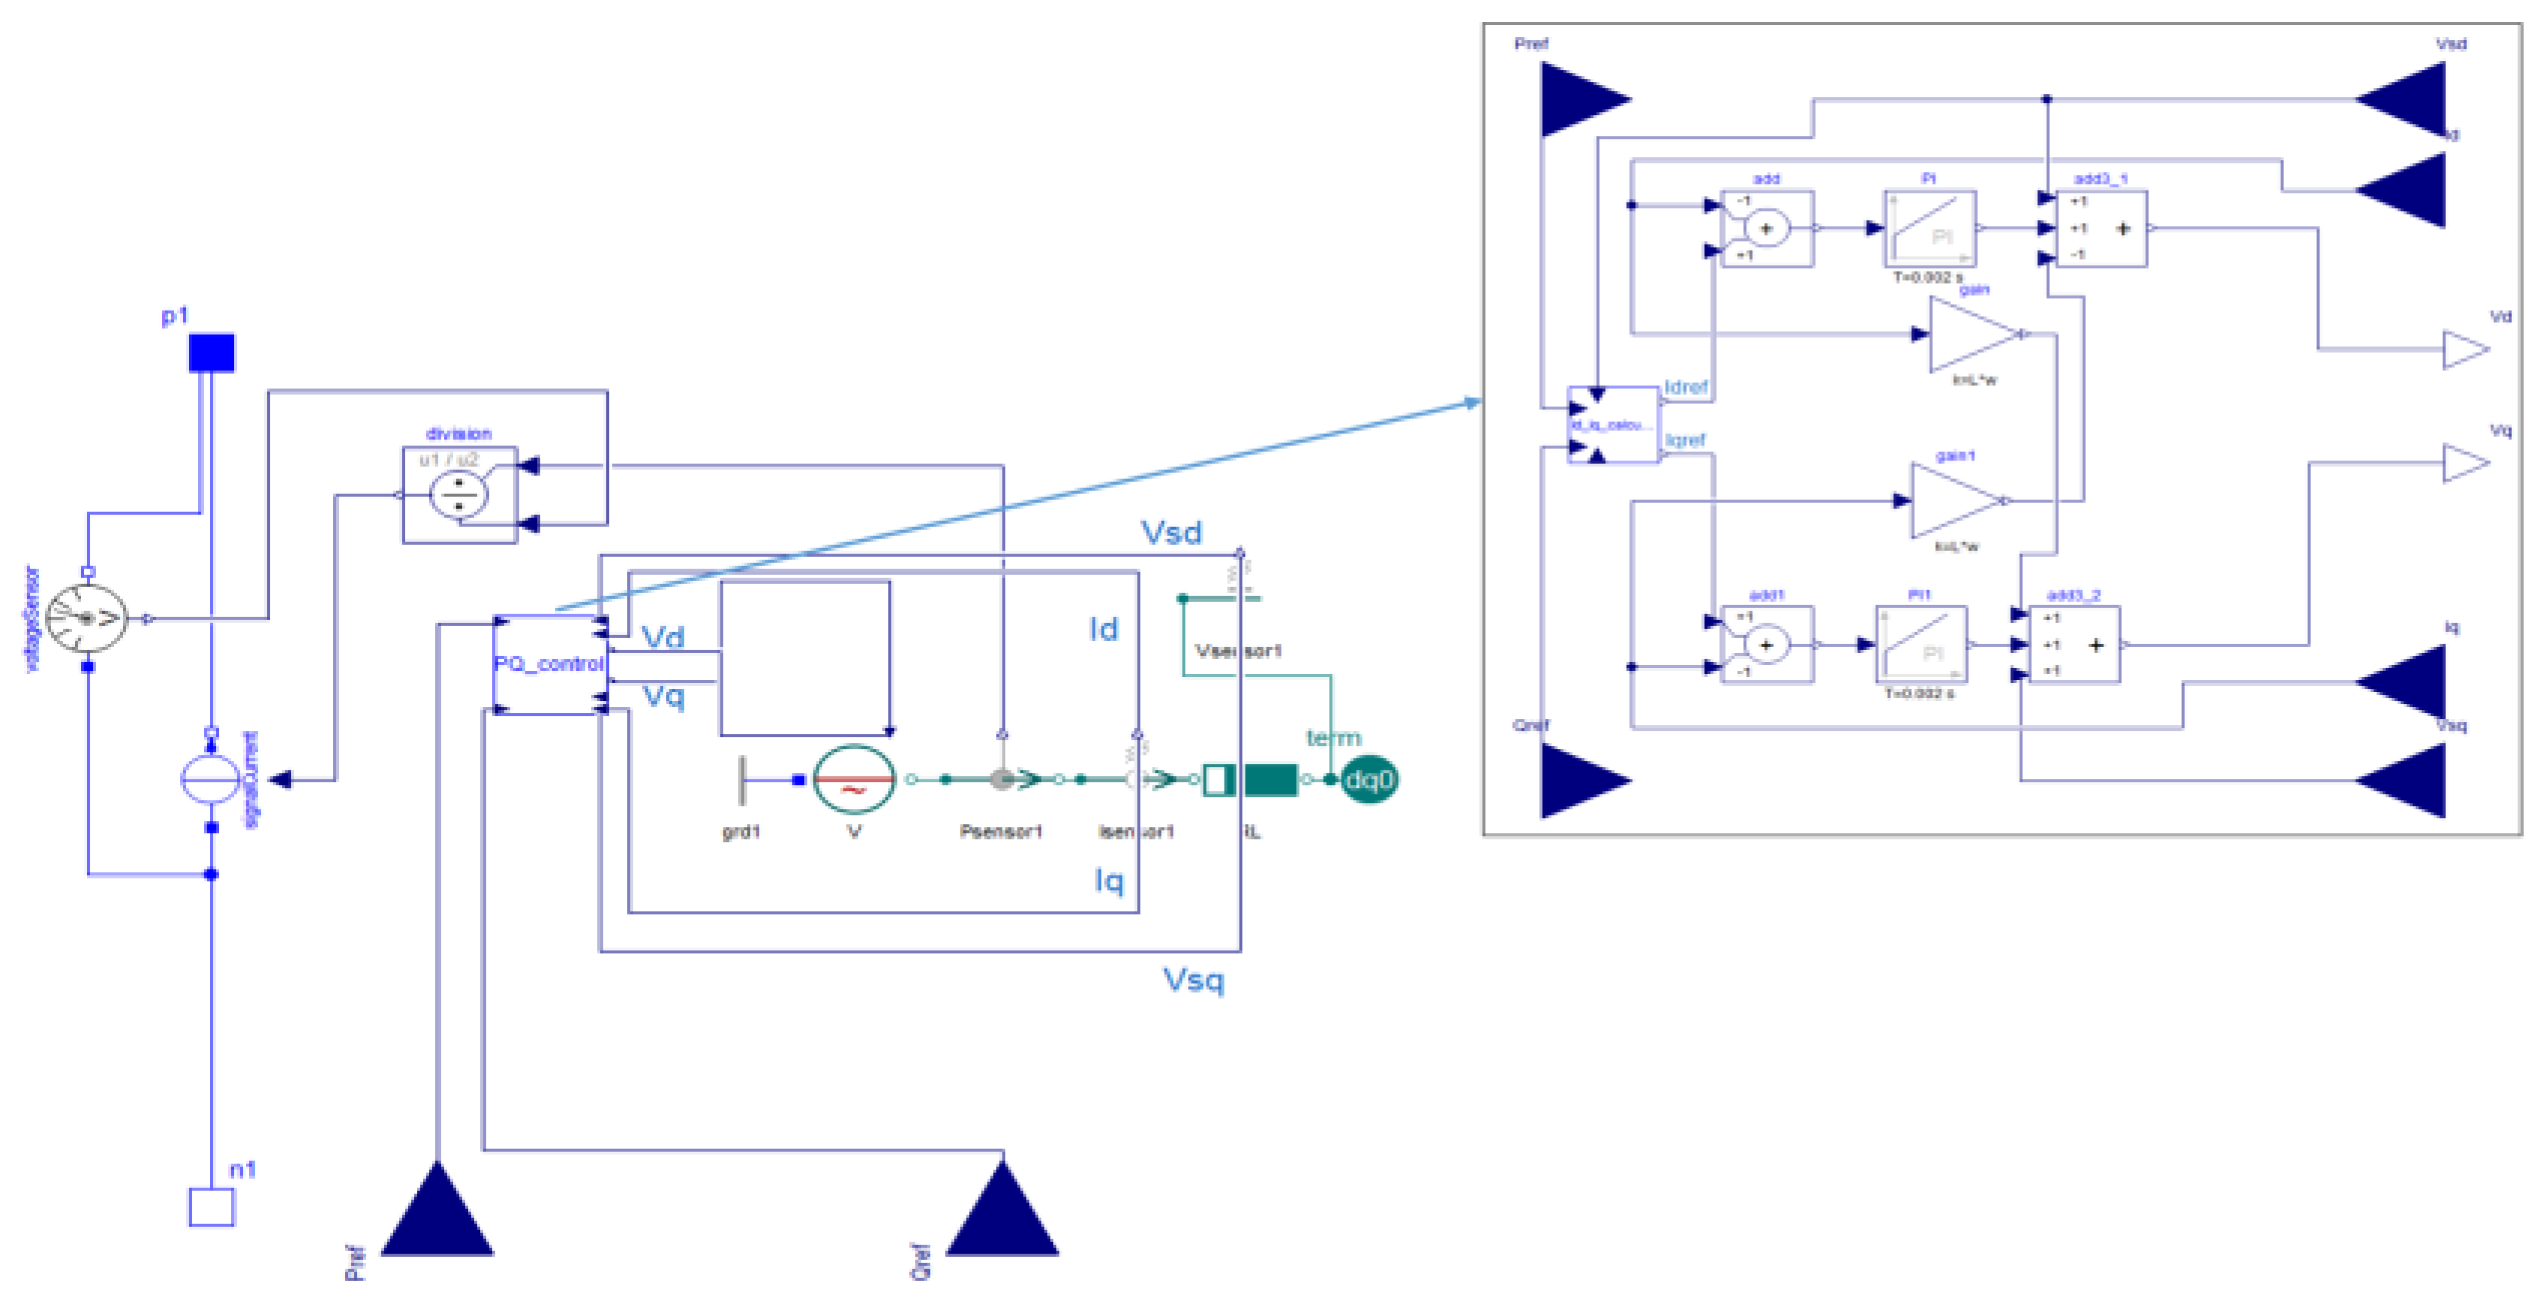
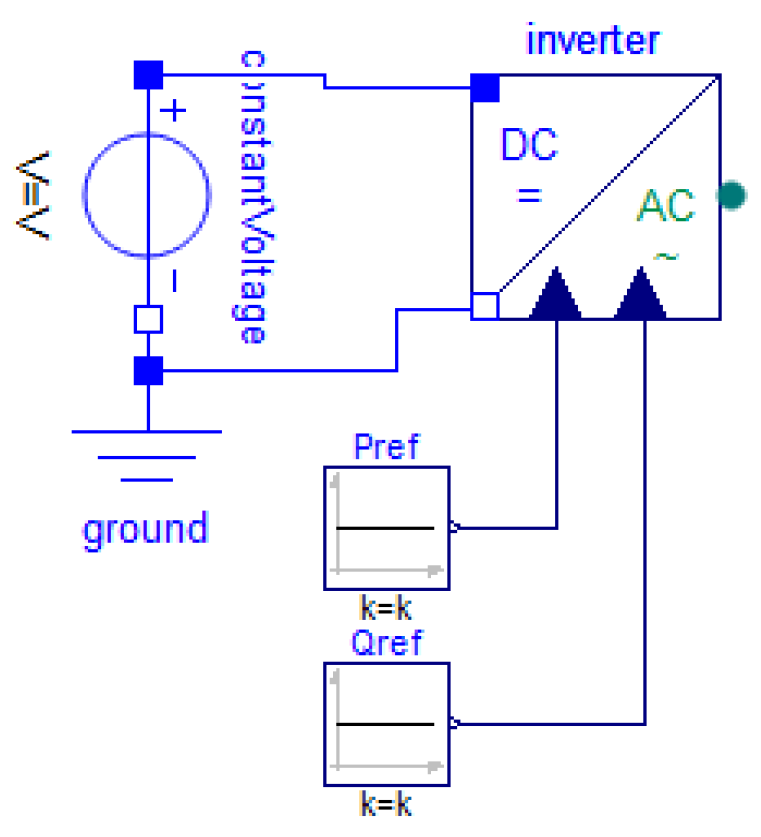
As already explained, the replacement of SGs with inverter-based RESs results in low inertia, as inverters provide small or zero inertia to the system due to their nonsynchronous connection to the grid and primary reserves reduction. The replacement of conventional units by inverter-based RES units reduces the number of units contributing to frequency support. To compensate for these effects, battery storage systems can assist primary frequency regulation with the appropriate control implementation in the inverter units. The general aim of the implemented inverter control through which the BESS interfaces with the grid is to modulate battery behavior to act as a synchronous generator in the event of a frequency change.
Since BESSs are capable of absorbing and delivering real power to the grid, they can offer ancillary services by properly controlling the inverter interfaced to the grid. This paper focuses only on inertial response and droop control, which are power-based services. The main challenge is to maintain a steady-state frequency in an acceptable value after disturbances.
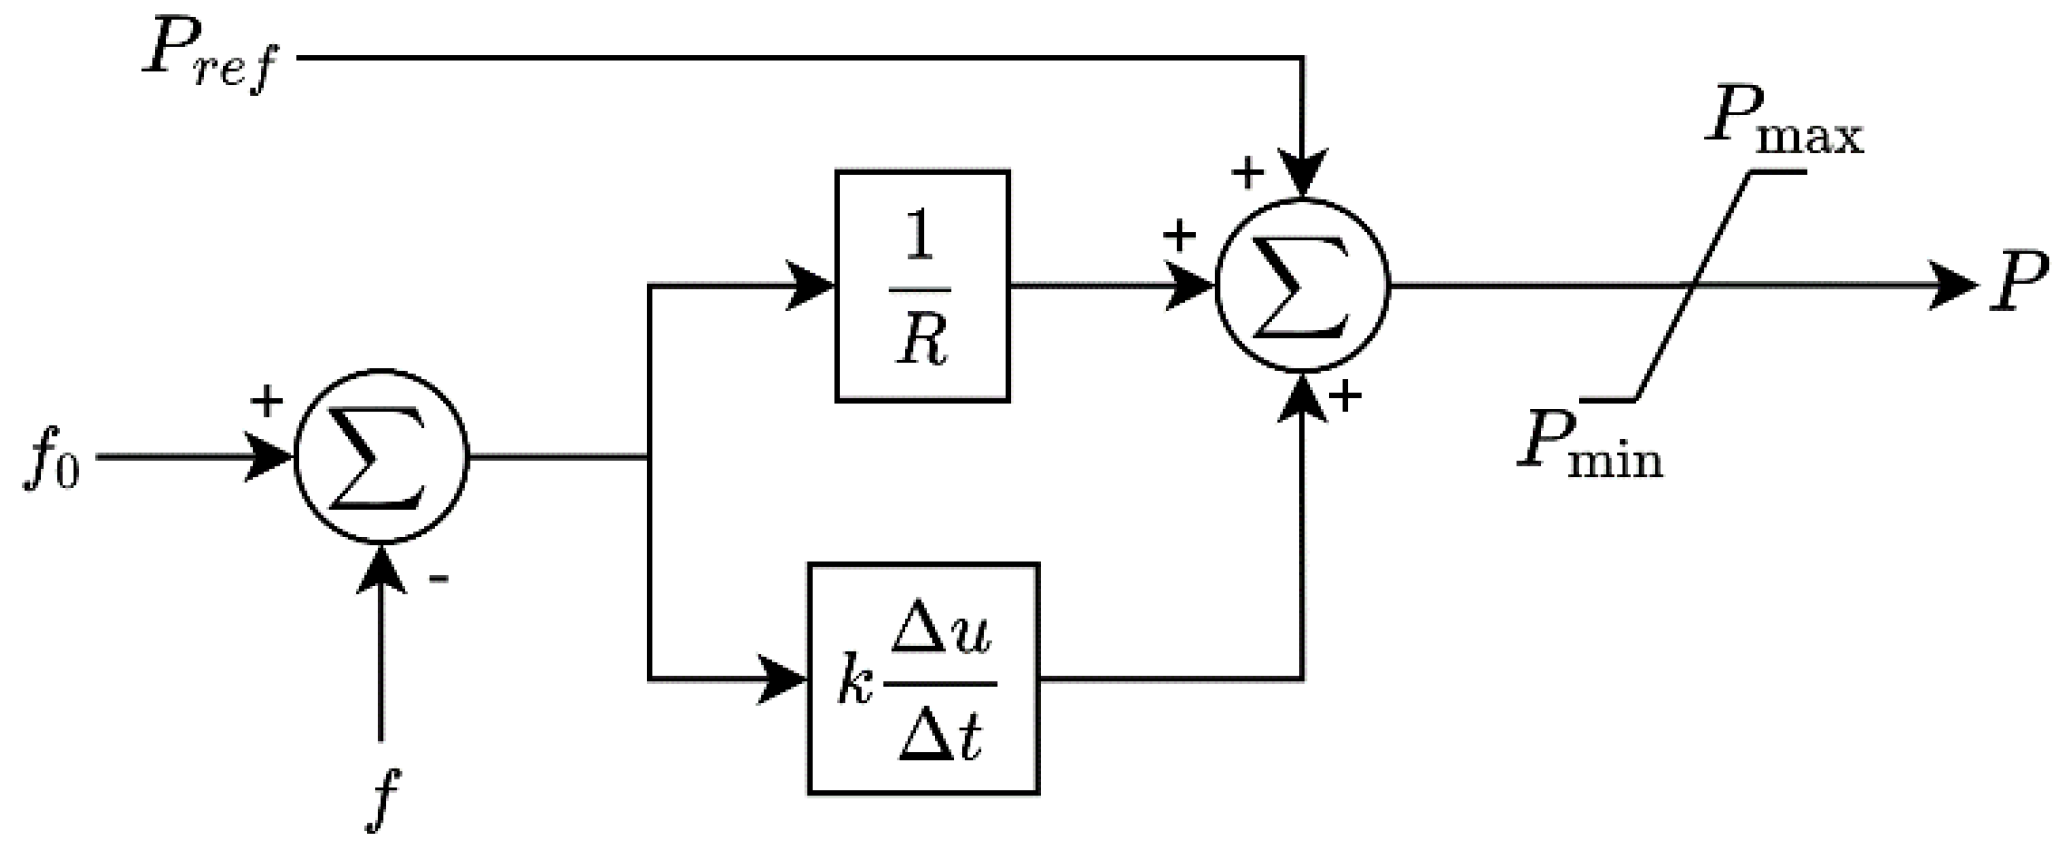
Figure 2 presents the schematic diagram for the BESS control that can provide the required services. Besides the setpoint for the active power (Pref), the control also receives a signal for the system frequency (f), which is compared with the nominal value (f0) to compute the error. The error signal is routed through proportional and derivative sides, implementing droop and synthetic inertia control, respectively. For parameters, it receives two gains: one for the droop control (R) and one for the inertia response (k) [43], as well as the limits for the rated power exchange (Pmax and Pmin).

3. Methodology

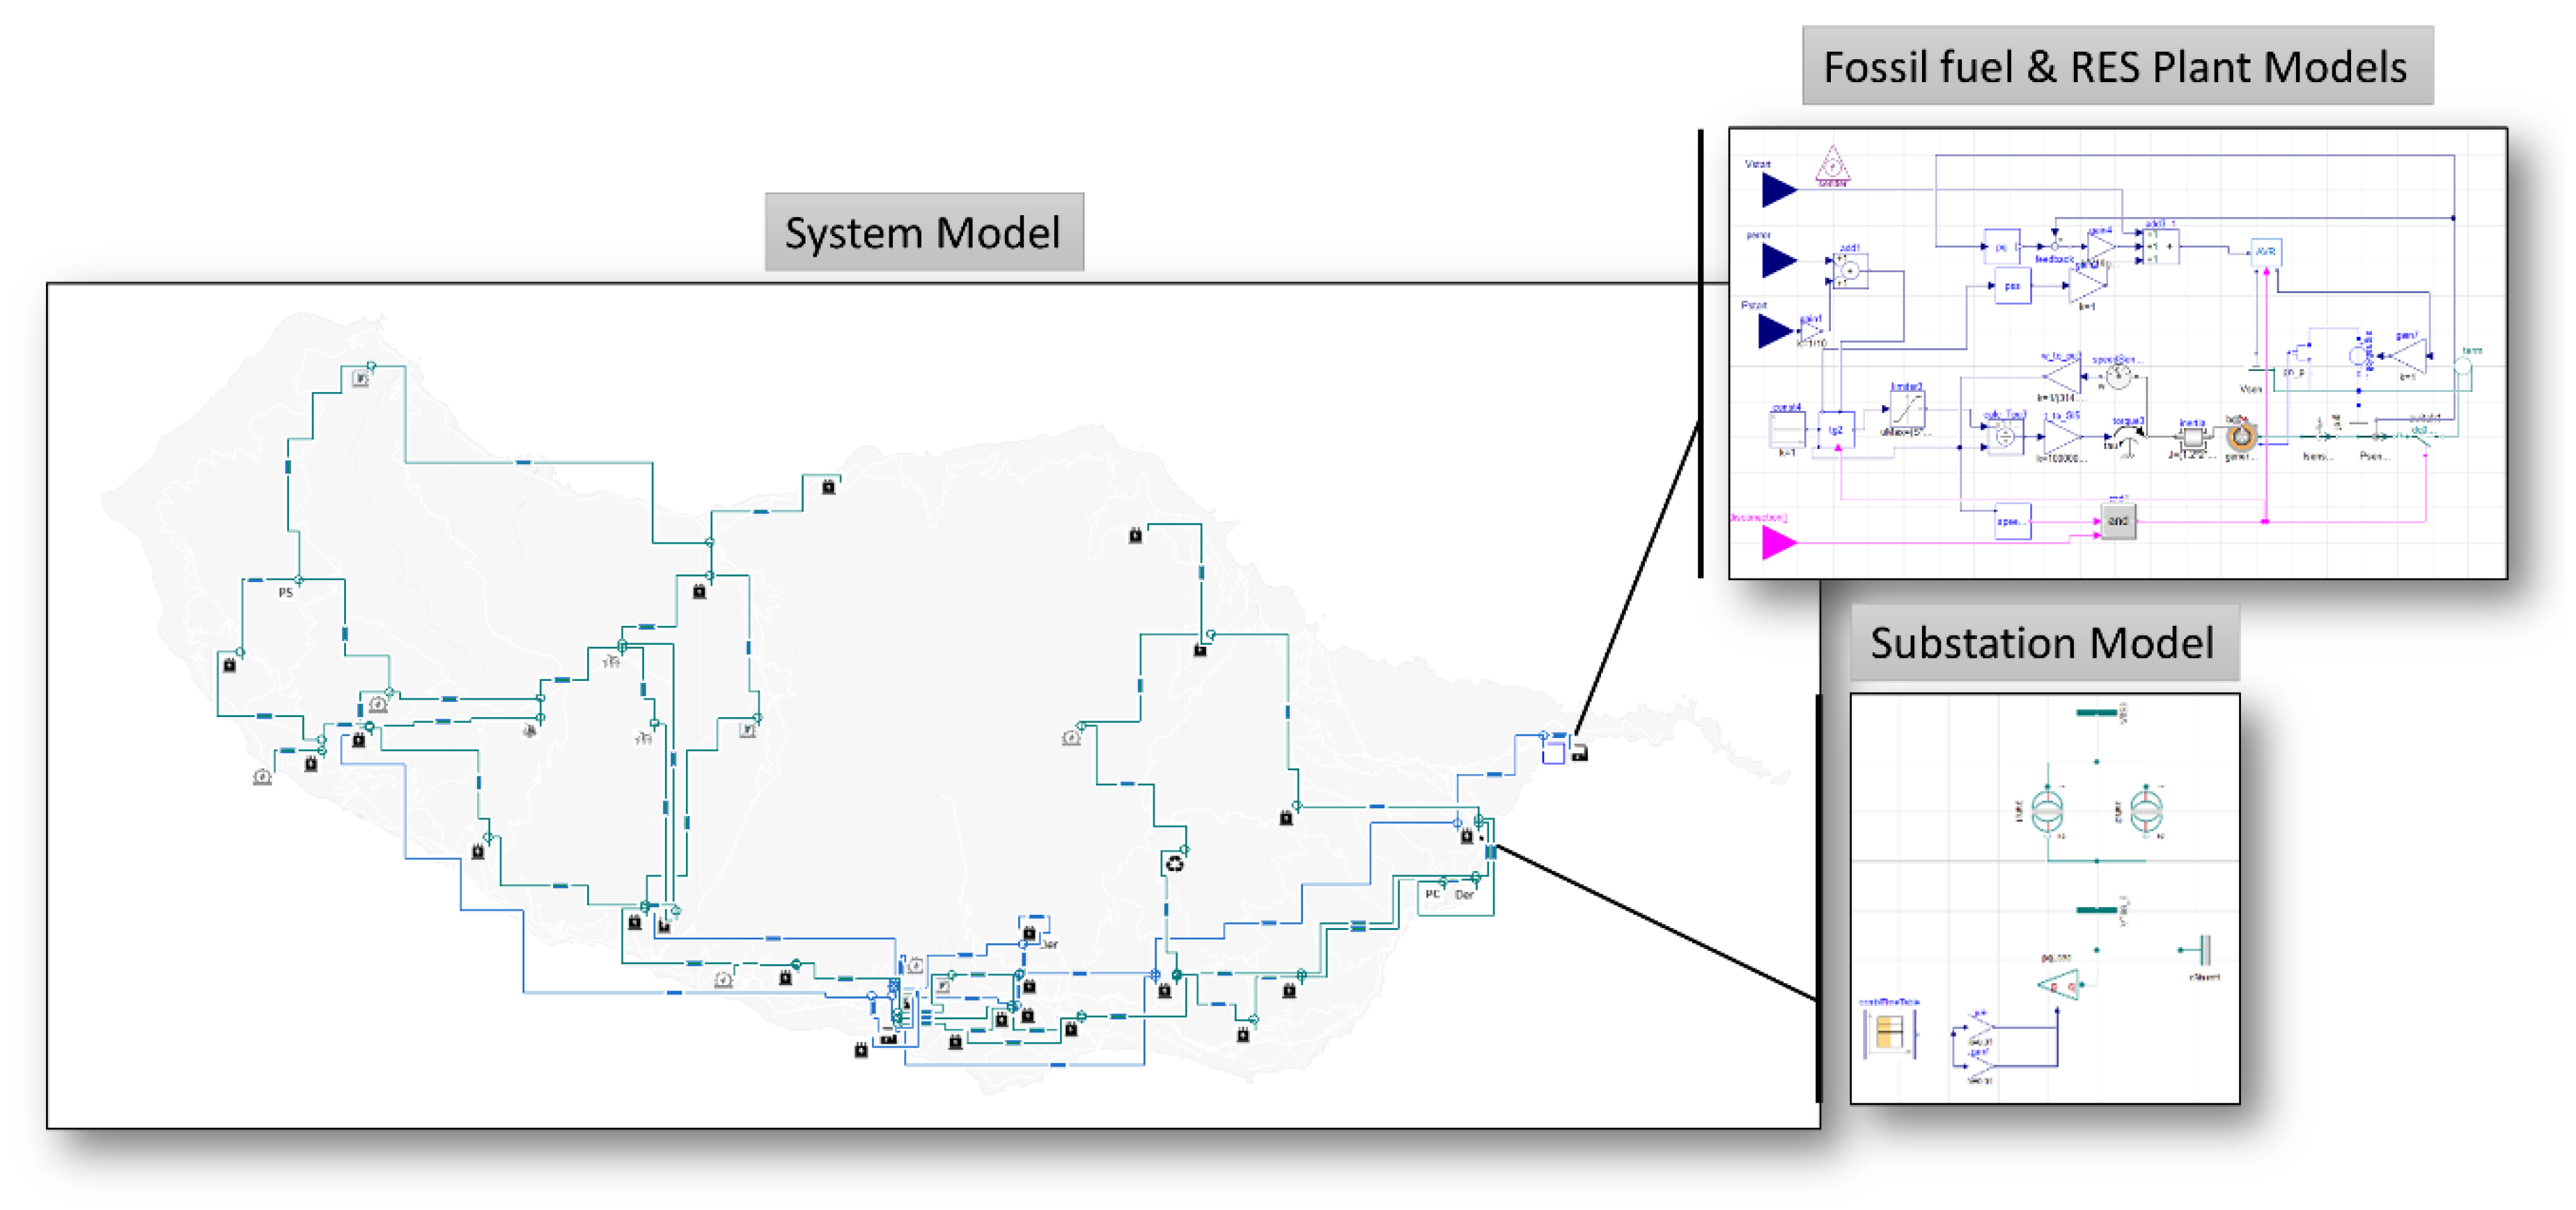
A custom methodology was utilized to evaluate the impact of increasing RES penetration in the Madeira island system. The approach is schematically depicted in Figure 3 and includes the following steps.
Initially, two scenarios are defined based on the current state of the power system (“reference scenario”) and the planned future case of the system (“future scenario”), the latter including the additional variable RES capacities. The two scenarios were modeled in Matpower [44] and simulations were carried out utilizing the optimal power flow (OPF) engine. Through power flow analysis over a one-year period, the resulting dispatches are analyzed. For each one, extreme cases (best and worst) are identified with respect to the online instantaneous rotational inertia and available primary reserve. The rationale behind this calculation is to identify the time at which maximum RES penetration (low demand and high RES production) is observed. When the grid’s stability is maintained in the worst case, the robustness of the grid in the examined scenario is verified.
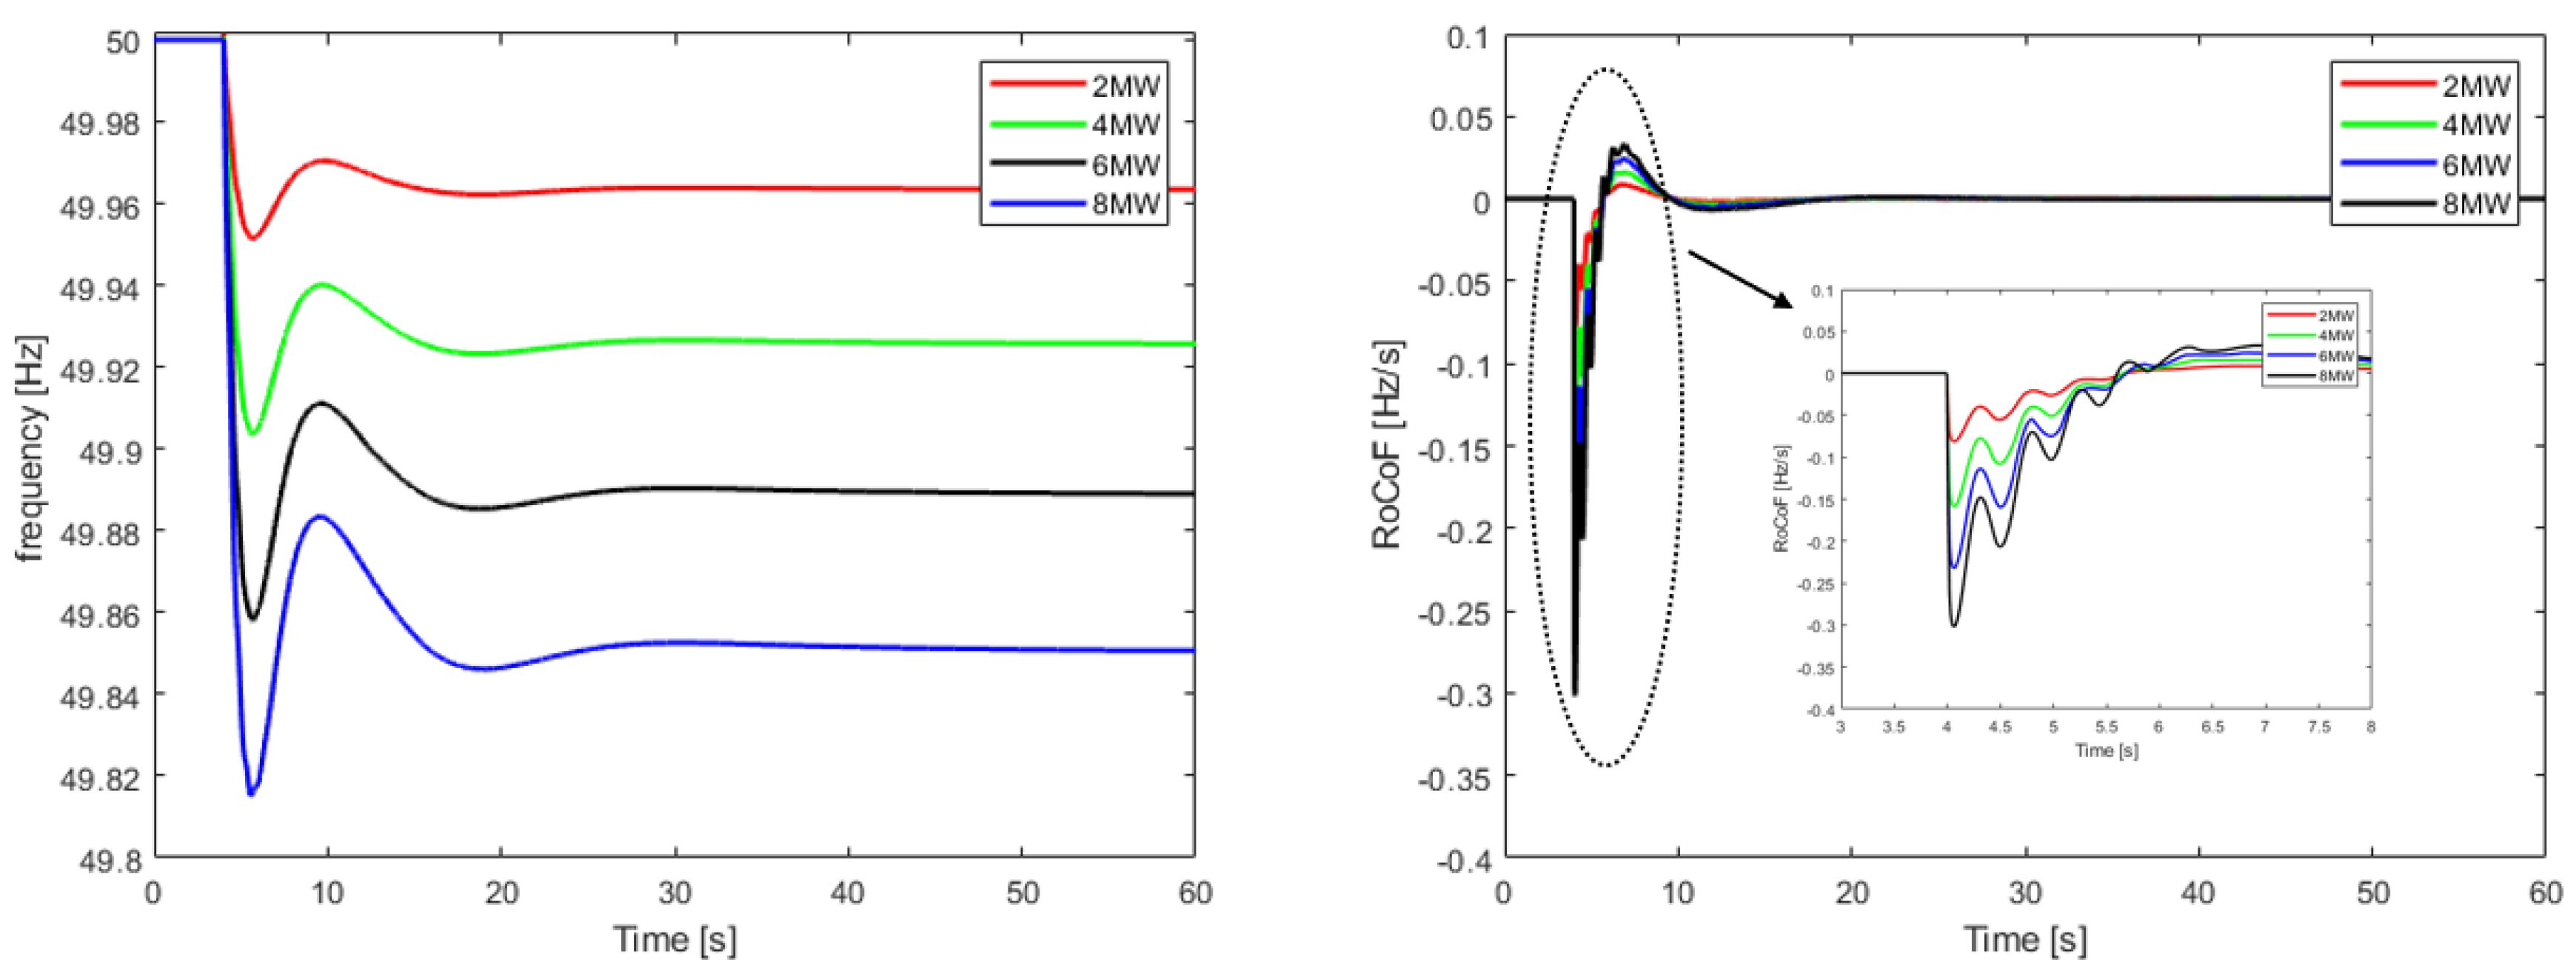
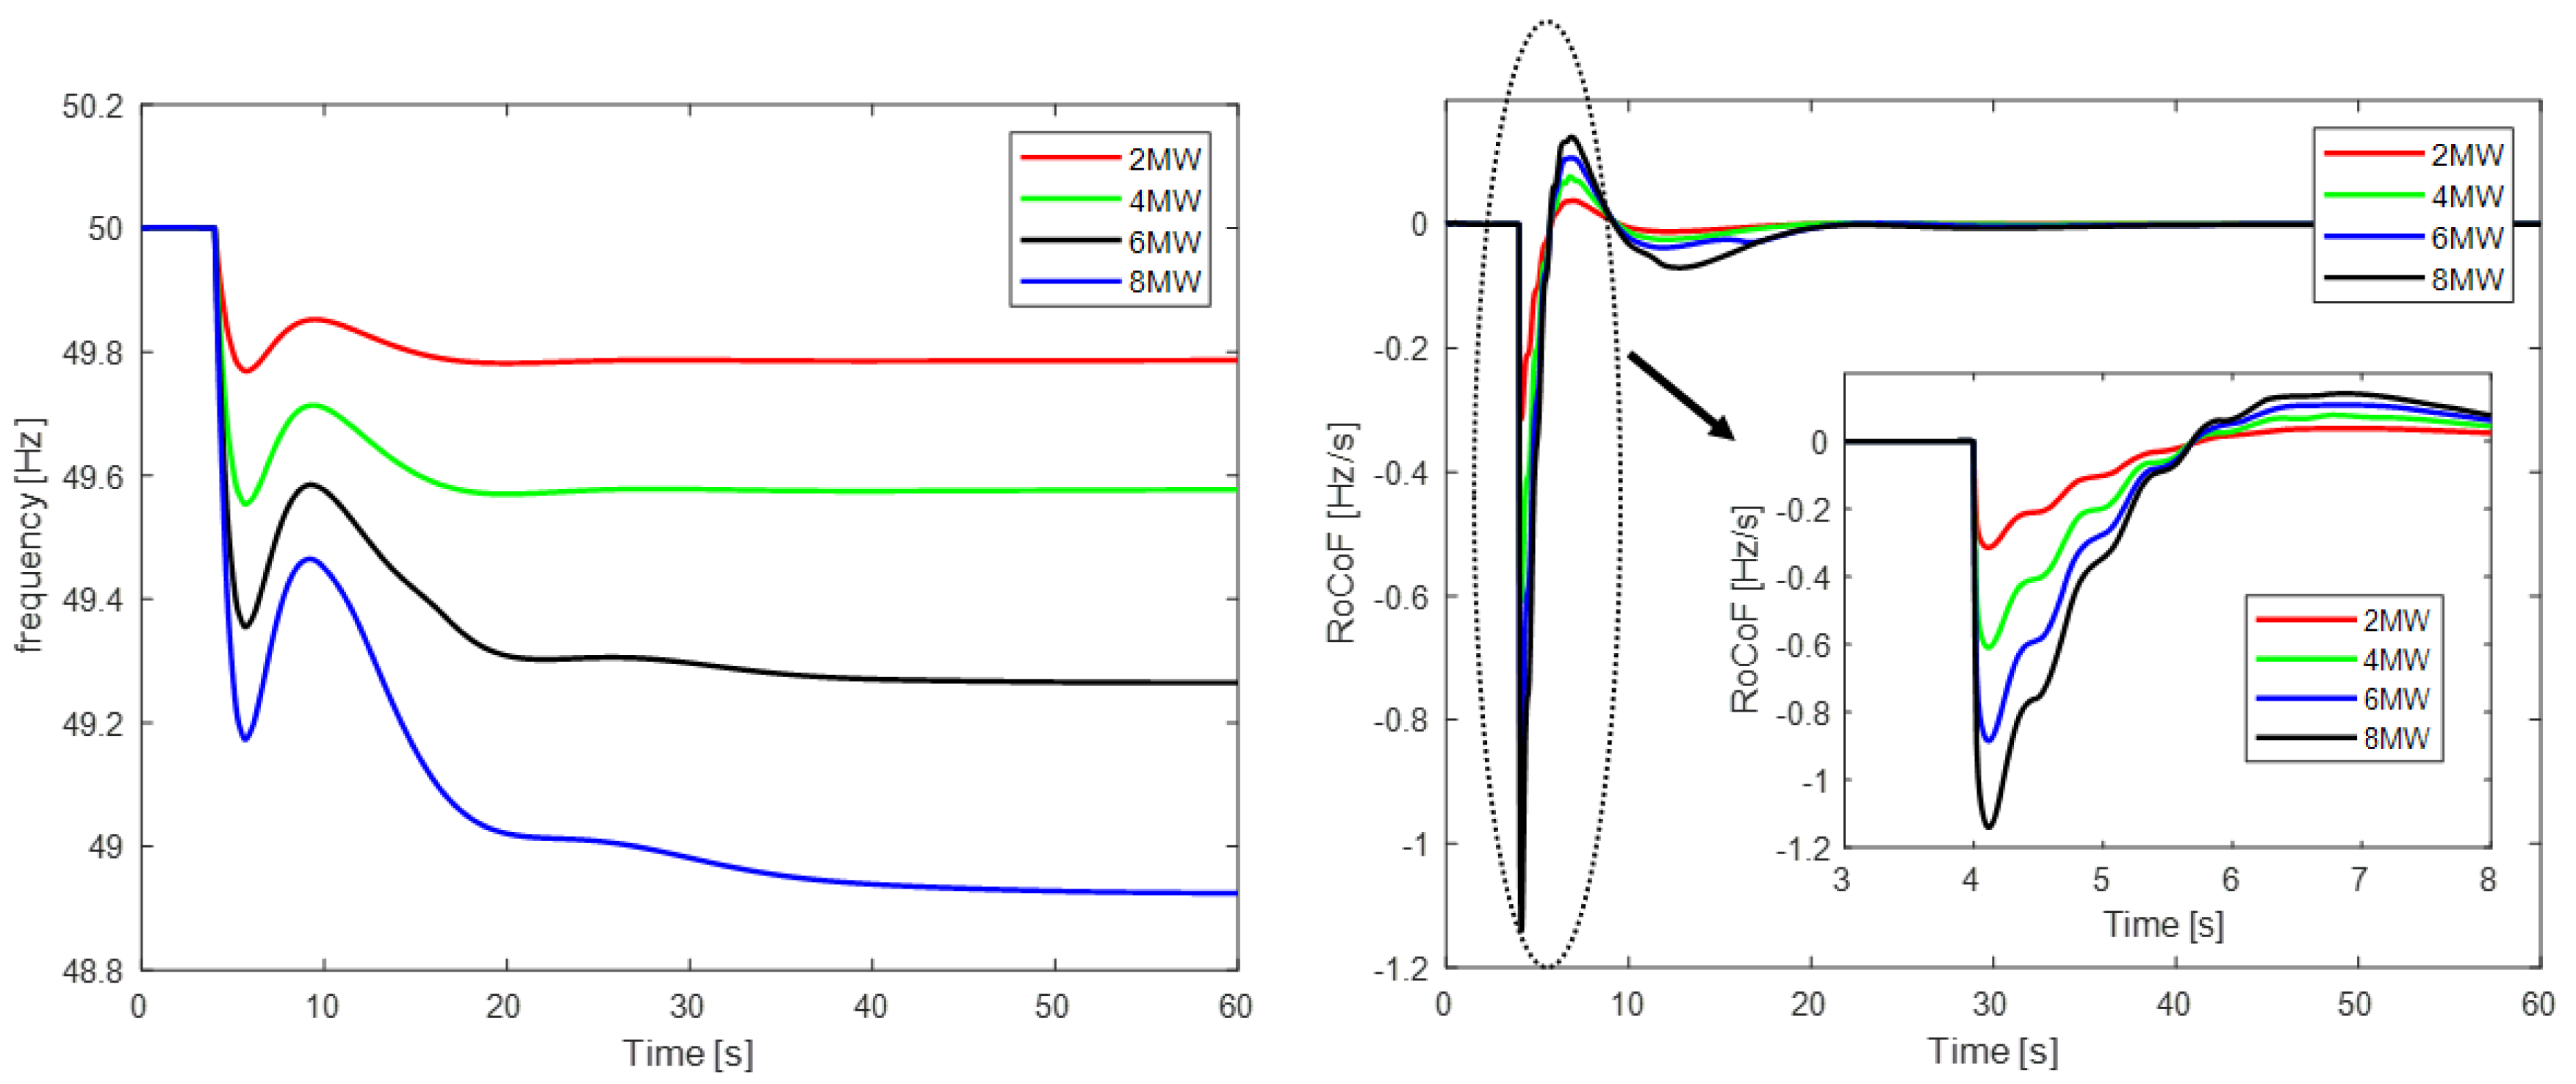
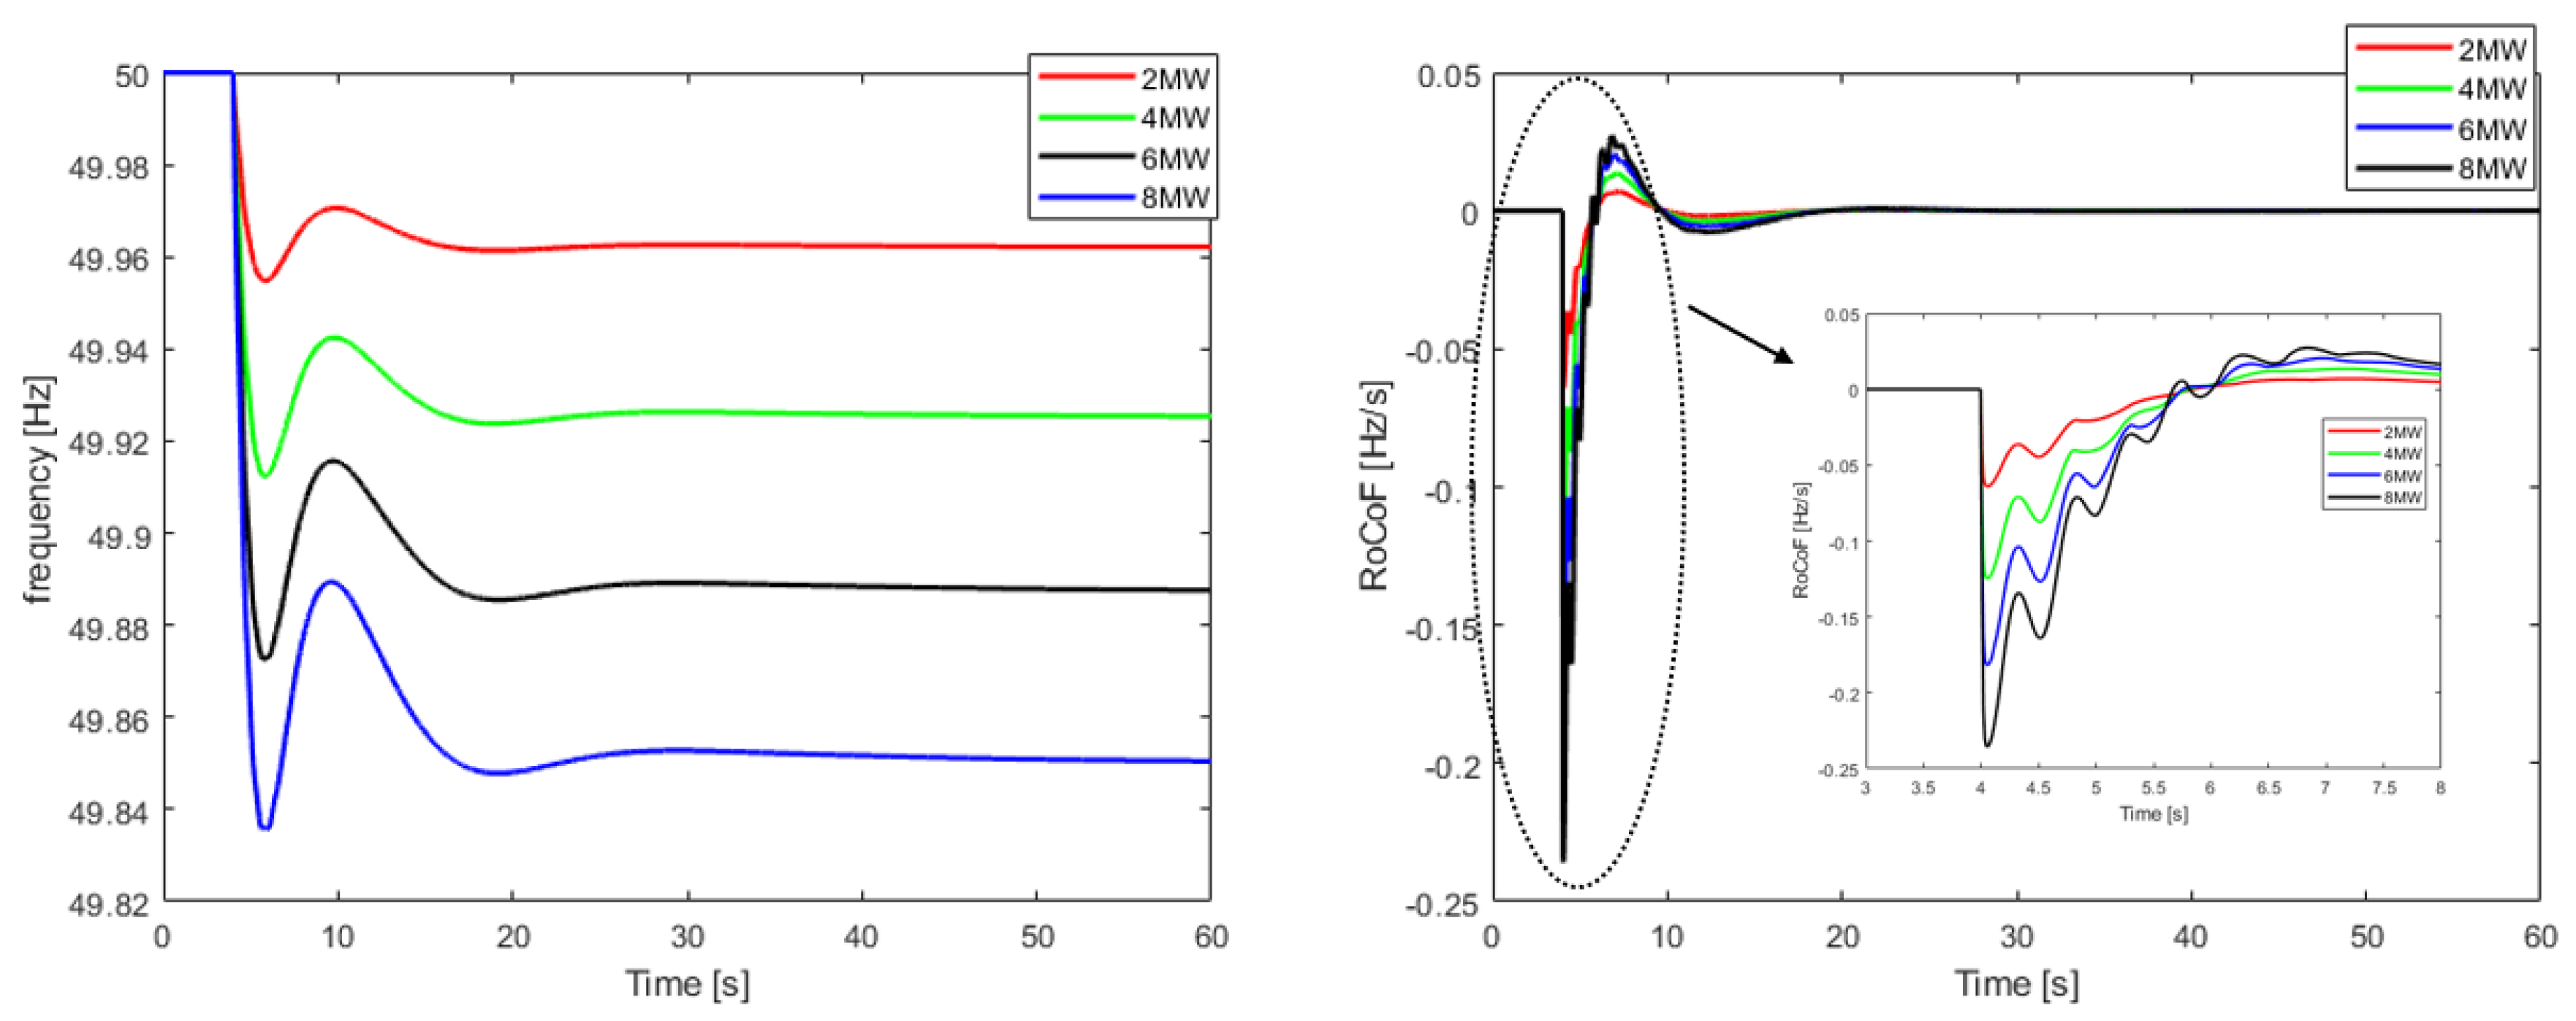
The next step includes transient grid modeling in Modelica and simulation conduction for each case and the three disturbances examined, namely “load sudden change (2–8 MWe with a step of 2 MWe),” “short-circuit (SC)” of a transmission line 60 kV with the requirement of a 100 ms clearance time and “loss of the island’s second-largest production unit online.” After the evaluation and comparison of the results, a third scenario is considered, which corresponds to the future scenario with the additional integration of a BESS to mitigate the frequency stability issues that are revealed in the high-RES case. Lastly, the results are thoroughly assessed and taken into account in the decision-making process in the context of the long-term planning of the island’s power system.
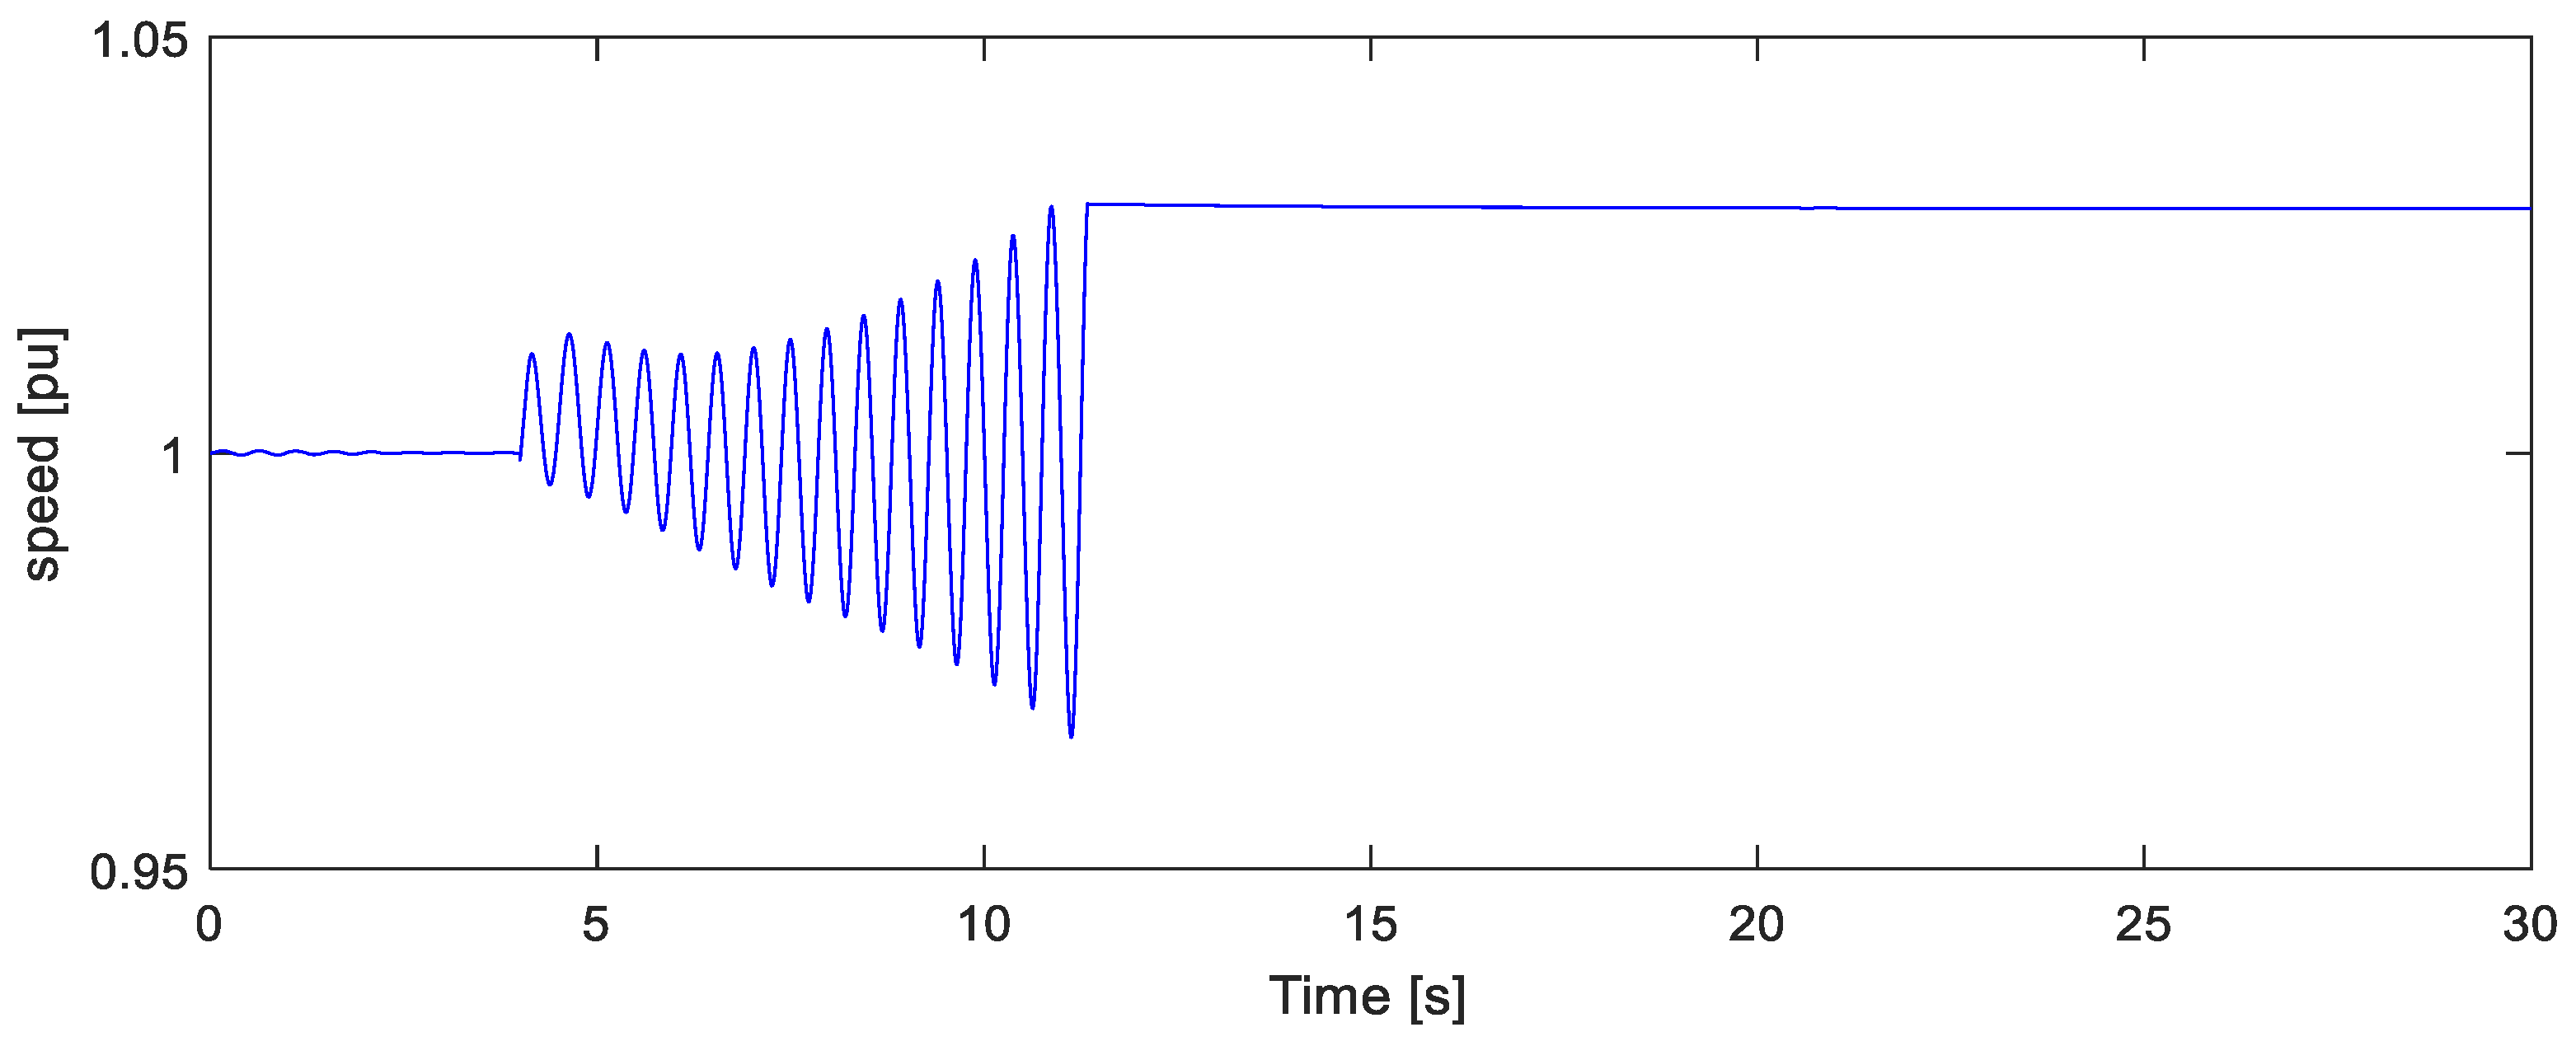
At this point, it is worth noting that the simulated model does not contain any underfrequency shedding relays, which may activate during severe transients. However, a relay is included on every SG, which activates when the generator speed is higher than 1.03 pu or lower than 0.92 pu (overfrequency/underfrequency relay).
A critical security constraint for the Madeira system is the need to avoid automatic underfrequency load-shedding situations [45]. Specifically, it is assumed that load-shedding occurs if the RoCoF is lower than −1.5 Hz/s and the absolute frequency value is lower than 49 Hz [46].

4. System Description and Scenarios Definition

The present section aims to introduce the investigated power system to the reader by gathering its main operational components for production and consumption, as well as some passive elements, while avoiding a lengthy detailed description of each asset, for which the reader can refer to [47].
Madeira’s power system has a yearly load peak of approximately 134 MWe. Its generation fleet is composed of two thermal plants, nine hydro plants, one pump-hydro plant, one solid-waste plant and a number of wind turbines (WTs) and photovoltaic (PV) parks, as well as some distributed PV generation rooftop-mounted systems [48]. Table 1 summarizes the installed power for all generation units per type, along with the number of generating units for conventional power plants.
Regarding the passive grid components that are incorporated in the developed model, the following aspects are considered:
  • A set of 11 busses at the 60 kV level, 35 at the 30 kV level and 27 at the 6.6 kV level (73 in total).
  • A set of 57 transmission lines (or cables) with their appropriate parameters, 13 at the 60 kV and 44 at the 30 kV level (114 in total).
  • Forty-six transformers: 6: 60 kV/30 kV, 6: 60 kV/6.6 kV, 21: 30 kV/6.6 kV, 4: 6.6 kV/60 kV and 9: 6.6 kV/30 kV.
The future scenario has been elaborated in communication with the Madeira’s system operator, Eletricidade da Madeira, S.A. (EEM), and incorporates specific actions towards the energy transition of the island. An existing power plant will be entirely renovated in this framework, and an additional pumped-hydro plant will be constructed. Furthermore, the installed vRES power will be increased. The existing wind farm capacities will be extended, new solar plants will be created and the energy production from solar PV microproducers will be increased. Additionally, a BESS is planned to be installed in the central substation (60 kV), mainly providing ancillary services (primary, secondary frequency control and synthetic inertia response). Dedicated studies regarding the sizing of the BESS in Madeira have been performed [34,35,36] and their results were adopted in the context of the present study, considering a BESS of 10 MWhe and 15 MWe. In this study, the future scenario is investigated considering the inclusion and nonuse of the BESS, aiming to examine the battery’s impact on the grid. Although the battery’s location has been indicated by EMM, this option was further examined with the conduction of several simulations with the BESS installed in different busses. The simulations proved that the location of the BESS was irrelevant to its performance during disturbances. Table 2 gathers the new total installed capacities per technology.

5. Case Definition

Following the definition of reference and future scenarios, this section elaborates on the identification of the examined cases. As mentioned in Section 3, yearly OPF simulations were conducted for both scenarios to reveal the best and worst cases in terms of online instantaneous rotational inertia and available primary reserve. The only difference regarding the optimal dispatch formulation between the two scenarios is that, in the reference case, there is a requirement of 30 MWe minimum thermal production to ensure the system’s stability, which translates into a considerable RES curtailment mainly during the night hours. This restriction is not present in the future scenario, as the BESS is responsible for securing the power system operation.
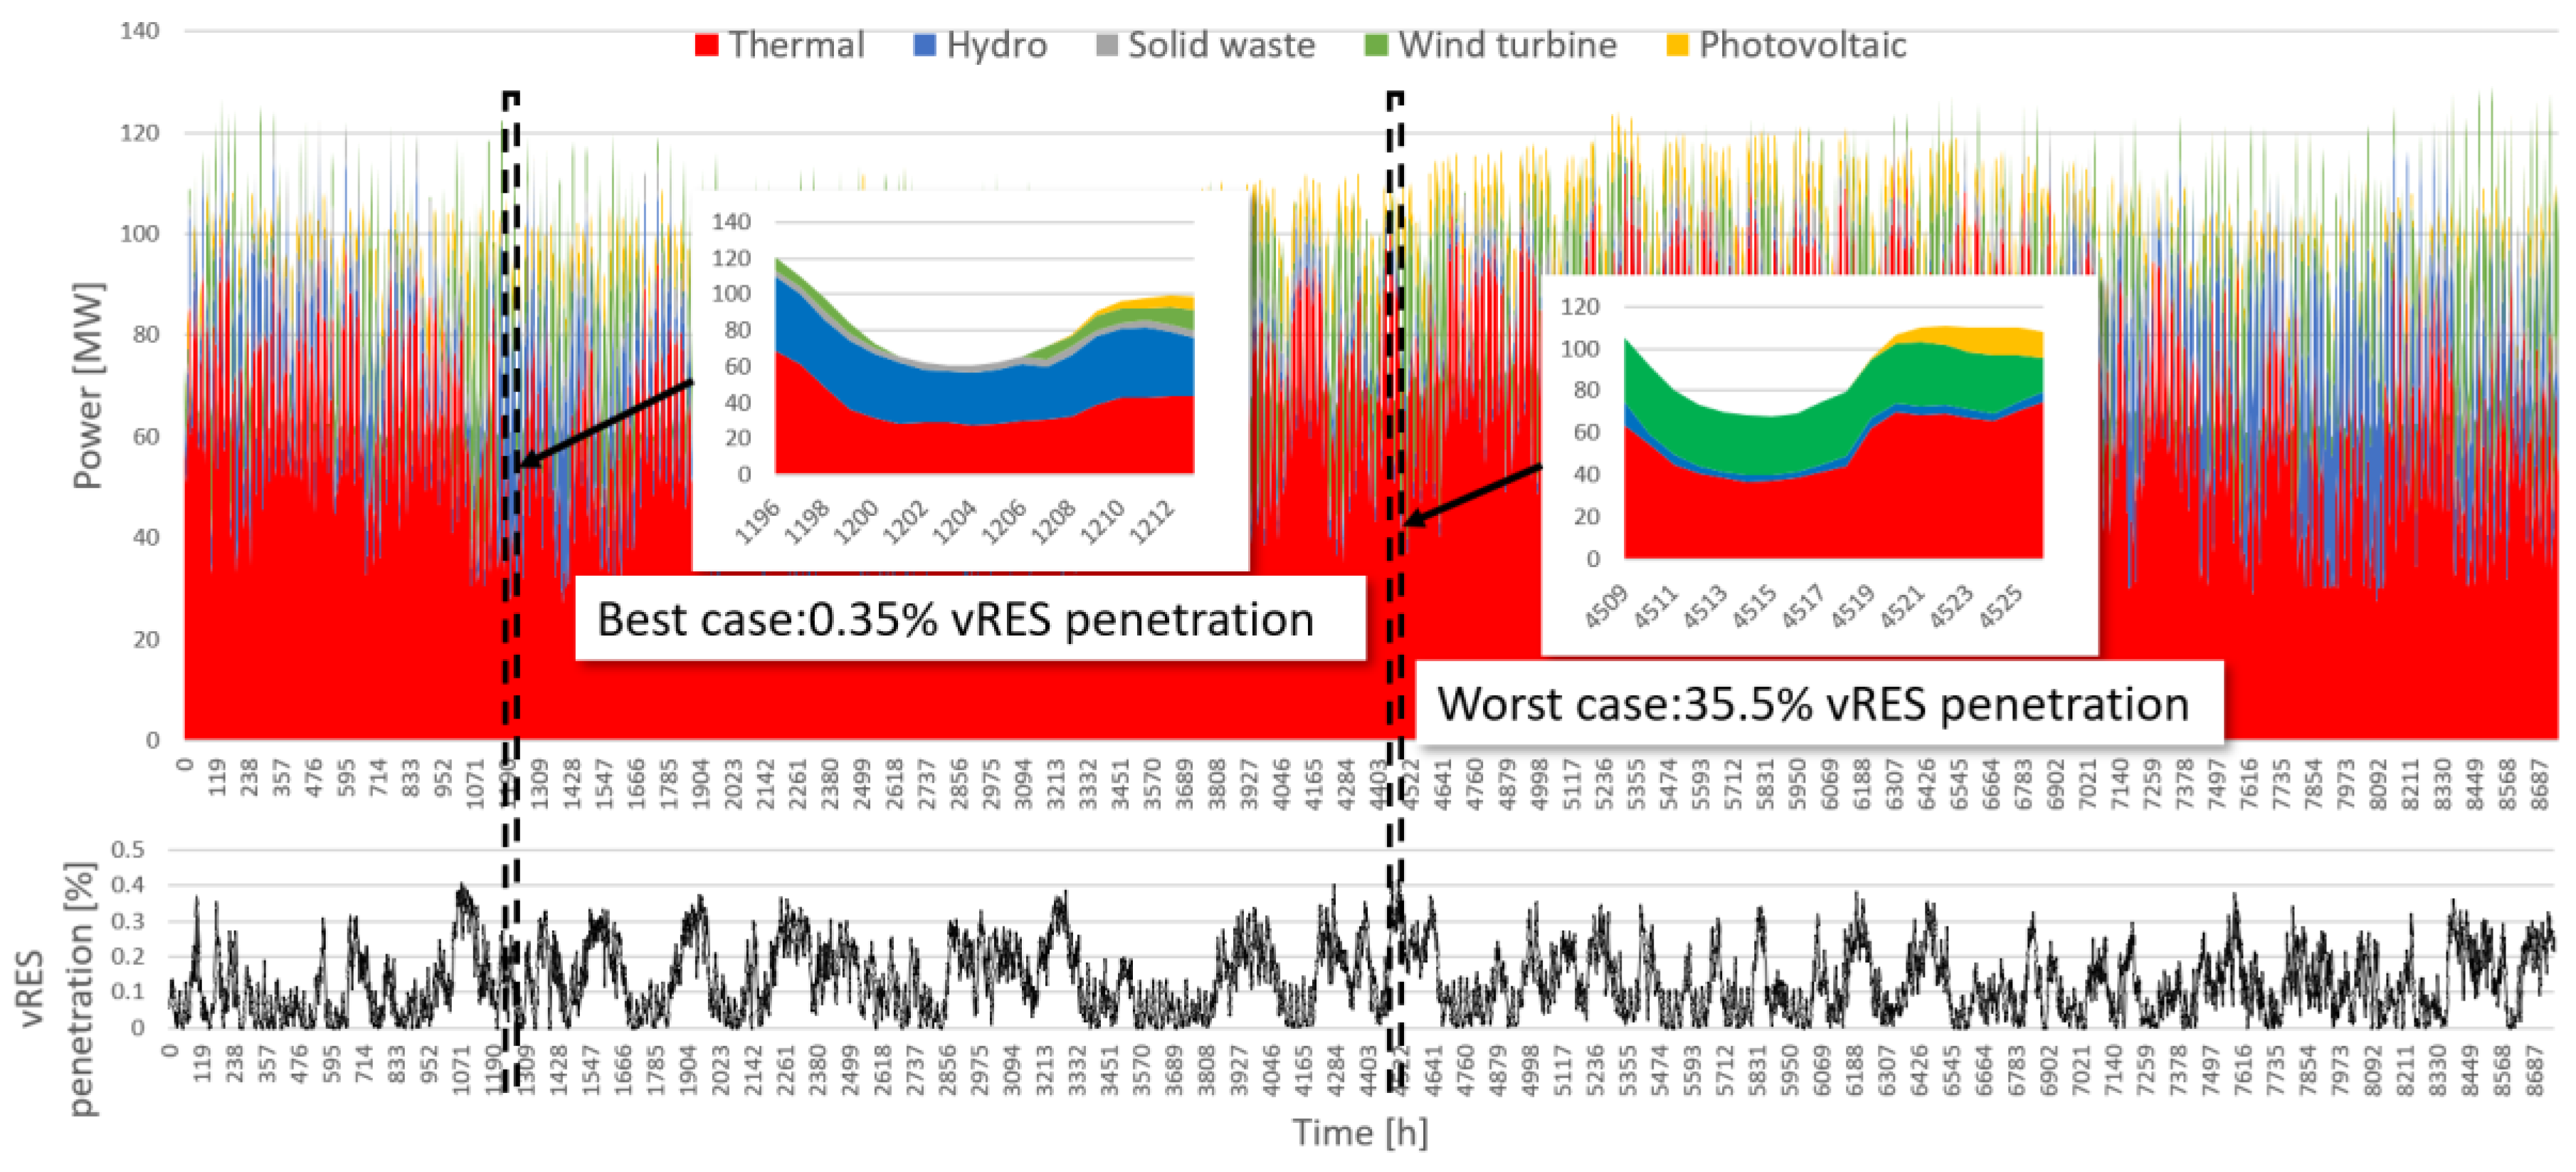
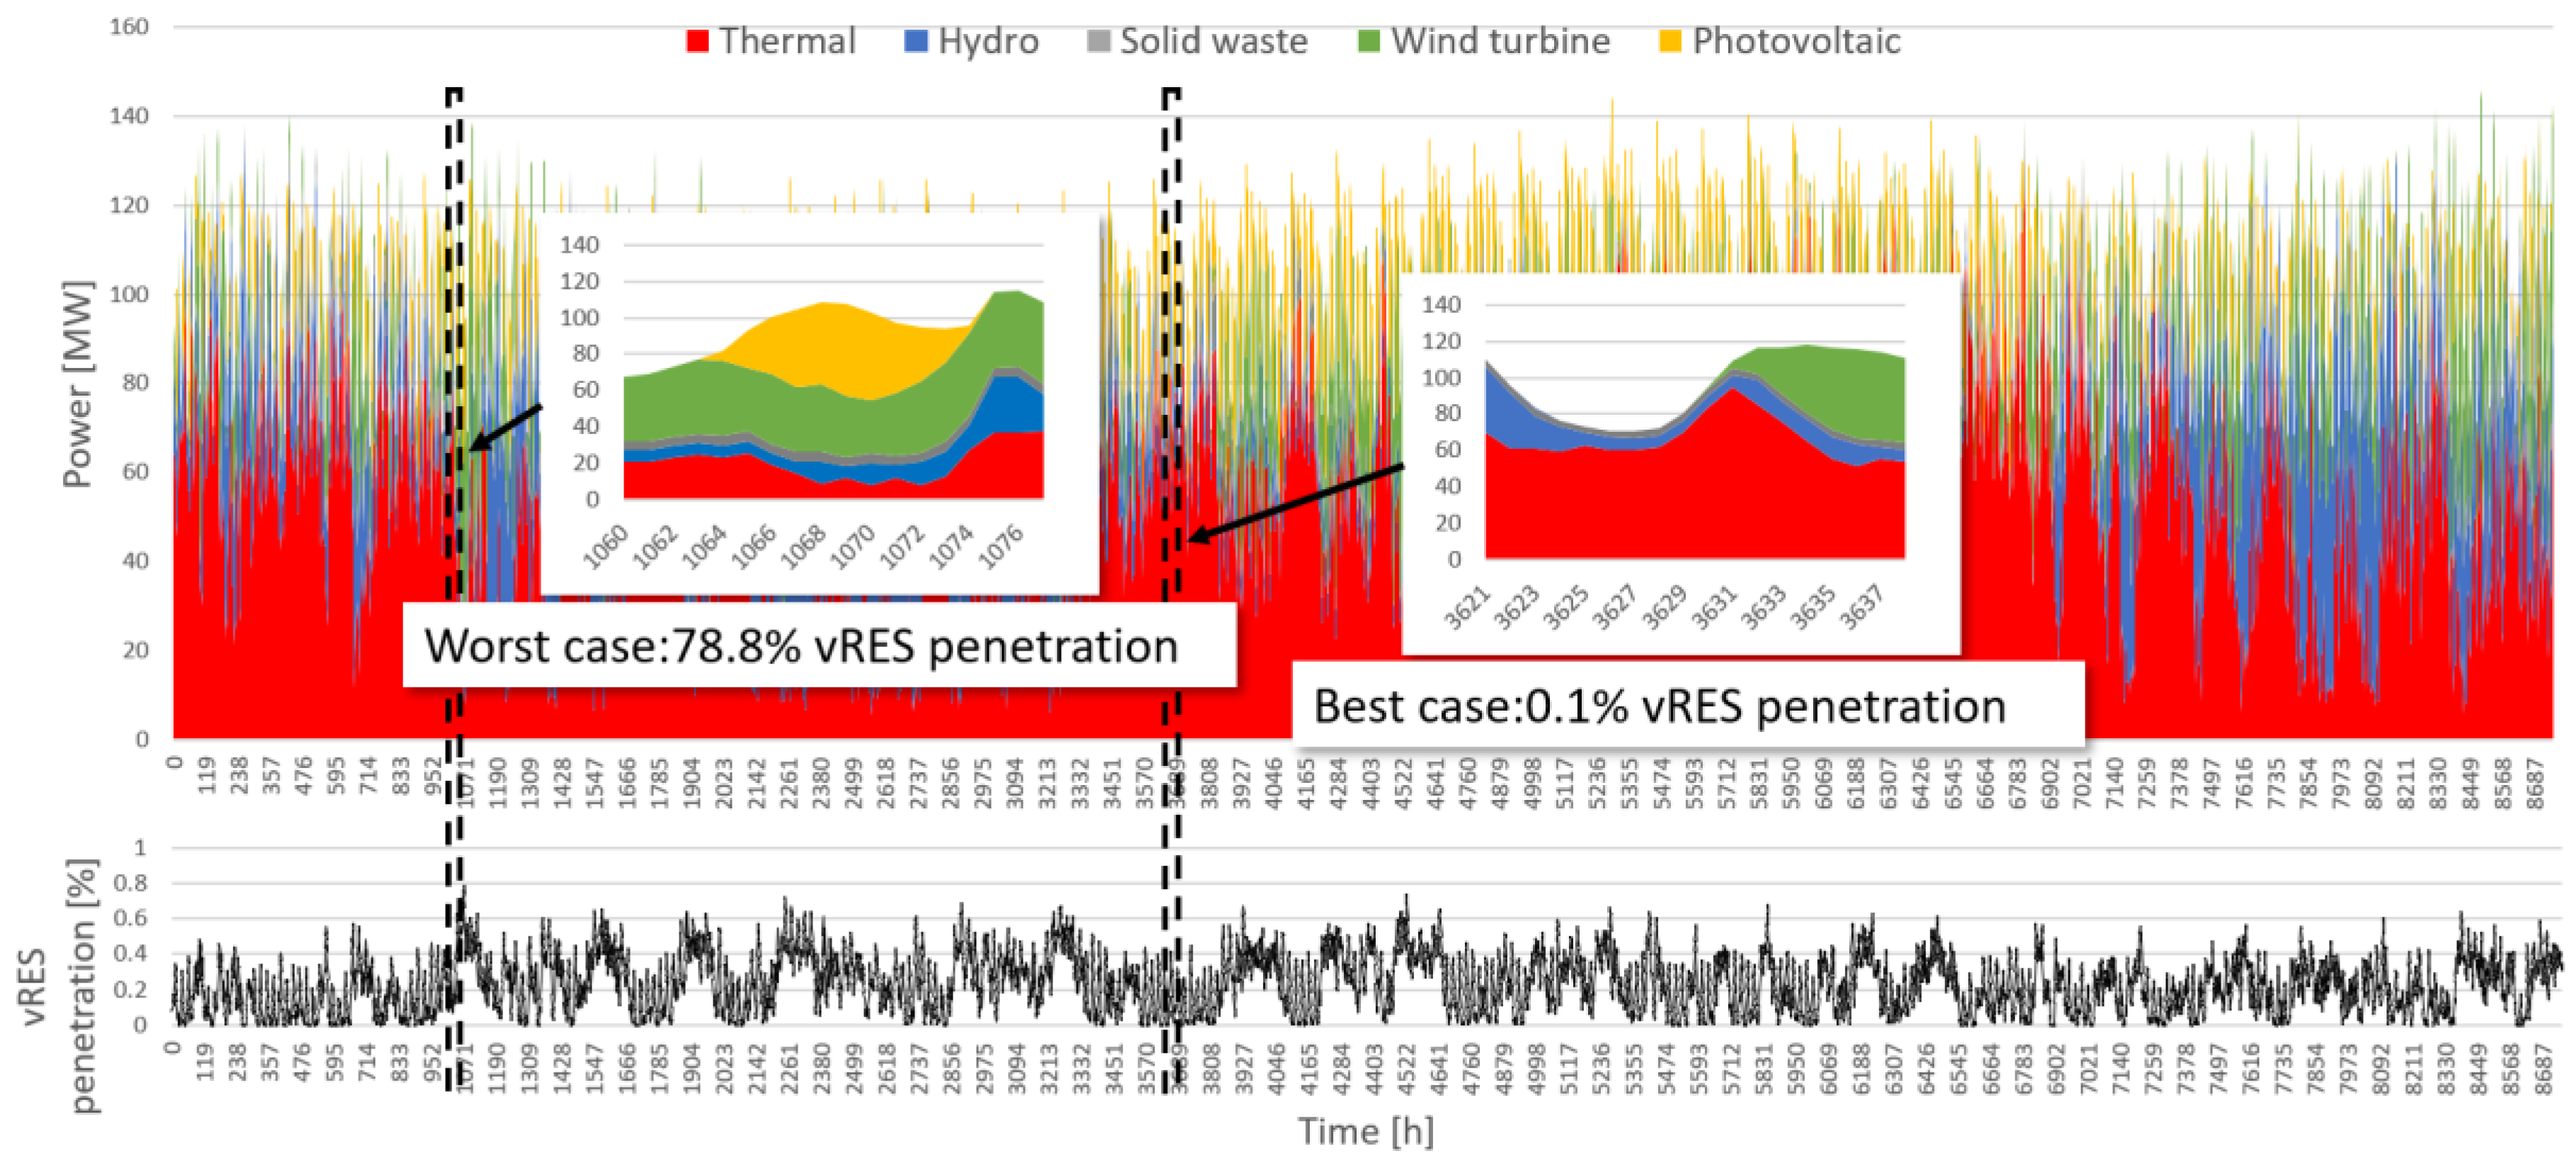
 Figure 4 and Figure 5 depict the resulting operation for the two scenarios and highlight the extreme points that form the basis for the transient simulations.
Table 3 and Table 4 focus on the identified best and worst cases and present units of operation. The purpose of including this information is to clarify which units are active at that time and which units can offer ancillary services. All conventional generation units can offer inertia response to the power system, since they are all composed of SGs, which contain rotating masses. Accordingly, all conventional units except steam plants contribute to primary frequency control according to their droop curve (2% for thermal, 3% for hydro). An important point is that many hydro units (mainly those with smaller installed power) operate close to their rated power; therefore, although they can assist in primary frequency control, this capability is limited by their rated power.
Finally, Table 5 presents the calculated available primary reserves and online inertia for each case under consideration. As shown, the reduction of primary frequency reserves and online inertia among worst cases (26.87 MWe to 11.33 MWe and 1.36 pu to 0.65 pu, respectively) is substantial and renders the system particularly sensitive under disturbances. It is mentioned that due to an increase in the installed hydropower plants’ capacity, the power system base is 250.17 MWe and 289.95 MWe for the reference and future cases, respectively.

6. Dynamic Simulations Results and Discussion

This section presents the results of the simulations for the defined cases. Figure 6 depicts an overview of the developed system’s representation in the Dymola environment. A detailed description of the utilized dynamic models for all generation units is given in Appendix A. Their electrical and mechanical parameters have been set with typical values from the literature [49] based on their type and capacity.

6.1. Disturbances

Three types of disturbances have been examined, namely (i) load step-change, (ii) generation loss and (iii) short-circuit at the transmission level. The purpose of this section is to illustrate the differences between the future and reference scenarios and demonstrate that the increase of vRES penetration affects network stability and requires solutions to avoid curtailment while maintaining power system security and reliability.

6.1.1. Load Step-Change

To examine the transient behavior of the system under stiff load changes, four simulations are presented, parameterized by the value of the load step increase, i.e., 2 MWe, 4 MWe, 6 MWe and 8 MWe. Figure 7 and Figure 8 show the frequency response and RoCoF for the best and worst cases of the reference scenario, respectively. It can be observed that the system responded successfully to this disturbance and no load-shedding relay activation was required as the load-shedding criteria were not met. Of course, the higher the load increase, the greater the steady-state error of frequency and RoCoF fluctuations. Even if load-shedding actions are avoided, frequency and RoCoF could reach extremely low values of 48.93 Hz and 1.14 Hz/s, respectively. This new low steady-state frequency will negatively affect the power quality provided to all customers, especially industries, as the operation of grid-coupled induction motors present in industrial environments is highly affected by the power system’s frequency.
Figure 9 and Figure 10 present the corresponding results of frequency response and RoCoF for the future scenario. As shown in Figure 10, severe frequency fluctuations occur in both 6 and 8 MWe load step-changes. The frequency rapidly reaches 46 Hz where generators have to be disconnected and the system collapses. In addition, in the RoCoF diagrams, it can be observed that the frequency drops sharply due to the presence of reduced inertia.
Lastly, Figure 11 and Figure 12 depict the results of the frequency response for the same disturbances after the BESS integration. As shown in these diagrams, no shedding relay needs to be activated after battery installation, since the load-shedding criteria are not met. In all load step increments, the system maintains stability and reduces both RoCoF deviations and steady-state frequency error as the inverter’s time response is fast enough to increase the battery’s active power output and emulate inertia.
Figure 13 presents the active power output of BESS during the disturbances. In all cases, BESS operates within the permitted limits (15 MWe). At the moment when the disturbance event occurs, the power of the BESS increases rapidly due to virtual inertia control and, due to the droop control, follows a pattern inversely proportional to the frequency.
Table 6 and Table 7 summarize the most characteristic parameters of the examined scenarios described above. Inertia reduction is reflected not only to the RoCoF nadirs of the reference and future scenarios but also by the fact that, since the frequency drops sharply, the generator’s prime movers fail to increase their power rates and prevent system collapse. In addition, it is observed that the battery installation for primary frequency control and inertia support can lead to a smaller RoCoF and steady-state frequency error than the reference case. For the most severe load step-change of 8 MWe, in the future with BESS scenario, the resulting RoCoF oscillates in the interval [−0.18, −0.015] Hz/s. The corresponding interval for the reference scenario is constrained between [−0.3, −0.03] Hz/s, demonstrating a strong advancement over the current operational mode, also considering the reduction of the physical system inertia from 1.36 pu to 0.65 pu.

6.1.2. Generation Loss

This scenario investigation is of great importance in the future case because facing great power fluctuations from renewable energy sources is very common. For this purpose, it is important to ensure that the power system will remain balanced under high-RES penetration. In order to test power system stability under extreme conditions, the tripping of the second-largest unit is investigated. According to the reference case, this unit is a wind power plant with an installed capacity of 8.32 MWe. According to the future case, the second-largest unit is a solar power plant with a 14.22 MWe maximum power output. Although the system maintained its stability in the best case of the future scenario as depicted in Figure 14, it collapsed in the corresponding worst case of Figure 15. Furthermore, load-shedding relays activated before system collapse as the load-shedding criteria were met. Additionally, BESS installation leads to secure system operation without load-shedding relay activation, even after the complete loss of a significant production unit.
Table 8 presents the characteristic values derived from the diagrams described above. In the worst case of the future scenario, the RoCoF’s nadir is equal to −3.69 Hz/s before the system collapse. On the contrary, in the worst case of the future with the integration of BESS scenario, the RoCoF and frequency remained below −0.98 Hz/s and 48.87 Hz, respectively, far from the load-shedding activation criteria (−1.5 Hz/s, 49 Hz), revealing a significant response improvement. The proposed control method for the BESS inverter leads not only to reliable system operation but also a severe reduction of the minimum RoCoF and prevention of load-shedding relay activation.

6.1.3. Three-Phase Short-Circuit (3ph SC) in a 60 kV Line

This section examines the impact of a three-phase short-circuit fault on the grid, which is considered one of the major disturbances that can occur in a power system and explores the system’s ability to clear the fault and maintain stability. On mainly overhead line systems, such as Madeira’s power system, the majority of short-circuit faults (approximately 80–90%) tend to appear on overhead lines and the rest on substation equipment and busbars combined [50]. This is due to the exposure of the transmission and distribution assets to the weather phenomena, making them vulnerable to wind gusts and thunders and, at the same time, causing earlier degradation to the insulating materials. Additionally, the increase of vRES penetration decreases the short-circuit currents due to the inverters’ current limiters, introducing a further challenge to the grid as it becomes harder to identify and clear the fault quickly. It is evident that the thorough investigation of this kind of fault is crucial for the resilience of the system under consideration.
In this framework, short-circuit scenarios have been examined for the most crucial point of the system, i.e., the 60 kV overhead transition lines. According to the scenario under consideration, the fault occurred on a 60 kV transition line, which supplies the west side of the island, and was cleared after 100 ms (five cycles) according to the Madeira’s power system fault-clearing standards.
As can be observed in Figure 16 and Figure 17, the system responded successfully to this disturbance and maintained its stability in all cases, although in the best case of the reference scenario, the fault led to the desynchronization of a hydro unit. As Figure 18 depicts, the short-circuit caused very high oscillations to the hydro unit’s speed and, as a result, to power system frequency, which are depreciated after the successful disconnection of the unit from the power system. Generally, the system has no problem maintaining its stability and is driven to a new frequency almost identical to the rated frequency (50 Hz) without the presence of secondary frequency control. In the future case, frequency deviation is more severe, which is mainly due to the significant reduction of system inertia.
Based on these figures, along with Table 9, it is evident that BESS results in both frequency deviations and the reduction of RoCoF. This contribution is primarily due to the derivative control presented in Section 2.2, which helped to increase the system inertia virtually along with BESS droop control since, after fault clearance, it contributed more than the derivative control. Furthermore, it is observed that in the worst case of the future scenario, the RoCoF oscillates between [−6.69, −4.32] Hz/s and [−4.27, −3.22] Hz/s in the same case of the future with BESS scenario, which is a huge enhancement, also taking into account the reduction of physical system inertia from 1.36 pu to 0.65 pu.

6.2. BESS/FESS Comparison

This paragraph examines the consideration of a flywheel storage system as an alternative solution to the stability problem in Madeira. The FESS model is presented in Appendix A and includes the rotor, a permanent magnet generator and two inverters in a back-to-back topology scheme. The battery in the overall system model has been replaced by the corresponding FESS, and simulations have been conducted for the case of the future scenario. The main parameters include the generator’s rated power of 18 MVA and the FESS inertia of 3·107 kg∙m2, which were selected to be analogous to the BESS characteristics.
Figure 19 presents the comparison between the battery and flywheel performance in an 8 MWe load step increase. It is observed that the differences between the two storage solutions are negligible. This is expected as the response time of the storage systems for the most part is determined by the inverter selection for the application and overall system design [51]. Therefore, the appropriate storage technology must be selected based on economic criteria regarding the investment and maintenance costs as their technical performance regarding the frequency of ancillary services is identical.

7. Conclusions

The transition from a fossil-fuel-based power system to a sustainable system with very high instantaneous penetrations of vRES requires the development of efficient methods for matching supply and demand over multiple timescales. Since traditional power system operation and security are based on synchronous generator characteristics, it is of utmost importance to ensure that vRES power systems operate in such a way that does not endanger grid stability. This includes designing an inverter-based system to provide system stability and additional grid services necessary for proper system operations.
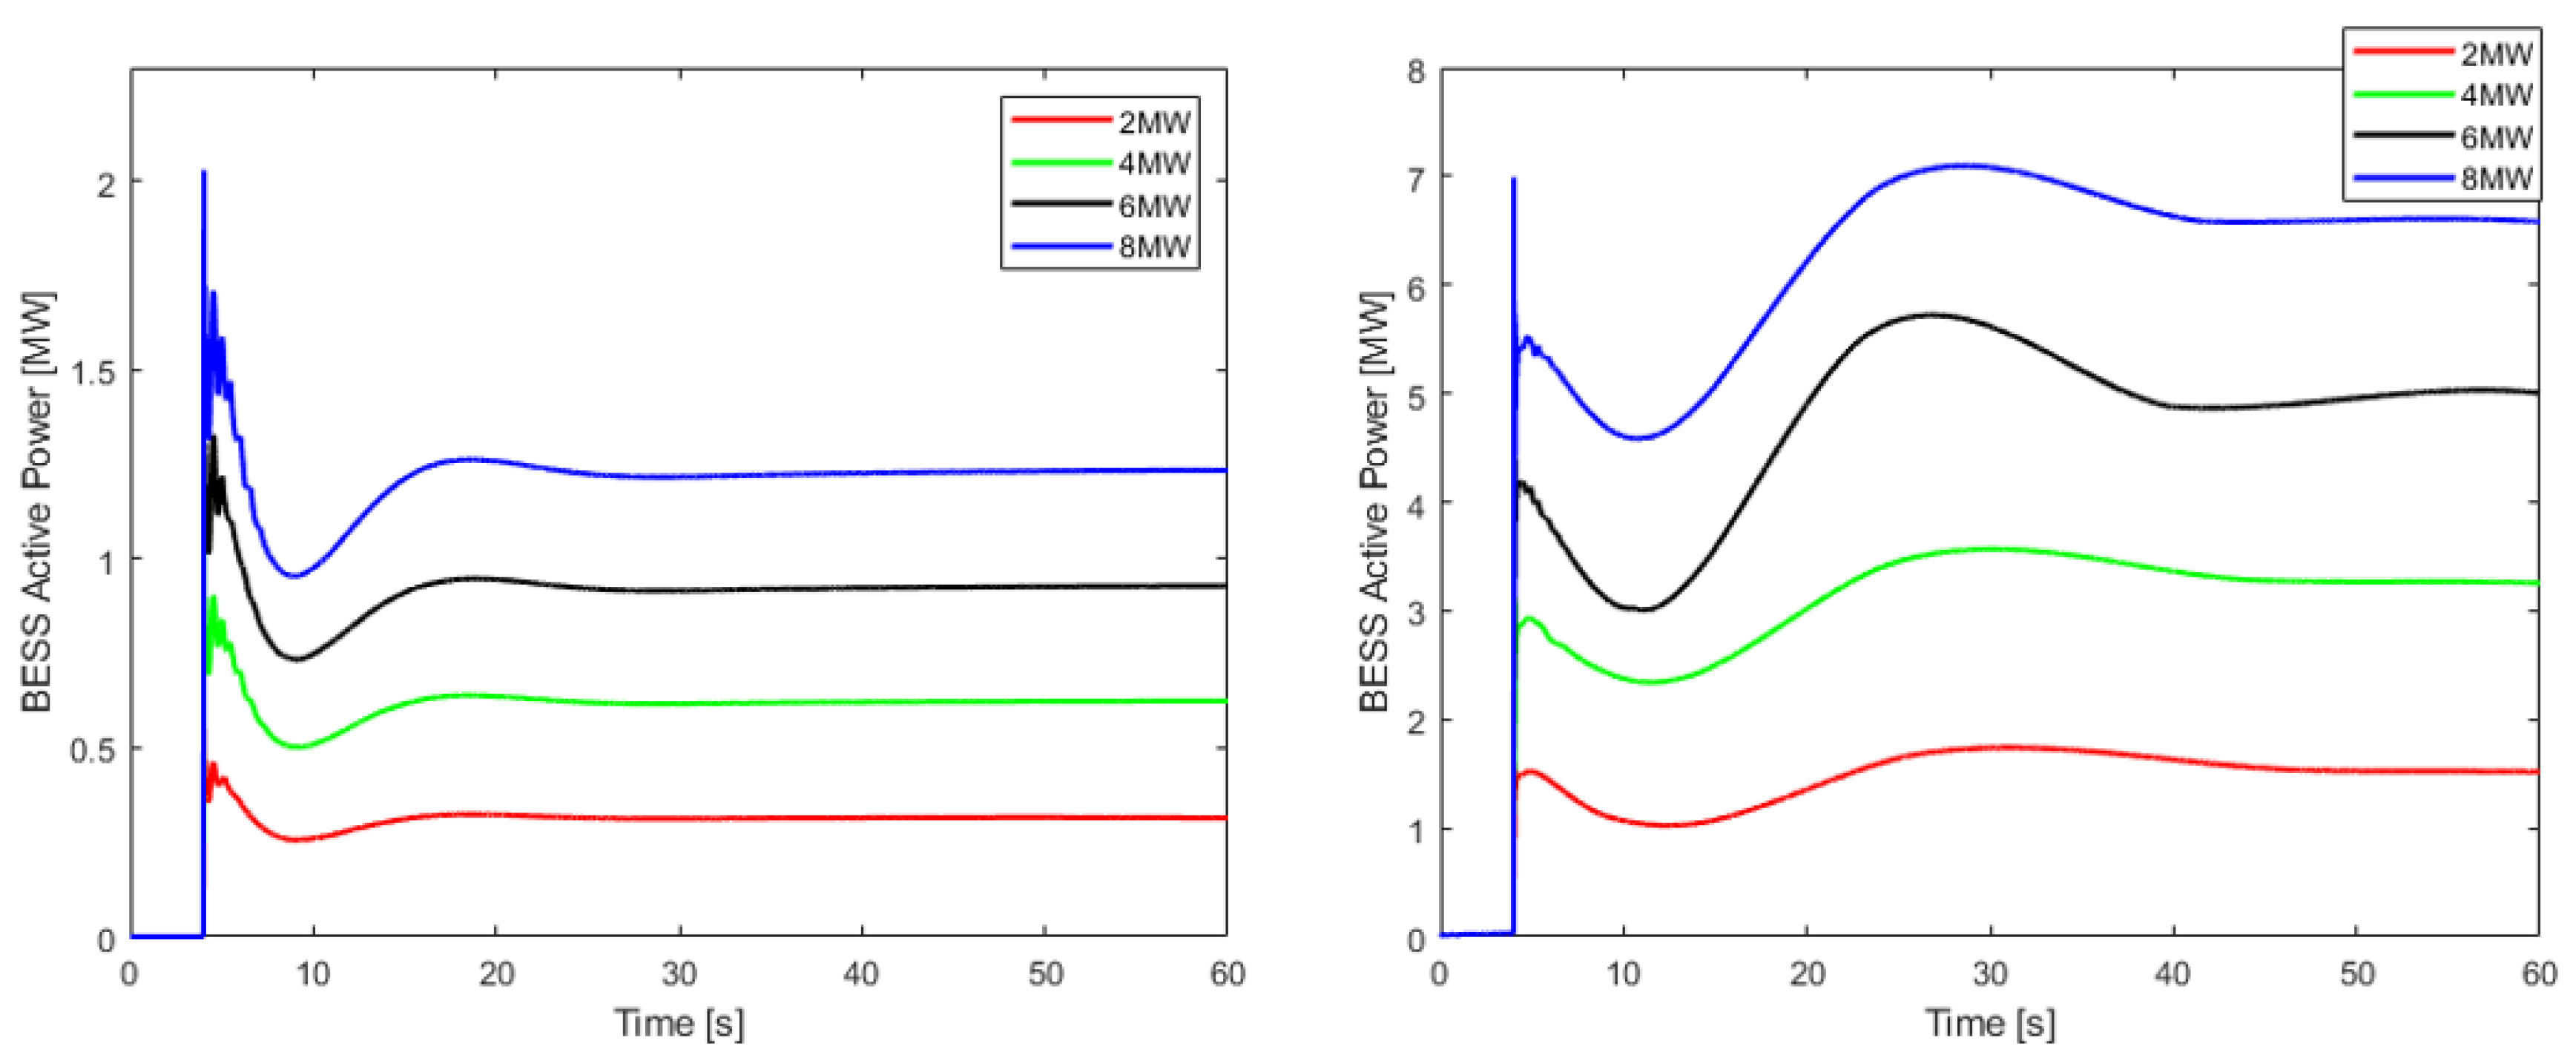
This paper focused on the primary frequency control of the Madeira island power system under high vRES penetration with the integration of a BESS (15 MWe, 10 MWhe) to provide frequency support under severe disturbances. In island systems, the location of a BESS is of minor importance, and in the context of the present study, the battery is considered to be installed in one of the major nodes of the system.
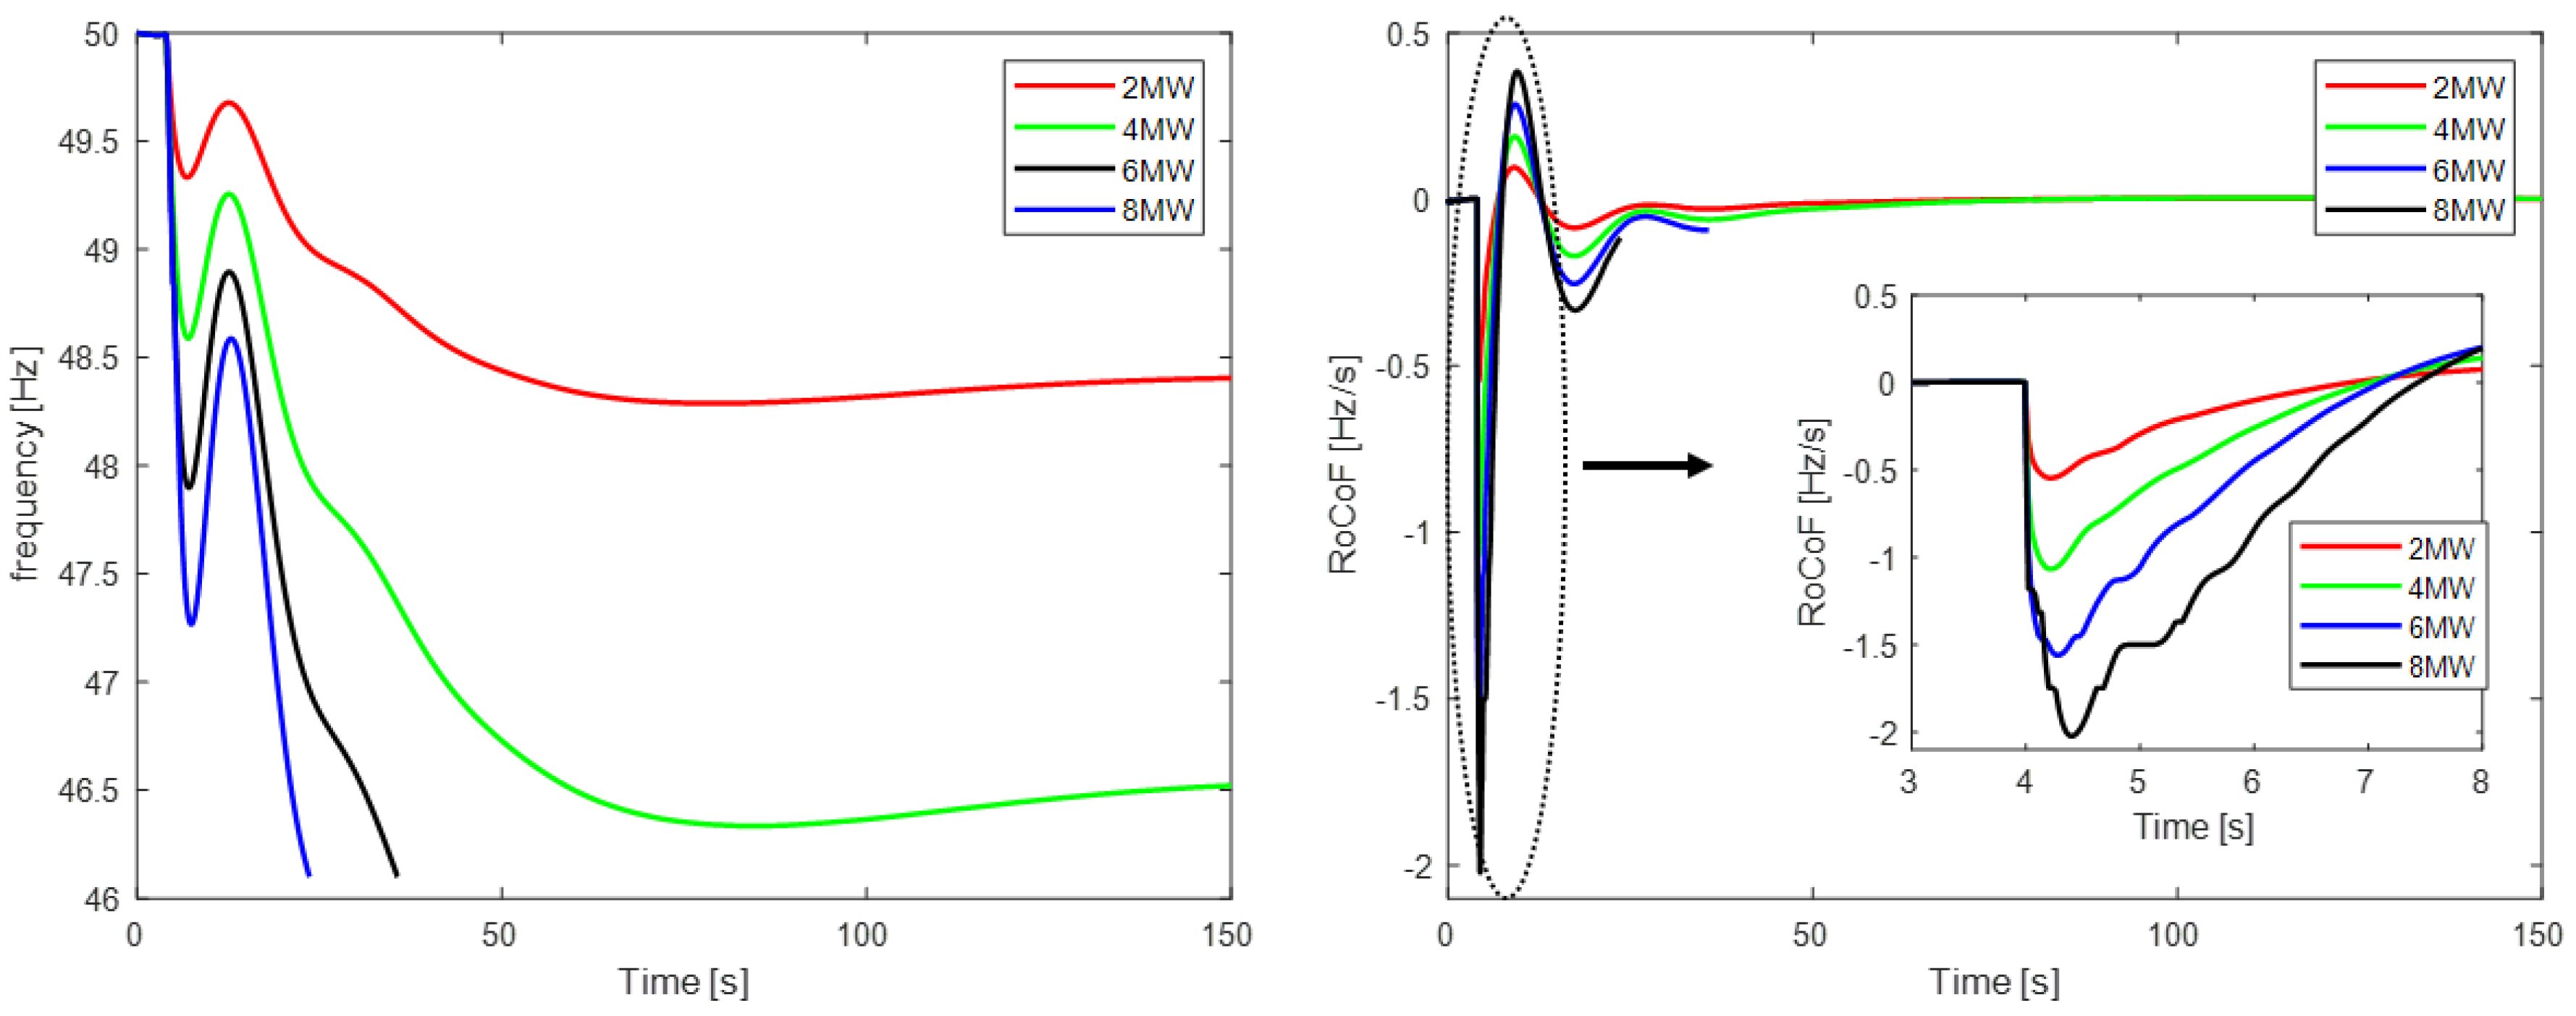
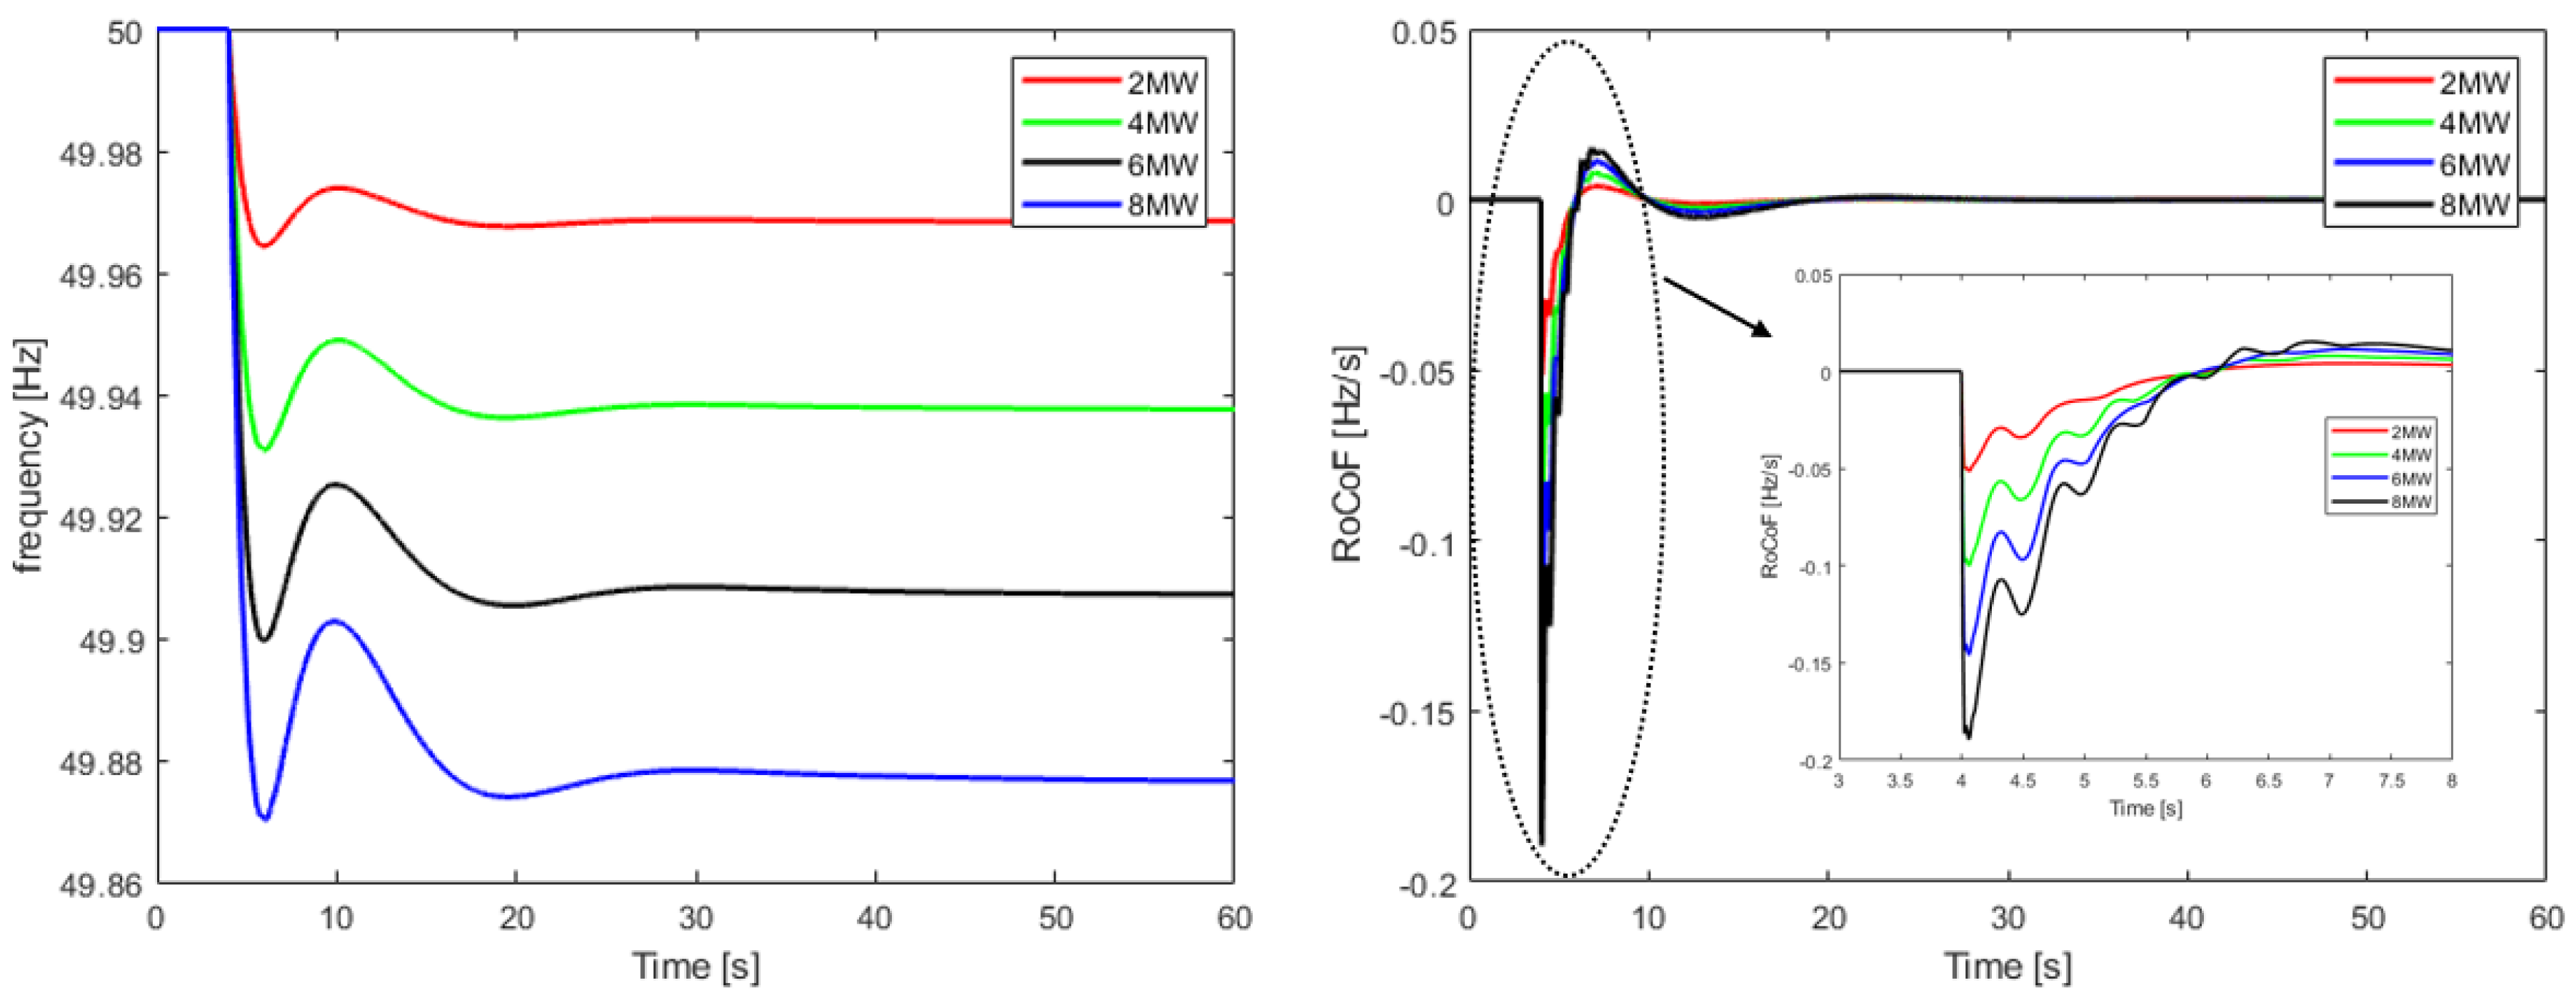
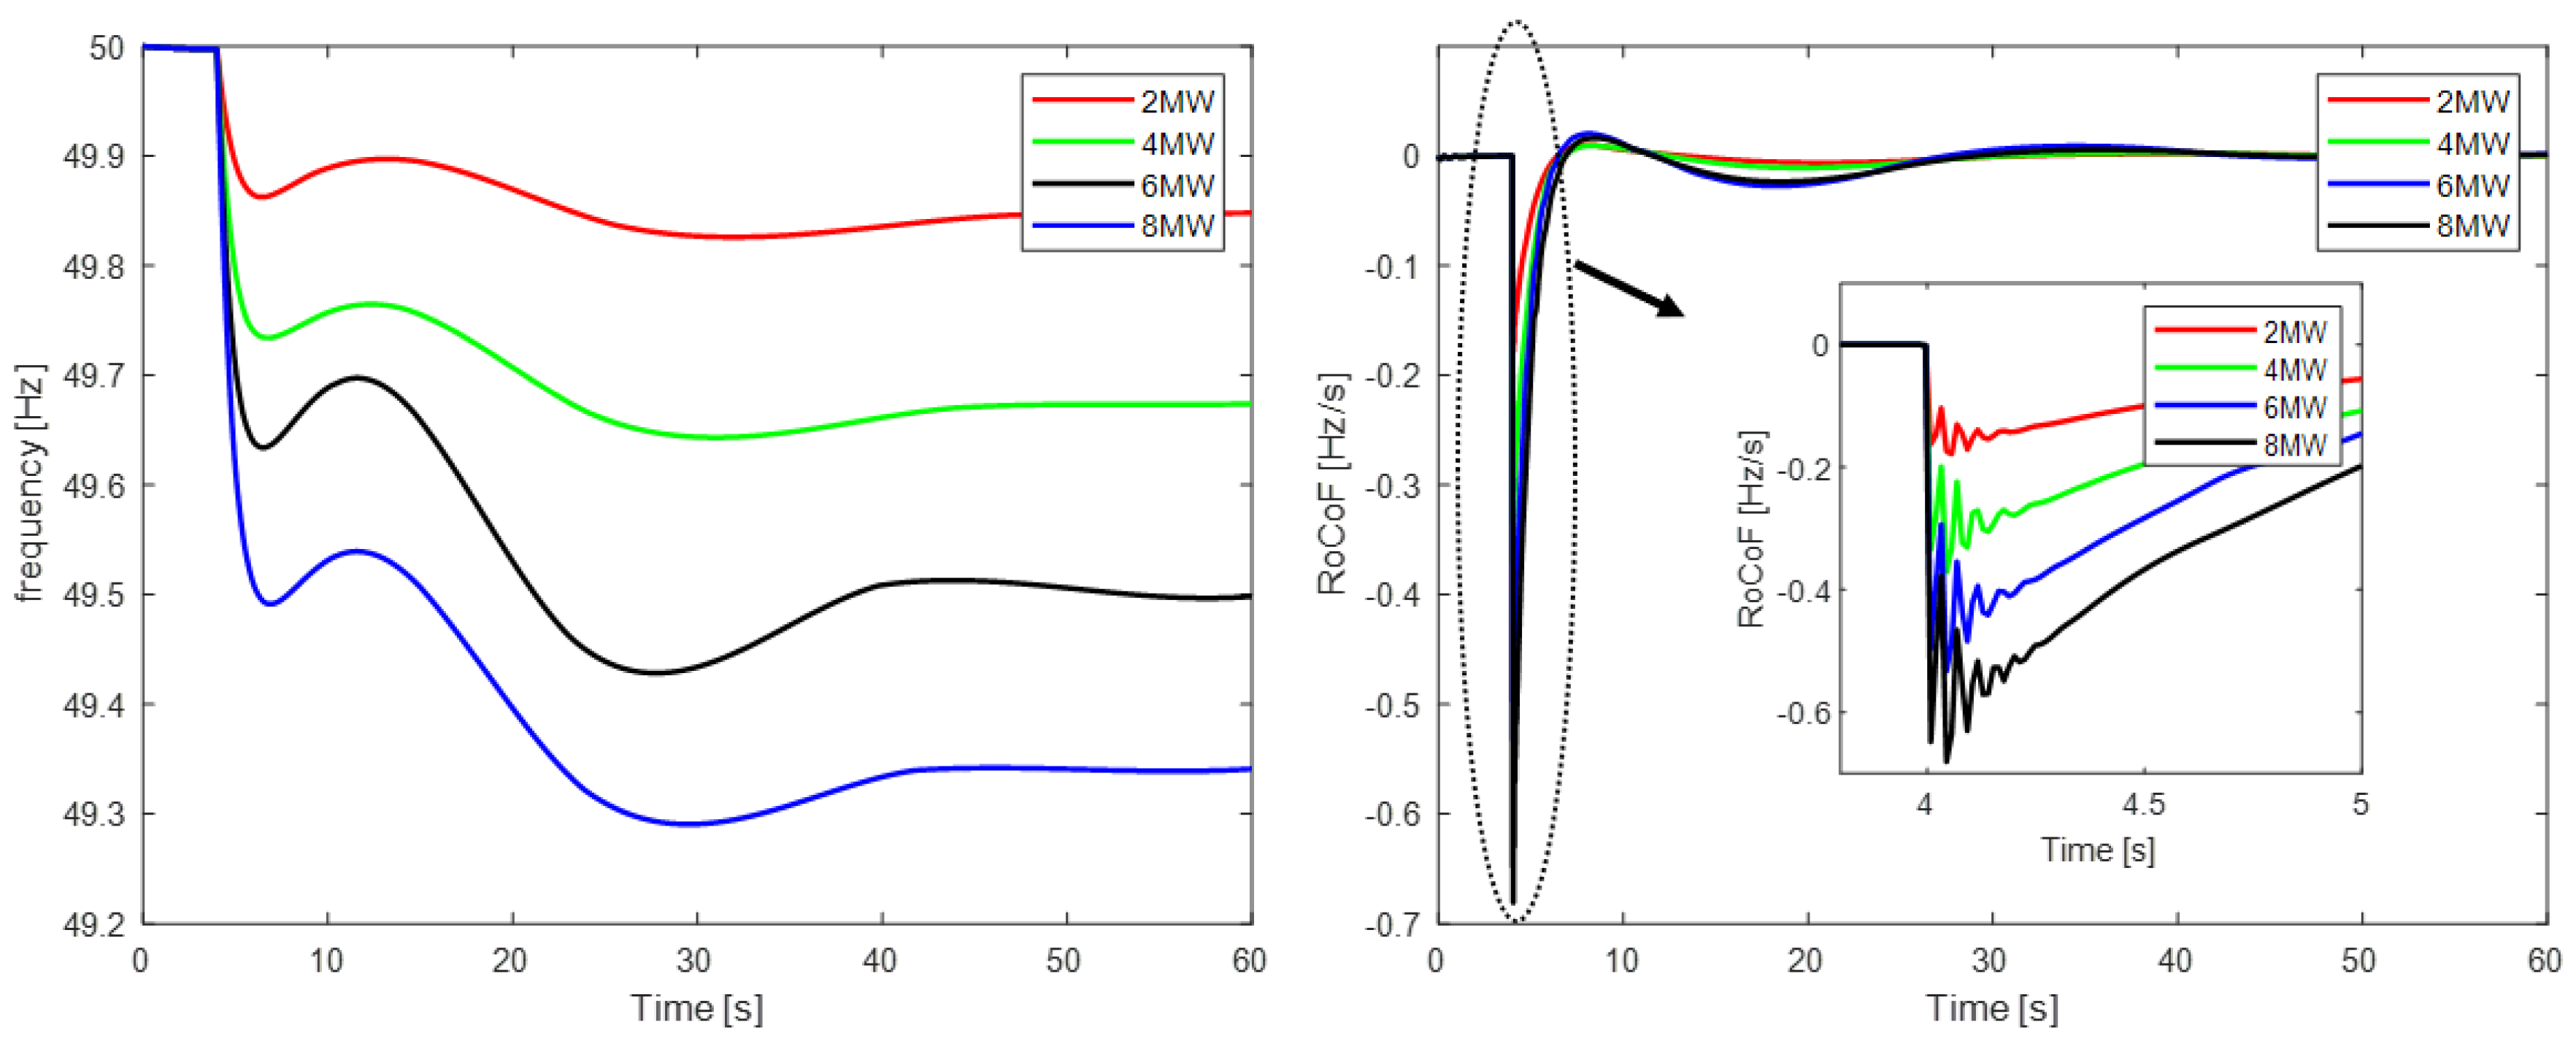
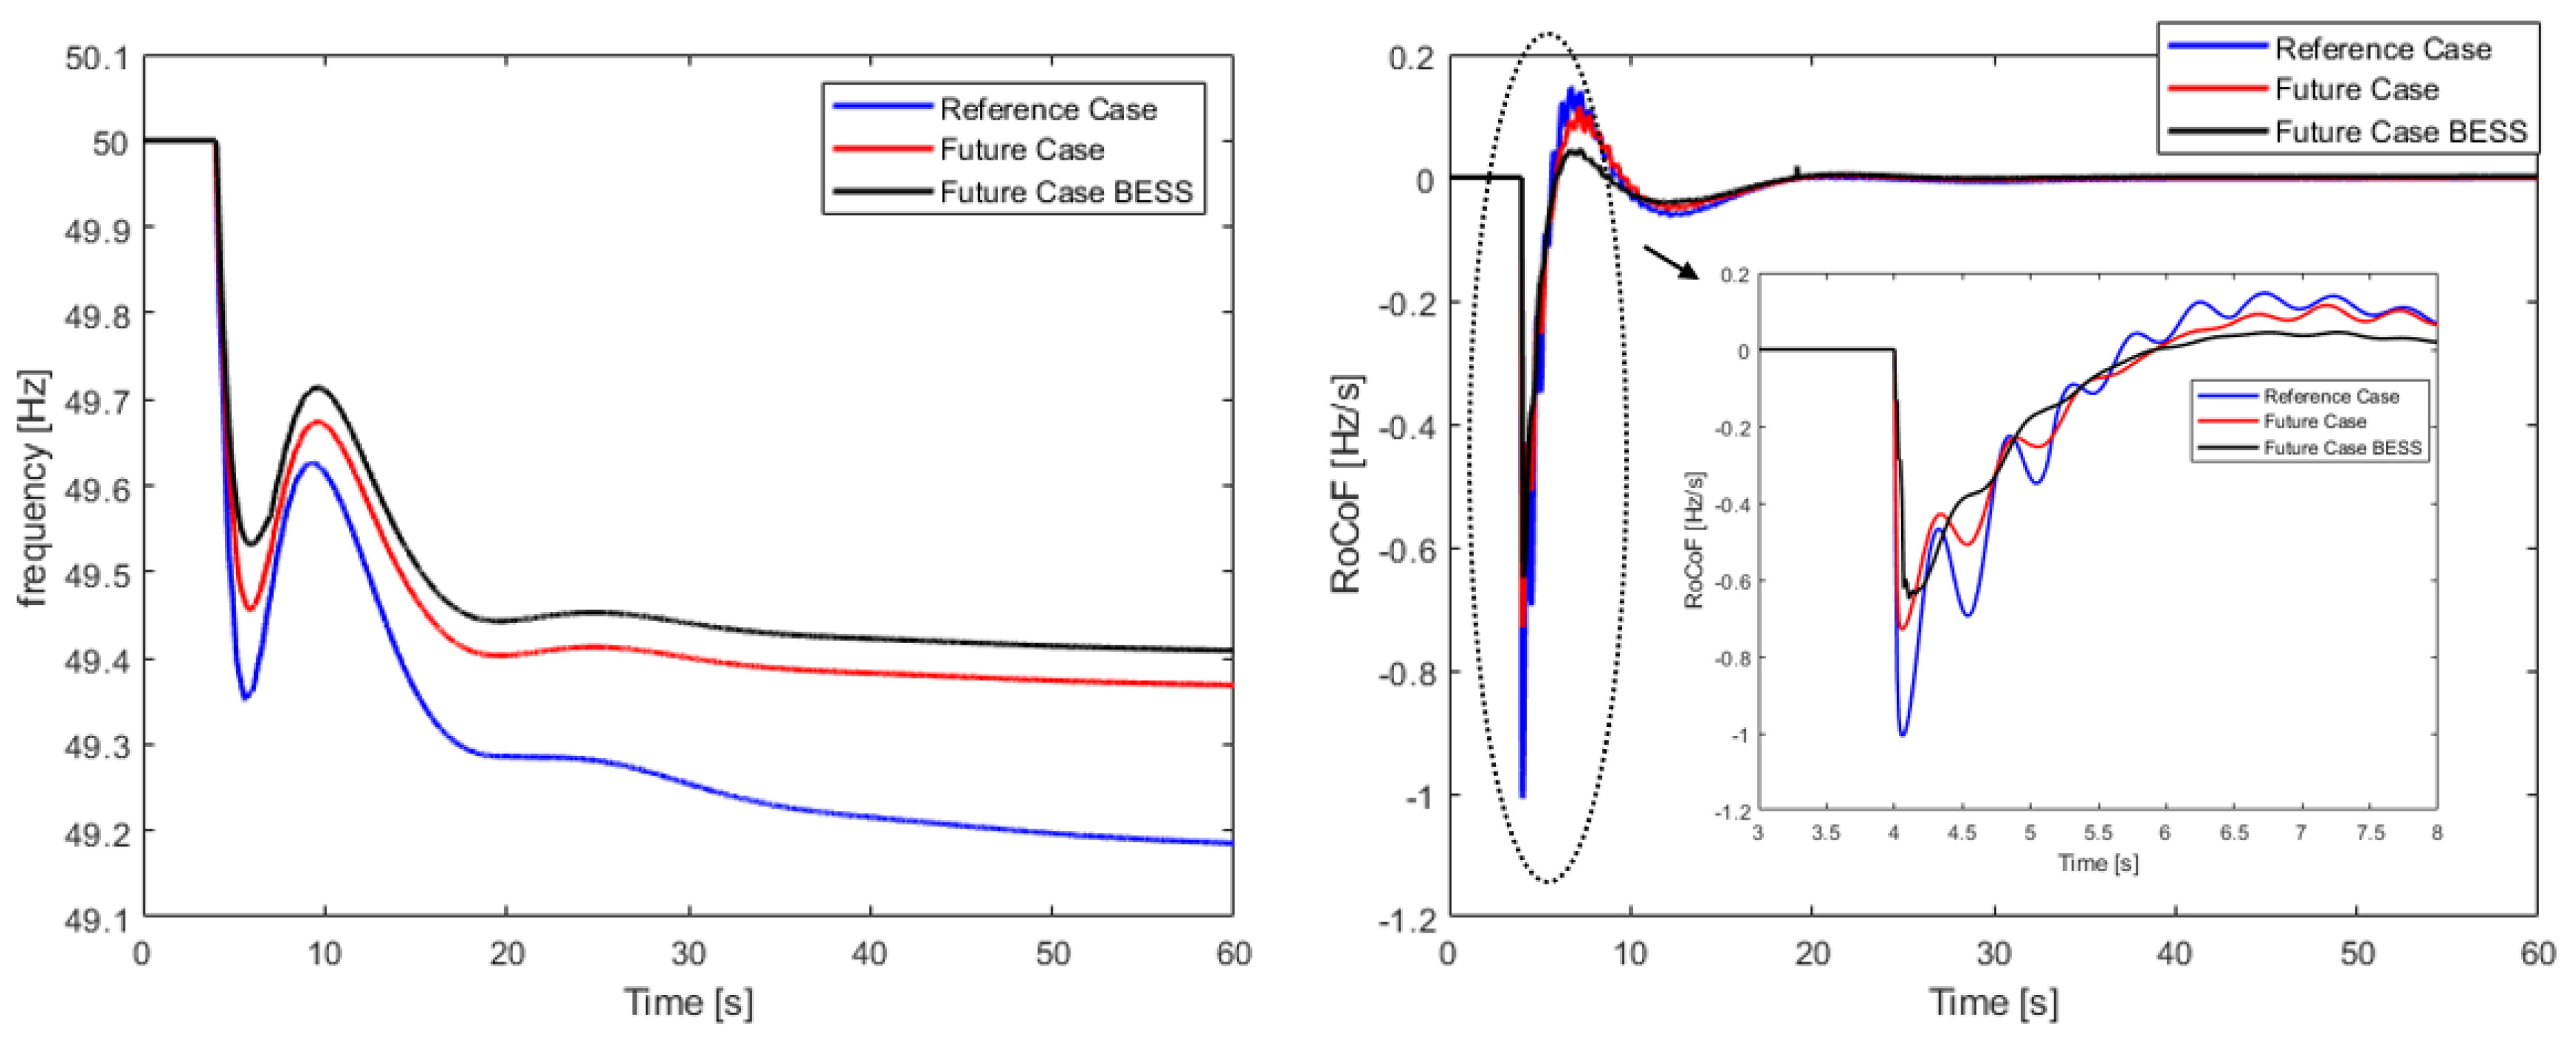
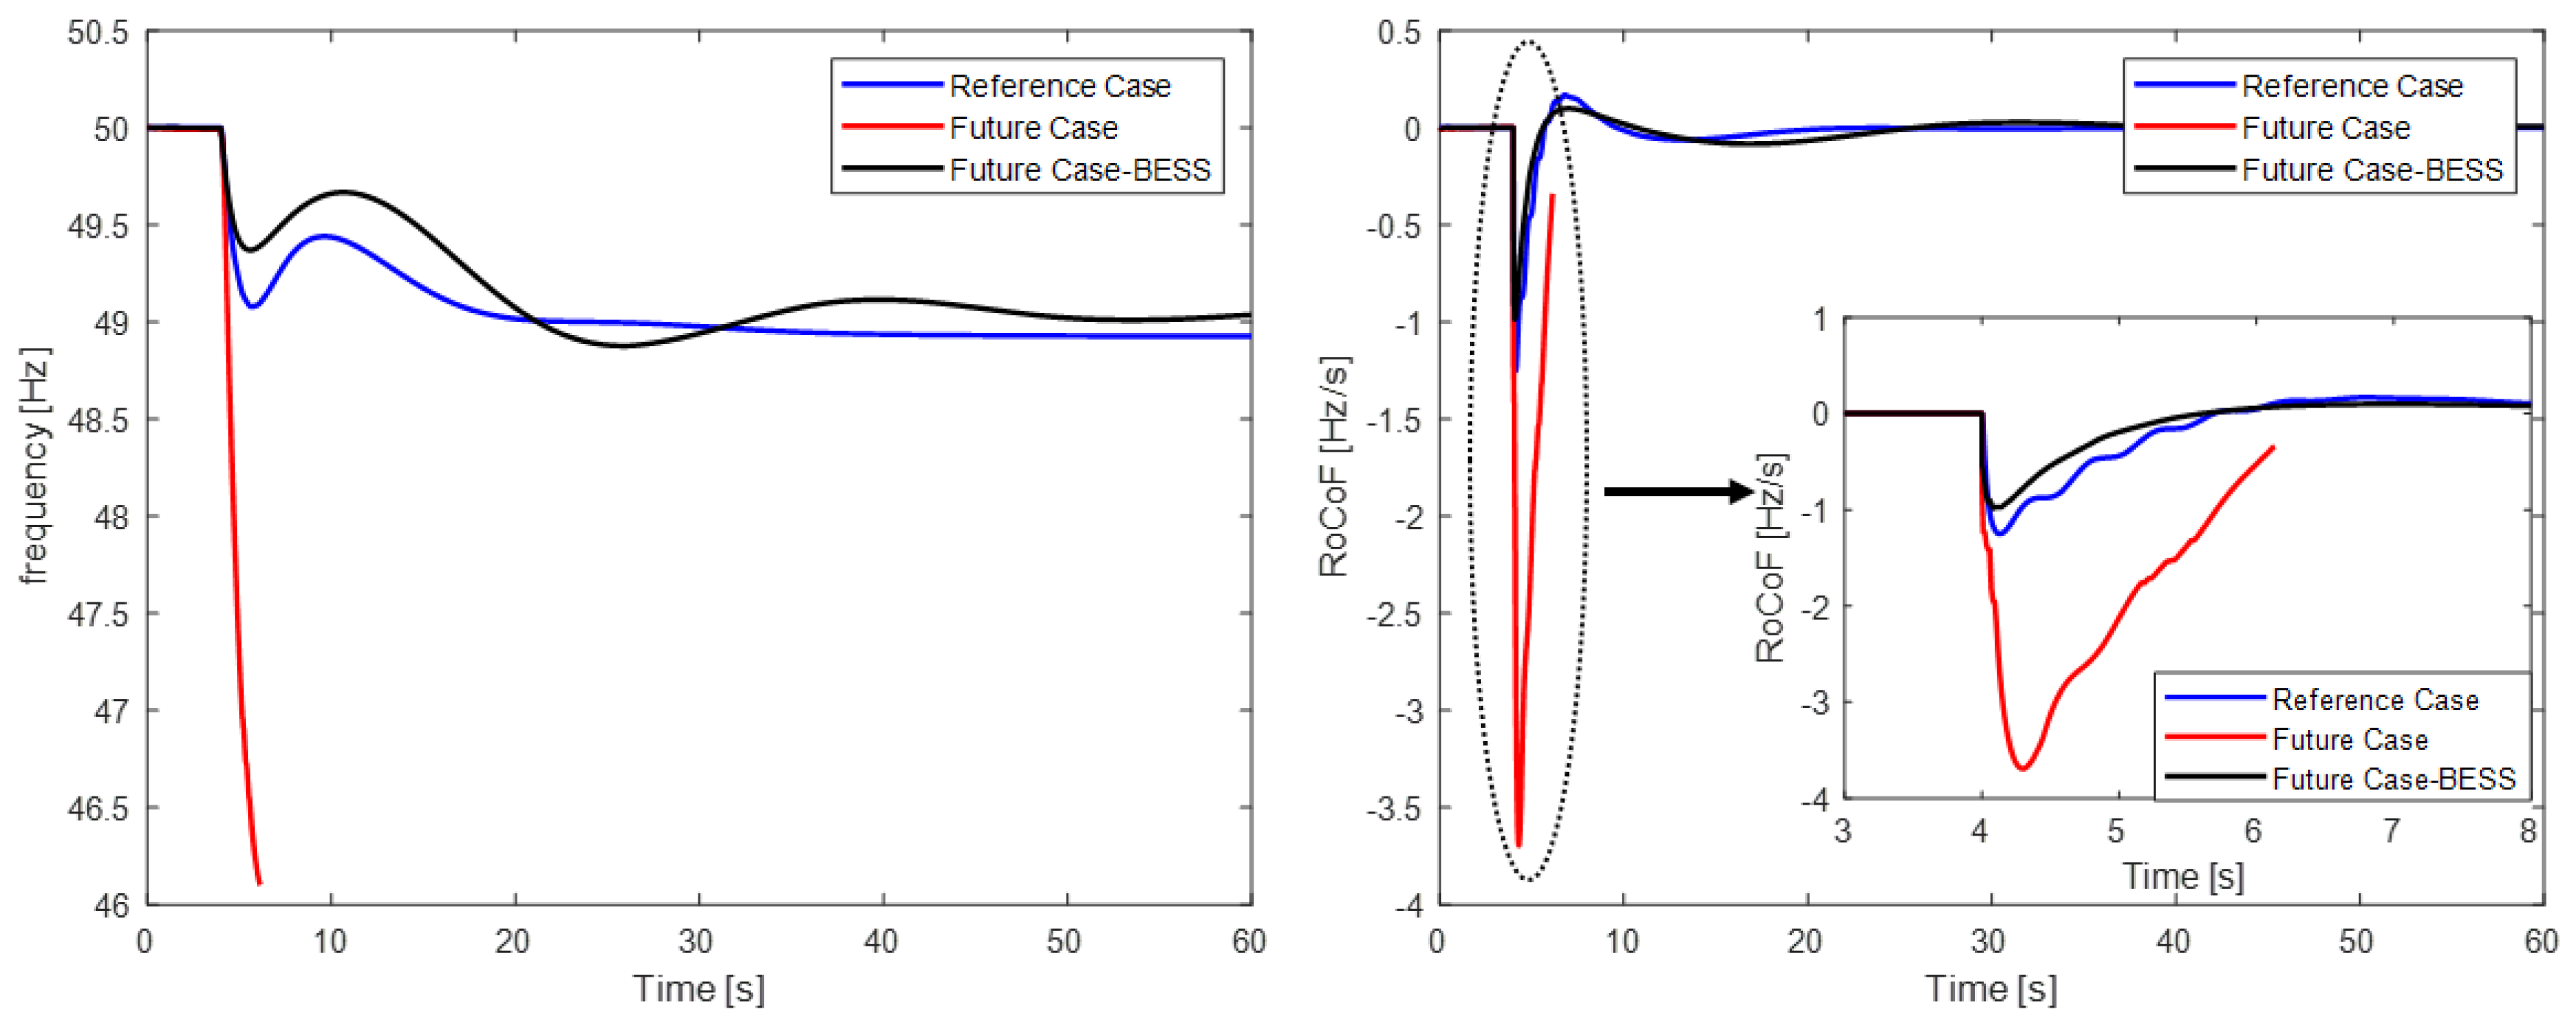
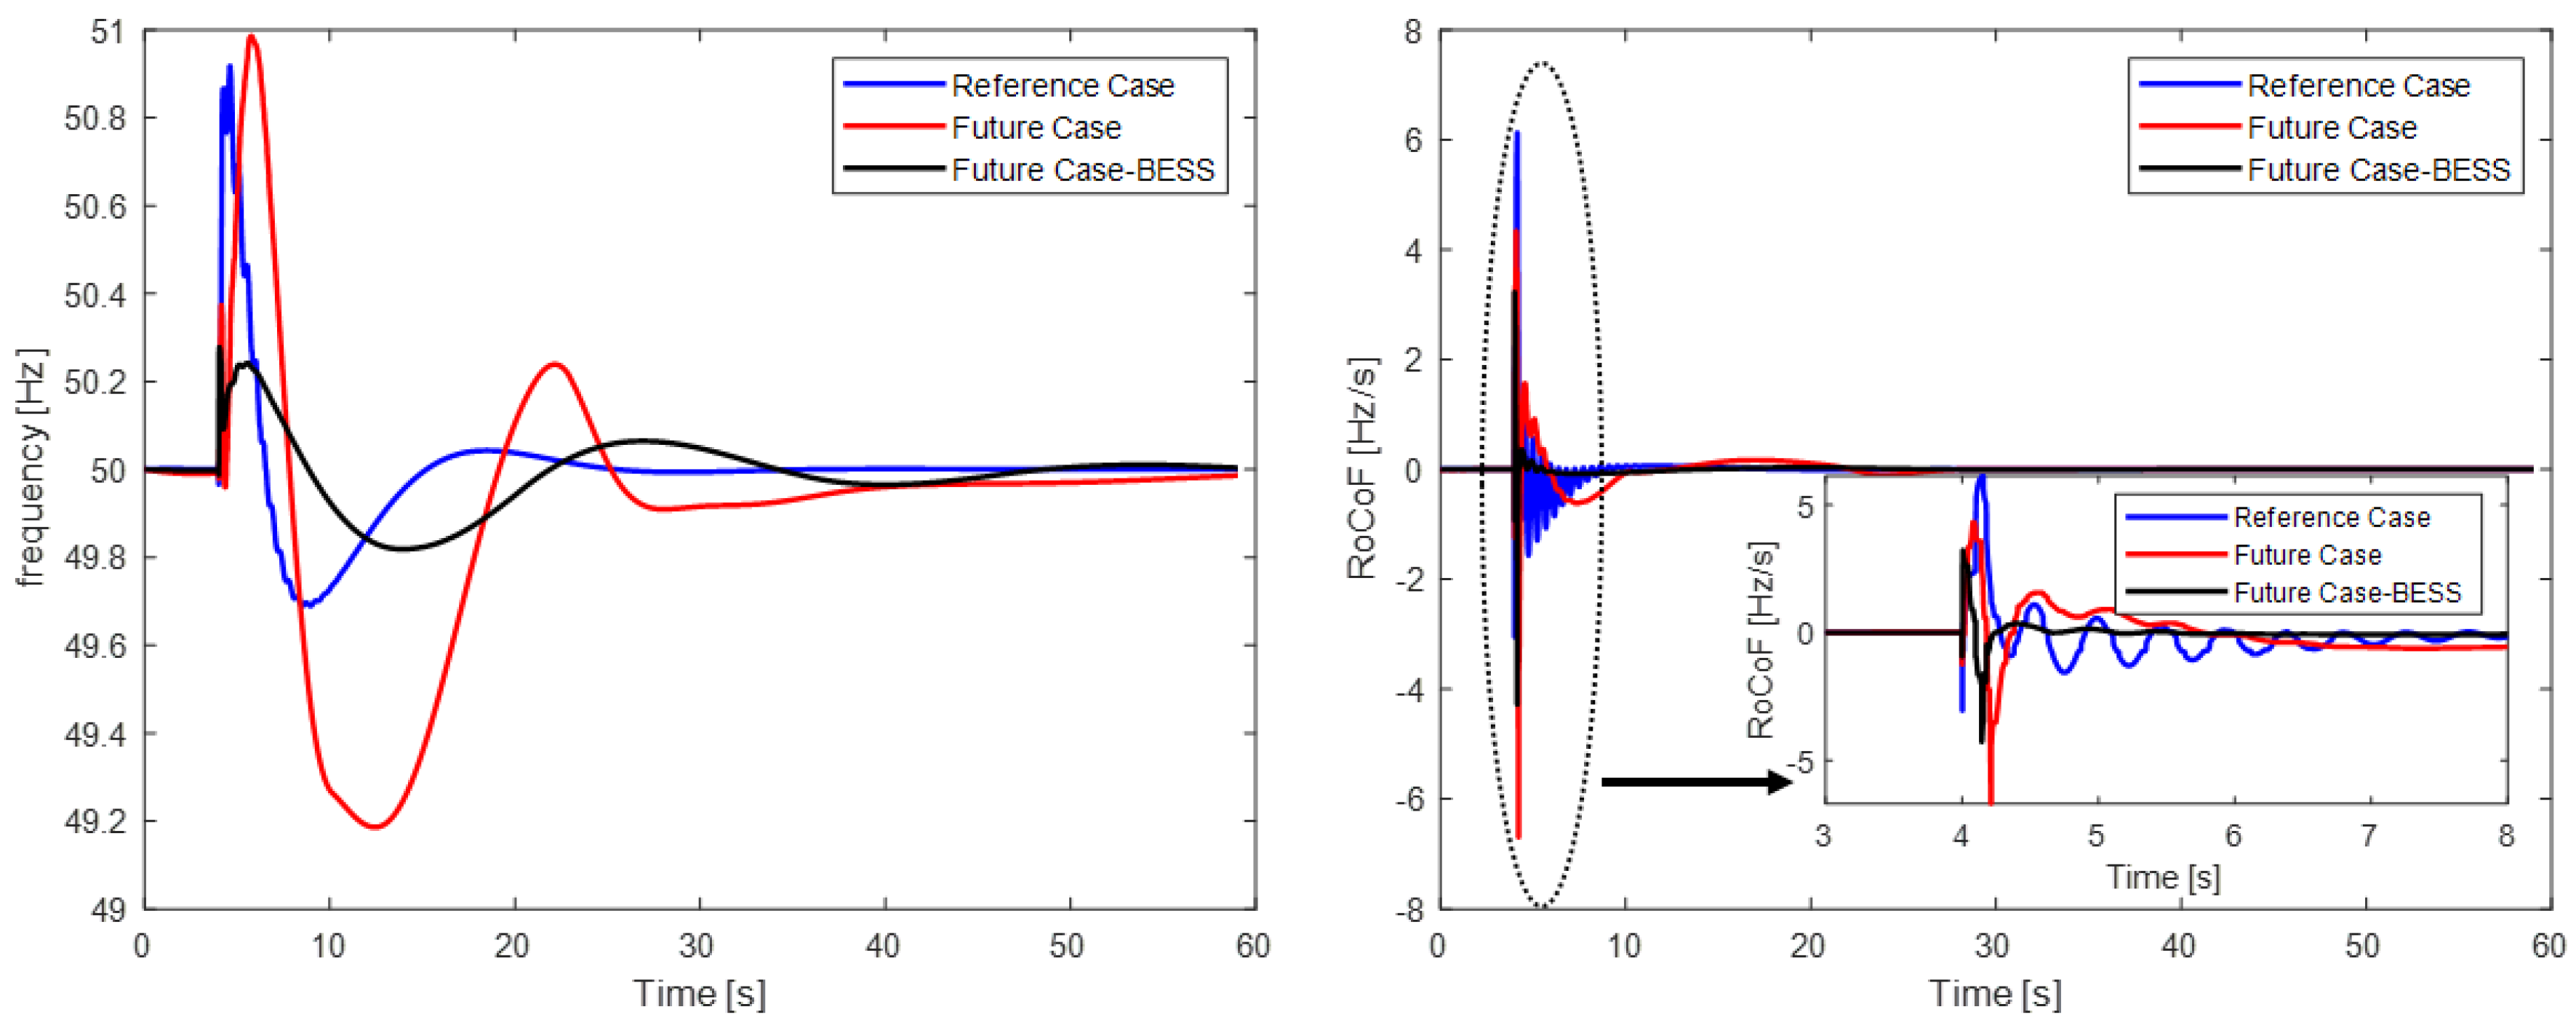
Through scenario-based fault simulation, the system’s response has been examined. It is demonstrated that with the proposed BESS, fault scenarios that would otherwise lead to load-shedding procedures can be mitigated with success. More precisely, three contingency events have been examined, i.e., load step-change, generation loss and short-circuit in a transmission line. For the most severe load step-change case of 8 MWe, in the future with BESS scenario, the resulting RoCoF oscillates in the interval [−0.18, −0.015] Hz/s and is constrained between [−0.3, −0.03] Hz/s for the reference scenario. Likewise, in the generation loss event, system collapse was prevented, while the RoCoF’s nadir between the future and future with BESS scenarios increased from −3.69 Hz/s to −1.5 Hz/s. Finally, the RoCoF of the future scenario oscillated between [−6.69, −4.32] Hz/s in the short-circuit event and [−4.27, −3.22] Hz/s in the same case of the future with BESS scenario.
It is also important to remark on some of the difficulties that occurred during the conduction of the present study. The most challenging part regards the high level of expertise required to develop the necessary modules and successfully perform the simulations using open-source software tools. There are many procedures that must be performed manually in contrast to the automated methods of corresponding proprietary tools. Modelica, in particular, requires deep user knowledge to develop and debug models in the power system domain. Additionally, there were conflicts about the compatibility of RMS simulations with high-RES scenarios and if the use of the phasor domain simulation, which is the most common for these studies, can predict all instabilities. Another important issue that is always present in these studies is the gathering and quality of the input data, which is often a sensitive subject, especially in the context of power consumption.
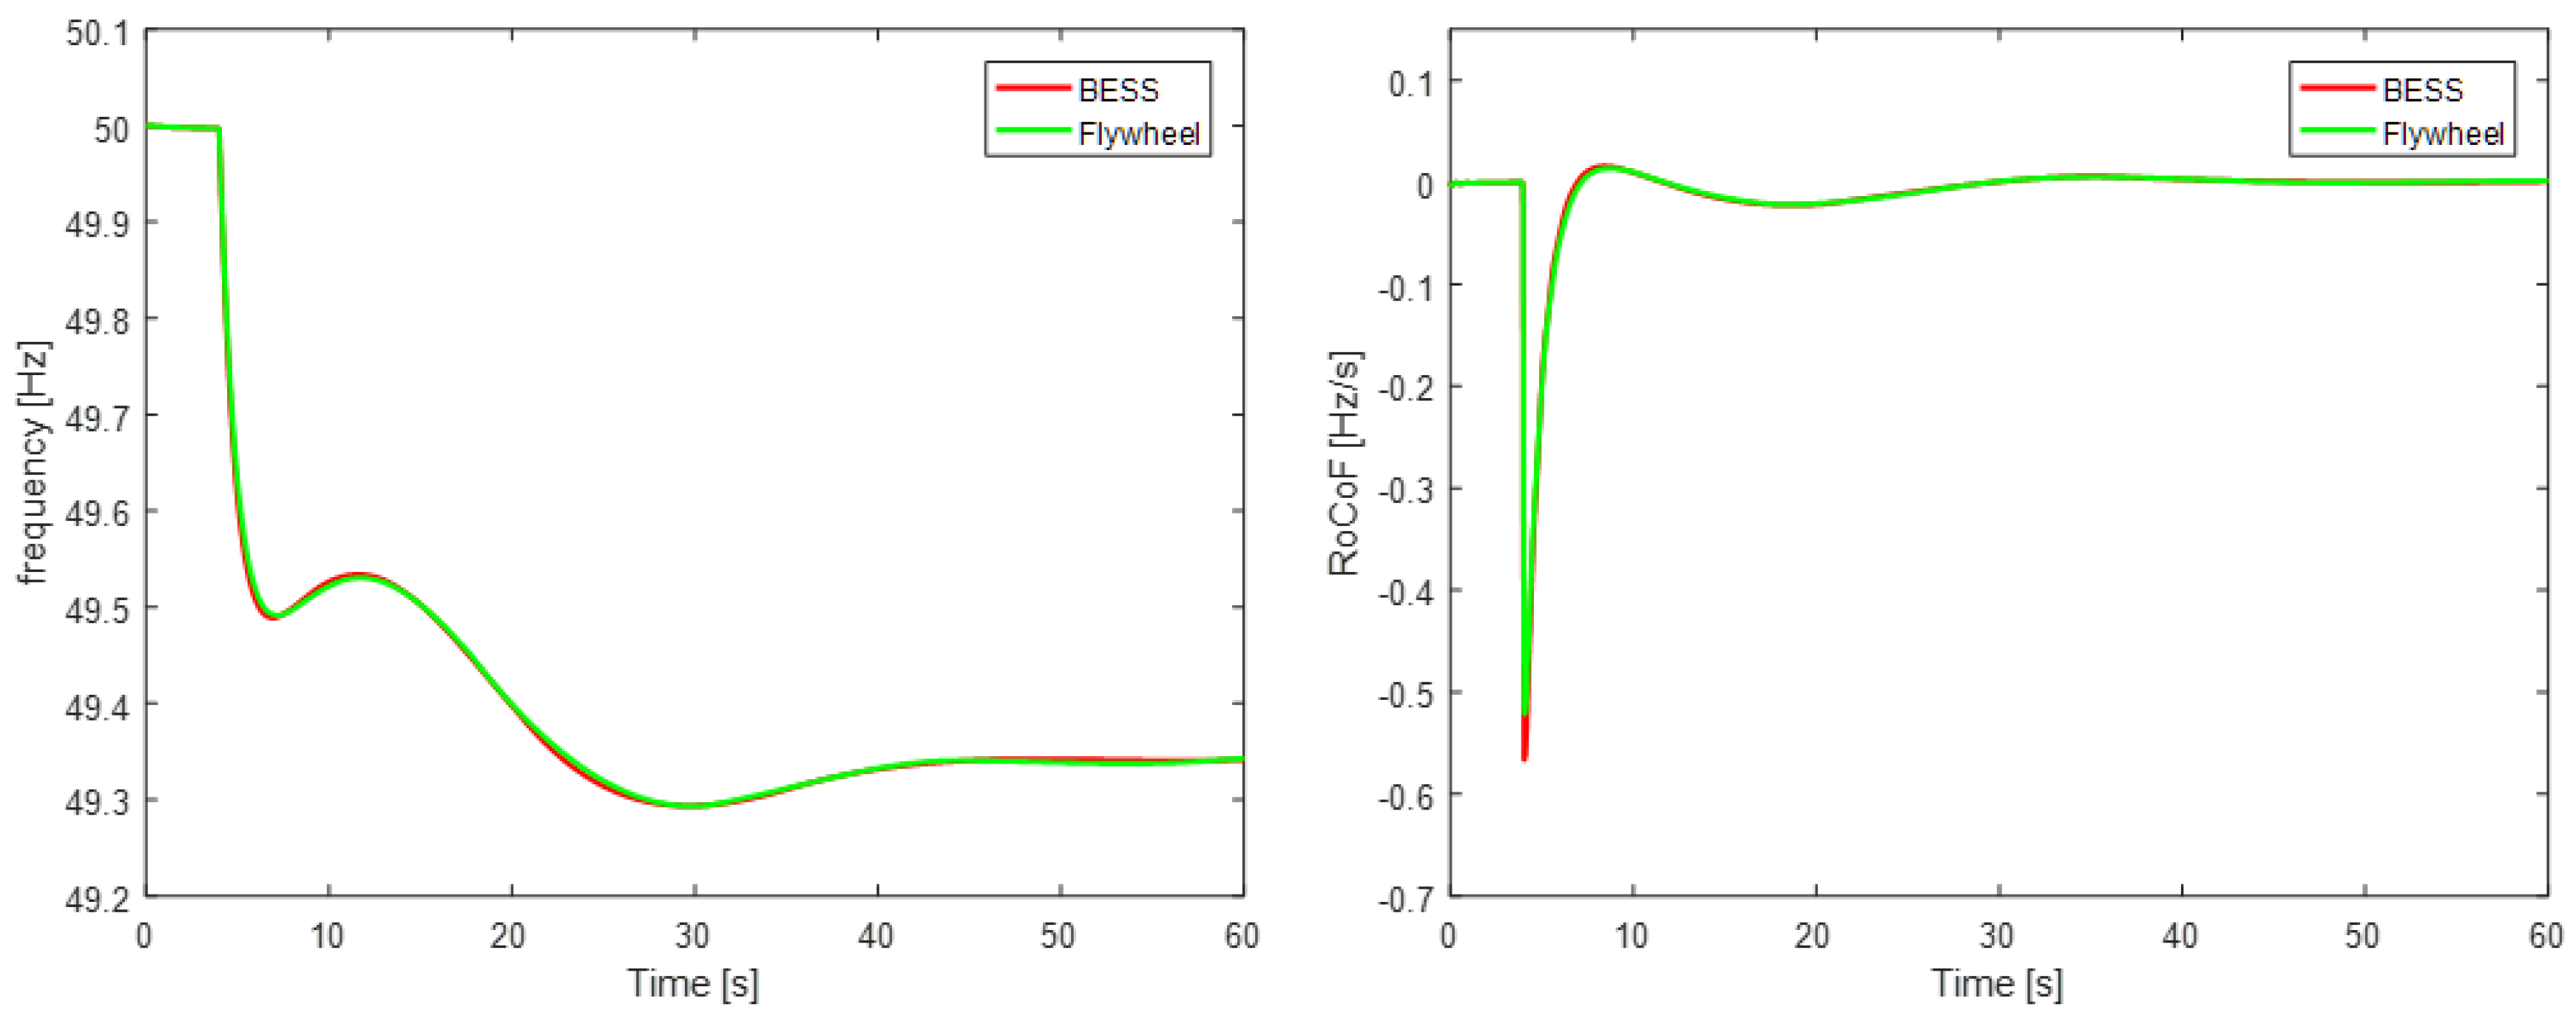
The simulation results proved that using a BESS for this purpose in an islanded non-interconnected island can prevent possible curtailment or load-shedding actions and is a promising solution for even higher RES penetration, ensuring grid security and stability. Similar conclusions were extracted from the analysis of using FESS for the frequency control of the island’s system, revealing that both batteries and flywheels are two energy storage technologies that guarantee the grid’s stability in a high-RES NII.

Author Contributions

Conceptualization, S.N., K.A. and P.I.; methodology, S.N. and P.I.; writing—original draft preparation, S.N.; writing—review and editing, P.I. and A.N.; supervision, N.N.; project administration, P.G. and N.N.; All authors have read and agreed to the published version of the manuscript.

Funding

This work has been carried out in the framework of the European Union’s Horizon 2020 research and innovation program under grant agreement No. 731249 (SMart IsLands Energy systems (SMILE)).

Acknowledgments

All parameters of the considered power system were kindly provided by EEM. The examined scenarios of the reference and future case were discussed and agreed with EEM. The authors thank Diogo Vasconcelos, Aires Henriques and Henrique Pinto Correia for their support and review.

Conflicts of Interest

The authors declare no conflict of interest.

Abbreviations

BESSBattery energy storage system
DFIGDouble-fed induction generator
FESSFlywheel energy storage system
GHGGreenhouse gas
ICInternal combustion engine
LCOELevelized cost of energy
NIINon-interconnected island
OPFOptimal power flow
PVPhotovoltaic
RESRenewable energy source
RMSRoot mean square
RoCoFRate of change of frequency
SGSynchronous generator
SOHState of health
STSteam turbine
TSOTransmission system operator
vRESVariable renewable energy source
WTWind turbine

Appendix A. Dynamic Models Description

The implementation of the power system’s dynamic model was carried out in Modelica/Dymola with the use of the open-source PowerSystems library [32] as the basis. Basic models such as grid lines, transformers, loads and synchronous generators were based on the PowerSystems library and others, such as synchronous generator controls, BESS, BESS controls, PV plant, WT plant and inverters, were developed from scratch. In this Appendix, the developed models are presented along with a short description regarding the most important implementation details.
Synchronous Generator and Controls
The SG of the PowerSystems library is a complete electromechanical model. As shown in Figure A1, it receives a mechanical torque and an excitation voltage as inputs and outputs voltage and current.
Figure A1. Modelica’s synchronous generator model.
Energies 13 05786 g0a1
Automatic Voltage Regulator (AVR)
The purpose of an AVR [52] is to control the voltage at the generator’s terminal and keep it at a constant, desired value. AVR IEEE T1 [53], whose diagram is shown in Figure A2, was selected.
Figure A2. Automatic voltage regulator (AVR) IEEE T1.
Energies 13 05786 g0a2
Power System Stabilizer (PSS)
In order to increase the damping of rotor oscillation caused by a disturbance [54], an IEEE type PSS1A power system stabilizer [55] was developed, based on Figure A3.
Figure A3. IEEE PSS1A.
Energies 13 05786 g0a3
Turbine Governors (TG)
To properly simulate the mechanical reactions of synchronous generators, it was necessary to use turbine governor models for all power plant types [56]. Figure A4, Figure A5 and Figure A6 show the schematic diagrams of TG for all types of power plants.
Figure A4. Hydro turbine governor type GovHydroIEEE0 (adopted by [57]).
Energies 13 05786 g0a4
Figure A5. Steam turbine governor (adopted by [58]).
Energies 13 05786 g0a5
Figure A6. Diesel turbine governor (adopted by [57]).
Energies 13 05786 g0a6
Average Inverter Model
RES and BESS are interfaced with the three-phase AC grid through an average inverter model presented in Figure A7 [59,60].
Figure A7. Modelica’s average inverter model.
Energies 13 05786 g0a7
Photovoltaic Power Plant
As a result of the investigations and discussions, a key simplification that could be applied in a central station PV system model is that the dynamics related to the DC side of the inverter (PV array dynamics, inverter DC link and voltage regulator) shall be ignored [61]. Therefore, according to the above, the developed solar plant consists of a DC voltage source along with an average inverter to connect it to the three-phase grid, as presented in Figure A8.
Figure A8. Modelica’s photovoltaic (PV) model.
Energies 13 05786 g0a8
Wind Power Plant
The double-fed induction generator (DFIG) developed wind turbine model is shown in Figure A9 [62].
Figure A9. Modelica’s ddouble-fed induction generator (DFIG) model.
Energies 13 05786 g0a9
Battery Energy Storage System (BESS)
A lithium-ion battery module was developed in order to simulate the BESS operation and calculate important BESS parameters, i.e., state of charge (SOC), terminal voltage, etc. The battery was modeled based on its equivalent electrical circuit in [63], consisting of a voltage source in series with its internal impedance. The latter is represented as a two-series resistor and two RC networks. The developed module is presented in Figure A10.
Figure A10. Modelica’s lithium-ion model.
Energies 13 05786 g0a10
Flywheel Energy Storage System (FESS)
The developed flywheel storage model is presented in Figure A11.
Figure A11. Flywheel energy storage system (FESS) model.
Energies 13 05786 g0a11

References

  1. Amanatidis, G. European Policies on Climate and Energy towards 2020, 2030 and 2050; European Parliament: Brussels, Belgium, 2019.
  2. IRENA Transforming Small-Island Power Systems: Technical Planning Studies for the Integration of Variable Renewables; International Renewable Energy Agency: Abu Dhabi, UAE, 2018.
  3. Lovegrove, K.; James, G.; Leitch, D.; Ngo, A.M.A.; Rutovitz, J.; Watt, M.; Wyder, J. Comparison of Dispatchable Renewable Electricity Options—Technologies for an Orderly Transition; Australian Renewable Energy Agency: Canberra, Australia, 2018.
  4. Denholm, P.; Ela, E.; Kirby, B.; Milligan, M. The Role of Energy Storage with Renewable Electricity Generation; National Renewable Energy Laboratory: Golden, CO, USA, 2010.
  5. Brivio, C.; Mandelli, S.; Merlo, M. Battery energy storage system for primary control reserve and energy arbitrage. Sustain. Energy Grids Netw. 2016, 6, 152–165. [Google Scholar] [CrossRef]
  6. Psarros, G.N.; Papathanassiou, S.A. A unit commitment method for isolated power systems employing dual minimum loading levels to enhance flexibility. Electr. Power Syst. Res. 2019, 177, 106007. [Google Scholar] [CrossRef]
  7. Serban, I.; Marinescu, C. Control Strategy of Three-Phase Battery Energy Storage Systems for Frequency Support in Microgrids and with Uninterrupted Supply of Local Loads. IEEE Trans. Power Electron. 2014, 29, 5010–5020. [Google Scholar] [CrossRef]
  8. Kerdphol, T.; Rahman, F.S.; Watanabe, M.; Mitani, Y.; Turschner, D.; Beck, H.-P. Enhanced Virtual Inertia Control Based on Derivative Technique to Emulate Simultaneous Inertia and Damping Properties for Microgrid Frequency Regulation. IEEE Access 2019, 7, 14422–14433. [Google Scholar] [CrossRef]
  9. Sanduleac, M.; Toma, L.; Eremia, M.; Boicea, V.A.; Sidea, D.; Mandis, A. Primary Frequency Control in a Power System with Battery Energy Storage Systems. In Proceedings of the 2018 IEEE International Conference on Environment and Electrical Engineering and 2018 IEEE Industrial and Commercial Power Systems Europe (EEEIC/I&CPS Europe), Palermo, Italy, 12–15 June 2018; p. 5. [Google Scholar]
  10. Zeraati, M.; Hamedani Golshan, M.E.; Guerrero, J.M. Distributed Control of Battery Energy Storage Systems for Voltage Regulation in Distribution Networks with High PV Penetration. IEEE Trans. Smart Grid 2018, 9, 3582–3593. [Google Scholar] [CrossRef] [Green Version]
  11. Singh, B.; Hussain, Z. Application of Battery Energy Storage System (BESS) in voltage control and damping of power oscillations. In Proceedings of the 2010 5th International Conference on Industrial and Information Systems, Mangalore, India, 29 June–1 August 2010; IEEE: Mangalore, India, 2010; pp. 514–519. [Google Scholar]
  12. Krata, J.; Saha, T.K. Real-Time Coordinated Voltage Support with Battery Energy Storage in a Distribution Grid Equipped With Medium-Scale PV Generation. IEEE Trans. Smart Grid 2019, 10, 3486–3497. [Google Scholar] [CrossRef]
  13. Li, X.; Zhang, D. Coordinated Control and Energy Management Strategies for Hundred Megawatt-level Battery Energy Storage Stations Based on Multi-agent Theory. In Proceedings of the 2018 International Conference on Advanced Mechatronic Systems (ICAMechS), Zhengzhou, China, 30 August–2 September 2018; IEEE: Zhengzhou, China, 2018; pp. 1–5. [Google Scholar]
  14. Teleke, S.; Baran, M.E.; Bhattacharya, S.; Huang, A.Q. Rule-Based Control of Battery Energy Storage for Dispatching Intermittent Renewable Sources. IEEE Trans. Sustain. Energy 2010, 1, 117–124. [Google Scholar] [CrossRef]
  15. Zheng, Y.; Dong, Z.Y.; Luo, F.J.; Meng, K.; Qiu, J.; Wong, K.P. Optimal Allocation of Energy Storage System for Risk Mitigation of DISCOs With High Renewable Penetrations. IEEE Trans. Power Syst. 2014, 29, 212–220. [Google Scholar] [CrossRef]
  16. Nikolic, D.; Negnevitsky, M. Adding Inertia to Isolated Power Systems for 100% Renewable Operation. Energy Procedia 2019, 159, 460–465. [Google Scholar] [CrossRef]
  17. Brown, T.; Ackermann, T.; Martensen, N. Solar Power Integration on the Seychelles Islands. Field Actions Sci. Rep. 2016, 46–53. [Google Scholar]
  18. Merino, J.; Veganzones, C.; Sanchez, J.A.; Martinez, S.; Platero, C.A. Power System Stability of a Small Sized Isolated Network Supplied by a Combined Wind-Pumped Storage Generation System: A Case Study in the Canary Islands. Energies 2012, 5, 2351–2369. [Google Scholar] [CrossRef] [Green Version]
  19. Cha, S.T.; Wu, Q.; Zhao, H.; Wang, C. Frequency Control for Island Operation of Bornholm Power System. Energy Procedia 2014, 61, 1389–1393. [Google Scholar] [CrossRef] [Green Version]
  20. Pillai, J.R.; Bak-Jensen, B. Vehicle-to-Grid for islanded power system operation in Bornholm. In Proceedings of the IEEE PES General Meeting, Minneapolis, MN, USA, 25–29 July 2010; IEEE: Minneapolis, MN, USA, 2010; pp. 1–8. [Google Scholar]
  21. Mosca, C.; Arrigo, F.; Mazza, A.; Bompard, E.; Carpaneto, E.; Chicco, G.; Cuccia, P. Mitigation of frequency stability issues in low inertia power systems using synchronous compensators and battery energy storage systems. IET Gener. Transm. Distrib. 2019, 13, 3951–3959. [Google Scholar] [CrossRef]
  22. Margaris, I.; Hansen, A.; Srensen, P.; Cutululis, N.; Hatziargyriou, N. Operation and Control of Wind Farms in Non-Interconnected Power Systems. In Wind Farm-Impact in Power System and Alternatives to Improve the Integration; Suvire, G.O., Ed.; InTech: London, UK, 2011; ISBN 978-953-307-467-2. [Google Scholar]
  23. Tselepis, S.; Neris, A. Dynamic Behaviour of the Autonomous Grid of the Island of Kythnos, Greece, Due to Large Penetration of PV and Wind Systems. In Proceedings of the 20th European Photovoltaic Solar energy Conference and Exhibition, Barcelona, Spain, 6–10 June 2005. [Google Scholar]
  24. Xin, H.; Zhou, F.; Yang, H.; Wang, Z.; Gan, D.; Huang, M. The operation and control of an Island power system. In Proceedings of the 2012 IEEE Power and Energy Society General Meeting, San Diego, CA, USA, 22–26 July 2012; IEEE: San Diego, CA, USA, 2012; pp. 1–6. [Google Scholar]
  25. Sebastián, R. Battery energy storage for increasing stability and reliability of an isolated Wind Diesel power system. IET Renew. Power Gener. 2017, 11, 296–303. [Google Scholar] [CrossRef]
  26. Zhang, T.; Orr, J.A.; Eigeles, A. Emanuel Adaptable Energy Storage System Control for Microgrid Stability enhancement. In Proceedings of the 2018 IEEE Power & Energy Society General Meeting (PESGM), Portland, OR, USA, 5–10 August 2018; pp. 1–5. [Google Scholar]
  27. Misyris, G.; Chatzivasileiadis, S.; Weckesser, T. Zero-inertia Systems: Sufficient Conditions for Phasor Modeling. arXiv 2020, arXiv:200211209. [Google Scholar]
  28. North American Electric Reliability Corporation. Reliability Guideline-Application Guide for Modeling Turbine-Governor and Active Power-Frequency Controls in Interconnection-Wide Stability Studies; North American Electric Reliability Corporation: Atlanta, Georgia, 2019. [Google Scholar]
  29. Tiller, M. Introduction to Physical Modeling with Modelica; Kluwer Academic Publishers: New York, NY, USA, 2001; ISBN 978-1-4615-1561-6. [Google Scholar]
  30. Fritzson, P.; Pop, A.; Asghar, A.; Bachmann, B.; Braun, W.; Braun, R.; Buffoni, L.; Casella, F.; Castro, R.; Danós, A.; et al. The OpenModelica Integrated Modeling, Simulation, and Optimization Environment. In Proceedings of the 1st American Modelica Conference, Cambridge MA, USA, 9–10 October 2018; pp. 206–219. [Google Scholar]
  31. Winkler, D. Electrical Power System Modelling in Modelica—Comparing Open-source Library Options. In Proceedings of the 58th Conference on Simulation and Modelling (SIMS 58), Reykjavik, Iceland, 25–27 September 2017; pp. 263–270. [Google Scholar]
  32. Franke, R.; Wiesmann, H. Flexible modeling of electrical power systems—The Modelica PowerSystems library. In Proceedings of the 10th International Modelica Conference, Lund, Sweden, 10–12 March 2014; pp. 515–522. [Google Scholar]
  33. Baudette, M.; Castro, M.; Rabuzin, T.; Lavenius, J.; Bogodorova, T.; Vanfretti, L. OpenIPSL: Open-Instance Power System Library—Update 1.5 to “iTesla Power Systems Library (iPSL): A Modelica library for phasor time-domain simulations”. SoftwareX 2018, 7, 34–36. [Google Scholar] [CrossRef]
  34. Miguel, M.; Nogueira, T.; Martins, F. Energy storage for renewable energy integration: The case of Madeira Island, Portugal. Energy Procedia 2017, 136, 251–257. [Google Scholar] [CrossRef]
  35. Izquierdo, P.; Vazquez, V.; Santos, J.M.; Margo, C. Optimization of Isolate Hybrid Photovoltaic and Wind Energy Instalations in Madeira Islands (Portugal). Adv. Ecol. Environ. Res. 2017, 2, 265–280. [Google Scholar]
  36. Hashmi, M.U.; Pereira, L.; Bušić, A. Energy Storage in Madeira, Portugal: Co-optimizing for Arbitrage, Self-Sufficiency, Peak Shaving and Energy Backup. arXiv 2019, arXiv:190400463. [Google Scholar]
  37. Milano, F.; Vanfretti, L. State of the art and future of OSS for power systems. In Proceedings of the 2009 IEEE Power & Energy Society General Meeting, Calgary, AB, Canada, 26–30 July 2009; IEEE: Calgary, AB, Canada, 2009; pp. 1–7. [Google Scholar]
  38. Kroposki, B.; Johnson, B.; Zhang, Y.; Gevorgian, V.; Denholm, P.; Hodge, B.-M.; Hannegan, B. Achieving a 100% Renewable Grid: Operating Electric Power Systems with Extremely High Levels of Variable Renewable Energy. IEEE Power Energy Mag. 2017, 15, 61–73. [Google Scholar] [CrossRef]
  39. Undrill, J. Primary Frequency Response and Control of Power System Frequency; Energy Analysis and Environmental Impacts Division; Lawrence Berkeley National Laboratory: Berkeley, CA, USA, 2018. [Google Scholar]
  40. Rezkalla, M.; Pertl, M.; Marinelli, M. Electric power system inertia: Requirements, challenges and solutions. Electr. Eng. 2018, 100, 2677–2693. [Google Scholar] [CrossRef] [Green Version]
  41. ENTSO-E. Rate of Change of Frequency (RoCoF) Withstand Capability; ENTSO-E: Brussels, Belgium, 2018. [Google Scholar]
  42. Hatziargyriou, N. Microgrids: Architectures and Control; John Wiley & Sons: Hoboken, NJ, USA, 2014; ISBN 978-1-118-72067-7. [Google Scholar]
  43. Kerdphol, T.; Rahman, F.; Mitani, Y. Virtual Inertia Control Application to Enhance Frequency Stability of Interconnected Power Systems with High Renewable Energy Penetration. Energies 2018, 11, 981. [Google Scholar] [CrossRef] [Green Version]
  44. Zimmerman, R.D.; Murillo-Sanchez, C.E.; Thomas, R.J. MATPOWER: Steady-State Operations, Planning, and Analysis Tools for Power Systems Research and Education. IEEE Trans. Power Syst. 2011, 26, 12–19. [Google Scholar] [CrossRef] [Green Version]
  45. Wester, C.; Smith, T.; Theron, J.; McGinn, D. Developments in fast load shedding. In Proceedings of the 2014 67th Annual Conference for Protective Relay Engineers, College Station, TX, USA, 31 March–3 April 2014; IEEE: College Station, TX, USA, 2014; pp. 779–784. [Google Scholar]
  46. Beires, P.; Moreira, C.; Lopes, J.A.P.; Figueira, A. The need of synchronous inertia in autonomous power systems with increasing shares of renewables—The study case of Madeira Island’s hybrid power system. In Proceedings of the 3rd International Hybrid Power Systems Workshop, Tenerife, Spain, 8–9 May 2018. [Google Scholar]
  47. Electricidade da Madeira, E. Network Characterization—Medium and High Voltage. Available online: https://www.eem.pt/media/412438/caract_sepm_2018.pdf (accessed on 1 March 2019).
  48. Abreu, S.R.; Barreto, C.; Morgado-Dias, F. Renewable Energy Characterization of Madeira Island; Portuguese Conference on Automatic Control Controlo: Funchal, Portugal, 2012; p. 6. [Google Scholar]
  49. Kundur, P.; Balu, N.J.; Lauby, M.G. Power System Stability and Control; The EPRI Power System Engineering Series; McGraw-Hill: New York, NY, USA, 1994; ISBN 978-0-07-035958-1. [Google Scholar]
  50. Tleis, N.D. Power Systems Modelling and Fault Analysis: Theory and Practice, 1st ed.; Elsevier: Amsterdam, The Netherlands, 2008; ISBN 978-0-7506-8074-5. [Google Scholar]
  51. Mongird, K.; Viswanathan, V.V.; Balducci, P.J.; Alam, M.J.E.; Fotedar, V.; Koritarov, V.S.; Hadjerioua, B. Energy Storage Technology and Cost Characterization Report; Pacific Northwest National Lab. (PNNL): Richland, WA, USA, 2019; pp. PNNL-28866, 1573487. [Google Scholar]
  52. Hoong, C.S.; Taib, S.; Rao, K.S.; Daut, I. Development of automatic voltage regulator for synchronous generator. In Proceedings of the PECon 2004, National Power and Energy Conference, Kuala Lumpur, Malaysia, 29–30 November 2004; IEEE: Kuala Lumpur, Malaysia, 2004; pp. 180–184. [Google Scholar]
  53. Institute of Electrical and Electronics Engineers. IEEE Recommended Practice for Excitation System Models for Power System Stability Studies; IEEE: New York, NY, USA, 2016; ISBN 978-1-5044-0855-4. [Google Scholar]
  54. Razali, N.M.M.; Ramachandaramurthy, V.K.; Mukerjee, R.N. Power System Stabilizer Placement and Tuning Methods for Inter-area Oscillation Damping. In Proceedings of the 2006 IEEE International Power and Energy Conference, Putra Jaya, Malaysia, 28–29 November 2006; IEEE: Putra Jaya, Malaysia, 2006; pp. 173–178. [Google Scholar]
  55. Liu, S.; Messina, A.R.; Vittal, V. A Normal Form Analysis Approach to Siting Power System Stabilizers (PSSs) and Assessing Power System Nonlinear Behavior. IEEE Trans. Power Syst. 2006, 21, 1755–1762. [Google Scholar] [CrossRef]
  56. Power System Dynamic Performance Committee. Dynamic Models of Turbine-Governors in Power System Studies; IEEE Power & Energy Society: Piscataway Township, NJ, USA, 2013. [Google Scholar]
  57. NEPLAN. Standard Dynamic Turbine-Governor Systems in NEPLAN Power System Analysis Tool; NEPLAN: Küsnacht, Switzerland, 2015. [Google Scholar]
  58. Goswami, U.; Sadhu, P.K.; Chakraborty, S. Enhancement of controllability to improve the transient performance for captive power plant in islanding condition: A case of study. Int. J. Electr. Power Energy Syst. 2016, 83, 188–202. [Google Scholar] [CrossRef]
  59. Jankovic, Z.; Novakovic, B.; Bhavaraju, V.; Nasiri, A. Average modeling of a three-phase inverter for integration in a microgrid. In Proceedings of the 2014 IEEE Energy Conversion Congress and Exposition (ECCE), Pittsburgh, PA, USA, 14–18 September 2014; IEEE: Pittsburgh, PA, USA, 2014; pp. 793–799. [Google Scholar]
  60. Mahamat, C.; Petit, M.; Marquant, R.; Gautier, C.; Mami, A.; Costa, F. Decoupled PQ control applied to a multicellular parallel inverter for grid-connected photovoltaic system. In Proceedings of the 2016 17th International Conference on Sciences and Techniques of Automatic Control and Computer Engineering (STA), Sousse, Tunisia, 19–21 December 2016; IEEE: Sousse, Tunisia, 2016; pp. 455–460. [Google Scholar]
  61. Ellis, A.; Behnke, M.R.; Elliott, R.T. Generic Solar Photovoltaic System Dynamic Simulation Model Specification; Sandia National Laboratories: Albuquerque, NM, USA, 2013. [Google Scholar]
  62. Qiao, W. Dynamic modeling and control of doubly fed induction generators driven by wind turbines. In Proceedings of the 2009 IEEE/PES Power Systems Conference and Exposition, Seattle, WA, USA, 15–18 March 2009; IEEE: Seattle, WA, USA, 2009; pp. 1–8. [Google Scholar]
  63. Erdinc, O.; Vural, B.; Uzunoglu, M. A dynamic lithium-ion battery model considering the effects of temperature and capacity fading. In Proceedings of the 2009 International Conference on Clean Electrical Power, Capri, Italy, 9 June 2009; IEEE: Capri, Italy, 2009; pp. 383–386. [Google Scholar]
Figure 1. Typical power system frequency response to a sudden loss of generation.
Energies 13 05786 g001
Figure 2. Implemented battery energy storage system (BESS)’s inverter control.
Energies 13 05786 g002
Figure 3. Illustration of the following methodology.
Energies 13 05786 g003
Figure 4. Resulting best and worst cases from the yearly optimal power flow (OPF) of the reference scenario.
Energies 13 05786 g004
Figure 5. Resulting best and worst cases from the yearly OPF of the future scenario.
Energies 13 05786 g005
Figure 6. Madeira’s power system model in Modelica/Dymola.
Energies 13 05786 g006
Figure 7. Load step-change frequency response and rate of change of frequency (RoCoF) for the best case of the reference scenario.
Energies 13 05786 g007
Figure 8. Load step-change frequency response and RoCoF for the worst case of the reference scenario.
Energies 13 05786 g008
Figure 9. Load step-change frequency response and RoCoF for the best case of the future scenario.
Energies 13 05786 g009
Figure 10. Load step-change frequency response and RoCoF for the worst case of the future scenario.
Energies 13 05786 g010
Figure 11. Load step-change frequency response and RoCoF for the future best case with the BESS installation.
Energies 13 05786 g011
Figure 12. Load step-change frequency response and RoCoF for the future worst case with the BESS installation.
Energies 13 05786 g012
Figure 13. Contribution of the BESS to the system response of a load step-change for the best and worst cases.
Energies 13 05786 g013
Figure 14. Generation loss frequency response and RoCoF for the best cases of the reference, future and future with BESS scenarios.
Energies 13 05786 g014
Figure 15. Generation loss frequency response and RoCoF for the worst cases for the reference, future and future with BESS scenarios.
Energies 13 05786 g015
Figure 16. Short-circuit frequency response and RoCoF for the best cases of the reference, future and future with BESS scenarios.
Energies 13 05786 g016
Figure 17. Short-circuit frequency response and RoCoF for the worst cases of the reference, future and future with BESS scenarios.
Energies 13 05786 g017
Figure 18. Short-circuit frequency response of the hydro generation unit for the best case of the reference scenario.
Energies 13 05786 g018
Figure 19. Frequency response and RoCoF for reference, future and future with BESS cases.
Energies 13 05786 g019
Table 1. Reference case production units’ description.
TypeInst. Power (MWe)Generator UnitsDescription/Comments
Thermal136.0012 ICDiesel
54.403 IC—1 STCombined-cycle natural gas
Hydro47.1718-
Solid waste8.001 ST-
Wind45.11--
Solar19.10--
Table 2. Future case production units’ description.
TypeIns. Power (MWe)Generator UnitsDescription/Comments
Thermal13612 ICDiesel
54.43 IC—1 STCombined-cycle natural gas
Hydro88.2518-
Solid waste81 ST-
Wind70.11--
Solar69.1--
Storage 15-10 MWhe
Table 3. Operating conditions for the best and worst cases of the reference scenario.
TypeDescription/CommentsBest Case (Instantaneous vRES Penetration 0.35%) (MWe)Generator Units (-)Worst Case (Instantaneous vRES Penetration 35.5%) (MWe)Generator Units (-)
Conventional unitsCombined-cycle natural gas29.194--
Diesel68.851030.615
Hydro24.02163.282
Solid waste5.2315.421
Inverter-based unitsPV----
Wind0.42-21.62-
Table 4. Operating conditions for the best and worst cases of the future scenario.
TypeDescription/CommentsBest Case (Instantaneous vRES Penetration 0.1%) (MWe)Generator Units (-)Worst Case (Instantaneous vRES Penetration 78.8%) (MWe)Generator Units (-)
Conventional unitsCombined-cycle natural gas28.554--
Diesel69.391111.252
Hydro42.92136.641
Solid waste1.5615.211
Inverter-based unitsPV--50.65-
Wind0.14-35.13-
Table 5. Primary reserve and inertia for the reference and future cases.
Reference CaseFuture Case
BestWorstBestWorst
Primary reserve (thermal) (MWe)54.4224.9565.5810.97
Primary reserve (hydro) (MWe)18.61.9231.980.36
Primary reserve (total) (MWe)73.0226.8797.5611.33
Total inertia (pu)4.864.864.854.85
Online inertia (pu)4.001.364.170.65
Table 6. Results for the best cases of the reference and future scenarios.
Load Step-ChangeReference/Future/Future with BESS Scenarios
2 MWe4 MWe6 MWe8 MWe
Min. RoCoF (Hz/s)−0.08/−0.064/−0.005−0.16/−0.12/−0.1−0.23/−0.18/−0.14−0.3/−0.23/−0.18
Max. RoCoF (Hz/s)0.008/0.006/0.0030.016/0.013/0.0070.024/0.02/0.0110.03/0.027/0.015
Min. frequency (Hz)49.95/49.95/49.9649.90/49.91/49.9349.86/49.87/49.8949.82/49.84/49.87
Max. frequency (Hz)50/50/5050/50/5050/50/5050/50/50
New steady-state frequency (Hz)49.96/49.96/49.9749.93/46.92/49.9349.88/49.88/49.9049.85/49.85/49.87
Resulting issuesNONE/NONE/NONENONE/NONE/NONENONE/NONE/NONENONE/NONE/NONE
Table 7. Results for the worst cases of the reference and future scenarios.
Load Step-ChangeReference/Future/Future with BESS Scenarios
2 MWe4 MWe6 MWe8 MWe
Min. RoCoF (Hz/s)−0.31/−0.54/−0.18−0.61/−1.07/−0.35−0.88/−1.56/−0.53−1.14/−2.02/−0.68
Max. RoCoF (Hz/s)0.037/0.1/0.0080.07/0.19/0.0090.10/0.28/0.0150.14/0.38/0.02
Min. frequency (Hz)49.78/48.4/49.8249.55/46.51/49.6449.26/0/49.4648.93/0/49.30
Max. frequency (Hz)50/50/5050/50/5050/50/5050/50/50
New steady-state frequency (Hz)49.78/48.4/49.8549.57/46.51/49.6749.26/0/49.5048.93/0/49.37
Resulting issuesNONE/NONE/NONENONE/NONE/NONENONE/system collapse/NONENONE/load-shedding-system Collapse/NONE
Table 8. Results of generation loss for all scenarios and cases.
Reference CaseFuture CaseFuture Case BESS
Best CaseWorst CaseBest CaseWorst CaseBest CaseWorst Case
Min. RoCoF (Hz/s)−1.00−1.25−0.73−3.69−0.64−0.98
Max. RoCoF (Hz/s)0.150.170.1100.040.09
Min. frequency (Hz)49.1848.9249.36049.4048.87
Max. frequency (Hz)505050505050
New steady-state frequency (Hz)49.1848.9249.36049.4049.03
Resulting issuesNONENONENONELoad-shedding/system collapseNONENONE
Table 9. Results of three-phase short-circuit (3ph) short-circuit for all scenarios and cases.
Reference CaseFuture CaseFuture Case BESS
Best CaseWorst CaseBest CaseWorst CaseBest CaseWorst Case
Min. RoCoF (Hz/s)−2.73−3.08−2.79−6.69−3.11−4.27
Max. RoCoF (Hz/s)3.606.123.094.323.533.22
Min. frequency (Hz)49.8249.6949.8949.1849.9149.82
Max. frequency (Hz)50.3950.9150.3250.9950.3550.24
New steady-state frequency (Hz)49.995050505050
Resulting issuesNONENONENONENONENONENONE
Publisher’s Note: MDPI stays neutral with regard to jurisdictional claims in published maps and institutional affiliations.

