Abstract
This paper presents test results of thermal treatment (combustion) of meat and bone meal (MBM) within the context of an animal waste utilization plant. The test facility was equipped with a rotating combustion chamber. The energy and ecological aspects of the operation of this facility were analyzed. This article assesses the impact of the tested system on the natural environment with regard to the emission of pollutants into the atmosphere. In accordance with the chemical composition of the incinerated waste, the following compounds were analyzed: CO, NOx (nitrogen oxides), SO2, HCl, HF, TOC (total organic carbon) and dust. The concentrations recorded in periods of 0.5 and 24 h were in compliance with the admissible levels defined by European Union directives. An analysis of the energy efficiency of the energy recovery system used, which produces saturated steam for the technological needs of the utilization plant, was also carried out. The conditions for the achieved ecological and energy parameters were analyzed and presented synthetically using the multicriteria assessment method, with a simultaneous Pareto principle determination of the process optimum. The results of the research and the analyses of ecological and performance parameters presented in the paper may prove helpful in the design and operation of systems for thermal treatment of waste equipped with a rotating combustion chamber and other types of furnaces.
1. Introduction
Meat and bone meal (MBM) is a byproduct generated during the treatment of carrion and animal waste. The production process consists of boiling waste under pressure, drying the obtained pulp and separating the fat by pressing or extraction. For many years, MBM was the main component of animal feed. However, since the Bovine Spongiform Encephalopathy (BSE) crisis, the use of MBM as a protein-rich supplement for cattle feed has been limited in Europe [1], the US and Canada [2]. Animal waste is now divided into three categories [3]. Category 1 includes animals suspected of BSE infection; animals killed during BSE control measures; animals other than farm and wild animals (i.e., domestic animals, zoo-kept animals and circus animals); and wild animals suspected of being infected with human or animal infectious diseases. High-risk animal waste which is not classified as Category 1 is classified as Category 2. This includes animal byproducts that contain residues of permissible substances or contaminants that exceed permissible levels, or animals that died on farms or on animal-breeding farms. Category 3 classifies low-risk material from safe animals. MBM produced from Category 3 waste can be used as feed and agricultural fertilizer.
The above category determination has caused a drastic drop in MBM sales. A particular problem concerns Category 1 and 2 meal. Large quantities of this meal have been found both at MBM production facilities and in landfills [4]. One acceptable method for its utilization is in thermal treatment technologies. The literature review shows that different aspects of the thermal recycling of MBM [5,6,7,8,9,10], like combustion, pyrolysis and gasification, have been studied in many types in reactors, such as fixed reactors and fluidized bed reactors. The effect of adding MBM (co-combustion) to coal, peat or chicken litter during combustion processes has been tested [11,12,13,14,15,16,17,18,19,20]. In most of the studies performed, the co-combustion of MBM with coal was carried out in fluidized bed reactors with a continuous feed by means of a screw feeder. The levels of PCDD/F (polychlorinated dibenzofurans), SO2, NOx, CO and SO2 emissions were within the limits established by international regulations.
This article examines the complex multiparameter process of MBM incineration. The process must meet the needs of the MBM manufacturer and the legal requirements for sanitary safety and environmental protection. The facility must meet three basic criteria: it must utilize MBM Category 1 and 2 in a safe manner, produce the right amount of technologically saturated steam and provide proper emission of gaseous pollutants into the atmosphere. The present research was carried out on an industrial scale in a large MBM utilization plant. The unique point of this study is the fact that MBM is the only waste (100%) incinerated (in a rotary kiln).
An important innovation of this paper is the use of multidimensional analysis in order to obtain the optimal working area of the above-mentioned facility.
2. Management of MBM
A company dealing with animal waste processing needs large amounts of heat for technological purposes, as well as for heating, cooling and ventilation installations. The company plant’s total heat power requirement was 3.5 MW. The main recipients of heat are technological lines that use saturated steam and hot water (90 °C). In the past, heat was produced using natural gas-fired boilers (thermal capacity was 4.0 MW).
In this plant, an MBM incinerator with a rotary kiln was built. The dimensions of the combustion and afterburning chambers, as well as the system capacity, were determined in accordance with British Standard BS 3316 [21,22,23,24]. The exhaust gas temperature in the afterburning chamber had to be not less than 850 °C. The exhaust gas retention time had to be not less than 2 s. The incineration installation used a steam recovery boiler. Its task was to recover the heat energy contained in the flue gas by generating saturated steam for technological purposes. Another important task of this boiler was to lower the exhaust gas temperature to approximately 220 °C; that is, to level allowing for the proper operation of the exhaust gas treatment systems.
The location of the MBM combustion installation at the technological plant allowed for the direct use of the generated saturated steam for technological purposes. Such a system is characterized by low energy losses. After modernization, the MBM installation is the main source of heat. Gas steam boilers are used in emergency situations only.
3. Description of the Technology and Measurement System
3.1. Thermal Treatment Technology
The tested MBM combustion installation (Figure 1) consisted of a continuous loading section, the rotary kiln (the primary combustion chamber), the afterburning chamber (the secondary combustion chamber), the recovery steam boiler and a section with exhaust gas treatment systems.
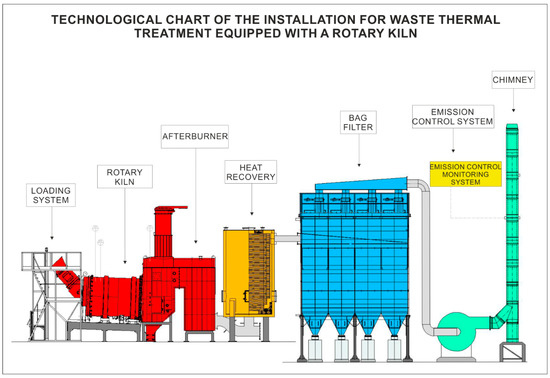
Figure 1.
The waste incineration system with heat recovery.
The MBM loading speed was controlled automatically. Loading was suspended in the event of excessively high temperatures, or if the concentration of pollutants in the exhaust gas exceeded the limit values. Loading was also suspended when the required minimum temperature of 850 °C was not reached. In this case, the auxiliary burners were started.
The solid waste was gasified in the combustion chamber. The rotational speed of the combustion chamber could be varied from one to ten revolutions per hour. It was also possible to suspend the rotation periodically. The rotational speed was selected to maximize ash burning and reduce dust emissions. A negative pressure of −50 Pa was maintained in the combustion chamber.
In the secondary combustion chamber, the gases were oxidized to end products. The dimensions of the secondary chamber were calculated to ensure that the flue gases remained therein for a minimum of 2 s (at a temperature of at least 850 °C). There was an emergency chimney on the afterburner chamber. The ash removal system was located in the lower part of the afterburner chamber.
The steam recovery boiler used the waste heat stream contained in the flue gas to generate saturated steam for technological purposes (pressure 7 bar, capacity 6 t/h). The exhaust gas temperature was lowered from 850 °C to 220 °C. It was also important to have a short cooling time to avoid the formation of dioxins.
The flue gas treatment section included a urea dosing system, a sorbent dosing system and a bag filter. The urea dosing system served to reduce NOx levels. It was located behind the afterburner chamber. The sorbent (calcium and activated carbon) dosing system with a bag filter (Teflon membranes) helped to reduce the concentration of SO2, HCl and HF, as well as dust and dioxins.
3.2. The Measurement System
The system for measuring the operating parameters of the combustion installation consisted of: inlet and outlet mass fluxes measurement, flue gas temperature measurement, pressure of saturated steam and measurement of chemical composition of discharged exhaust gases. All these parameters were recorded in a database system.
The flux measurement allowed us to take readings of the energy and mass of waste inlet flux, inlet and outlet fluxes of the heat recovery boiler and outlet flux of flue gas. Temperatures were measured in the combustion chamber, postcombustion chamber, before the recovery boiler, before the bag filter and in the chimney. The exhaust gas monitoring system was designed to measure the concentration of pollutants, as well as the hop composition and flow rate of exhaust gases. The measurement system made it possible to perform calculations based on data from the gas sample collection system and pollution analyzers. The system enables the presentation of data in the form of trend charts and reports.
4. Methodology
4.1. Purpose of the Analysis
In this study, the MBM incineration process was analyzed for ecological parameter correctness and heat recovery system efficiency. The interdependence between the levels of ecological parameters and the levels of combustion and energy efficiency was also analyzed. During the testing period, the homogeneous MBM came from one source only, i.e., from the company itself. The average chemical composition was determined by an external laboratory on the basis of a series of samples provided. An amount of 100 kg of MBM contained ash 20.15 kg, water 3.12 kg, hydrogen 6.71 kg, sulfur 0.44 kg, chlorine 0.57 kg, potassium 0.24 kg, sodium 0.57 kg, phosphorus 2.90 kg, carbon 47.21 kg, oxygen 9.68 kg and nitrogen 8.41 kg. The calorific value of this MBM was 18.42 MJ/kg.
The flue gas resulting from the thermal treatment of waste must not contain harmful substances in concentrations exceeding the permissible levels. The limits of permissible concentrations for harmful substances such as CO, NOx, HCl, HF, dust, TOC and SO2 are specified in The Waste Incineration Directive 2000/76/EC [25].
4.2. Multicriterion Evaluation of the Efficiency and Technological Correctness of the Process
The rational (optimal) control of the MBM waste incineration process should take into account the interdependence between the level of ecological parameters and the level of combustion and energy efficiency. Table 1 shows diagnostic variables relevant for the existing legal requirements and investor expectations for the object under consideration in the case of the thermal transformation of MBM. The evaluation of such a complex process is possible after creating a synthetic measure that is a function of the value of all variables that characterize it. The main problem is that individual diagnostic variables differ in their character (stimulants, destimulants, nominants) and utilize values expressed in different units. One of the methods allowing a synthetic description of complex phenomena is multidimensional analysis, leading to the determination of the measure of process development.

Table 1.
List of boundary conditions for the main parameters of the waste thermal treatment process defined for the tested object.
The parameters of the process can be divided into three types: stimulants, destimulants and nominants. Stimulants are variables for which an increase in value is assessed positively in the analyzed process (e.g., energy efficiency). Destimulants are variables for which a decrease in value is assessed positively in the analyzed process (e.g., NOx emission level). Nominants are variables for which the correct (nominal) level of the point or interval is determined, assessed positively from the point of view of the analyzed process, and then any deviations from this level up and down are evaluated negatively (e.g., pressure of the generated steam).
The column of nominal values is the so-called standard to which individual parameters should strive. Minimum or maximum columns, depending on the type of variable, determine the so-called antistandard. The general evaluation of the process consists of determining the location of all its parameters between the standard and the antistandard.
Calculation of the development process in the selected time interval requires the earlier specification of the normalized (to the range 0 ÷ 1) distance of the single diagnostic variable and then the normalized distance of the entire process from the vector defining the perfect state. For example, for energy efficiency, the value of the standards xWj (perfect condition) is 100% and the value of the antistandards xAj (the worst theoretically possible situation) is 0%. If 70% efficiency is achieved, the normalized distance dij from the ideal state is (100% − 70%)/(100% − 0%) = 0.3. However, the indicator of process development mij for this case is 1 − 0.3 = 0.7 (result for a single technological parameter in one selected period). The average of these values calculated for all technological parameters in all registered periods gives the overall measure of the process under development (total indicator of process development).
where:
- i: period number
- j: number of diagnostic variable
- xij: value of the j-th variable in the i-th period
- xWj: the value of the standard for the j-th variable
- xAj: the value of the anti-standard for the j-th variable
- n: period quantity
- wj: weight of the j-th diagnostic variable
- dij: normalized distance from the standard of the j-th diagnostic variable in the i-th period
- di: normalized distance from the standard in the i-th period
- mi: measure of process development in the i-th period
The value of the general measure of development of the process mi in the i-th period takes values from the range 0 to 1. An increase of this parameter means a general approximation of the level of the complex process to a standard that includes ideal values. In order to better analyze the process variability for the entire analyzed period, a total measure of development mtotal is calculated. In addition, the indicator is divided into two main components. The performance index mp is a measure of the development of the process, including variables related to process efficiency such as the mass flow of the waste processed and the stream of process steam per unit of time. However, the correctness index of technology mq is a measure of process development that groups parameters that characterize the quality of environmental protection and energy efficiency (not exceeding the required boundary conditions).
5. Test Results and Discussion
The chart in Figure 2 presents an analysis of one month of operation of the tested system. It also shows the trend of the index mtotal calculated based on all diagnostic variables from Table 1 and the trends of its components: the performance index mp and the indicator of meeting the boundary conditions (technological and emission) mq. During that time, the overall process score expressed with mtotal fluctuated around the average value of 0.65.
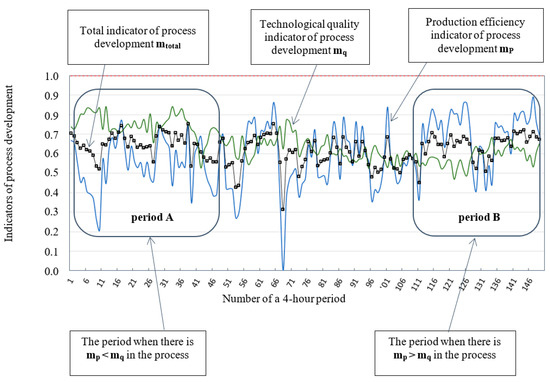
Figure 2.
Trend graph of total indicator mtotal, technological quality indicator mq and production efficiency mp of process development (4-h periods registered within 1 month).
In the analyzed period, there were short-term declining trends (e.g., ranges of 1–10 or 42–47) and growing trends (e.g., ranges of 80–86 ranges) of the index mtotal, as well as periods of process stabilization (e.g., ranges of 136–141). During the analyzed operating time of the installation, periods can be observed when the technological correctness index is greater than the process efficiency index (period A), and periods when the situation is reversed (period B).
The chart in Figure 3 is another element of the process analysis in which the possible levels of coexistence of two main criteria are assessed: mp and mq. This analysis makes it possible to indicate the optimal work area (in the sense of the so-called Pareto principle). In the analyzed system, the values of the index mp (yields) are placed on the horizontal axis and the values of index mq (meeting nominal conditions) on the vertical axis for each of the 4-h periods.
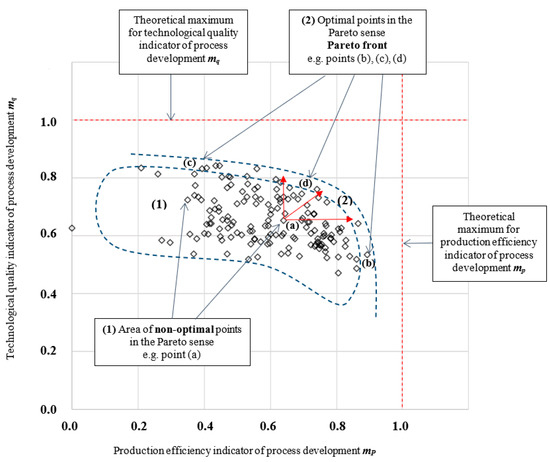
Figure 3.
Analysis of optimality in the Pareto sense (mp vs. mq for 4-h periods registered within 1 month).
The chart indicates the area (1) covering the so-called Pareto nonoptimal points. For each work point in this area, it is possible to improve one of the indicators, mp and mq, or both. For example, the point (a) with the coordinates mp = 0.640 and mq = 0.652 is suboptimal. This is the period denoted as (a) in Figure 3 and as No. 41 in Figure 2, during which the performance variables were ṁi-w = 986.8 kg/h, ṁo-ss = 4852.6 kg/h; that is, significantly below the values expected by the investor. On the other hand, despite the reduced combustion efficiency, the temperature to-fg = 1050.8 °C is definitely above the recommended level, which negatively affects the durability of the thermal insulation in the afterburner chamber. At the same time, it can be observed that during this period, there is a very high NOx concentration of 219.8 mg/m3u and high concentration of SO2 at a level of 28.2 mg/m3u). By analyzing the location of this point in the trend diagram Figure 2, it can be seen that the situation of suboptimal work resulted from a large dispersion of combustion efficiency in the preceding period (periods 28–40), which proves that the process was not carried out correctly. An analysis of the empirical data for the entire analyzed period showed that it would be possible to improve mp to the level of 0.82 or mq to 0.83. In the case of simultaneous improvement of both parameters, it is possible to achieve, for example, the levels mp = 0.79 and mq = 0.78. This is the period denoted as (d) in Figure 3 and as No. 17 in Figure 2, during which the performance variables were relatively high (ṁi-w = 1034.6 kg/h and ṁo-ss = 5075.0 kg/h) and, at the same time, it was possible to reduce the NOx concentration to a level of 58.5 mg/m3u. However, there was a problem with maintaining a high concentration of SO2, i.e., amounting to 45.7 mg/m3u, which was caused by a malfunction of the SO2 reduction system by sorbent dosing. By analyzing the position of this period in the trend diagram Figure 2, it can be seen that the optimal operation state (in the Pareto sense) was obtained thanks to the stabilization of the MBM combustion efficiency in the preceding periods (periods 11–16). The empirical data presented in Figure 3 come from the start-up period of the installation and testing of various technical solutions and control algorithms, which resulted in the occurrence of numerous nonoptimal points.
Area (2) in Figure 3 is a set of optimal points under the Pareto principle. The chart indicates the maximum possible levels for pairs of indicators mp and mq. This means that it is not possible to improve one of these indicators without worsening the other. For example, point (b) is characterized by values mp = 0.892 and mq = 0.533 (No. 147/ṁi-w = 1325.4 kg/h, ṁo-ss = 6511.2 kg/h, to-fg = 1093.2 °C, CNOx = 188.5 mg/m3u, CSO2 = 34.2 mg/m3u). The circumstances point to the fact that the personnel servicing the system were, at that time, focused on high efficiency (high level of mp), which resulted in a lower level of the indicator of technological and emission conditions mq. The opposite situation occurred in the case of point (c) with coordinates mp = 0.406 and mq = 0.834, for which a large value of the technological conditions index mq was obtained, but this was associated with a decrease in the efficiency index mp. (No. 6/ṁi-w = 752.3 kg/h, ṁo-ss = 3736.9 kg/h, to-fg = 974.1 °C, CNOx = 50.7 mg/m3u, CSO2 = 27.9 mg/m3u).
6. Conclusions
This article presented the results of research on the multiparameter process of MBM incineration. The energy and ecological aspects of the functioning of this process were analyzed, and then their mutual conditions were analyzed using the multicriteria assessment method.
The incineration process is highly complex. It requires meeting many, often contradictory criteria, e.g., low emission of gaseous pollutants into the atmosphere, high efficiency of installations, low operating costs, etc. The use of multidimensional analysis can significantly help in obtaining the optimal working area for a waste incineration system. Research conducted on the real process using a multicriteria evaluation showed that there were periods during which there were numerous points of nonoptimal work.
Multicriteria analysis enables observation of many parameters of the work of a thermal waste treatment installation with simultaneous assessment of how far they differ from the optimal conditions. This makes it possible to objectively evaluate the operation of any thermal waste treatment plant. The results of the tests and analyses of ecological and performance parameters presented in this work may also be helpful when designing such systems.
Author Contributions
Conceptualization, J.B., P.S. and M.N.; methodology, J.B., P.S. and M.N.; data curation, J.B., P.S. and M.N.; formal analysis, J.B., P.S. and M.N.; writing—review and editing, J.B., P.S. and M.N. All authors have read and agreed to the published version of the manuscript.
Funding
This research received no external funding.
Conflicts of Interest
The authors declare no conflict of interest.
References
- European Commission. Commission decision 94/381/EC of 27 June 1994 concerning certain protection measures with regard to bovine spongiform encephalopathy and the feeding of mammalian derived protein. Off. J. L 1994, 172, 23–24. [Google Scholar]
- Fedorowicz, E.M.; Miller, S.F.; Miller, B.G. Biomass gasification as a means of carcass and specified risk materials disposal and energy production in the beef rendering and meatpacking industries. Energy Fuels 2007, 21, 3225–3232. [Google Scholar] [CrossRef]
- European Regulation. Regulation (EC) no. 1774/2002 of the European parliament and of the council of 3 October 2002 laying down health rules concerning animal by products not intended for human consumption. Off. J. Eur. Communities L 2002, 45, 1–95. [Google Scholar]
- Ayllón, M.; Gea, G.; Murillo, M.B.; Sánchez, J.L.; Arauzo, J. Kinetic study of meat and bone meal pyrolysis: An evaluation and comparison of different possible kinetic models. J. Anal. Appl. Pyrolysis 2005, 74, 445–453. [Google Scholar] [CrossRef]
- Cascarosa, E.; Gea, G.; Arauzo, J. Thermochemical processing of meat and bone meal: A review. Renew. Sustain. Energy Rev. 2012, 16, 942–957. [Google Scholar] [CrossRef]
- Skoulou, V.; Zabaniotou, A. Investigation of agricultural and animal wastes in Greece and their allocation to potential application for energy production. Renew. Sustain. Energy Rev. 2007, 11, 1698–1719. [Google Scholar] [CrossRef]
- Lynch, D.; Henihan, A.M.; Bowen, B.; Lynch, D.; McDonnell, K.; Kwapinski, W.; Leahy, J.J. Utilisation of poultry litter as an energy feedstock. Biomass Bioenergy 2013, 49, 197–204. [Google Scholar] [CrossRef]
- Hassen-Trabelsi, A.B.; Kraiem, T.; Naoui, S.; Belayouni, H. Pyrolysis of waste animal fats in a fixed-bed reactor: Production and characterization of bio-oil and bio-char. Waste Manag. 2014, 34, 210–218. [Google Scholar] [CrossRef] [PubMed]
- Poskrobko, S. Identification and stabilization of combusting animal waste with active participation of bone material—Emission of SO2 and HCl. Fuel Process. Technol. 2013, 113, 20–27. [Google Scholar] [CrossRef]
- Staroń, P.; Kowalski, Z.; Krupa-Zuczek, K.; Wzorek, Z. Thermal utilization of mixtures of bone waste. Pol. J. Chem. Technol. 2010, 12, 26–30. [Google Scholar] [CrossRef]
- Beck, J.; Brandenstein, J.; Unterberger, S.; Hein, K.R.G. Effects of sewage sludge and meat and bone meal co-combustion on SCR catalysts. Appl. Catal. B Environ. 2004, 49, 15–25. [Google Scholar] [CrossRef]
- Coutand, M.; Cyr, M.; Deydier, E.; Guilet, R.; Clastres, P. Characteristics of industrial and laboratory meat and bone meal ashes and their potential applications. J. Hazard. Mater. 2008, 150, 522–532. [Google Scholar] [CrossRef] [PubMed]
- Cummins, E.J.; McDonnell, K.P.; Ward, S.M. Dispersion modelling and measurement of emissions from the co-combustion of meat and bone meal with peat in a fluidised bed. Bioresour. Technol. 2006, 97, 903–913. [Google Scholar] [CrossRef] [PubMed]
- Fryda, L.; Panopoulos, K.; Vourliotis, P.; Kakaras, E.; Pavlidou, E. Meat and bone meal as secondary fuel in fluidized bed combustion. Proc. Combust. Inst. 2007, 31, 2829–2837. [Google Scholar] [CrossRef]
- Fryda, L.; Panopoulos, K.; Vourliotis, P.; Pavlidou, E.; Kakaras, E. Experimental investigation of fluidised bed co-combustion of meat and bone meal with coals and olive bagasse. Fuel 2006, 85, 1685–1699. [Google Scholar] [CrossRef]
- Gulyurtlu, I.; Boavida, D.; Abelha, P.; Lopes, M.H.; Cabrita, I. Co-combustion of coal and meat and bone meal. Fuel 2005, 84, 2137–2148. [Google Scholar] [CrossRef]
- Heikkinen, J.M.; Venneker, B.C.H.; di Nola, G.; de Jong, W.; Spliethoff, H. CFD simulation and experimental validation of co-combustion of chicken litter and MBM with pulverized coal in a flow reactor. Fuel Process. Technol. 2008, 89, 874–889. [Google Scholar] [CrossRef]
- McDonnell, K.; Cummins, E.; Fagan, C.; Markku, O. Co-fuelling of peat with meat and bone meal in a pilot scale bubbling bed reactor. Energies 2010, 3, 1369–1382. [Google Scholar] [CrossRef]
- Miller, B.G.; Miller, S.F.; Fedorowicz, E.M.; Harlan, D.W.; Detwiler, L.A.; Rossman, M.L. Pilot-scale fluidized-bed combustor testing cofiring animal-tissue biomass with coal as a carcass disposal option. Energy Fuels 2006, 20, 1828–1835. [Google Scholar] [CrossRef]
- Senneca, O. Characterisation of meat and bone mill for coal co-firing. Fuel 2008, 87, 3262–3270. [Google Scholar] [CrossRef]
- British Standard. Incinerators. Part 1. Specification for Standard Performance Requirements for Incineration Plant for the Destruction of Hospital Waste. BS 3316: Part 1. 1987. Available online: https://shop.bsigroup.com (accessed on 10 June 2018).
- British Standard. Incinerators. Part 2. Methods of Test and Calculation for the Performance of Incineration Plant for the Destruction of Hospital Waste. BS 3316: Part 2. 1987. Available online: https://shop.bsigroup.com (accessed on 10 June 2018).
- British Standard. Incinerators. Part 3. Method for Specifying Purchasers’ Requirements for Incineration Plant for the Destruction of Hospital Waste. BS 3316: Part 3. 1987. Available online: https://shop.bsigroup.com (accessed on 10 June 2018).
- British Standard. Incinerators. Part 4. Code of Practice for the Design, Specification, Installation and Commissioning of Incineration Plant for the Destruction of Hospital Waste. BS 3316: Part 4. 1987. Available online: https://shop.bsigroup.com (accessed on 10 June 2018).
- The Waste Incineration Directive 2000. The Waste Incineration Directive 2000/76/EC. Available online: https://www.eea.europa.eu/themes/waste/links/waste-incineration-directive-2000-76-ec (accessed on 23 September 2018).


Publisher’s Note: MDPI stays neutral with regard to jurisdictional claims in published maps and institutional affiliations. |
© 2020 by the authors. Licensee MDPI, Basel, Switzerland. This article is an open access article distributed under the terms and conditions of the Creative Commons Attribution (CC BY) license (http://creativecommons.org/licenses/by/4.0/).