1. Introduction
As a solution to the exhaustion of fossil fuel energy, the importance of renewable energy has been recognized by the world; the introduction of renewable energy as a key industry in each country is becoming a significant issue. The power generation sector in South Korea aims to expand its proportion of renewable energy generation to 20% and achieve a cumulative installed renewable energy capacity of 63.8 GW. Of the newly installed capacity, 95% will be supplied by clean energy generated through wind and solar power, and wind power generation will account for 28%, which is 17.7 GW out of a total of 63.8 GW by 2030. Unlike conventional resources, wind generation resources (WGR) are highly variable power sources affected by meteorological factors, such as temperature, wind speed, and wind direction. If wind power generators are integrated into existing power grids, the intermittent output can cause uncertainty in the grid and increase the complexity of the power grid’s operation. Therefore, it is very important to estimate and analyze wind power generation’s characteristics and variability for a given period. Several studies have been conducted to operate and plan the power system in major countries integrated with large-scale renewable energy. For example, The National Renewable Energy Laboratory (NREL) considers issues, such as a variety of issues related to renewable energy technologies, including congestion of transmission, seasonal and diurnal generation profiles, the variability of wind and solar power, and the influence of variability on the reliability of the electrical grid through the Regional Energy Deployment System (ReEDS) [
1]. The Electric Reliability Council of Texas (ERCOT) solves optimization problems using probabilistic models to account for uncertainties in large-scale wind power generation in grid planning [
2,
3]. On the other hand, South Korea needs to study the power system operation and planning, reflecting the uncertainty of renewable energy generation. Accordingly, in this paper, we propose a probabilistic method that can be the basic study for future expansion planning by modeling the actual power grid of Korea and conducting security assessments using historical data.
The best method is to estimate the characteristics through in situ tests for several years. However, another way to employ the probabilistic approach is to use the probability density function with less time investment and data as this is also useful and necessary [
4]. The most common probability distribution functions used by researchers investigating the characteristics of wind power generation are the Weibull distribution and Rayleigh functions, both of which relate to the natural characteristics and essence of wind under certain conditions [
5]. The function that researchers mainly use is the Weibull distribution function, as it has a smaller standard error than the Rayleigh function [
6]. The Weibull function has been employed by researchers about wind energy analysis, including wind speed, for many years. It has also extensively been used in wind power analysis for many decades [
7]. A Weibull distribution function with two parameters is a more accurate and relevant probability distribution function than other distribution functions [
8]. Therefore, a Weibull distribution function makes it possible to estimate the characteristics of wind power data. In this paper, we analyze the characteristics of WGR using the Weibull probability distribution. We need to calculate two parameters that are shape (
k) and scale (
c). There are several ways to estimate the two parameters. Commonly used parameter estimation methods are graphical method [
9], an empirical method [
10], moment method [
11], maximum likelihood method [
12,
13,
14], and least squares method [
15]. In this paper, as the parameter estimation method for estimating the Weibull distribution, we used the simplest “moment method” and the “maximum likelihood method” that requires many iterations. The distributions estimated by the two techniques are used to analyze the goodness of fit using the Kolmogorov-Smirnov method [
16]. We also use the fluctuation rate of wind power output to estimate seasonal characteristics by studying the empirical wind power output data for a year.
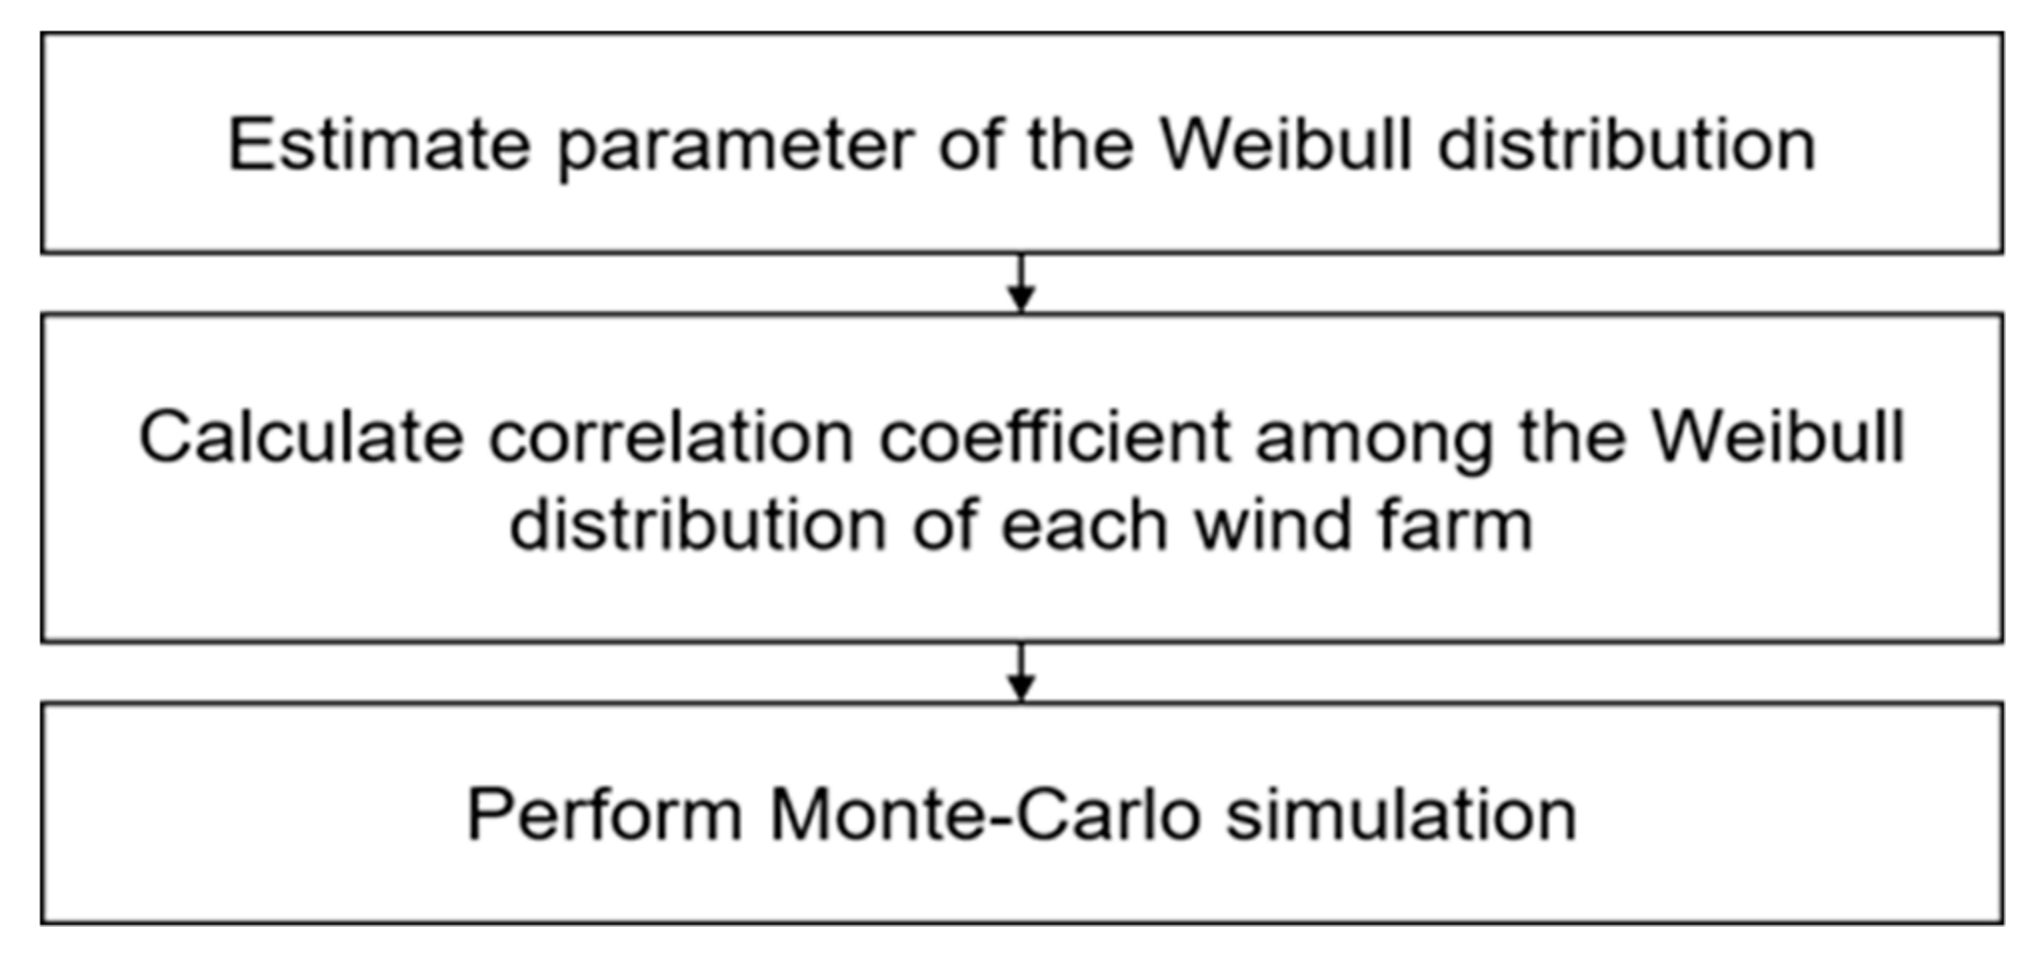
We propose various scenarios for case studies based on the wind power outputs modeled by the probabilistic method. The scenarios are constructed based on seasonal and hourly demands, and stochastically modeled wind power outputs. The probabilistic modeling techniques are performed using Monte-Carlo simulations (MCS). MCS is performed by using a stochastic system for decision making under uncertain circumstances; this is called mock sampling by probabilistic or accidental results [
17]. When sampling, the copula coefficient is used to reflect the correlation between the samples [
18].
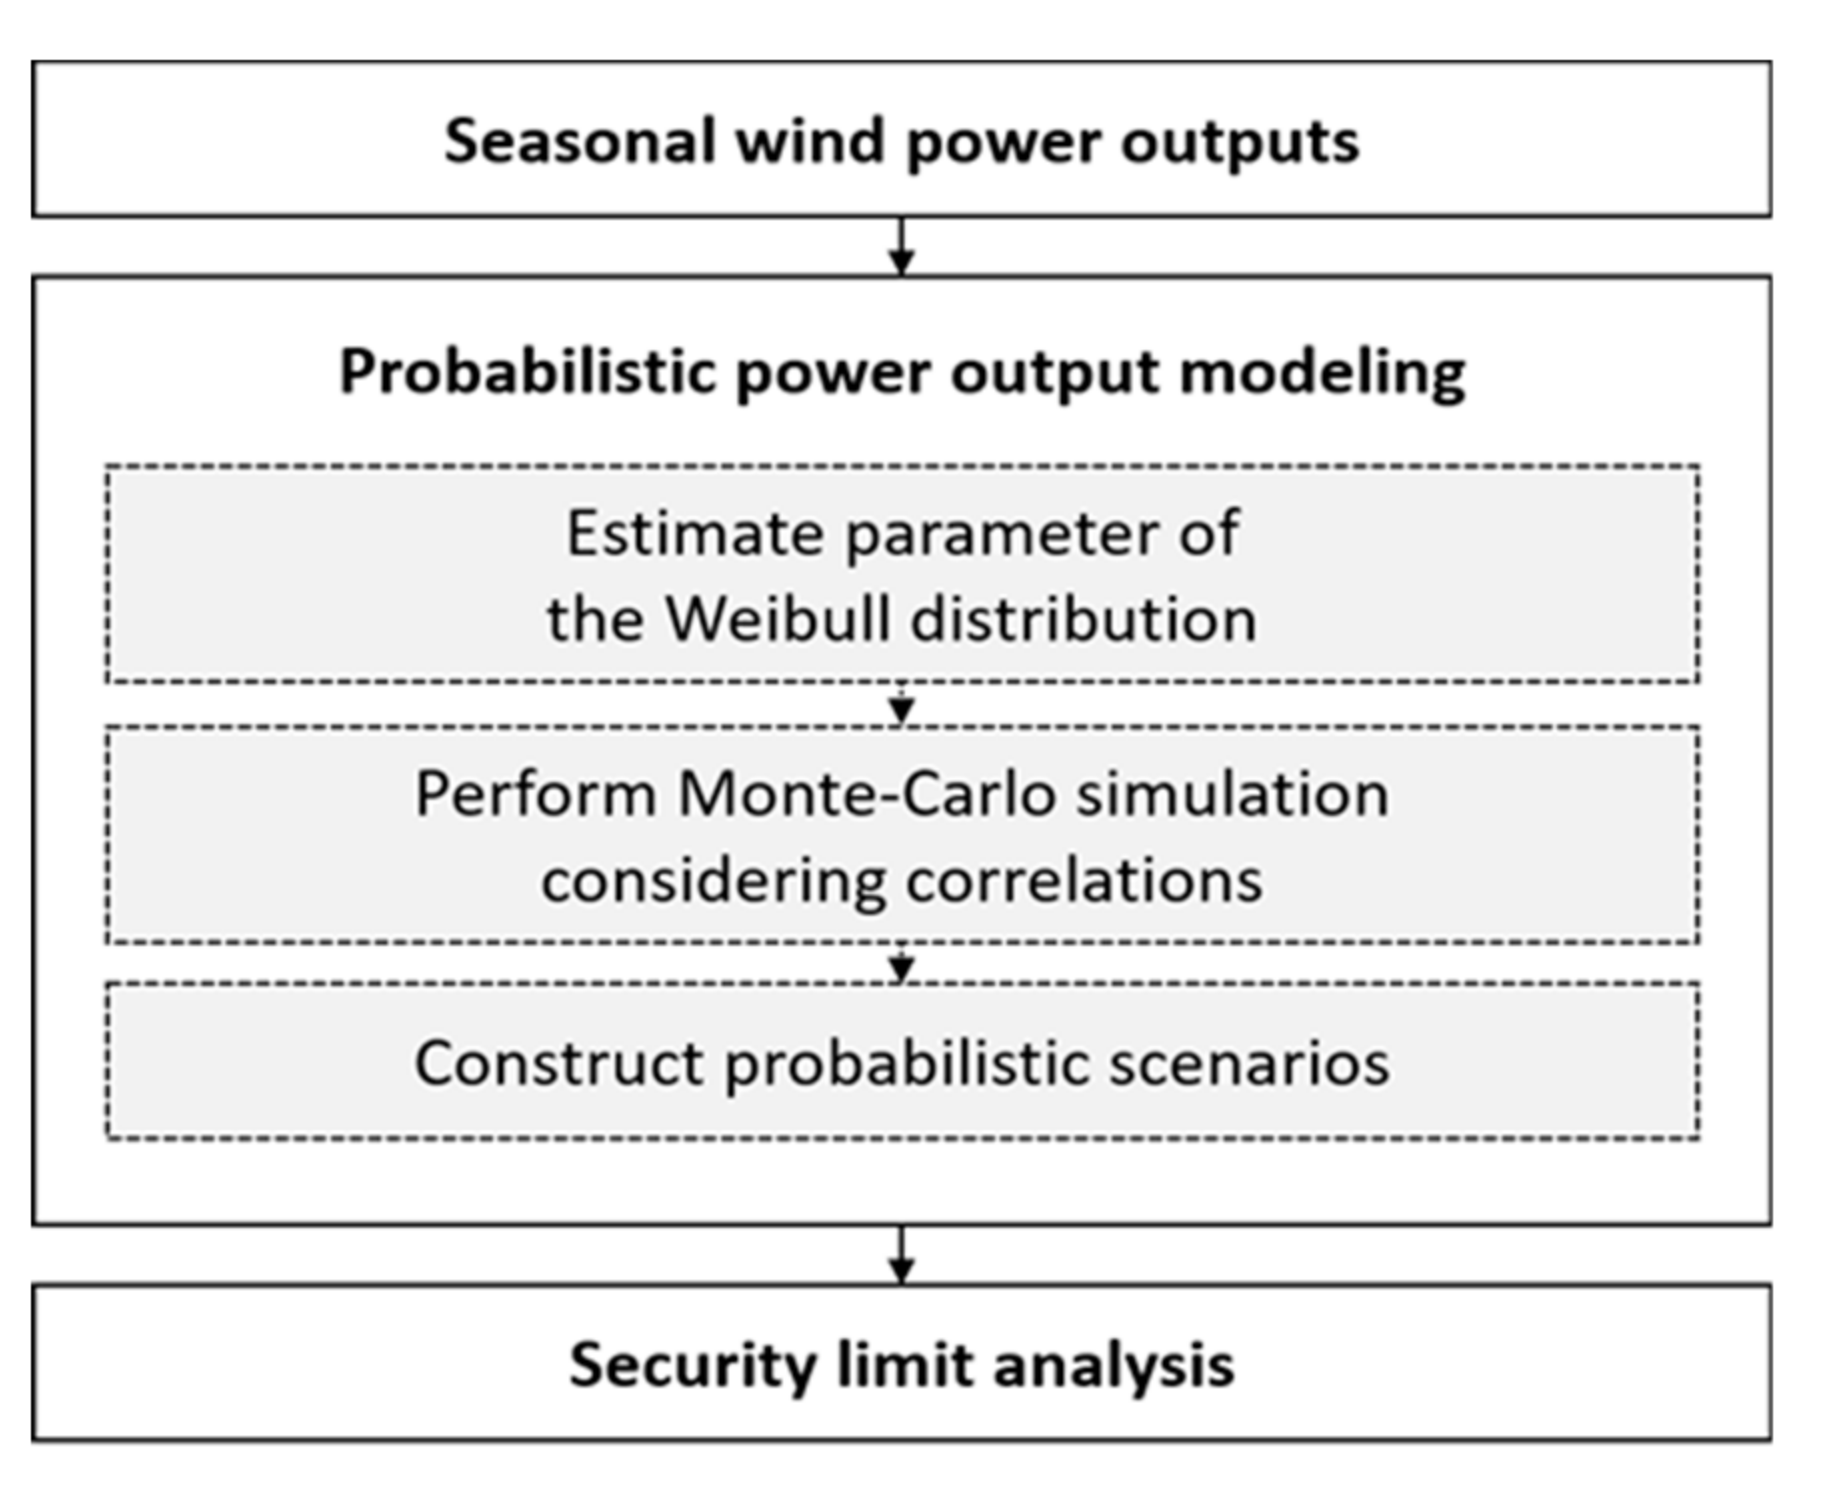
The outputs modeled in this way can reflect the seasonality and uncertainty of wind power. The output modeling and security of the power grid limit analysis procedures performed in this paper are shown in
Figure 1. In
Figure 1, the characteristics of wind power are analyzed based on the historical outputs of various wind farms. The MCS based on the Weibull distribution was performed to model the output based on the characteristics. In this paper, the Monte-Carlo simulation was performed considering the correlation of the wind farms, and the seasonal scenarios were constructed based on the simulation results. To verify the simulations and modeling based on the proposed scenarios, the Jeju Island in South Korea power grid model was used. Using the probabilistic modeling results from power outputs proposed in this paper, we analyze the security limits of the grids; power flow and voltage violations also have probabilistic results. Thus, from a grid operator’s point of view, an effective decision can be made through percentiles rather than deterministic values.
The remainder of this paper is organized as follows.
Section 2 analyzes seasonal characteristics of wind power outputs using empirical data in Jeju Island. Next, in
Section 3, we performed probabilistic wind power output modeling of six wind farms.
Section 4 analyzes the security limit of Jeju Island’s grid-based on the probabilistic method. Finally, conclusions are presented in
Section 5.
2. Seasonal Characteristic of Wind Power Outputs
If the large-scale wind power generation is integrated into the existing power grid, it can have a significant impact on the reliability of the power system. To improve reliability, it is necessary to analyze the intermittent characteristics and variability of wind power generation and to perform various case studies. In this section, we precede wind power output modeling with a characteristic analysis of wind power outputs.
2.1. Wind Power Output Distribution
The Weibull probability distribution was used to estimate the characteristics of wind power outputs as it is most widely used to study wind energy and other renewable energy resources [
19]. The Weibull probability distribution function is given by Equation (1) [
20,
21]:
where
k and
c represent shape and scale parameters, respectively, and
p is wind power output. In this study, the characteristics of seasonal wind power output are examined by classifying seasonal parameters. In this paper, we will fit the distribution using two parameters. The first method is the moment method; its parameters are calculated through Equations (2) and (3) [
11]:
where
is the mean wind power output,
is the standard deviation, and
is the gamma function. In addition, mean wind power output and the standard deviation is calculated by
where
n is the number of observations and
is the wind power output measured at the interval
i.
The second method is the maximum likelihood method, which is as commonly used as the moment method. This method requires extensive computational iterations for parameter estimation. This method uses a likelihood function of the wind output data in a time series format [
13]. Equations (6) and (7) are used to calculate the parameters based on the maximum likelihood method [
14].
where
n is the number of observations and
is the wind power output measured at the interval
i. Care must be taken to apply Equation (6) only to the nonzero wind power output data points [
13]. According to the MLM condition, every zero measured value are removed from the wind power output data.
Table 1 shows the results of calculating the Weibull parameters that are divided into spring, summer, fall, and winter (March–May, June–August, September–November, and December–February, respectively) [
18]. The data used in this study is the wind power outputs of wind farm A located in Jeju, South Korea, and its rated capacity is 33 MW.
According to the parameters in
Table 1, both the results of the moment method and the maximum likelihood method resulted in the largest winter shape and scale parameter values and the lowest summer parameter values. Through these results, wind farm A has a distinct seasonal difference in wind power distributions.
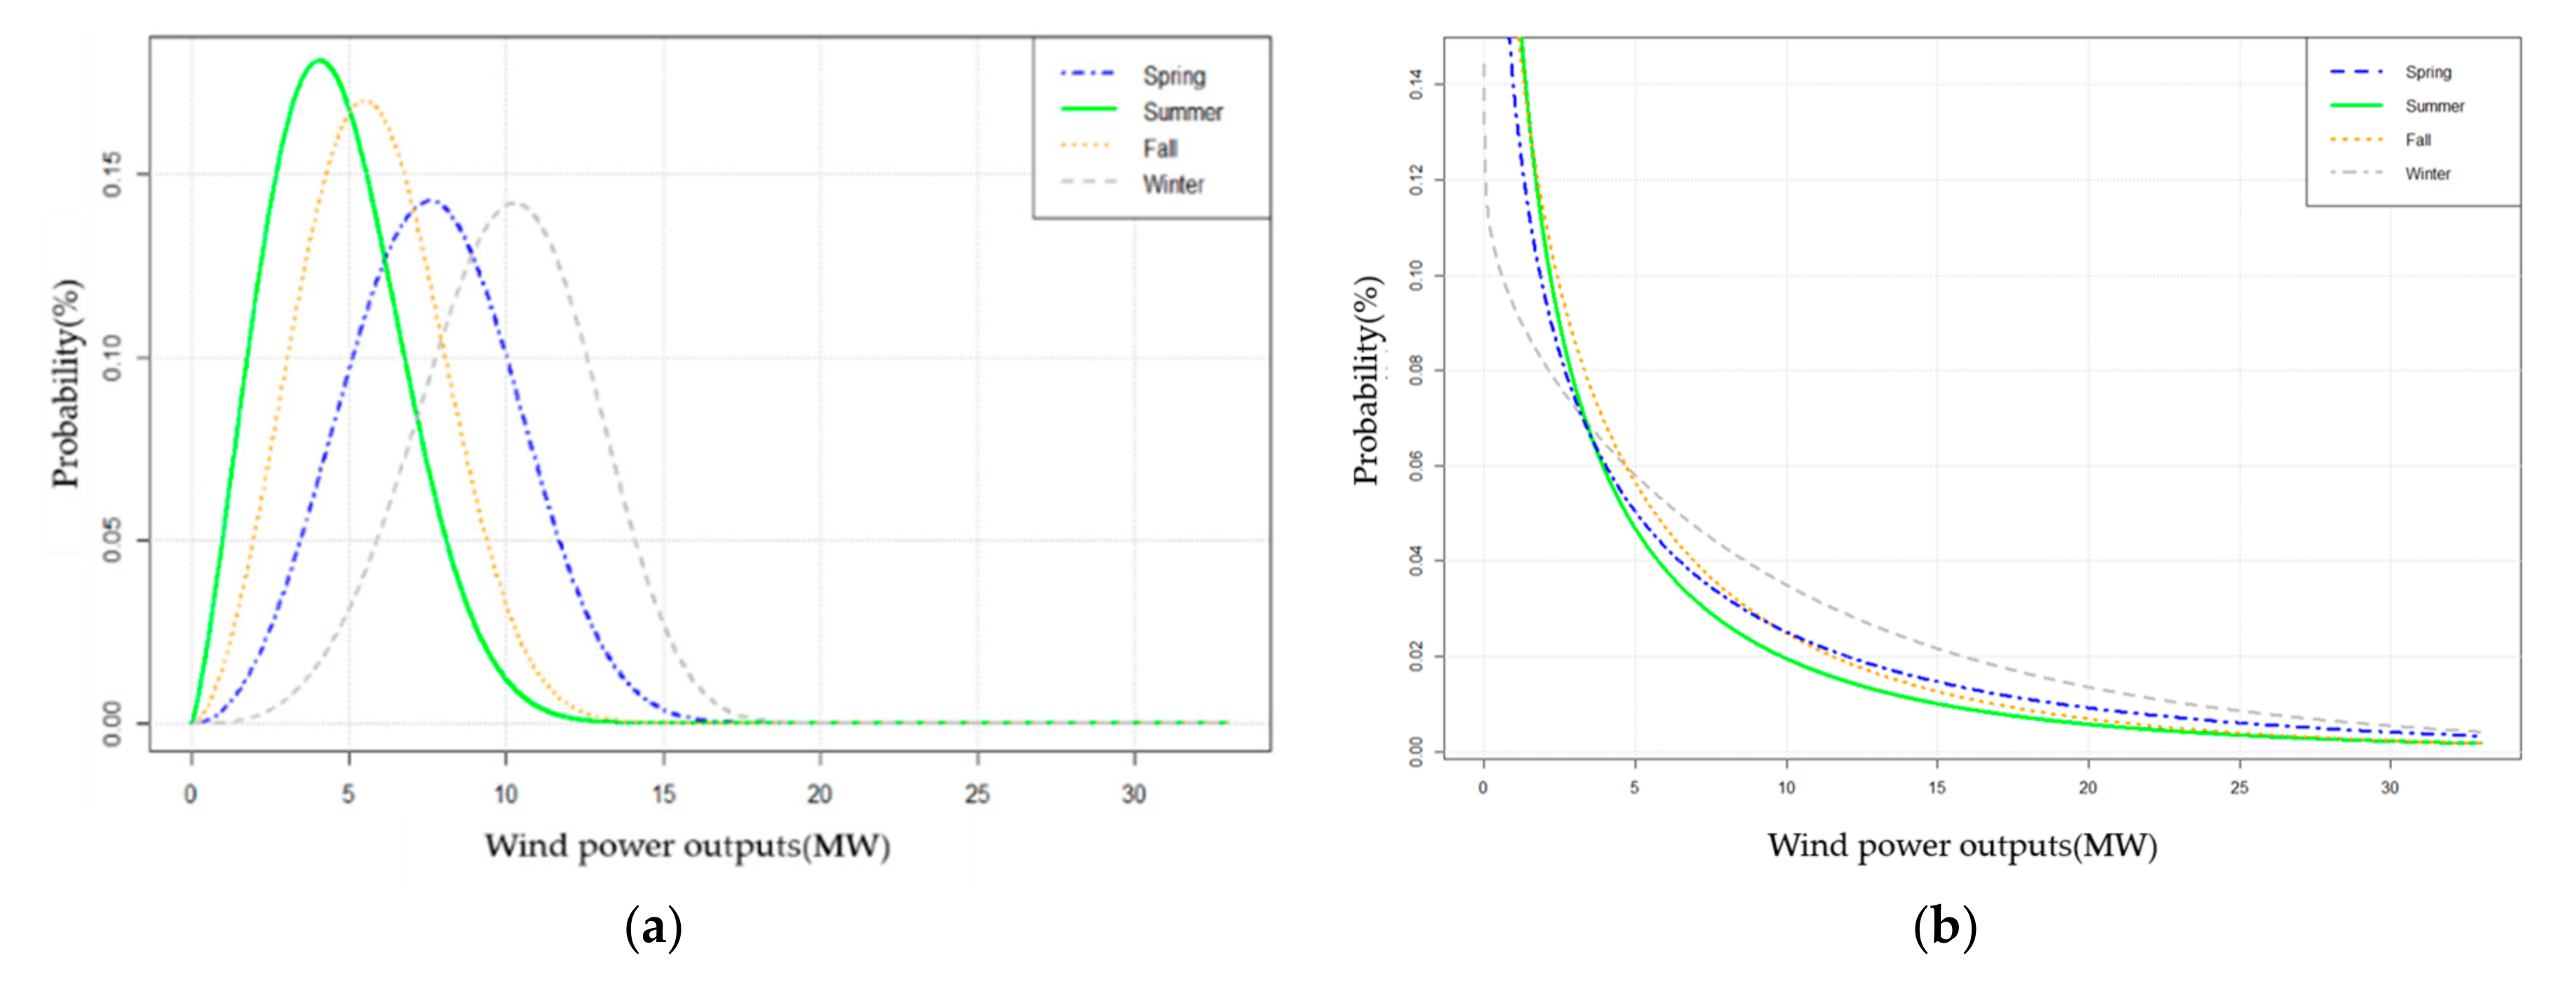
Figure 2 shows the seasonal Weibull probability distribution of wind farm A estimated based on the two methods previously mentioned.
According to
Figure 2, as shown in
Table 1, since the moment method-based parameters are estimated to be larger than the maximum likelihood method, there is a big difference in the form of the probability distribution. However, the commonality between the two distributions is that the distribution of wind power in winter is skewed to the right. This means that the wind power outputs in winter are likely to be higher than in other seasons.
2.2. Fluctuation Rate of Wind Power Outputs
In this section, the seasonal variability of wind power outputs is analyzed by calculating the fluctuation rate based on hourly output variation. The output fluctuation rate is shown in Equation (8) [
22]:
As shown in Equation (8), the fluctuation rate of wind power output is the hourly wind power output variation divided by the rated capacity of the wind farm. Previous data was also used to estimate the wind power output fluctuation rate.
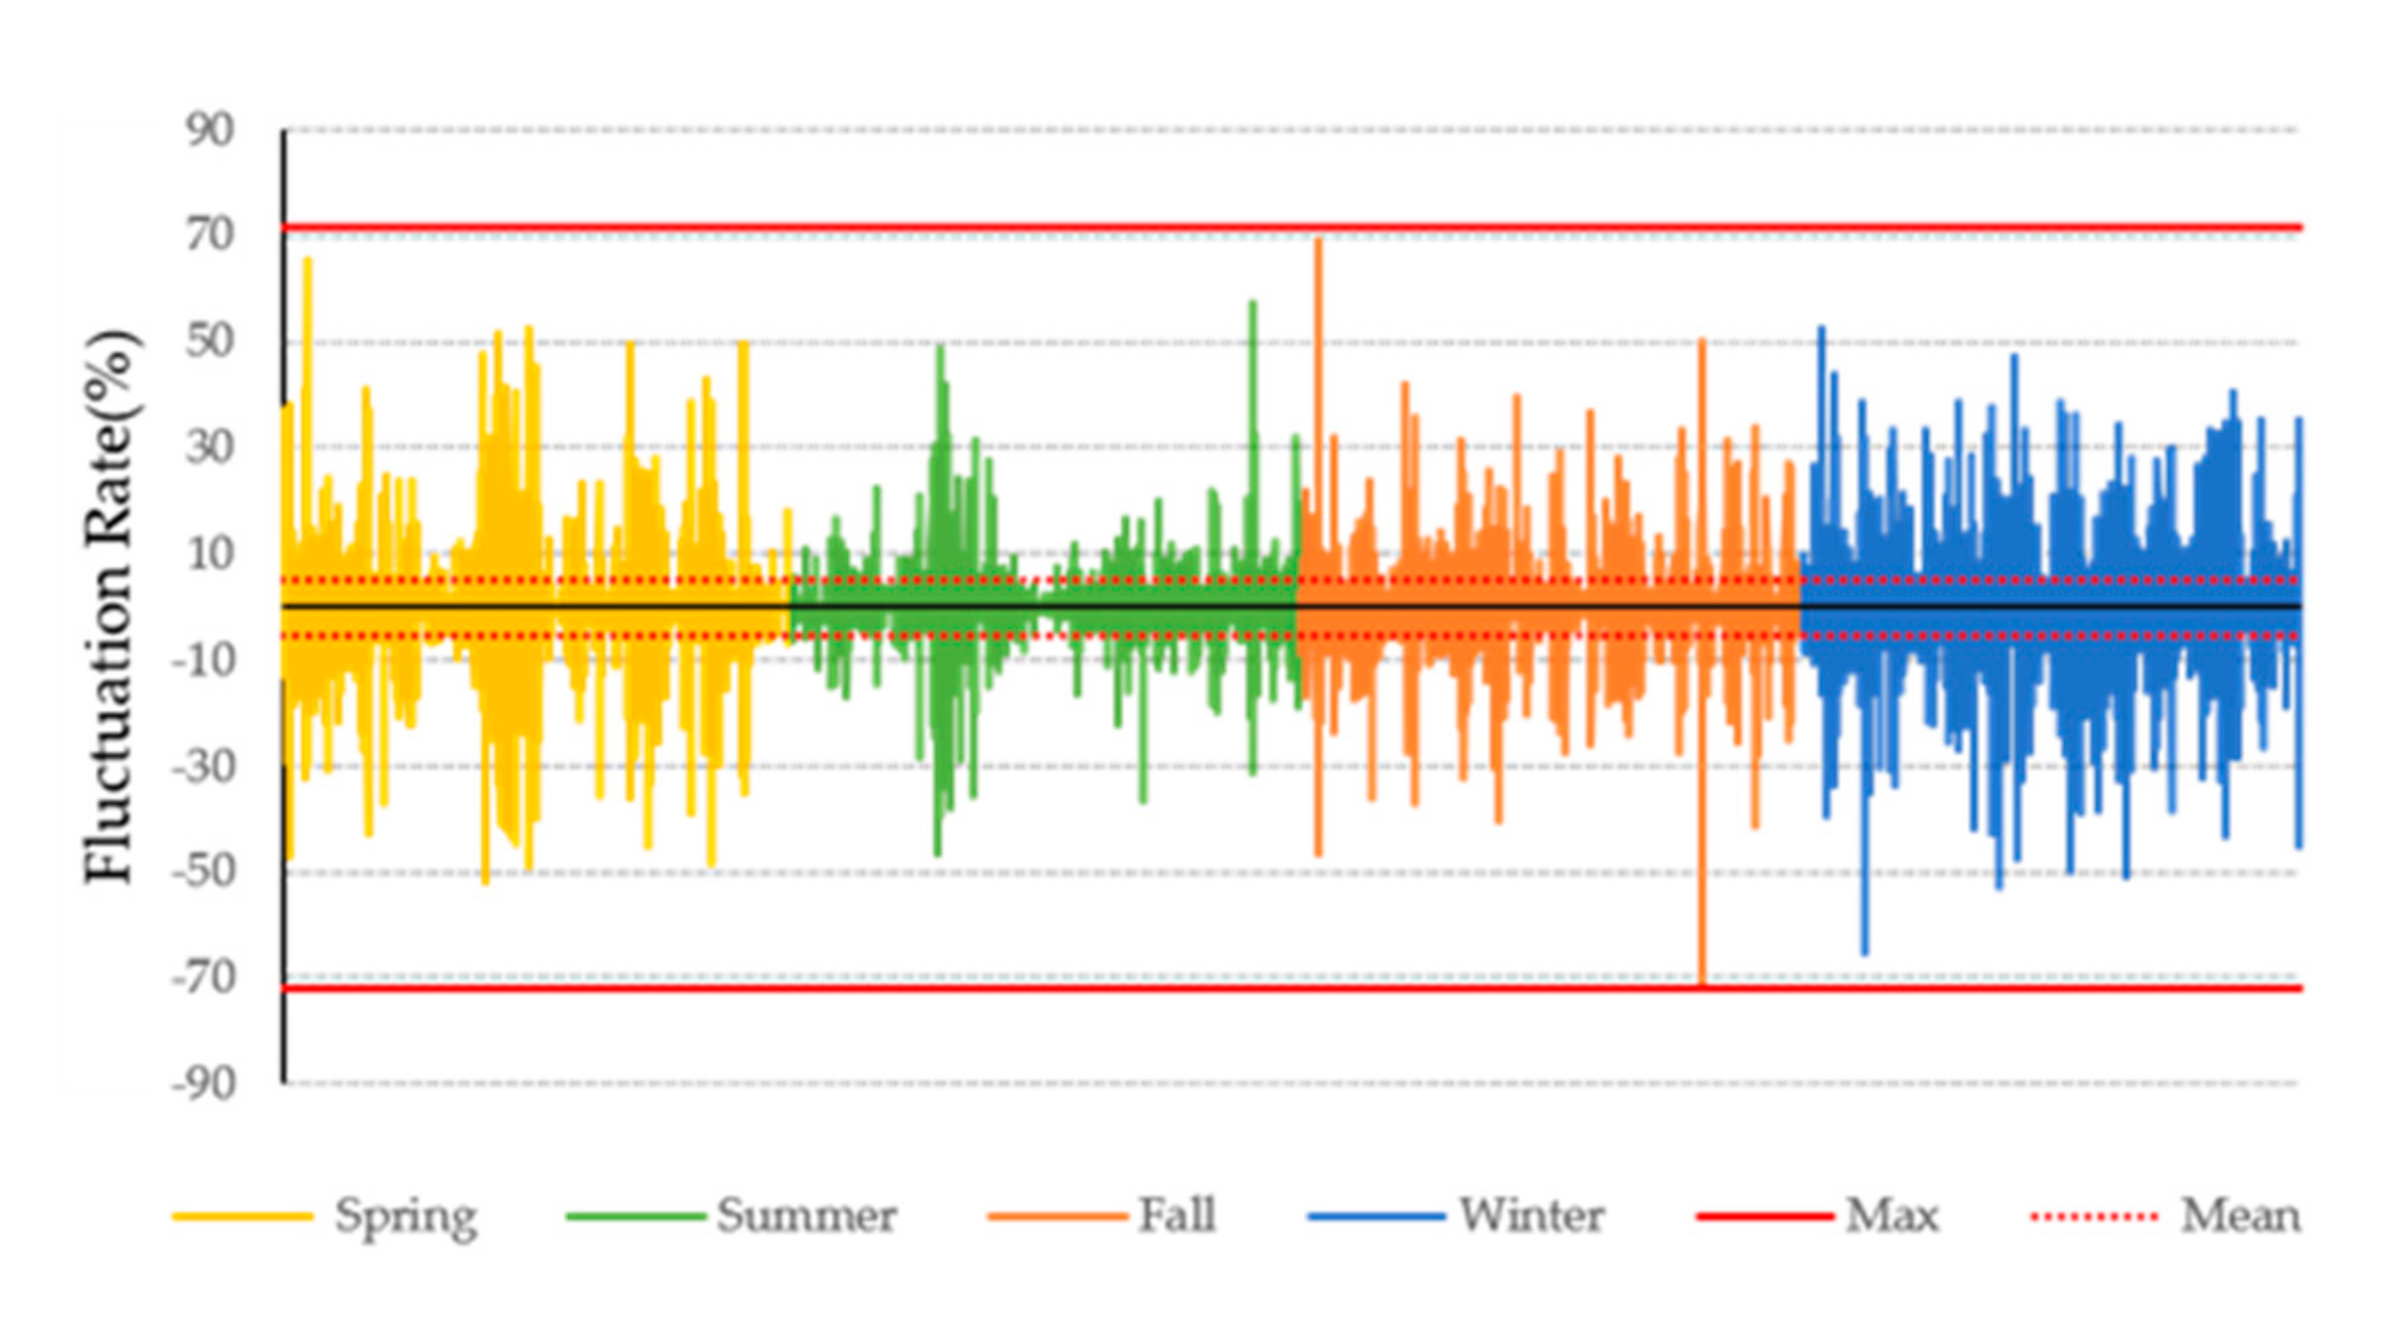
Figure 3 shows the wind power output fluctuation rate per hour of wind farm A.
As shown in
Figure 3, the wind power output fluctuation rate is negative when output decreases in the next time frame and positive when it increases in the next time frame. In other words, when the wind power output value is smaller than now in the next time zone, since the output variation value has a negative, the fluctuation rate finally has a negative value.
Table 2 shows the average, maximum values, and the standard deviation for the entire period based on the absolute value of the fluctuation rate to compare the output fluctuation magnitude.
In the case of the average value of each wind farm, the output fluctuation rate in winter is relatively higher than in other seasons.
As a result of analyzing the wind power outputs over the course of one year through Weibull distributions and the hourly output fluctuation rates, it was confirmed that wind power has seasonal characteristics and that outputs and variations are large in the winter. In addition, the output may fluctuate momentarily in other seasons apart from winter. Therefore, to integrate large-scale wind power generation in the future, research that reflects the seasonal characteristics and output variability of wind power generation need to be conducted.
4. Probabilistic Security Limit Analysis for Power Grids
The Jeju power grid was modeled on the empirical system data for probabilistic security limit analysis. The seasonal Jeju power grid was modeled based on each peak load. There are six buses integrated with wind farms, and the HVDC (High-Voltage Direct Current) bus of 80 MW is connected to the land. It is assumed that no other renewable energy resource exists except wind power. Herein, we construct some scenarios for a case study based on wind farms whose output data are within the estimated range. Currently, grid operators consider the security of a power grid against the peak loads in summer and winter only. If the security limit analysis is performed by applying the seasonal scenarios based on the probabilistic method proposed in this paper, the voltage stability and line overload can be considered more effective than those obtained using the conventional method.
4.1. Probabilistic Scenarios for Security Limit Analysis
The base scenarios were modeled by season for comparison with the probabilistic scenarios to reflect the seasonal characteristics and uncertainties of wind power generation, and the total supply from the grid, including wind power, is 110% of the load. A summary of the scenarios for all four base cases are shown in
Table 9.
In
Table 9, the scenarios are classified by season, and the sum of the existing power generation and wind power generation implies that the total meets the power load and an additional 10% reserve capacity. All four scenarios have the same wind power generation capacity, which is the deterministic value of wind farm capacity that does not take into account seasonal characteristics and uncertainties in wind power outputs. Therefore, the base scenarios can be compared with the probabilistic scenarios proposed in this study.
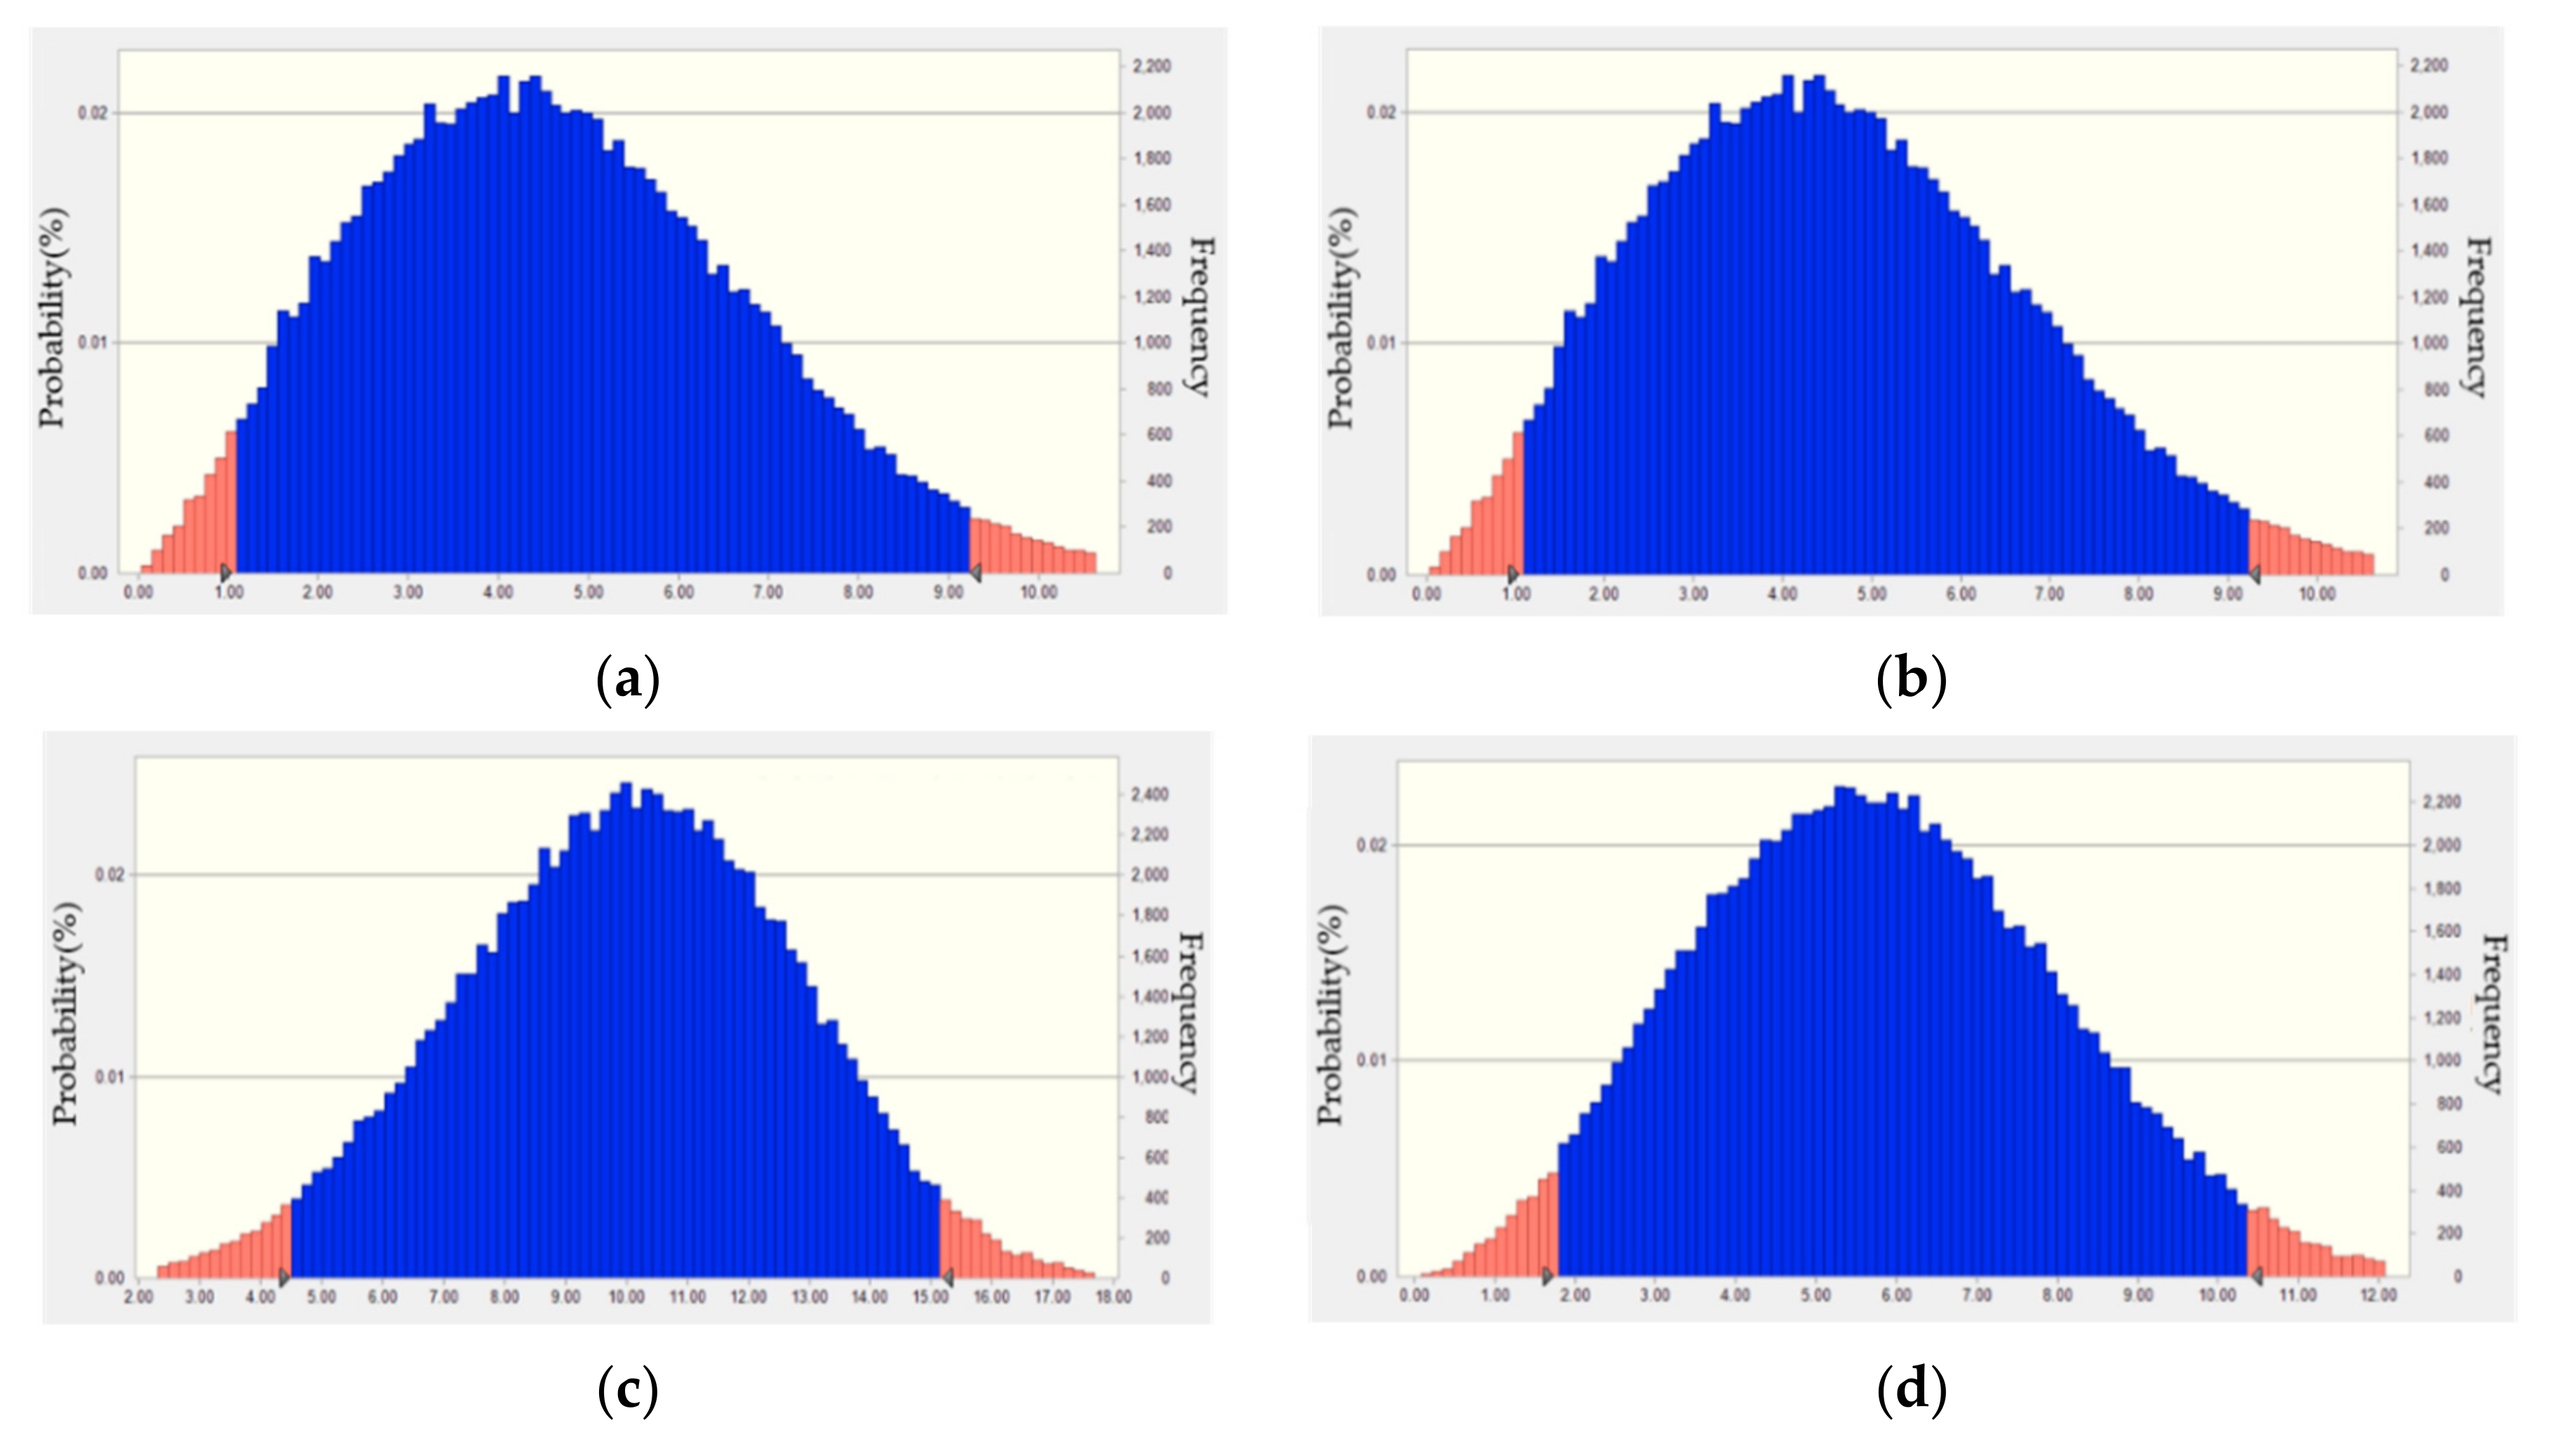
Table 10 shows the scenarios for the probabilistic grid security assessment based on the results of the stochastic wind power output modeling.
Table 10 also shows the probabilistic scenarios classified by seasons, and unlike
Table 9, each instance of wind power capacity has a range with minimum and maximum values. In
Table 10, the sum of the minimum and maximum values of the existing power generation and the wind power generation in the table is calculated to be 110% of the seasonal peak load. The wind power generation values represent the probabilistic wind power output modeling results performed in
Section 3.
The wind power capacities given in
Table 10 include all six wind farms analyzed in this study. Unlike the base scenario, since it represents a probability range with 95% reliability, the result of voltage violation and line overload after N-1 contingency can also be represented as a range.
4.2. Probabilistic Security Limit Analysis of Jeju Island
For the probabilistic security limit analysis, we reviewed the Jeju power grid-based on the scenarios shown in
Table 10. The case study results for all four scenarios are compared with the results of the deterministic base cases in
Table 9. Herein, we use the summer scenario case study as an example.
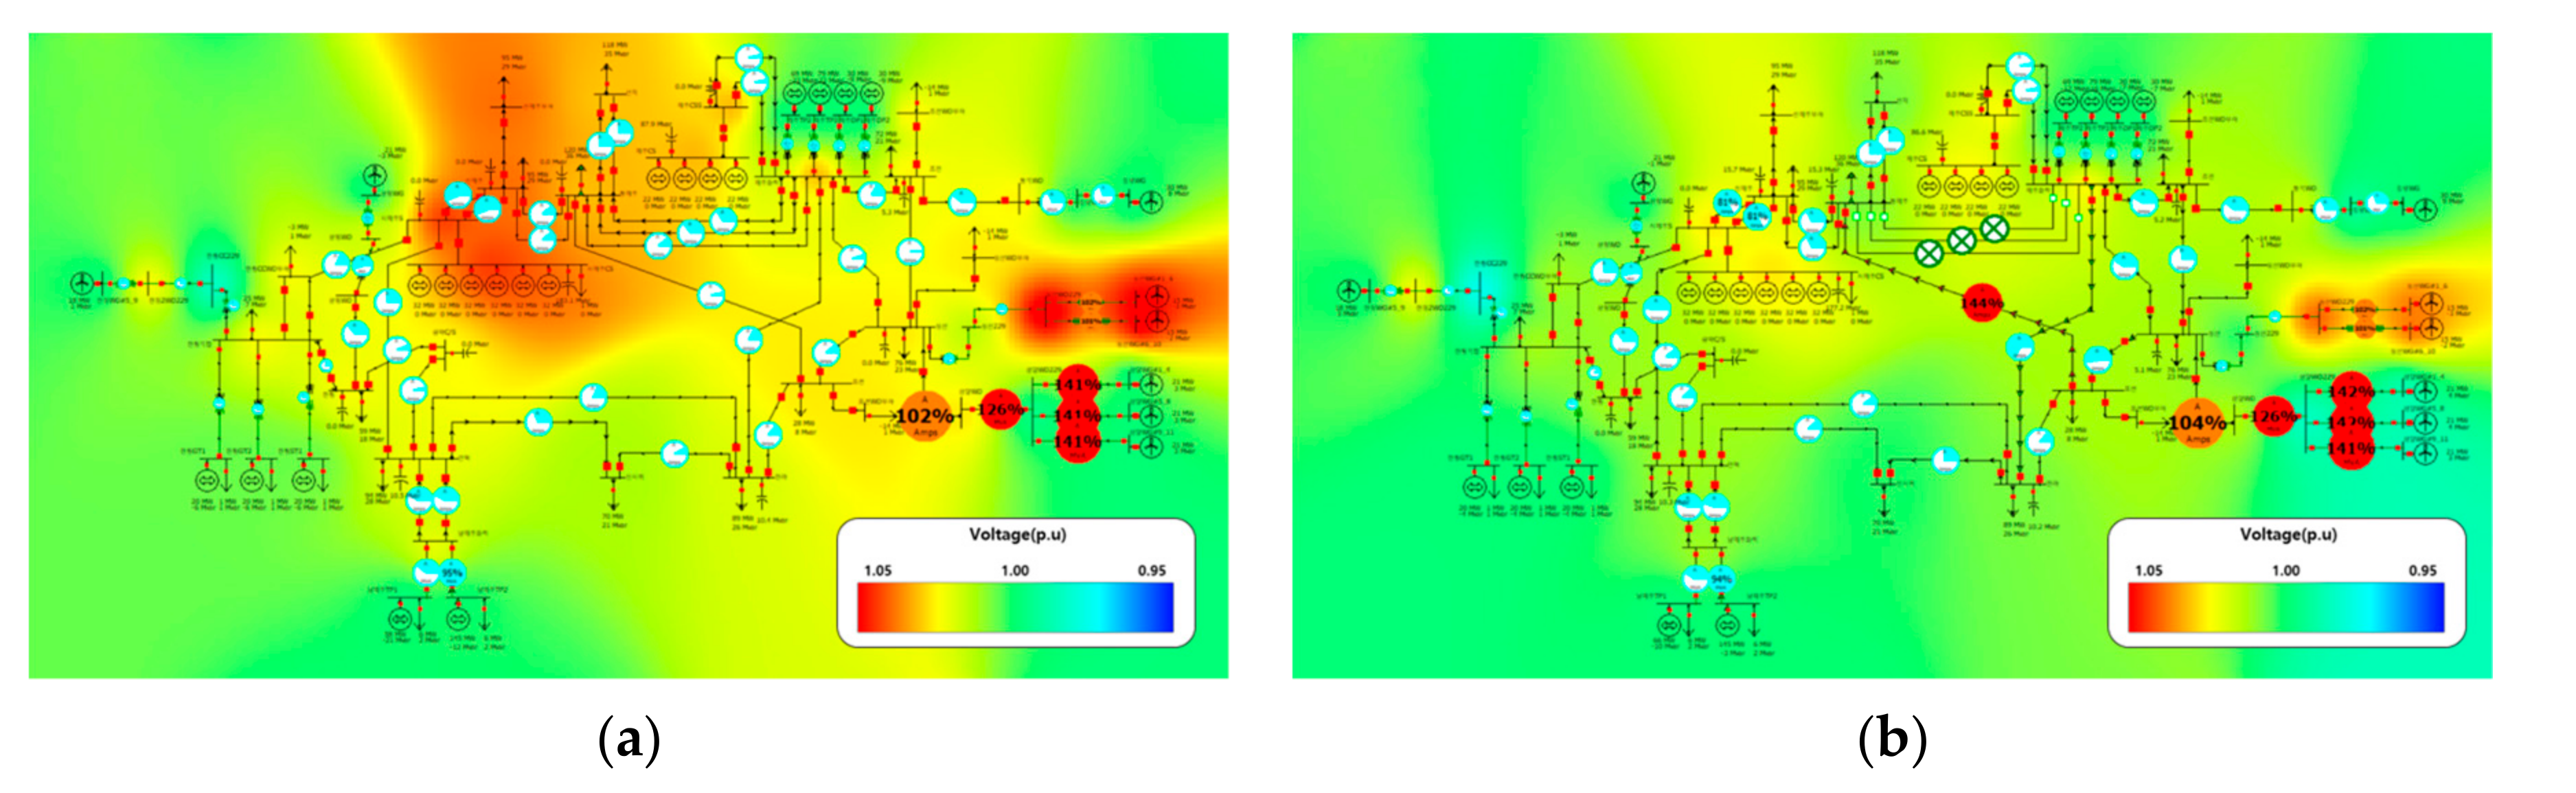
Figure 6a,b shows the pre and post N-1 contingencies of the grid to which the summer scenario of
Table 9 is applied. The contingency means simulating any faults that may occur in the power grid for the case study. In N-k contingency, k is the number of system equipment that has failed, and N-1 means a single failure. In this paper, we reviewed whether supply failure, line overload, and voltage violation problems occurred in the event of a single failure to review the grid security as specified in the reliability standard. Therefore, we selected the most critical line in this grid.
Figure 6 and
Figure 7 show the results of the case study based on the summer data of the scenarios shown in
Table 9 and
Table 10, respectively.
Figure 6 shows the deterministic scenario results for comparison with
Figure 7. The background color in
Figure 6 represents the bus voltage (pu), and it means 0.95 to 1.05 pu from blue to red. The pie chart shown on each line in
Figure 6 indicate the line overload rate, and the pie chart appears in red when the overload rate is above 100%.
In
Figure 6b, it can be seen that more than 100% of line overload occurs in the eastern region, where the wind farms are concentrated, both pre and post the contingency. The voltage is observed to have dropped slightly since the contingency, but there is no voltage violation. The total line overload was estimated to be 98.09 MW.
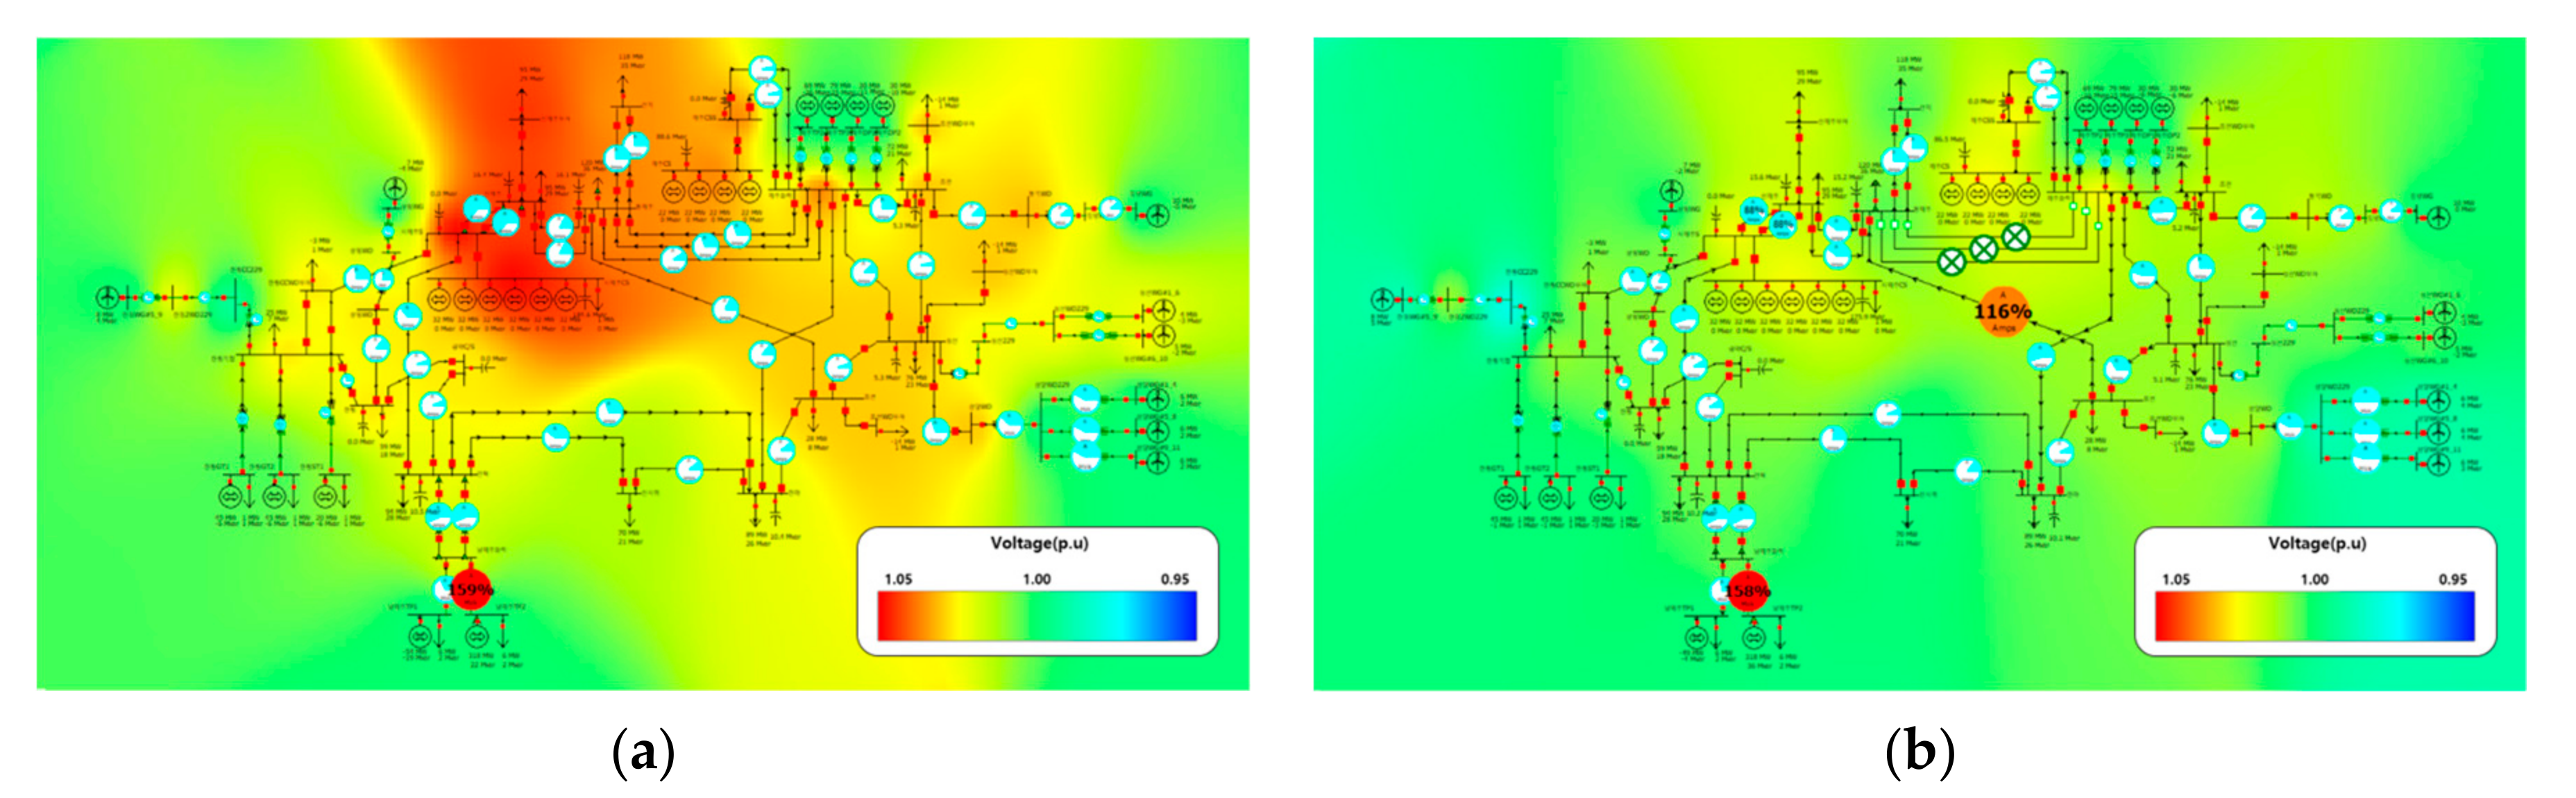
Figure 7 shows the results of the case study for the probabilistic summer scenario proposed in this work; as in
Figure 6, the results pre and post-N-1 contingency are presented.
As mentioned previously, summer wind power generation is very likely to have lower capacity than the other seasons. Therefore, over 100% of the line overload did not exist in regions where the wind farms were integrated. However, as seen in both
Figure 7a,b, overloads occurred on the line to which the existing generators were connected. In the case of post-N-1 contingency, the voltage was lowered overall, but there were no voltage violations, resulting in 116% of line overload on the new line in the center part of Jeju Island. The total overload was estimated to be approximately 65.7–79.2 MW after the failure of those two specific lines. The results of applying the two scenarios for security evaluation of the power system during the summer season are as follows:
There were no voltage violations in both scenarios;
The total line overload for the post-N-1 contingency of the critical line in a deterministic scenario is about 98.9 MW;
The total line overload for the post-N-1 contingency of the critical line in a probabilistic scenario is 65.7–79.2 MW.
In summer, wind power generation is unlikely to occur at the rated capacity. The deterministic scenarios that do not reflect the seasonality and uncertainty of wind power could lead to excessive grid investments in the future and excessive curtailment of wind power during grid operations. Probabilistic scenarios, however, enable efficient decision-making on grid investments.
5. Conclusions
With the growing importance of renewable energy around the world, South Korea aims to supply approximately 20% of the requirements of the electricity sector via renewable energy generation, including wind generation resources, by 2030. Wind power generation is a highly variable resource. Therefore, it is necessary to understand its characteristics and analyze the integration of the existing power system with large-scale wind power generation. In this paper, we propose a probabilistic security limit analysis of a power grid to improve the power system reliability and efficiency of grid operation and planning when large-scale wind power generation is integrated. Wind power output characteristics were analyzed using historical empirical data, and the outputs were stochastically modeled. Based on the outputs of the proposed method, various scenarios were established for case studies, and security limits were assessed by applying these scenarios to the modeled Jeju power system. For the probabilistic output modeling method, various security limit analyses reflecting the uncertainties and variabilities comprising the limitations of the deterministic method are possible. This is expected to play a key role in developing hedging strategies for investment decisions on power grid expansion planning with extensive wind power penetration. However, the analysis performed in this paper examined thermal limits of line, voltage violations, and contingency analysis for a simply modeled grid system. Therefore, further research on various situations is needed. According to previous studies of transmission planning or security analysis based on the probabilistic approaches, from a security perspective, probabilistic voltage and transient stability assessment are key issues toward probabilistic transmission planning [
27]. For transmission expansion planning, scenario-specific fault, load flow, reactive power, and stability analysis (dynamic analysis) should be performed [
28].
We will perform a numerous load flow analysis is based on the proposed probabilistic simulation results. In this way, security analysis based on several scenarios will be conducted to derive numerical results that can be used in transmission expansion planning. This would have a more valid result, which would help the transmission operator’s decision to expand the future grid.


