Article

Renewable Energy Promotion Instruments Used by Innovation Brokers in a Technology Transfer Network. Case Study of the Enterprise Europe Network

1
Department of Economics and Enterprise Organization, Cracow University of Economics, 31-510 Krakow, Poland
2
Department of Applications of Mathematics in Economics, Faculty of Management, AGH University of Science and Technology, 30-067 Kraków, Poland
3
Department of Organizational Management and Social Capital, Faculty of Management, AGH University of Science and Technology, 30-067 Krakow, Poland
4
Faculty of Production and Power Engineering, University of Agriculture in Krakow, 30-149 Kraków, Poland
5
Faculty of Agriculture and Economics, University of Agriculture in Krakow, 31-121 Kraków, Poland
*
Author to whom correspondence should be addressed.
Energies 2020, 13(21), 5752; https://doi.org/10.3390/en13215752
Submission received: 1 October 2020 / Revised: 29 October 2020 / Accepted: 2 November 2020 / Published: 3 November 2020

Abstract

:
Stable and sustainable economic development—including that of renewable energy resources (RES)—requires institutional support of an environment that would enable market operations, and support them in case they are ineffective. Innovation brokers, including structured technology transfer networks, play a key role in promoting, disseminating, and liaising between the parties in the RES sector. The aim of the paper is to present the structure of events used to promote RES in Europe by the Enterprise Europe Network in the years 2017–2018; to verify whether the type of promotion instrument used is significantly related to the location of the events organized; to research whether the selection of the supporting partner is determined by the organized event’s geographical location. The analysis is carried out by means of an empirical study of the network of innovation brokers, i.e., the Enterprise Europe Network. Additionally, the available data are analyzed in terms of the type of the partner supporting individual events. It has been shown that there is a significant variation in the structure of the types of events for individual regions of Europe. This could mean that the organizers’ decisions as to the type of events organized in particular regions of Europe are deliberate and in some way adjusted to the region in which they take place.

1. Introduction

Innovation brokers, including structured technology transfer networks, play a key role in promoting, disseminating, and liaising between the parties in the RES sector. The high level of innovation in the energy and environmental technologies increases the competitiveness of national economies and minimizes the negative impact of human intervention in the natural environment, also by minimizing the emission of air pollutants and greenhouse gases into the atmosphere [1,2]. Innovation brokers have been identified as key actors in the innovation landscape, improving the speed and performance of companies in terms of innovation, as well as the efficiency of transfer of innovative technologies [3,4]. Innovation brokers are broadly defined as “organizations that support cooperation between two or more parties at different stages of the innovation process” [5,6,7]. The brokerage institutions are thus seen as key to creating and maintaining an effective innovation ecosystem [8,9]. The role of innovation brokers covers a wide range of tasks, from bringing the parties together for collaboration, to establishing and liaising in relationships and filling in all kinds of knowledge, skills, and talent gaps. Among the different types of involvement of innovation brokers [10,11], their interaction in collaborative projects represents one of their more complex, rich, and engaged roles. In addition to developing and supporting the partnership, they engage in co-creative innovation activities with colleagues, in a process of greater co-creation and joint development [12,13,14,15,16,17,18,19].
Stable and sustainable economic development—including that of renewable energy resources (RES)—requires institutional support of an environment that would enable market operations and support them in case they are ineffective. Shirley [20] classified the institutions that comprise the institutional structure into two categories that are not necessarily complementary. The first category includes the elements of institutional support that facilitate market exchange by reducing transaction costs and increasing trust. The second category includes elements that shape the national power system to strengthen private ownership and individual freedom and not towards the use and subordination of central authority units. For the economic development to be permanent, political institutions must change along with the socio-economic evolution. In this context, the institutional support system for market processes to encourage the development and promotion of RES in the economy plays an important role. Sanderink and Nasiritousi [21] pointed to the fact that institutional relations impact the effectiveness of institutional partnerships for RES.
The research available in the subject literature extensively discusses the role of brokers in innovation and how they generate value for their customers [1,3,22,23,24,25,26,27,28]. The available research results document a rich catalog of technology transfer drivers that improve collaboration, as well as inhibitors that hinder it in the first place. Both drivers and inhibitors are further distinguished between push and pull factors, including supply push factors and demand pull factors [29,30]. For example, Erickson and Chapman [29] write that “renewable energy technology transfer and collaboration would be a supply rather than demand impulse.” As part of the research, the authors identified a research gap in terms of RES technology promotion instruments within a technology transfer network, especially in one financed from public funds. The research on RES technology promotion available in the literature focuses on promotion through financing systems [31], feed-in tariffs for RES promotion [32], strategies of RES promotion and the related power implementations on the European market [33], or instruments for RES promotion in the power production sector [34].
The article is a continuation of research conducted by the authors in their research laboratory [11]. The article in question fills the gap by analyzing often dispersed, independent activities which are undertaken for the same purpose, i.e., promoting RES among entrepreneurs.
The purpose of the article is:
  • to present the structure of events used to promote RES in Europe by the Enterprise Europe Network in the years 2017–2018;
  • to verify whether the type of promotion instrument used is significantly related to the location of the events organized;
  • to research whether the selection of the supporting partner is determined by the organized event’s geographical location.

2. Materials and Methods

The analysis in question was carried out by means of an empirical study of the network of innovation brokers, i.e., the Enterprise Europe Network (EEN). The Enterprise Europe Network is the world’s largest business and innovation support network. Currently, it consists of 625 partner organizations located in over 60 countries [11,31,32]. In this study, the authors focused on the event marketing of the EEN. Event marketing is a set of activities that leverages various types of events for promotion. Event marketing allows reaching a broad audience, providing information to increase the knowledge of an idea, service, technology or product, or to familiarize with it, and also allows winning publicity and building a positive image of the organization in the media [35]. Event marketing activities favor creating communication platforms, which ensure that a specific group of recipients is reached [36]. Statistical and visual analysis of RES promotion instruments (events) was carried out on the basis of data obtained from the Enterprise Europe Network (EEN) from the years 2017–2018. The database of promotional events included 2131 records, out of which RES promotion events were selected. A total of 354 events were analyzed, later categorized as: brokerage event (BE), company mission (CE), conference/seminar/information day (C/S/ID), sector group meeting (SGM), and workshop (W).
The presented instruments (Table 1) are not only a platform for establishing direct contact but also a unique opportunity to exchange innovative technologies, as well as to initiate and establish new business partnerships specializing in similar industries. The above mentioned events engage organizational innovation brokers from the EEN and from its partner institutions (universities, business support institutions, local government units, private entities). The authors have made efforts to present the distribution scheme of various types of promotion instruments (Table 1) for individual European countries and regions. Additionally, the available data were analyzed in terms of the type of the partner supporting individual events. One of the main expected results of the Innovation Intermediary Network is the increase in the number of small and medium-sized enterprises (SMEs) linked with other business actors across Europe for cross-border cooperation, technology, and knowledge transfer, as well as innovation partnerships [37,38].
The article presents the following research hypotheses:
  • The forms of meetings organized in different parts of Europe are varied.
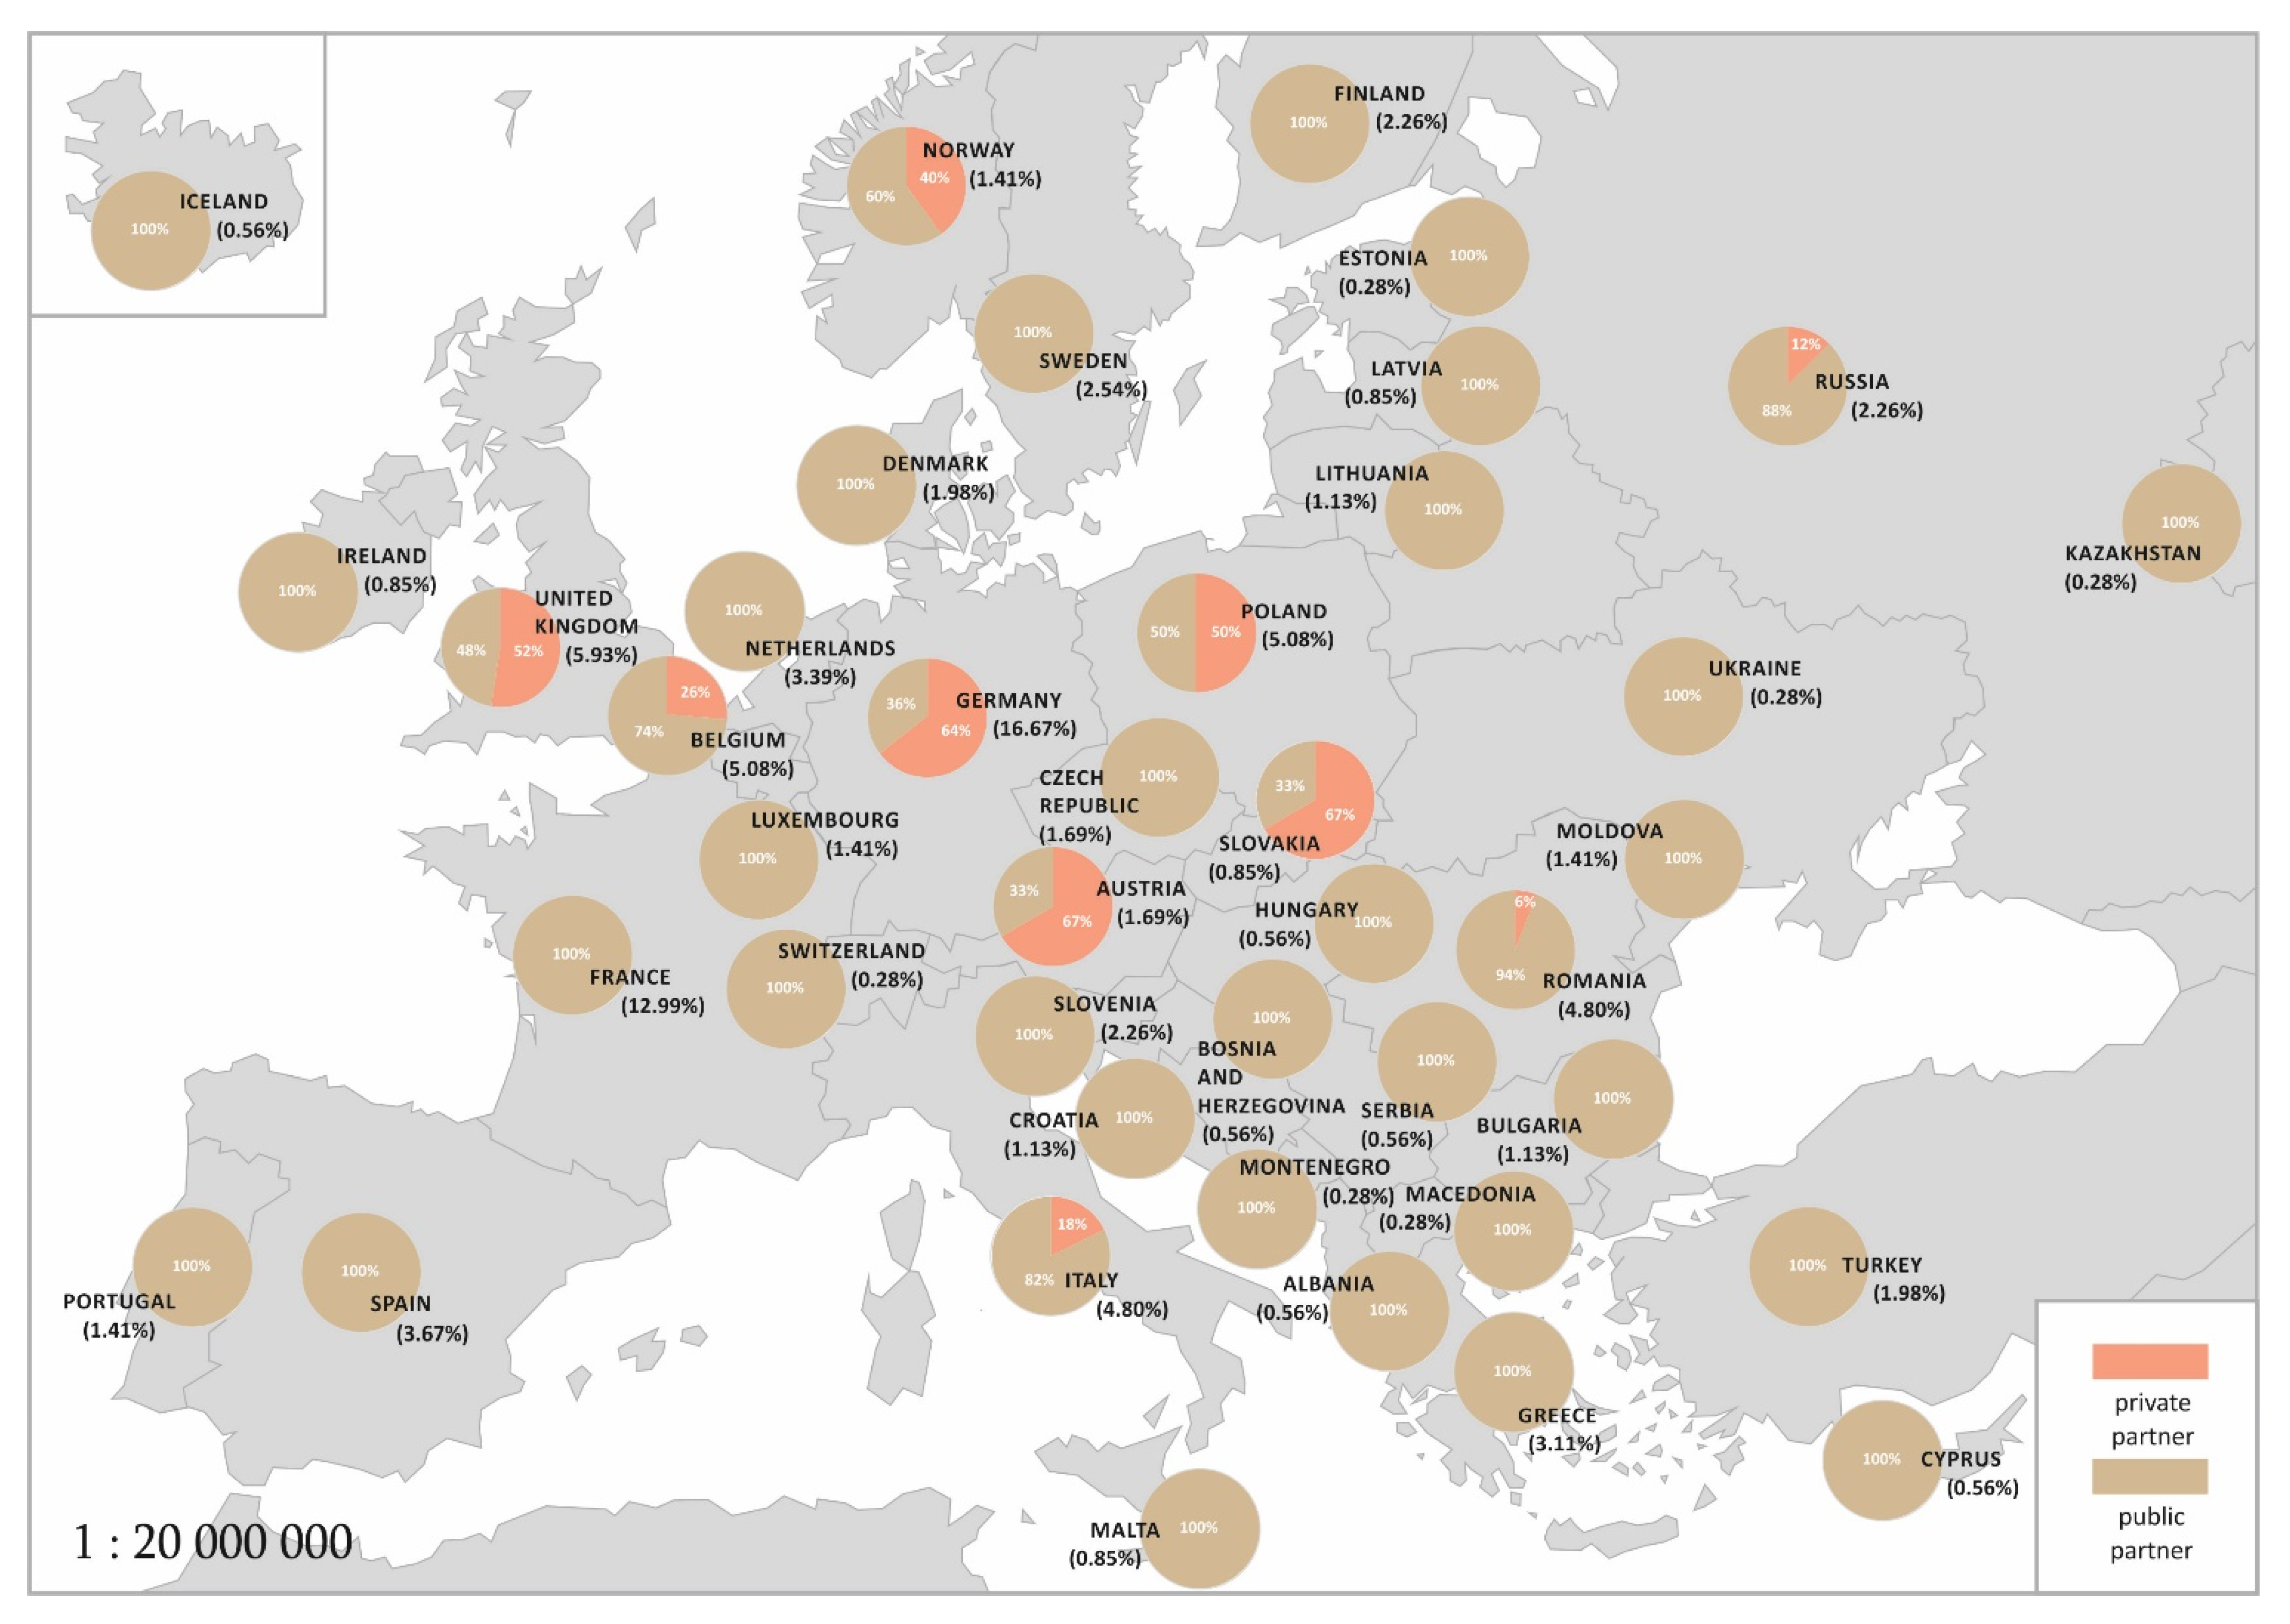
  • In countries from different parts of the European continent, there is a diversity in the selection of an event partner (public or private).

3. Results and Discussions

3.1. Analysis of the Structure of Promotional Instruments in Individual Countries of Respective European Regions

In the first stage of the research, the structure of types of promotional instruments in Europe as a whole was analyzed, and then analyzed again for its individual countries and regions. As can be seen from the diagram presented in Figure 1, BEs are most often organized among the analyzed events. Of this type, 221 events were registered, i.e., over 62% percent of all analyzed cases. A significant group is also CM meetings, of which 107 were held all over Europe, i.e., slightly over 30% of all events. Out of 354 analyzed cases, C/S/ID were organized 18 times, which is slightly above 5%. On the other hand, organizing W and SGM events and using these forms as promotion instruments was rare.
In the structure of promotional instruments, SGM has the lowest share as the sectoral groups—and constitutes the framework for discussing, planning, and executing joint actions in order to provide entrepreneurs with services of European-level added value [37]. These are meetings, in which entrepreneurs do not participate, in which the participating network partners develop solutions dedicated to the development of the RES sector. In the analyzed period, 105 SGM meetings were held, 6 of which were dedicated to RES. There are 17 thematic SGMs within the EEN. The RES-related topics are dealt with by the Intelligent Energy Sector Group. In turn, BE (62.4%) complement industry fair and exhibition events. Fair organizers offer EEN innovation brokers and their partners the opportunity to present RES technologies during the events accompanying the main event. The increasing frequency of RES sector fairs results in an increased supply of BE offered by the network. A 30.2% share of CM’s results from the activity of the network and its public partners (especially local government) in the organization of direct meetings of parties interested in technological cooperation in the field of renewable energy, but on-site, in the place of active operation of the technology transfer parties.
Figure 2 demonstrates how the analyzed cases of promotion instruments are distributed among individual European countries. Additionally, the map for each country where the events took place presents a distribution of the types of the respective events.
The results of the analysis of the distribution of all types of meetings per individual European countries indicate that Germany and France are definitely leaders in the organization of this type of event. It turns out that every sixth such meeting is organized in Germany (16.67%) and every eighth in France (12.99%). The above situation is a consequence of trade fair activity—at RES fairs—in the indicated countries, which are most often exhibition events accompanied by BE and W. The second group of countries where the percentage of all European events oscillates around 5% (every twentieth meeting) are: UK (5.93%), Belgium (5.08%), Poland (5.08%), Italy (4.80%), and Romania (4.80%). In the analyzed period, large fair events took place in these geographical locations. The countries where more than three events were organized in the years 2017–2018, i.e., over 1% of all cases, include: Austria (1.69%), Bulgaria (1.13%), Croatia (1.13%), Czech Republic (1.60%), Denmark (1.98%), Finland (2.26%), Greece (3.11%), Lithuania (1.13%), Luxemburg (1.41%), Moldova (1.41%), Norway (1.41%), Portugal (1.41%), Serbia (2.26%), Slovenia (2.26%), Spain (3.67%), Sweden (2.45%), Turkey (1.98%). The activity of the EEN centers and their partners can support the above results in respective countries. In the other countries listed in the database, the number of organized events accounted for less than 1% of all European events.
Upon analyzing Figure 2 in the context of the types of events organized in individual countries, it can be seen that in most countries, the general tendency is to organize mainly BE. However, there are countries where the number of CM meetings is similar to that of BE meetings. Among the countries with more than four events of this type, this can be observed in: Austria, Bulgaria, Croatia, Lithuania, Moldova, Norway, Portugal. In these countries, entrepreneurs who are beneficiaries of the EEN request a direct exchange of experiences with a potential RES technology partner at the place of their business. This is often associated with the exchange of experiences not only in terms of technology but also the infrastructure necessary for RES.
In the same group of countries, the greatest disproportions in favor of BE occur in the Czech Republic, where over 83% are BEs and only slightly over 16% CMs. On the other hand, in Moldova, the situation is quite the opposite: out of five promotional events, as many as four were CMs. As a result, they represented 80% of all events. Among the countries in which at least five events were held, the predominance of CMs over BEs was observed only in Norway and Portugal. This can be caused by the activity of the respective centers and their public partners (e.g., local governments).
As observed in the previous analysis (see Figure 1), the remaining event types, i.e., C/S/ID, SGM and W, are organized much less frequently and in most cases their occurrence is marginal. The exceptions are C/S/ID events in Germany, which were held 10 times in the analyzed period, i.e., over 16% of all meetings organized in Germany. Please note the education and popularization strategy adopted and implemented for RES by Germany [39].
In the context of the diversity of the analyzed promotion instruments, Great Britain deserves attention, as is the only country where all types of events were organized. In the analyzed period, the activity of the network’s centers and its partners allowed to leverage the extensive offer of trade and exhibition events in the UK.
This part of the analysis can be summarized with the conclusion that there is a noticeable differentiation in the structure of the types of promotional events organized for individual European countries. However, due to the significant fragmentation of cases into individual countries, it is not possible to perform statistical tests to verify the statistical significance of the indicated differentiation.

3.2. Analysis of the Structure of Promotional Instruments in Individual Regions of Europe

To enable a more detailed statistical analysis of the relationship between the type of promotional instrument and its physical location, the countries included in the database were assigned to the appropriate part of Europe. To organize the course of research, the European continent was divided into five main regions. Geographical division of Europe includes four regions (Eastern, Western, Northern, and Southern), with an additional fifth region, i.e., Central Europe [40]. The proposed division into five parts is one of the conventional divisions of Europe, resulting mainly from the geographical location, but also from common history and culture:
  • Western Europe—Belgium, the Netherlands, Luxembourg, Great Britain, Ireland and France.
  • Central Europe—Austria, Czech Republic, Germany, Hungary, Liechtenstein, Poland, Slovakia, Slovenia, and Switzerland.
  • Northern Europe—Finland, Iceland, Norway, Sweden, and Denmark.
  • Eastern Europe—Belarus, Bulgaria, Estonia, Lithuania, Latvia, Moldova, Romania, Russia, Ukraine and Kazakhstan.
  • Southern Europe—Albania, Andorra, Bosnia and Herzegovina, Croatia, Greece, Spain, Macedonia, Malta, Monaco, Portugal, San Marino, Serbia, Montenegro, Turkey, Vatican, and Italy.
The map of Europe in Figure 3 shows the data on the distribution of all organized events among the individual parts of the continent. Additionally, for each part of Europe, the structure of promotional instruments was presented according to the division adopted in Table 1. Directly from the data presented in Figure 3, it can be seen that most of the RES-promoting events registered in the EEN database took place in Western and Central Europe. The number of meetings in each of these parts of Europe was over 100, which accounted for approximately 30% of all events.
Upon analyzing the pie charts showing the distribution of event types for individual regions of Europe, it can be noticed that in four out of five parts of Europe (according to the general distribution) BE dominates due to the wide range of fairs and exhibitions organized and offered in this part of the continent. It is worth noting, however, that in the case of Eastern Europe, CM events are organized more often.
Moreover, a detailed comparison of the pie charts allows a conclusion that in the western part of Europe, BEs were organized relatively more often than in other regions. In this part of Europe, the structure index for this type of event is 7 percentage points higher than in northern Europe and more than 10 percentage points higher than in the rest of Europe. This is a result of the activity of the EEN centers and their partners, in cooperation with the organizers of trade and exhibition events, as well as popularization of the event among potential participants. The occurrence of W and SGM, if any, is marginal for each part of Europe. On the other hand, the percentage of C/S/ID meetings is the highest in Central Europe, i.e., over 10%. In the case of other regions, these values are negligible or this type of meeting is not observed. BEs are organized alongside of trade fairs, therefore it is natural that where such fairs take place, more BEs occur. In addition, the EEN’s focus is on international cooperation agreements, and the fairs are visited by entrepreneurs presenting their offer or looking for a specific technology or service, which gives the network’s clients a great chance for international contact. C/ID/S are more used to promote network services and acquire customers.
In order to verify whether the indicated differences in the distribution of the structure of event types for the analyzed regions of Europe are significant, the Pearson independence test was carried out. The probability value obtained in the test is p = 0.0106 and is lower than the adopted significance level. Therefore, it can be concluded that there is a significant variation in the structure of the types of events for individual regions of Europe. This could mean that the organizers’ decisions as to the type of events organized in particular regions of Europe are deliberate and in some way adjusted to the region in which they take place.

3.3. Analysis of the Diversity of Events Per Dominant Partner in Individual Countries and Parts of Europe

As already mentioned, the second factor considered in this study with regard to the analyzed promotional events was the type of partner supporting the event. In the paper, the authors assigned to each event one of the two types of the supporting partner, i.e., public or private (depending on the category, to which the main supporting partner belonged). The choice of a partner to support the event is related to the affiliation of the local EEN center. Depending on the country, EEN centers are present in public institutions such as universities, or private organizations, and depend on the environment of their host organizer. In addition, the dominant type of institution, i.e., public institutions or the private sector, depend on the industry. A reliable partner provides substantive support to the event and raises its rank. Chart 4 presents information on the distribution of the partner selection for all analyzed events from the database. The diagram below clearly shows that the organizers of the analyzed promotional events in Europe much more often chose a public institution as their main partner. It is often the same partner who is the partner of the fair, of which the BE is part, but it is also about raising the prestige of the meetings.
In the next stage of the research, it was verified whether the advantage of the public partner in the organization of the discussed events applies to all countries in which the events took place. For this purpose, the map of Europe shown in Figure 4 includes pie charts offering information about the percentage distribution of the partner type. Based on the above, it can be concluded that for most countries, the choice of the public partner prevails, which is in line with the general tendency (see Figure 5). For a large group of countries, entities from the public sector were invited to cooperate during the organization of promotional events in 100% of cases. An interesting case is France, where in all 46 events, the main supporting partner was a public organization. Countries with a relatively large number of events (over 6) organized, of which all had a public partner, include: Spain, Greece, Sweden, Turkey, Czech Republic, Denmark, Slovenia, and the Netherlands.
However, there is a group of countries where the choice of a private partner is no less frequent than that of a public partner. These are Germany, Slovakia, Austria, England, and Poland. In Poland, it is not only the public sector that plays a significant role in the given economic sector. Often also large private organizations get involved and are invited to cooperate. This raises the prestige of meetings, and allows smaller companies the opportunity to gain experience and/or enter into cooperation with a larger market player. To verify the hypothesis whether the type of event, its location, and specifically the region of Europe in which the event takes place determines the choice of an event partner, the data had to be aggregated accordingly. The process included assigning data from individual countries to a group of data related to the region of Europe in which a given country is located (exactly as it was in the case of event types). Research results for data aggregated as per individual parts of the European continent are presented in Figure 6.
When analyzing the results of the research presented in the figure above, it can be observed that in four European regions, the predominant option is the public partner. The situation is different in Central Europe, where the cooperation with private organizations reaches a significantly higher percentage compared to the other regions of Europe. Germany, Slovakia, and Austria are in the lead in this respect. In those parts of Europe where private organizations are invited less frequently, there is also a slight variation in the percentage distribution. In Western Europe, in 15% of cases, the organizer invited a private partner to participate, and this mainly concerns meetings organized in the UK. For meetings organized in Northern Europe, the figure is 9.4%, while in Eastern and Southern Europe, the private partner of an event occurs less than once in twenty events. A noticeable difference in the percentage distribution of the supporting partner type for Central Europe, as compared to other regions of Europe, may result from the fact that in countries such as Germany and Austria, also partly in Poland, there are many private scientific institutions that are significantly involved in the development and promotion of the RES market. In this case, the reason is more probably the affiliation of the EEN center with the given types of institutions. Moreover, the private sector may have a dominant role in a given sector of a country’s economy rather than the public one. In order to verify whether the indicated differentiation in the choice of the organizational partner for individual regions of Europe is statistically significant, the Pearson independence test was performed. The value of the test probability obtained was close to 0. Therefore, it can be concluded there is a significant variation in the structure of the types of events for individual regions of Europe. This could mean that the organizers’ decisions as to the type of events organized in particular regions of Europe are deliberate and in some way adjusted to the region in which they take place.

4. Conclusions

On 18 December 2017, the European Council adopted its position on a directive promoting the use of RES energy throughout the Member States. The EU made a commitment to ensure at least 27% of its consumed energy comes from renewable sources by 2030. This is a major challenge but also an opportunity to achieve economic growth through innovation and a sustainable, competitive energy policy. Renewable energy production often depends on local or regional SMEs. The opportunities for the development of local entrepreneurship, sustainable growth, and high-quality employment that investment in regional and local RES energy production offers in the Member States are important. An important role in this respect rests on European technology transfer networks [41,42,43]. They not only develop innovation and promote sustainable development but also, by organizing meetings and integrating environments, effectively stimulate the development and transfer of RES technologies. The presented results indicate that various forms of activities stimulating technology transfer are used for this purpose. The organizers of these meetings try to differentiate them in the respective countries as per form (brokerage event, company mission, conference/seminar/information day, sector group meeting, workshop) and the type of lead partner (private versus public). The research goal formulated by the authors is to verify whether the type of promotional instrument used has a significant connection with the location of organized events and to examine whether the choice of the supporting partner is determined by the geographical location of the organized event.
Recommendations:
  • Undertake further research aimed at the determinants of choice and effectiveness of individual forms. Defining them would be useful for partner networks, institutions supporting the development of RES and directly, for meeting organizers. Further research could contribute to strengthening cooperation and improving the effectiveness of RES popularization and achieving the ambitious goals set in the EU in this respect.
  • Promotion initiatives by brokerage networks in terms of RES technology transfer should stimulate and support national and regional development measures in these areas. They should also promote the exchange of best practices in terms of RES energy production between local and regional development initiatives and activate brokers in innovation networks.

Author Contributions

Conceptualization, Z.G.-S., M.S., R.K.; methodology, Z.G.-S., M.S., R.K., J.D.; validation, A.S.-S., M.N.; formal analysis, Z.G.-S., M.S., R.K.; investigation, Z.G.-S., M.S., R.K., J.D., A.S.-S., M.N.; resources, Z.G.-S., M.S., R.K., J.D.; data curation, A.S.-S., M.N.; writing—original draft preparation, Z.G.-S., M.S., R.K.; writing—Z.G.-S., M.S., R.K.; visualization M.S., Z.G.-S., supervision, A.S.-S., M.N. All authors have read and agreed to the published version of the manuscript.

Funding

Publication financed by the subsidy granted to the Cracow University of Economics. The publication is financed by a subsidy for the Faculty of Management of AGH University for the maintenance and development of research potential.

Conflicts of Interest

The authors declare no conflict of interest.

References

  1. Knockaert, M.; Spithoven, A.; Clarysse, B. The impact of technology intermediaries on firm cognitive capacity additionality. Technol. Forecast. Soc. Chang. 2014, 81, 376–387. [Google Scholar] [CrossRef] [Green Version]
  2. Lin, H.; Zeng, S.; Liu, H.; Li, C. How do intermediaries drive corporate innovation? A moderated examination. J. Bus. Res. 2016, 69, 4831–4836. [Google Scholar] [CrossRef]
  3. Howells, J. Intermediation and the role of intermediaries in innovation. Res. Policy 2006, 35, 715–728. [Google Scholar] [CrossRef]
  4. Sieg, J.H.; Wallin, M.W.; von Krogh, G. Managerial challenges in open innovation: A study of innovation intermediation in the chemical industry. Policy 2010, 40, 281–291. [Google Scholar] [CrossRef]
  5. Smedlund, A. The roles of intermediaries in regional knowledge systems. J. Intellect. Cap. 2006, 7, 204–222. [Google Scholar] [CrossRef] [Green Version]
  6. Klerkx, L.; Leeuwis, C. Matching demand and supply in the agricultural knowledge infrastructure: Experiences with innovation intermediaries. Food Policy 2008, 33, 260–276. [Google Scholar] [CrossRef]
  7. Klerkx, L.; Leeuwis, C. Balancing multiple interests: Embedding innovation intermediation in the agricultural knowledge infrastructure. Technovation 2008, 28, 364–378. [Google Scholar] [CrossRef]
  8. Edler, J.; Yeow, J. Connecting demand and supply: The role of intermediation in public procurement of innovation. Res. Policy 2016, 45, 414–426. [Google Scholar] [CrossRef]
  9. Gródek-Szostak, Z.; Szeląg-Sikora, A.; Sikora, J.; Korenko, M. Prerequisites for the cooperation between enterprises and business support institutions for technological development. Business and Non-profit Organizations Facing Increased Competition and Growing Customers’ Demand. In Proceedings of the 16th International Conference, Tomaszowice, Poland, 19–20 June 2017. [Google Scholar]
  10. Boon, W.P.; Moors, E.H.; Kuhlmann, S.; Smits, R.E. Demand articulation in emerging technologies: Intermediary user organisations as co-producers? Res. Policy 2011, 40, 242–252. [Google Scholar] [CrossRef]
  11. Gródek-Szostak, Z.; Luc, M.; Szeląg-Sikora, A.; Sikora, J.; Niemiec, M.; Ochoa Siguencia, L.; Velinov, E. Promotion of RES in a Technology Transfer Network. Case Study of the Enterprise Europe Network. Energies 2020, 13, 3445. [Google Scholar] [CrossRef]
  12. Szeląg-Sikora, A.; Sikora, J.; Niemiec, M.; Gródek-Szostak, Z.; Kapusta-Duch, J.; Kuboń, M.; Komorowska, M.; Karcz, J. Impact of Integrated and Conventional Plant Production on Selected Soil Parameters in Carrot Production. Sustainability 2019, 11, 5612. [Google Scholar] [CrossRef] [Green Version]
  13. Kapusta-Duch, J.; Szeląg-Sikora, A.; Sikora, J.; Niemiec, M.; Gródek-Szostak, Z.; Kuboń, M.; Leszczyńska, T.; Borczak, B. Health-Promoting Properties of Fresh and Processed Purple Cauliflower. Sustainability 2019, 11, 4008. [Google Scholar] [CrossRef] [Green Version]
  14. Gródek-Szostak, Z.; Malik, G.; Kajrunajtys, D.; Szeląg-Sikora, A.; Sikora, J.; Kuboń, M.; Niemiec, M.; Kapusta-Duch, J. Modeling the Dependency between Extreme Prices of Selected Agricultural Products on the Derivatives Market Using the Linkage Function. Sustainability 2019, 11, 4144. [Google Scholar] [CrossRef] [Green Version]
  15. Niemiec, M.; Chowaniak, M.; Sikora, J.; Szeląg-Sikora, A.; Gródek-Szostak, Z.; Komorowska, M. Selected Properties of Soils for Long-Term Use in Organic Farming. Sustainability 2020, 12, 2509. [Google Scholar] [CrossRef] [Green Version]
  16. Sikora, J.; Niemiec, M.; Tabak, M.; Gródek-Szostak, Z.; Szeląg-Sikora, A.; Kuboń, M.; Komorowska, M. Assessment of the Efficiency of Nitrogen Slow-Release Fertilizers in Integrated Production of Carrot Depending on Fertilization Strategy. Sustainability 2020, 12, 1982. [Google Scholar] [CrossRef] [Green Version]
  17. Velinov, E.; Petrenko, Y.; Vechkinzova, E.; Denisov, I.; Ochoa Siguencia, L.; Gródek-Szostak, Z. “Leaky Bucket” of Kazakhstan’s Power Grid: Losses and Inefficient Distribution of Electric Power. Energies 2020, 13, 2947. [Google Scholar] [CrossRef]
  18. Sikora, J.; Niemiec, M.; Szeląg-Sikora, A.; Gródek-Szostak, Z.; Kuboń, M.; Komorowska, M. The Impact of a Controlled-Release Fertilizer on Greenhouse Gas Emissions and the Efficiency of the Production of Chinese Cabbage. Energies 2020, 13, 2063. [Google Scholar] [CrossRef] [Green Version]
  19. Sikora, J.; Niemiec, M.; Szeląg-Sikora, A.; Gródek-Szostak, Z.; Kuboń, M.; Komorowska, M. The Effect of the Addition of a Fat Emulsifier on the Amount and Quality of the Obtained Biogas. Energies 2020, 13, 1825. [Google Scholar] [CrossRef] [Green Version]
  20. Shirley, M. Institutions and Development. In Handbook of New Institutional Economics; Meénard, C., Shirley, M., Eds.; Springer: Dordrecht, The Netherlands, 2005. [Google Scholar]
  21. Sanderink, L.; Nasiritousi, N. How institutional interactions can strengthen effectiveness: The case of multi-stakeholder partnerships for renewable energy. Energy Policy 2020, 141, 111447. [Google Scholar] [CrossRef]
  22. Sawhney, M.; Prandelli, E.; Verona, G. The power of innomediation. MIT Sloan Manag. Rev. 2003, 44, 77–82. [Google Scholar]
  23. Verona, G.; Prandelli, E.; Sawhney, M. Innovation and virtual environments: Towards virtual knowledge brokers. Organ. Stud. 2006, 27, 755–788. [Google Scholar] [CrossRef]
  24. Sapsed, J.; Grantham, A.; De Fillippi, R. A bridge over troubled waters: Bridging organisations and entrepreneurial opportunities in emerging sectors. Res. Policy 2007, 36, 1314–1334. [Google Scholar] [CrossRef]
  25. Nambisan, S.; Sawhney, M. A buyer’s guide to the innovation bazaar. Harv. Bus. Rev. 2007, 85, 109–118. [Google Scholar]
  26. Arnold, E.; Clark, J.; Javorka, Z. Impacts of European RTOs: A Study of Social and Economic Impacts of Research and Technology Organisations; Report to European Association of Research and Technology Organisations (EARTO); Technopolis Ltd.: Brighton, UK, 2010. [Google Scholar]
  27. Tran, Y.; Hsuan, J.; Mahnke, V. How do innovation intermediaries add value? Insight from new product development in fashion markets. R&D Manag. 2011, 41, 80–91. [Google Scholar]
  28. Landry, R.; Amara, N.; Cloutier, J.S.; Halilem, N. Technology transfer organizations: Services and business models. Technovation 2013, 33, 431–449. [Google Scholar] [CrossRef]
  29. Erickson, J.D.; Chapman, D. Photovoltaic technology: Markets, economics, and rural development. World Dev. 1995, 23, 1129–1141. [Google Scholar] [CrossRef]
  30. Rai, V.; Schultz, K.; Funkhouser, E. International low carbon technology transfer: Do intellectual property regimes matter? Glob. Environ. Chang. 2014, 24, 60–74. [Google Scholar] [CrossRef]
  31. Theodorou, S.; Florides, G.; Tassou, C. The use of multiple criteria decision making methodologies for the promotion of RES through funding schemes in Cyprus, A review. Energy Policy 2010, 38, 7783–7792. [Google Scholar] [CrossRef]
  32. Krajačić, G.; Duić, N.; Tsikalakis, A.; Zoulias, M.; Caralis, G.; Panteri, E.; da Graca Carvalho, M. Feed-in tariffs for promotion of energy storage technologies. Energy Policy 2011, 39, 1410–1425. [Google Scholar] [CrossRef] [Green Version]
  33. Haas, R.; Panze, C.; Resch, G.; Ragwitz, M.; Reece, G.; Held, A. A historical review of promotion strategies for electricity from renewable energy sources in EU countries. Renew. Sustain. Energy Rev. 2011, 15, 1003–1034. [Google Scholar] [CrossRef]
  34. Ragwitz, M.; Huber, C.; Resch, G. Promotion of renewable energy sources: Effects on innovation. Int. J. Public Policy 2007, 2, 32–56. [Google Scholar] [CrossRef]
  35. Moreno, B.; Lopez, A.J. The Effect of Renewable Energy on Employment. The Case of Asturias (Spain). Renew. Sustain. Energy Rev. 2008, 12, 732–751. [Google Scholar] [CrossRef]
  36. Ferraro, G.; Iovanella, A. Technology transfer in innovation networks: An empirical study of the Enterprise Europe Network. Int. J. Eng. Bus. Manag. 2017, 9. [Google Scholar] [CrossRef] [Green Version]
  37. Sagan, D. Event Marketing—Innowacja czy Niedoceniana Forma Promocji? Available online: http://nf.pl/manager/event-marketing-innowacja-czy-niedoceniana-forma-promocji,,53474,82 (accessed on 17 September 2020).
  38. Ogundele, T.J.; Chow, C.Y.; Zhang, J.D. SoCaST: Personalized event recommendations for event-based social networks: A multi-criteria decision making approach. IEEE Access 2018, 6, 27579–27592. [Google Scholar] [CrossRef]
  39. Gródek-Szostak, Z.; Luc, M.; Szeląg-Sikora, A.; Niemiec, M.; Kajrunajtys, D. Economic Missions and Brokerage Events as an Instrument for Support. of International Technological Cooperation between Companies of the Agricultural and Food Sector. In Infrastructure and Environment; Springer: Cham, Switzerland, 2019; pp. 303–308. [Google Scholar]
  40. Europe Countries and Regions. Available online: https://www.worldatlas.com/articles/the-four-european-regions-as-defined-by-the-united-nations-geoscheme-for-europe.html (accessed on 18 October 2020).
  41. Gródek-Szostak, Z.; Luc, M. Company mission events i brokeage events jako narzędzia wsparcia międzynarodowej współpracy technologicznej. In Zarządzanie Restrukturyzacją: Innowacyjność i Konkurencyjność w Obliczu Zmian; Towarzystwo Naukowe Organizacji i Kierownictwa, Dom Organizatora: Toruń, Poland, 2019; pp. 231–239. [Google Scholar]
  42. Enterprise Europe Network. Available online: https://een.ec.europa.eu/my/n/sector-groups (accessed on 9 September 2020).
  43. Citizens’ Participation in the Energiewende. Available online: https://www.cleanenergywire.org/factsheets/citizens-participation-energiewende (accessed on 17 September 2020).
Figure 1. Structure types of events in the Enterprise Europe Network (EEN) in 2017–2018 for entire Europe.
Energies 13 05752 g001
Figure 2. Structure of types of promotional instruments in the EEN in 2017–2018 for selected European countries.
Energies 13 05752 g002
Figure 3. Structure of EEN events in 2017–2018 for selected regions of Europe.
Energies 13 05752 g003
Figure 4. Structure events in the EEN in 2017–2018 for selected European countries, including the type of partner.
Energies 13 05752 g004
Figure 5. Structure of promotional instruments in the EEN in 2017–2018 for entire Europe, including the type of leading partner.
Energies 13 05752 g005
Figure 6. Structure of partners for events organized by the EEN in 2017–2018.
Energies 13 05752 g006
Table 1. The characteristic of events used by the Enterprise Europe Network (EEN).
No.Promotion InstrumentCharacteristic
1.Brokerage Event (BE)A direct form of searching for a cooperation partner, offering the possibility to exchange information on innovative technologies, new trends, as well as to search for business and technological partners [11], e.g.,:
  • Brokerage event during RoEnergy Trade Fair 2017 South-East Europe
  • E² Tech4Cities 2017—Energy & Efficiency Technologies for cities
  • GreenWin International Conferences & Brokerage Event - Green Chemistry & White Biotechnology: From Innovation to Business
2.Company Mission (CM)A direct form of reaching the right potential business partner in the natural place of their operation, which allows learning not only about their possibilities but also their immediate business and legal environment [11], np.:
  • Company Mission to IFAT 2018 in Munich
  • Company Mission of the Czech companies to InterSolar Europe 2017
  • Green Technology Trade mission to Vietnam 2017
3.Conference/Seminar/Information Day (C/S/ID)Open information meetings, promoting the idea of technological cooperation in a specific sector/industry, e.g.,:
  • Project Factory H2020 Energy Technologies
  • Energy Efficiency in Horizon 2020
  • Webinar on “Water and energy sectors in the Vietnamese market”
4.Sector Group Meeting (SGM)Meetings of network partners who take up cooperation in order to meet the specific needs of their clients, in a specific sector, e.g., renewable energy, e.g.,:
  • SGIE Autumn 2017 Meeting in the Netherlands
  • SGIE Spring 2017 Meeting in Cracow
  • SGIE Spring 2018 Meeting in Bulgaria
5.Workshop (W)Open workshop meetings, to prepare for the execution of international technology transfers and internationalization, e.g.,:
  • Round table on resource efficiency in SMEs/ Brainstorming: Ideas for joint projects
  • Bridging Borders with Innovation
  • About Japan Webinar 80: Hydrogen Technology Market in Japan
Publisher’s Note: MDPI stays neutral with regard to jurisdictional claims in published maps and institutional affiliations.

