Abstract
This work contributes to the understanding of mechanisms that lead to increased carbon monoxide (CO) concentrations in gas turbine combustion systems. Large-eddy simulations (LES) of a full scale high pressure prototype Siemens gas turbine combustor at three staged part load operating conditions are presented, demonstrating the ability to predict carbon monoxide pollutants from a complex technical system by investigating sources of incomplete CO oxidation. Analytically reduced chemistry is applied for the accurate pollutant prediction together with the dynamic thickened flame model. LES results show that carbon monoxide emissions at the probe location are predicted in good agreement with the available test data, indicating two operating points with moderate pollutant levels and one operating point with CO concentrations below 10 ppm. Large mixture inhomogeneities are identified in the combustion chamber for all operating points. The investigation of mixture formation indicates that fuel-rich mixtures mainly emerge from the pilot stage resulting in high equivalence ratio streaks that lead to large CO levels at the combustor outlet. Flame quenching due to flame-wall-interaction are found to be of no relevance for CO in the investigated combustion chamber. Post-processing with Lagrangian tracer particles shows that cold air—from effusion cooling or stages that are not being supplied with fuel—lead to significant flame quenching, as mixtures are shifted to leaner equivalence ratios and the oxidation of CO is inhibited.
1. Introduction
The operating hours of gas turbines at part load are becoming increasingly important in the energy turnaround. Part load operation of gas turbines is limited by incomplete carbon monoxide (CO) burnout at the lowest power settings [1]. To overcome this problem, fuel staging is applied distributing the fuel to different stages to flexibly control combustion to achieve low emissions and to avoid thermoacoustic oscillations [2]. Especially at part load, this can lead to the situation where not all the stages are supplied with fuel. The interaction of flames with cold air from the adjacent deactivated burner has a significant impact on the formation of CO. Additional effects such as short system residence times, unfavorable interaction with cooling air or flame quenching due to wall interaction promote high CO levels at the system outlet [3]. The formation of carbon monoxide has been experimentally investigated in various works [4,5,6]. Howard et al. [7] found that the consumption of CO is kinetically limited by the consumption of hydroxyl (OH), which presents the main oxidation path. The quenching of the flame inhibits the CO oxidation and consequently leads to an increase of CO emissions, which has been addressed by Correa [8], who investigated flame quenching effects due to flame-wall interaction and by mixing with cold gases. Mann et al. [9] investigated the flame-wall interaction of lean premixed flames and found that leaner flames quench further away from the wall. Nilsson and Bai [10] demonstrated that aerodynamic strain leads to a reduction and flame wrinkling to an increase of carbon monoxide formation.
Numerical investigations using large-eddy simulations (LES) have shown promising results for the prediction of CO pollutants [11,12,13,14]. Studies analyzing carbon monoxide at gas turbine part load conditions have been performed by Wegner et al. [15] and Klarmann et al. [16], where Reynolds-averaged Navier-Stokes (RANS) simulations with a flamelet approach [17] have been performed. A progress variable was introduced to model the slow CO oxidation in the post flame region, while considering stretch effects [16]. Menon [18] and Eggenspieler et al. [19] investigated flames near the lean-blowout limit using LES with a flamelet approach and suggested to account for finite rate kinetics to improve predictions.
The sources leading to incomplete CO burnout in gas turbines in staged part load operation are not well understood and further investigations beyond the lab scale are required. In the Siemens test facility Clean Energy Center (CEC), many staged part load operation conditions of a prototype gas turbine combustor were tested, showing different carbon monoxide levels at the probe location. In this work, a validated LES combustion modeling approach [20] is applied for a predictive study of a high pressure full scale technology prototype Siemens combustion system at part load to reveal sources leading to incomplete CO burnout observed at two of the tested operating conditions, with the focus on the following goals: (i) to demonstrate the ability to predict CO from a very complex full scale combustor and, (ii) to investigate the impact of mixture formation in the different fuel stages on CO and, (iii) to analyze the effect of local flame quenching due to secondary air on CO.
2. Numerical Modeling
Favre-filtered governing equations for mass, momentum, species mass fractions and absolute enthalpy are solved, using a commonly made unity Lewis number assumption. Viscosity is determined from Sutherland’s law and the laminar and turbulent Prandtl and Schmidt numbers are . In order to accurately resolve the thin flame front on the numerical grid, the dynamic thickened flame (DTF) model [21,22,23] is used by introducing a thickening factor F to the species and enthalpy transport equations. The unresolved flame wrinkling is modeled by an efficiency function E using the modified [24] Charlette model [25], with . In the DTF model, a flame sensor is introduced to avoid unphysical diffusion away from the flame and to accurately predict pure mixing. The DTF model applied to the Favre-filtered transport equations for each species mass fraction and absolute enthalpy results in the following Equations (1) and (2) presented in Einstein summation convention:
Equations (1) and (2) depend on density , velocity , viscosity , turbulent viscosity , Prandtl number Pr, turbulent Prandtl number , Schmidt number Sc, turbulent Schmidt number , pressure p, the net formation rate for species , the thickening factor F, the efficiency function E, the flame sensor function , the absolute enthalpy is the sum of the chemical and sensible enthalpy, and the kinetic energy .
For the flame sensor function, a modified version of the formulation by Legier et al. [23] is used to spatially limit thickening to a smaller region of the flame, as shown in Equation (3).
In this equation, and are the heat release rate and the maximum heat release rate from a 1D flame. The flame thickening factor F is dynamically calculated as . The maximum thickening factor in each cell is determined as and depends on the number of cells n on which the flame thickness is to be resolved (here, ), the mesh cell size and the laminar flame thickness .
Reaction kinetics are described by analytically reduced chemistry (ARC) by Lu and Law [26] (denoted as Lu19 in the following). This mechanism was derived from GRI-3.0 [27] and contains 19 transported species and 11 species using quasi steady state approximations (QSSA).
Figure 1 shows the laminar flame speed at different equivalence ratios and the dry and corrected CO mole fraction after a reference system residence time in dependency of different flame temperatures comparing Lu19, GRI-3.0, DRM19 [28] and state of the art AramcoMech2.0 [29] mechanism.
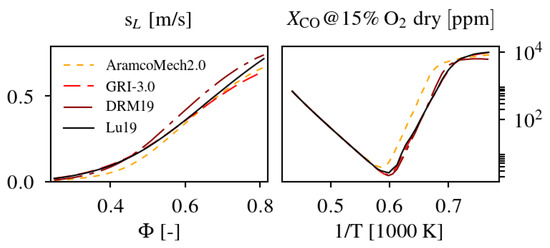
Figure 1.
Laminar flame speed in dependency of equivalence ratio (left) and dry and corrected carbon monoxide mole fractions over adiabatic flame temperature (right) for different reaction mechanisms at gas turbine part load conditions.
For both laminar flame speed and CO mole fractions, a very good agreement between Lu19 and GRI-3.0 is visible, while minor deviations are identified for for . DRM19 predicts the highest flame speeds for and AramcoMech2.0 agrees with Lu19 and GRI-30 for , but shows lower flame speeds approaching the lean blowout limit. A parallel shift of the CO turndown curve towards higher concentrations at lowered temperatures is indicated by AramcoMech2.0, while all other reaction mechanisms predict similar CO levels. The good agreement with the other mechanisms and the low computational cost justifies the choice of the applied Lu19 reaction mechanism for this work.
3. Test and Simulation Setup
3.1. Test Configuration
In the test rig of the technology prototype Siemens gas turbine combustor, pressurized air from the compressor enters the inlet passage of the plenum through a diffusor to reproduce the inlet flow conditions in the engine [2]. A small amount of the compressed air is used for chamber cooling, while the majority mixes with fuel before entering the combustor. This combustor aims to achieve low emissions by ensuring very short residence times and consists of 28 jets that are separated in four different fuel stages, namely main stages A, B and C and a pilot stage P, respectively. The jets of the different stages are arranged in a circumferential pattern. Stage B provides the largest number of jets, followed by stages A and P, and the lowest number of jets is featured with stage C. A sketch of the combustor side view is indicated in Figure 2.
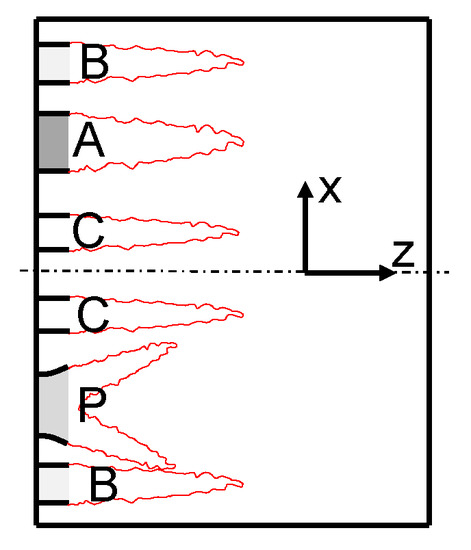
Figure 2.
Sketch of the combustor side view.
In each jet, fuel is injected to the cross flow of air. Additional air is added for effusion cooling to the combustion chamber. The burnt products leave the chamber through the transition piece into the exhaust gas passage where the emission sampling probe is located downstream of the transition exit. Experimental data for validation is limited to emission probe data, as laser measurement techniques can not be applied to optically closed gas turbine combustion chambers.
Three different staging concepts under similar load levels were compared, which mainly differ in terms of fuel staging and small pressure variations. In this work, the level of stratification of a specific staged operating point is characterized by the ratio of the nominal minimum and maximum equivalence ratio . Operating point 1 (7.42 bar) is characterized by a weak stratification (), operating point 2 (6.86 bar) by stages A and C not being supplied with fuel resulting in strong stratification ( ), and moderate stratification () for operating point 3 (7.23 bar). In this work, pure methane () is used as fuel and mass flows have been corrected by the lower heating value with respect to the natural gas utilized in the tests. The operating conditions from the test for the different cases are summarized in Table 1.

Table 1.
Operating conditions for the investigated cases. Temperatures are normalized by a reference temperature , which corresponds to the adiabatic temperature of the mass averaged equivalence ratio of each operating point (OP).
3.2. Simulation Setup
A compressible version of OpenFOAM-6 is applied for the large-eddy simulations with unstructured meshes, which required robust schemes [30]. The temporal discretization blends explicit and implicit contributions, weighted at and . Convection is discretized by a total variation diminishing (TVD) scheme to preserve stability. Eddy-diffusivity and eddy-viscosity approaches are applied, the sub-grid viscosity is computed with the transported sub-grid kinetic energy model by Yoshizawa et al. [31]. For the pressure-velocity coupling, a pressure-implicit with splitting of operators (PISO) algorithm is used.
Dirichlet boundary conditions are applied at the inlet for the fuel and air mass flows and temperatures, while the pressure is specified at the system outlet. Temperatures are applied to the chamber walls to account for non-adiabatic effects on the flame due to heated wall material and have been approximated from one-dimensional heat transfer analyses.
For a reasonable thermal boundary layer treatment at the walls, Spalding’s [32] wall functions are applied. A coarser (C) and finer mesh with 35 and 61 million hexahedral cells resolve 2.0 mm and 1.0 mm in the flame region. Simulations are parallelized using 3600 and 6096 CPUs, respectively. The sampling of the flow statistics is started after quasi steady-state is reached (∼100 ms) for another 100 ms. High velocities in small cells that are located in the fuel injector nozzles determine the simulation time-step width resulting in a corresponding convective CFL number of in the flame region. The considerable computational cost for each simulated case is presented in Table 2.
Table 2.
Cell numbers and computational cost.
4. Results and Discussion
4.1. Flow Field and Flame Properties
Contours of instantaneous normalized temperature , carbon monoxide mass fractions and axial velocity fields for the moderate stratified case 3 are presented in Figure 3, including iso-lines for different equivalence ratios.
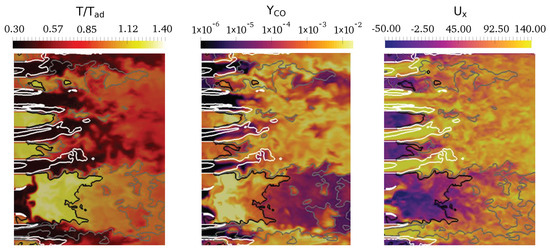
Figure 3.
Instantaneous contours of normalized temperature (left), carbon monoxide mass fraction (mid) and axial velocity (right) in the combustion chamber mid-plane with equivalence ratio iso-lines for (white), (gray) and (black).
Note that for reasons of confidentiality, contours are only shown for a small but representative section of the combustion chamber that is relevant for interpretation. Highest temperatures and values are indicated for the pilot stage, whereas leaner mixtures at lower temperatures can be observed for the other stages. For richer mixtures, as shown in the region of the pilot stage, maximum CO mass fractions can be detected. Interestingly, large carbon monoxide concentrations are also found close to the chamber walls that may be attributed to quenching effects at the cold wall. Leaner mixtures at the chamber center show large CO levels that decay towards the chamber outlet. The velocity field presents a highly turbulent flow with strong swirling motion at the pilot stage. Jet bulk velocities of 140 m/s result in a jet Reynolds number of 6.4 × .
4.2. Emission Probe
Time averaged carbon monoxide mole fractions from the simulations are compared against emission data from the probe location in Table 3. Operating points 1 (weak stratification) and 2 (strong stratification) result in measured carbon monoxide concentrations of around 30 ppm, while a good CO burnout is achieved for case 3 (moderate stratification), showing very low CO emissions of 2.51 ppm. Carbon monoxide emissions are predicted with very good agreement with the test data for case 3, while CO is underestimated for operating points 1 and 2. Similar predictions are achieved for cases 1C and 1, indicating negligible grid dependence for the prediction of CO.
Table 3.
Mean dry and corrected carbon monoxide mole fractions 15% dry at the emission probe.
As carbon monoxide levels are in overall agreement with the test data, it can be assumed that most relevant phenomena that have an impact on the formation and oxidation of CO are captured in the simulations. For this reason, further analyses focus on the effects that lead to increased CO levels for the weak and strong stratified cases 1 and 2 in comparison to the good burnout achieved in case 3 (moderate stratification).
4.3. Impact of Mixture Formation
The different staging strategies applied in the investigated cases lead to different levels of stratification and mixture inhomogeneities. To identify whether increased CO concentrations at the combustor outlet result from lean (large CO levels due to incomplete oxidation) or rich mixtures (large CO levels from mixtures at equilibrium)—with respect to the nominal global equivalence ratio —the impact of the fuel-air mixture formation on the CO formation is investigated in the following.
Figure 4 presents carbon monoxide mass fractions in dependency of the equivalence ratio for different system residence times from 1D flames. Low CO levels can be achieved for lean mixtures at very large residence time. For shorter residence times, the lean CO rise shifts to richer mixtures. As richer mixtures () are unaffected by the residence time (equilibrium concentrations are reached in a very short time by sufficiently high temperatures) mixture inhomogeneities may significantly increase carbon monoxide concentrations. Note that in 3D turbulent flows, however, the residence time of the mixtures is determined by complex turbulent flow structures and local recirculation zones.
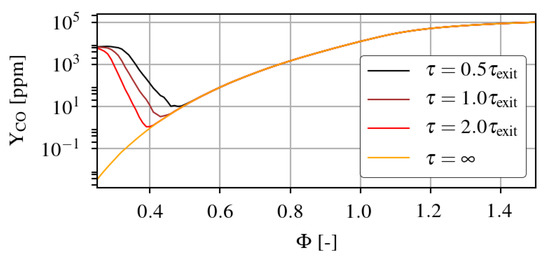
Figure 4.
Carbon monoxide (CO) mass fractions over equivalence ratio in dependency of the system residence time from 1D flames. The CO peak value marks and is the volumetric combustor residence time.
Figure 5 presents carbon monoxide mass fractions over equivalence ratio colored by the CO source term at the combustor exit cross-section.
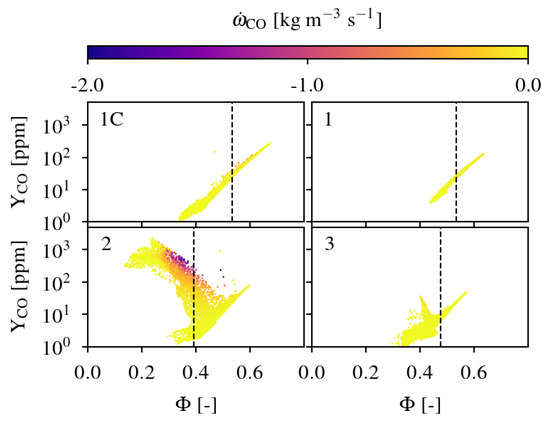
Figure 5.
Carbon monoxide mass fractions over in dependency of the CO reaction rate at the combustor exit cross-section for cases 1C, 1, 2 and 3. The vertical dashed line marks the nominal global equivalence ratio.
Case 1 (weak stratification) indicates highest CO concentrations of 100 ppm for richer mixtures at and lower carbon monoxide mass fractions towards leaner mixtures. Cases 1 and 1C agree overall, indicating that results are robust against changes in grid resolution. For case 2 (strong stratification), highest CO concentrations () are found for very lean mixtures of . Very low CO concentrations of ≤50 with a narrow range of are identified for operating point 3 (moderate stratification). Carbon monoxide reaction rates are zero in all simulations, while oxidizing mixtures with very small values can be detected for case 2.
The presence of high CO concentrations at the combustor outlet at richer mixtures for the weakly stratified case 1 and at lean mixtures for the strongly stratified case 2 stresses the relevance of mixture inhomogeneities on the formation of carbon monoxide.
The mixture distribution in the combustion chamber is presented in Figure 6, showing normalized temperature over equivalence ratio.
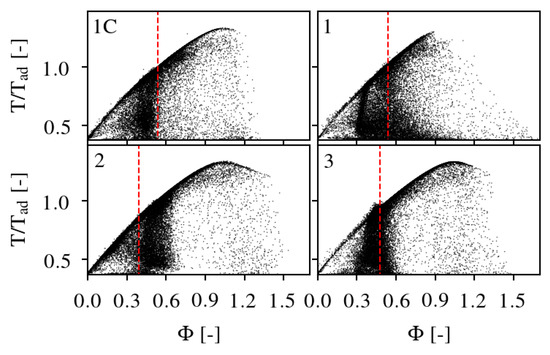
Figure 6.
Normalized temperature over equivalence ratio in the combustion chamber for cases 1C, 1, 2 and 3. The vertical dashed line marks the global equivalence ratio.
A wide scatter of equivalence ratios is identified for all cases ranging from pure air () to rich mixtures (). Mixtures with temperatures below the adiabatic flame temperature are detected as a result of heat losses at the chamber walls and supplied cooling air. Furthermore, these mixtures can also be associated with slow chemistry resulting from finite rate kinetics accounted for in this work. For case 1 (weak stratification), the scatter is most dense for mixtures leaner than the global equivalence ratio; significant numbers can also be seen for richer mixtures. The strongly stratified case 2 is characterized by a high number of mixtures on the very lean side which correspond to stages A and C being operated with pure air that mixes with the hot jets. This is in agreement with the observation of large CO levels on the lean side (see Figure 5). For case 3 (moderate stratification), a sparse distribution is shown on the very lean side and the scatter is most dense at values corresponding to the global equivalence ratio.
To further analyze the origin of mixture inhomogeneities and to potentially assign the problem to the mixing behavior of a single stage, Favre-filtered transport equations for passive scalars have been introduced representing the mixture fraction of the individual stages A, B, C and P (i.e., ). The contribution of the single stages on the global mixture in the combustion chamber is analyzed by their joint probability density functions (JPDF) by means of equivalence ratio , as shown in Figure 7a–c.
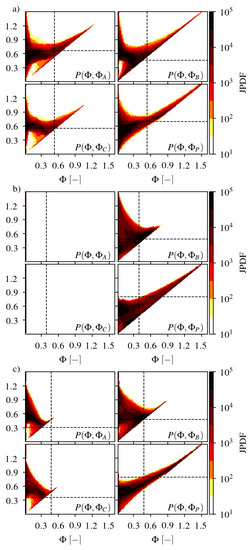
Figure 7.
Joint PDF of the equivalence ratio and the equivalence ratio of the individual stages , , and for cases (a) 1, (b) 2, and (c) 3. Vertical and horizontal dashed lines mark nominal global () and fuel stage equivalence ratio.
The nominal fuel stage equivalence ratio (horizontal line) indicates the ideal case, where air is supplied by equal shares to the stages and mixes homogeneously with fuel. Deviations from the nominal global equivalence ratio (vertical line) illustrate the unmixedness caused by the single stages. For all cases, mixture inhomogeneities can be observed in all of the stages and a high impact of the pilot stage on fuel-rich mixtures is presented as a linear dependency between the equivalence ratio and is shown for .
For the weakly stratified case 1 (Figure 7a), stages A and C present a high probability on the lean side and a linear dependency on mixtures , indicating also a significant contribution to richer mixtures. Note that results for 1C are not shown here for brevity and can be found in Appendix A. The B stage predominantly contributes to the global equivalence ratio; large mixture inhomogeneities and a strong impact from cooling air can be seen, as a linear dependency for is detected. In the strongly stratified case 2 (Figure 7b), stages A and C are not operated with fuel. The mixture depends on stages B and P, and a significant impact of air is identified for both stages as shown by a high probability on lean mixtures. For case 3 (moderate stratification), stages A and C show highest probability on the very lean side () with a linear dependency up to , as shown in Figure 7c. Interestingly, stage B presents highest density at the nominal operating point—marked by the intersection point between the nominal global and stage equivalence ratio.
In summary, the pilot stage contributes to the formation of fuel rich mixtures in all cases. For case 1 with weak stratification, significant contributions on richer mixtures are also due to stages A and C, and lean mixtures mostly depend on stage B. For the strongly stratified case 2, operating stages B and P contribute to the entire range of mixtures, with larger impact from the pilot on fuel-rich mixtures. For the moderate stratified case 3, stages A and C are only relevant for the formation of lean mixtures and stage B for all mixtures.
The contribution of each stage to CO at the combustor outlet is shown in Figure 8a–c, presenting carbon monoxide mass fractions over colored by the contribution of the stage equivalence ratio to the total mixture. For the weak stratified case 1 (Figure 8a), low carbon monoxide levels at equivalence ratios can predominantly be attributed to stage B, with increasing contribution towards leaner mixtures. Larger CO concentrations at richer mixtures are controlled by stages A and P, with minor impact from stage C. High carbon monoxide concentrations on the lean side in the strongly stratified case 2 (Figure 8b) are due to both operating stages B and P, while CO at very lean mixtures () depend on the pilot stage. Richer mixtures with lower CO values are due to stage B. Interestingly, a second lower branch between with very low carbon monoxide concentrations can be identified, indicating a good burnout. Stage B shows the highest relevance on CO for almost the complete range of mixtures in the moderate stratified case 3 (Figure 8c), followed by the pilot. At , stage C indicates highest relevance on carbon monoxide levels; negligible contributions are observed for stage A.
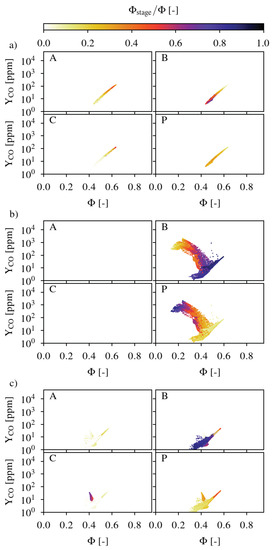
Figure 8.
Carbon monoxide mass fraction over equivalence ratio in dependency of the respective stage equivalence ratio normalized by the equivalence ratio for cases (a) 1, (b) 2 and (c) 3.
To summarize, large CO concentrations are located at richer mixtures for case 1 (weak stratification) and are governed by stages A and P. For the strongly stratified case 2, both operating stages—with greater weights by the pilot—contribute to high CO levels on the lean side. Richer mixtures at or large carbon monoxide mass fractions at leaner conditions are not present for the moderate stratified case 3, which is mostly influenced by stage B.
Large carbon monoxide levels at the combustor outlet that are related to richer mixtures, i.e., , can be attributed to poor mixing of fuel and air. However, high CO concentrations on the lean side result from incomplete oxidation, that may be attributed to local quenching effects at the cold wall or by mixing with air.
4.4. Flame Quenching at Cold Wall
Flame quenching at the cold wall leads to a significant increase of CO in this region. The oxidation of carbon monoxide is inhibited and CO species concentrations are convected with high axial velocities towards the system outlet. The significance of flame quenching at the cold wall on the incomplete carbon monoxide burnout in the investigated operating points is analyzed in Figure 9.
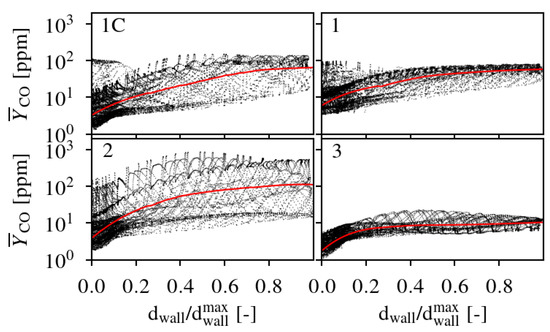
Figure 9.
Scatter of the mean carbon monoxide mass fraction over normalized wall distance / at the combustor exit cross section for cases 1C, 1, 2, and 3. The red solid line shows the conditional mean.
The plot shows the radial distribution of the mean carbon monoxide concentration in terms of cell distance towards the chamber wall at the combustor exit cross section. It can be seen that very low CO levels are present in the proximity of the cold wall (/ = 0) in any of the cases and that concentrations increase towards the center of the cross section. Irrespective of whether flame quenching occurs in any upstream location in the combustion chamber, it has no impact on the outlet concentration. Hence, it can be concluded that flame quenching at the cold wall is insignificant for the incomplete CO burnout of the investigated operating points in this configuration.
4.5. Impact of Secondary Air
To investigate the impact of air on the formation of CO, an additional Favre-filtered transport equation has been solved for the primary air ratio . Air that has mixed with fuel before entering the combustion chamber is denoted as primary air (), whereas secondary air () is defined as air supplied through a jet that is not being operated or by effusion cooling. Cooling air is supplied to the chamber in the wall region in proximity to the jets from stage B. To investigate flame quenching events by the interaction with secondary air, Lagrangian tracer particles are used. As this analysis was not affordable during simulation run-time using the Lu19 reaction mechanism and fine grids, the tracer particles are only added to the Reynolds averaged LES results. The is arguably not ideal but still sheds light on the results. Potential effects of the impact of effusion cooling is investigated for all stages. One jet from each stage is selected as a representative and the massless tracer particles are injected at the outlet of the mixing passage. Particles evolve based on the local flow conditions and track the history of mean carbon monoxide mass fraction , equivalence ratio and primary air ratio . The CO particle history in dependency of and for all investigated cases is presented in Figure 10a–c.
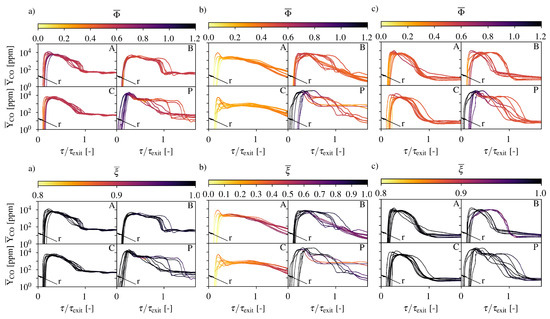
Figure 10.
Lagrangian particle history of carbon monoxide in dependency of the equivalence ratio (top row) and the primary air ratio (bottom row) from the different stages for case (a) 1, (b) 2 and (c) 3. Time is normalized by the combustor exit time . The temporal shift is related to the injection radius r.
The shown set of particle histories is representative for all particles injected. Carbon monoxide mass fraction histories may not start at , as Lagrangian particles have the same axial but not radial injection position and, hence, particles injected at a small radius, with respect to the jet diameter, cross the flame front at later times.
Incomplete CO burnout is identified by a carbon monoxide trajectory that does not decrease after reaching its peak value within the flame front. For the weakly stratified case 1 (Figure 10a), a good burnout can be identified for stage C with a rather uniform equivalence ratio of around downstream of the flame front and negligible impact by secondary air. High carbon monoxide mass fractions at the combustor outlet at richer mixtures (i.e., ) result from the pilot stage but also from stage A. Stage B and to some extent stage P indicate particles with high CO concentrations at very lean mixtures with increased contributions of secondary air. It can be assumed that these mixtures are affected by flame quenching, as their local equivalence ratio is shifted towards leaner values by the interaction with secondary air and, hence, the oxidation of CO is inhibited.
Figure 10b shows CO particle histories for the strongly stratification case 2. Particles from stages A and C, operating with air only, indicate strong interaction with stages B and P, as equivalence and primary air ratios increase towards to and , respectively, and CO levels of almost 1000 ppm can be seen. Consistent to Figure 8b, large CO concentrations on the fuel-lean side at the combustor outlet can be identified for particle trajectories from the pilot stage. It is likely that these increased carbon monoxide mass fractions result from quenching events, as the equivalence ratio is lowered from to , while the primary air ratio at the same time indicates a reduction from to . In comparison to the pilot stage, a lower impact by secondary air can be observed for stage B, which, however, shows increased CO levels for richer mixtures.
The CO particle history in dependency of and for case 3 (moderate stratification) is presented in Figure 10c. A negligible impact of secondary air and homogeneous mixtures are identified for stage A and C, indicating a good CO burnout with low concentrations at the combustor exit time. For stage B, particles are identified where secondary air leads to a shift of the equivalence ratio to leaner mixtures. Interestingly, mixtures are not quenched but show a slower oxidation which appears to be complete at . The cooling air shows strongest impact on the pilot stage, where the burnout of CO for mixtures at around is slowed down, leading to increased concentrations.
The Lagrangian particle post-processing reveals that increased CO levels in case 1 (weak stratification) can be attributed to richer mixtures originating mostly from the pilot stage and, that flame quenching by the interaction with cold air affects stage B. For the strongly stratified case 2, most significant impact by secondary air is observed, resulting in local flame quenching at lean mixtures in stages B and P. In case of the moderate stratification (3), a negligible influence of cooling air is found and increased CO concentrations can be attributed to richer mixtures in stage P.
In the event of local flame quenching the oxidation of CO is inhibited due to the absence of OH species [7]. Figure 11 shows the carbon monoxide mass fraction over equivalence ratio in dependency of the primary air ratio for quenched mixtures, that is, mixtures with and , in the combustion chamber.
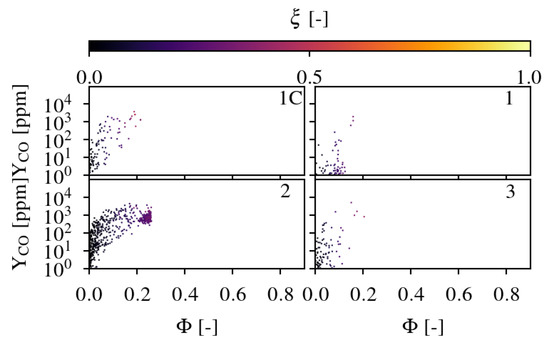
Figure 11.
Carbon monoxide mass fractions over equivalence ratio in dependency of the primary air ratio for quenched mixtures in the combustion chamber for the different cases.
Quenched mixtures are identified for very lean mixtures () with high content of secondary air. High carbon monoxide mass fractions resulting from quenching is not of great importance for cases with weak (1) and moderate stratification (3), as only a spare distribution is present. A high density of quenched pockets can be seen for the strongly stratified case 2, indicating a dense scatter with CO concentrations up to around 5000 ppm. This is in agreement with previous findings from Lagrangian tracer particles (see Figure 10b) revealing a significant impact of secondary air and explains the origin of high carbon monoxide levels on the lean side at the combustor outlet for case 2 (ref. Figure 5).
Finally, the impact of secondary air on the mixture is assessed at the combustor outlet in Figure 12.
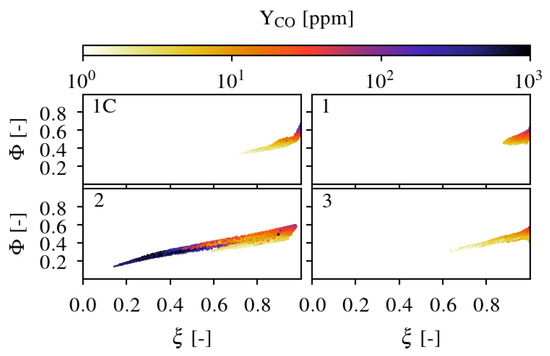
Figure 12.
Equivalence ratio over primary air ratio in dependency of CO for the different cases at the combustor outlet cross-section.
A minor impact of on mixtures in the weak and moderate stratified cases 1 and 3 can be observed, as at least 80% primary air is present at the combustor outlet. The highest CO mass fractions can be found at and lower concentrations are present at leaner mixtures with higher contribution of secondary air. For the strongly stratified case 2, however, a wide range of values can be identified with maximum carbon monoxide levels of around 1000 ppm at very lean mixtures with at least 60% secondary air content. This is in agreement with high CO concentrations at quenched mixtures from Figure 11 and illustrates the important role of secondary air on the mixture and the subsequent shift towards leaner equivalence ratios, where CO oxidation rates are significantly reduced or even inhibited.
5. Conclusions
Large-eddy simulations of a high pressure full scale Siemens prototype combustor at three staged part load conditions have been performed, demonstrating the ability to predict CO from a complex technical combustion system and mechanisms leading to incomplete carbon monoxide burnout in either cases were investigated. Combustion kinetics were modeled using direct reduced chemistry. Predictions of CO concentrations at the probe location were predicted with good agreement with the test data. It was found, that large CO levels corresponding to operating point 1 (weak stratification) could be related to high equivalence ratios streaks, whereas operating point 2 (strong stratification) revealed increased CO levels on the fuel-lean side. A good CO burnout has been noted for operating point 3 (moderate stratification). Increased CO concentrations could not be related to flame quenching events at the cold wall. The contribution of each stage on the total mixture showed that increased CO concentrations in the weakly stratified case 1 could be attributed to mixture inhomogeneities resulting from poor mixing, especially of the pilot stage, while flame quenching events were identified to have minor influence on CO in this case. Lagrangian particles revealed that cold air from effusion cooling and from stages not operated with fuel had a significant impact on the oxidation of CO in the case with strong stratification 2, as large numbers of mixtures could be identified where the equivalence ratio was shifted to lean mixtures so that quenching occurred and, hence, the carbon monoxide burnout was inhibited. Low carbon monoxide emissions in operating point 3 (moderate stratification), were found to result from a uniform mixture distribution and no significant flame quenching effects resulting from the interaction with secondary air.
Author Contributions
Conceptualization, P.G., C.B., B.J. and A.M.K.; methodology, P.G., C.B. and A.M.K.; software, P.G.; validation, P.G.; formal analysis, P.G.; investigation, P.G.; resources, A.M.K.; data curation, P.G.; writing—original draft preparation, P.G.; writing—review and editing, P.G., C.B., B.J. and A.M.K.; visualization, P.G.; supervision, P.G.; project administration, A.M.K.; funding acquisition, A.M.K. All authors have read and agreed to the published version of the manuscript.
Funding
The authors gratefully acknowledge the financial support through Siemens and BMWi through CEC3 (funding reference number 03ET7073D) and the Gauss Centre for Supercomputing e.V. (www.gauss-centre.eu) for funding this project by providing computing time on the GCS Supercomputer SUPERMUC-NG at Leibniz Supercomputing Centre (www.lrz.de).
Acknowledgments
We would like to thank Isolde Siebelist, Maximilian Schäfer and Patrick Wollny for many helpful discussions and their technical support.
Conflicts of Interest
The authors declare no conflict of interest.
Appendix A. Simulation Results for the Weakly Stratified Case 1C Using the Coarse Grid
Figure A1, Figure A2 and Figure A3 present simulation results from case 1C being discussed in Section 4.3 and Section 4.5, respectively.

Figure A1.
Joint PDF of the equivalence ratio and the equivalence ratio of the individual stages , , and for case 1C. Vertical and horizontal dashed lines mark nominal global () and fuel stage equivalence ratio.

Figure A2.
Carbon monoxide mass fraction over equivalence ratio in dependency of the respective stage equivalence ratio normalized by the equivalence ratio for case 1C.

Figure A3.
Lagrangian particle history of carbon monoxide in dependency of the equivalence ratio (top) and the primary air ratio from the different stages for case 1C. Time is normalized by the combustor exit time . The temporal shift is related to the injection radius r.
References
- Lieuwen, T.C.; Yang, V. Gas Turbine Emissions; Cambridge University Press: Cambridge, UK, 2013. [Google Scholar] [CrossRef]
- Gruschka, U.; Janus, B.; Meisl, J.; Huth, M.; Wasif, S. ULN System for the New SGT5-8000H Gas Turbine: Design and High Pressure Rig Test Results. In Turbo Expo: Power for Land, Sea, and Air; American Society of Mechanical Engineers (ASME): New York, NY, USA, 2008; pp. 913–919. [Google Scholar] [CrossRef]
- Lefebvre, A.H.; Ballal, D.R. Gas Turbine Combustion; CRC Press: Boca Raton, FL, USA, 2010. [Google Scholar] [CrossRef]
- Lovett, J.A.; Abuaf, N. Emissions and stability characteristics of flameholders for lean-premixed combustion. In Turbo Expo: Power for Land, Sea, and Air; American Society of Mechanical Engineers (ASME): New York, NY, USA, 1992; Volume 3. [Google Scholar]
- Nguyen, Q.; Edgar, B.; Dibble, R.; Gulati, A. Experimental and numerical comparison of extractive and in situ laser measurements of non-equilibrium carbon monoxide in lean-premixed natural gas combustion. Combust. Flame 1995, 100, 395–406. [Google Scholar] [CrossRef]
- Nguyen, Q.V. Measurements of Equivalence Ratio Fluctuations in a Lean Premixed Prevaporized (LPP) Combustor and Its Correlation to Combustion Instability. In Turbo Expo: Power for Land, Sea, and Air; American Society of Mechanical Engineers (ASME): New York, NY, USA, 2002. [Google Scholar] [CrossRef]
- Howard, J.; Williams, G.; Fine, D. Kinetics of carbon monoxide oxidation in postflame gases. Symp. (Int.) Combust. 1973, 14, 975–986. [Google Scholar] [CrossRef]
- Correa, S.M. Carbon monoxide emissions in lean premixed combustion. J. Propul. Power 1992, 8, 1144–1151. [Google Scholar] [CrossRef]
- Mann, M.; Jainski, C.; Euler, M.; Böhm, B.; Dreizler, A. Transient flame–wall interactions: Experimental analysis using spectroscopic temperature and CO concentration measurements. Combust. Flame 2014, 161, 2371–2386. [Google Scholar] [CrossRef]
- Nilsson, P.; Bai, X. Effects of flame stretch and wrinkling on co formation in turbulent premixed combustion. Proc. Combust. Inst. 2002, 29, 1873–1879. [Google Scholar] [CrossRef]
- Bulat, G.; Jones, W.; Marquis, A. Large Eddy Simulation of an industrial gas-turbine combustion chamber using the sub-grid PDF method. Proc. Combust. Inst. 2013, 34, 3155–3164. [Google Scholar] [CrossRef]
- Bulat, G.; Jones, W.P.; Marquis, A.J. NO and CO formation in an industrial gas-turbine combustion chamber using LES with the Eulerian sub-grid PDF method. Combust. Flame 2014, 161, 1804–1825. [Google Scholar] [CrossRef]
- Jaravel, T.; Riber, E.; Cuenot, B.; Bulat, G. Large Eddy Simulation of an industrial gas turbine combustor using reduced chemistry with accurate pollutant prediction. Proc. Combust. Inst. 2016, 35, 3817–3825. [Google Scholar] [CrossRef]
- Maio, G.; Cailler, M.; Mercier, R.; Fiorina, B. Virtual chemistry for temperature and CO prediction in LES of non-adiabatic turbulent flames. Proc. Combust. Inst. 2019, 37, 2591–2599. [Google Scholar] [CrossRef]
- Wegner, B.; Gruschka, U.; Krebs, W.; Egorov, Y.; Forkel, H.; Ferreira, J.; Aschmoneit, K. CFD prediction of partload CO emissions using a two-timescale combustion model. J. Eng. Gas Turbine Power 2011, 133, 071502. [Google Scholar] [CrossRef]
- Klarmann, N.; Zoller, B.T.; Sattelmayer, T. Numerical modeling of CO-emissions for gas turbine combustors operating at part-load conditions. J. Glob. Power Propuls. Soc. 2018, 2, 376–387. [Google Scholar] [CrossRef]
- Maas, U.; Pope, S. Simplifying chemical kinetics: Intrinsic low-dimensional manifolds in composition space. Combust. Flame 1992, 88, 239–264. [Google Scholar] [CrossRef]
- Menon, S. CO Emission and Combustion Dynamics Near Lean-Blowout in Gas Turbine Engines. In Proceedings of the ASME Turbo Expo 2004: Power for Land, Sea, and Air, Vienna, Austria, 14–17 June 2004. [Google Scholar] [CrossRef]
- Eggenspieler, G.; Menon, S. Combustion and emission modelling near lean blow-out in a gas turbine engine. Prog. Comput. Fluid Dyn. 2005, 5, 281. [Google Scholar] [CrossRef]
- Gruhlke, P.; Janbazi, H.; Wlokas, I.; Beck, C.; Kempf, A.M. Investigation of a High Karlovitz, High Pressure Premixed Jet Flame with Heat Losses by LES. Combust. Sci. Technol. 2020, 1–33. [Google Scholar] [CrossRef]
- Butler, T.; O’rourke, P. A numerical method for two dimensional unsteady reacting flows. Symp. (Int.) Combust. 1977, 16, 1503–1515. [Google Scholar] [CrossRef]
- Colin, O.; Ducros, F.; Veynante, D.; Poinsot, T.J. A thickened flame model for large eddy simulations of turbulent premixed combustion. Phys. Fluids 2000, 12, 1843–1863. [Google Scholar] [CrossRef]
- Legier, J.P.; Poinsot, T.J.; Veynante, D. Dynamically thickened flame LES model for premixed and non-premixed turbulent combustion. In Proceedings of the Summer Program; Center for Turbulence Research: Stanford, CA, USA, 2000; pp. 157–168. [Google Scholar]
- Wang, G.; Boileau, M.; Veynante, D. Implementation of a dynamic thickened flame model for large eddy simulations of turbulent premixed combustion. Combust. Flame 2011, 158, 2199–2213. [Google Scholar] [CrossRef]
- Charlette, F.; Meneveau, C.; Veynante, D. A Power-Law Flame Wrinkling Model for LES of Premixed Turbulent Combustion Part I: Non-Dynamic Formulation and Initial Tests. Combust. Flame 2002, 131, 159–180. [Google Scholar] [CrossRef]
- Lu, T.; Law, C.K. A criterion based on computational singular perturbation for the identification of quasi steady state species: A reduced mechanism for methane oxidation with NO chemistry. Combust. Flame 2008, 154, 761–774. [Google Scholar] [CrossRef]
- Michael, F.; Tom, B.; Greg, S. GRI-Mech. Available online: http://combustion.berkeley.edu/gri-mech/ (accessed on 1 October 2020).
- Frenklach, M.; Kazakov, A. Reduced Reaction Sets Based on GRIMech1.2. Available online: http://combustion.berkeley.edu/drm/ (accessed on 1 October 2020).
- Metcalfe, W.K.; Burke, S.M.; Ahmed, S.S.; Curran, H.J. A Hierarchical and Comparative Kinetic Modeling Study of C1–C2 Hydrocarbon and Oxygenated Fuels. Int. J. Chem. Kinet. 2013, 45, 638–675. [Google Scholar] [CrossRef]
- Nguyen, T.; Kempf, A.M. Investigation of Numerical Effects on the Flow and Combustion in LES of ICE. Oil Gas Sci. Technol. 2017, 72, 25–40. [Google Scholar] [CrossRef][Green Version]
- Yoshizawa, A.; Horiuti, K. A statistically-derived subgrid-scale kinetic energy model for the large-eddy simulation of turbulent flows. J. Phys. Soc. Jpn. 1985, 54, 2834–2839. [Google Scholar] [CrossRef]
- Spalding, D.B. A Single Formula for the “Law of the Wall”. J. Appl. Mech. 1961, 28, 455–458. [Google Scholar] [CrossRef]
Publisher’s Note: MDPI stays neutral with regard to jurisdictional claims in published maps and institutional affiliations. |
© 2020 by the authors. Licensee MDPI, Basel, Switzerland. This article is an open access article distributed under the terms and conditions of the Creative Commons Attribution (CC BY) license (http://creativecommons.org/licenses/by/4.0/).