Abstract
The connectivity of the internal pores and fractures in oil shale is the critical factor in determining the success of the insitu pyrolysis of the oil shale with superheated steam. In this paper, using a self-developed superheated steam pyrolysis experimental system, oil shale samples were subjected to pyrolysis experiments at different steam temperatures. Then, the oil shale samples were scanned with high-precision micro-CT equipment to obtain the three-dimensional digital core of oil shale (DCOS). Based on the three-dimensional site percolation theory and renormalization group algorithm, the pore and fracture connectivity characteristics of the DCOSs were studied. The results show that when the steam temperature reached the pyrolysis temperature for oil shale, a series of pores was formed during the pyrolysis process. These pores gradually connected the adjacent fracture and subsequently formed a massive pore-fracture cluster. However, from room temperature to 555 °C, there were always parts with porosity less than 5% in the DCOSs perpendicular to the direction of the sedimentary bedding, forming the bottleneck of the seepage passage. This occurrence is the main reason that the permeability of the oil shale perpendicular to the direction of the sedimentary bedding is far lower than that parallel to the direction of the sedimentary bedding.
1. Introduction
Oil shale is a type of sedimentary rock containing kerogen [1]. Kerogen is distributed in the solid skeleton of oil shale in the form of a solid at room temperature. By heating oil shale, solid kerogen can be pyrolyzed to produce shale oil and light hydrocarbon gas [2]. Oil shale is widely distributed throughout the world with vast reserves. If oil shale resources can be converted into shale oil, they could be used to produce more than 400 billion tons, equivalent to three times the current world oil reserves [3,4]. Therefore, oil shale is considered an unconventional energy with great potential, which has great research and development value [1,5,6].
Unlike conventional oil exploitation technology, heating oil shale under an anaerobic environment to cause a series of physical and chemical changes in the kerogen to produce shale oil and hydrocarbon gas is the most effective technical method to date [7,8,9]. For the shallowly buried oil shale seam, the open-pit mining method is usually used to extract the oil shale ore. The ore is then broken, and subsequently, high-temperature dry distillation is performed to obtain related products [2,10,11]. However, for the deep oil shale seam, due to the low energy density of oil shale, it is difficult to achieve economic benefits if traditional mining methods (such as open-pit mining or well mining) are used [6]. Therefore, it is essential to develop insitu mining technology for oil shale [12,13]. Taiyuan University of Technology (TYUT) proposed a method for the insitu pyrolysis of oil shale using superheated steam in 2005 [14,15]. The steps of this method are as follows: first, drill a group of wells into the oil shale seam and use the fracturing method to connect all the wells along the oil shale seam; then, inject superheated steam into the oil shale seam through the injection wells and heat the oil shale, so that the kerogen in the oil shale can be pyrolyzed to produce shale oil and gas; finally, the oil and gas products are driven by low-temperature steam or condensate water from the production wells to the surface. The key to heating oil shale in situ by using water vapor as a heat carrier is to inject superheated steam into the oil shale seam, and the pores and fractures in oil shale are the main channels of fluid migration [16]. The pore and fracture connectivity of oil shale directly determines the heating range, heating rate, and resource recovery for oil shale. Actually, it is not a new topic, and many scholars have performed a lot of research on the pore and fracture connectivity of shale. Saif et al. [17,18,19,20] studied the microstructure characteristics of oil shale before and after pyrolysis based on micro-CT experiments. The results show that the porosity of the oil shale significantly increased at a pyrolysis temperature of 400–500 °C and formed a connected pore channel, mainly along a kerogen-rich layer. By using the approaches of WM (Wood’smetal) impregnation, SEM (field emission-scanning electron microscopy) imaging, X-ray tomography, and LA-ICP-MS (laser ablation-inductively coupled plasma-mass spectrometry) tracer mapping, Zhao et al. [21] characterized the connected pores of the shale samples in 2D/3D space at nano- to millimeter scales. Wu et al. [22] studied the multiscale characterization of the pore structure and connectivity of shale. Based on X-ray CT images of shale, Zhou et al. [23] predicted the permeability by the fractal dimension and analyzed the hydrocarbon flow behaviors in nanoscale-pore structures of shale reservoirs. Tiwari et al. [24,25] studied the pore structure characteristics of oil shale before and after pyrolysis, by X-ray and micro-CT. Their results indicate that the organic-rich sites in the oil shale produced more voids after pyrolysis. Liu et al. [26] studied the pore throat distribution in oil shale and discussed the effect of pore structure on fluid mobility and oiliness. Zhao et al. [14] performed micro-CT scanning of oil shale after pyrolysis at different temperatures and applied 3D reconstruction technology to analyze the evolution characteristics of the internal pores and fractures of oil shale samples. The results show that when the pyrolysis temperature was 600 °C, the largest pore cluster in the oil shale penetrated the whole oil shale sample. However, the size of the region of interest (ROI) was 700 × 700 × 80 pixels, and the distance along the direction of 80 pixels was too short, which may have caused the misjudgment of the oil shale connectivity. Many studies have shown that when the pyrolysis temperature increases, thermal cracking occurs in the oil shale. After the kerogen pyrolysis, new pores form, so the oil shale finally transforms from an impervious material to high-permeability porous media. However, most of the existing studies have evaluated and determined the connectivity of seepage channels in oil shale based on the porosity and did not rule out the effects of isolated voids and fractures on the oil shale connectivity. In addition, there are few reports on the anisotropy of the spatial distribution of pore-fracture connected clusters during the pyrolysis of oil shale.
In this paper, the oil shale of Balikun county, Xinjiang Province, China, was pyrolyzed by using a superheated steam pyrolysis experimental system. Oil shale samples after pyrolysis at different steam temperatures were obtained. Then, a high-precision micro-CT experimental system was used to scan the oil shale samples, and 3D digital cores of oil shale (DCOSs) were obtained using a 3D reconstruction program compiled based on the Python language. Afterwards, the effective porosities of the DCOSs were calculated by combining the three-dimensional site percolation theory for porous media and renormalization group algorithm [27,28]. Meanwhile, the extension length of the largest pore-fracture cluster in the DCOSs in the direction of the parallel and vertical sedimentary bedding was analyzed. The distribution and evolution law of the largest pore-fracture cluster and percolating pore-fracture clusters were obtained. Finally, the variation of the porosity in different layers of the DCOSs perpendicular and parallel to the direction of the sedimentary bedding after steam pyrolysis at different temperatures was studied, and the cause of the anisotropic permeability of oil shale was discussed.
2. Materials and Methods
2.1. Oil Shale Samples
Oil shale samples were taken from the oil shale open-pit mine in Balikun, Xinjiang. A professional core drill was used to drill the cylindrical oil shale samples (Figure 1). All of the seven samples in the experiments were drilled from the same oil shale block to reduce the effect of the heterogeneity of the oil shale on the experimental results. The cylindrical axis of the samples was along the direction of the oil shale sedimentary bedding. The reasonable accuracy in the samples’ parallelism and smoothness was consistent with the standards of the International Society of Rock Mechanics (ISRM).

Figure 1.
Oil shale samples in the pyrolysis experiments (size: Φ = 10 × 20 mm).
2.2. Superheated Steam Pyrolysis Experimental System and Experimental Procedure
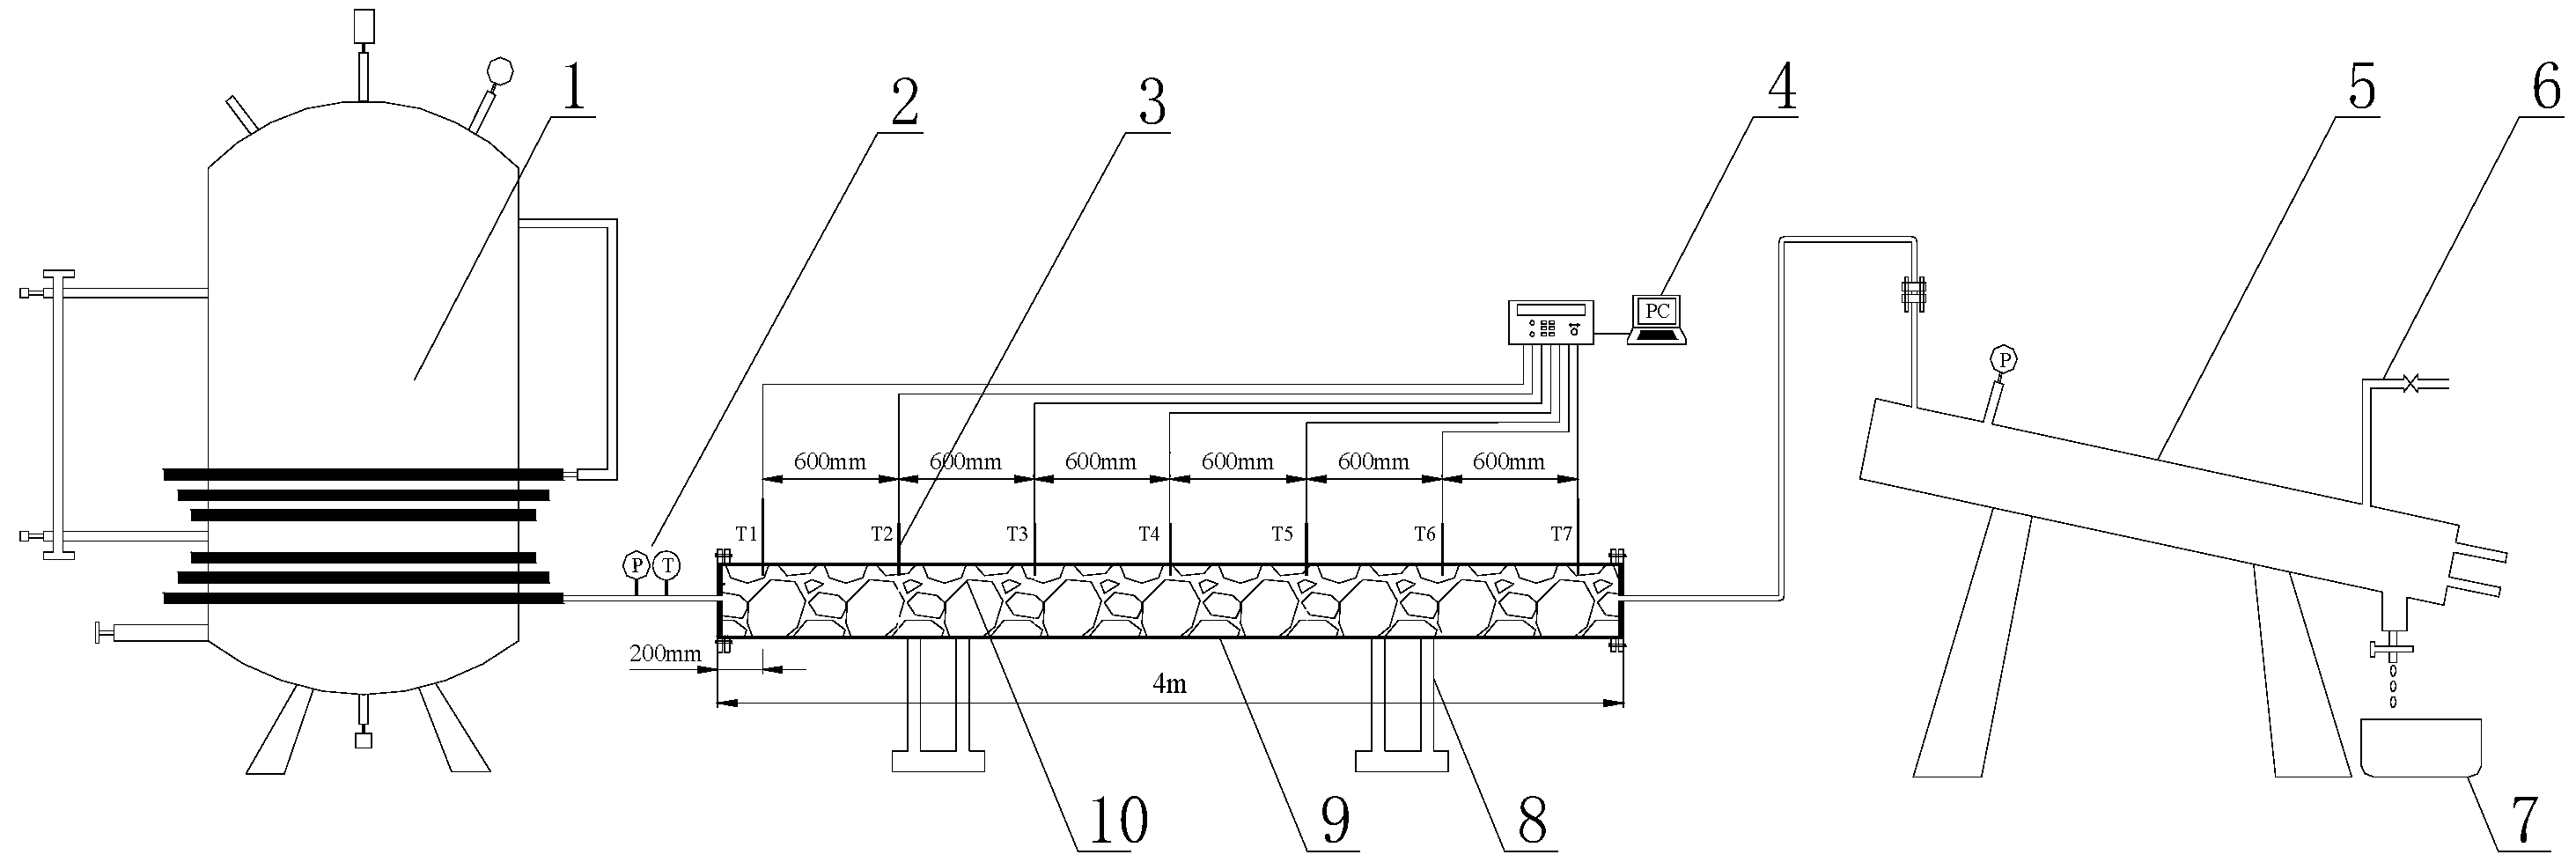
The superheated steam pyrolysis experimental system consists of a steam generator, a pyrolysis reaction chamber, a data acquisition system, and a cooling system (Figure 2). The steam generator continuously supplies superheated steam with a temperature above 600 °C. The pyrolysis reaction chamber has a total length of 4 m and an inner diameter of 110 mm. Seven temperature sensors are arranged along the length direction to monitor the temperature of different positions in the reaction chamber. The data acquisition system continuously records the temperatures and pressures in the steam generator and at various positions of the pyrolysis reaction chamber. When the superheated steam passes through the reaction chamber and heats the oil shale, it carries the shale oil and hydrocarbon gas generated by pyrolysis into the cooling system. The cooling system condenses the oil and gas with a low freezing point into the liquid oil–water mixture and simultaneously separates the gas products.
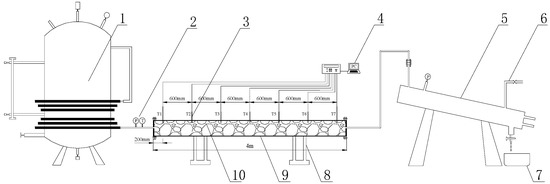
Figure 2.
High-temperature steam pyrolysis testing system: (1) steam generator; (2) temperature and pressure sensors; (3) temperature sensors; (4) data acquisition system; (5) cooling system; (6) gas vent; (7) condensate and shale oil collector; (8) support frame; (9) pyrolysis reaction chamber; (10) oil shale samples.
Before the pyrolysis experiment, we first checked the airtightness of the entire test system to ensure that there was no leakage at each connection. Then, the cylindrical oil shale samples were put into boxes made of steel wire mesh, and the boxes were placed in different positions of the reaction chamber for the pyrolysis reaction experiments. The steel wire mesh boxes could protect the cylindrical oil shale samples and ensure full contact between the oil shale samples and superheated steam. After the cylindrical oil shale samples were placed, the pyrolysis reaction chamber was filled with oil shale fragments. Hence, the insitu pyrolysis environment was simulated as much as possible, and the steam flow rate was decreased through the pyrolysis reaction chamber. When the experiment began, superheated steam entered from the inlet end of the pyrolysis reaction chamber and flowed along the pyrolysis reaction chamber to the outlet end. Due to heat loss, the temperature along the pyrolysis reaction chamber gradually decreased. Finally, the corresponding heating temperature of the oil samples at different positions from the inlet end of the pyrolysis chamber to the outlet end was 555, 534, 511, 452, 382, and 314 °C. Thus, we obtained oil shale samples after superheated steam pyrolysis at different temperatures.
2.3. Superheated Steam Pyrolysis Experimental System and Experimental Procedure
After the pyrolysis experiment, the oil shale samples were scanned with a micro-CT system (μCT225 kVFCB). Simultaneously, a sample of oil shale of the same size without a pyrolysis experiment was scanned for comparison. The parameters of this CT experiment were as follows: scanning voltage, 100 kV; current, 120 μA; magnification, 38.18 times; and minimum resolution, 5 μm. In this study, the gray value range of the gray slices was 0–255. After scanning each sample, we obtained 1500 slices of each sample perpendicular to the sedimentary bedding plane. Then, the CT slices were binarized so that the slices only showed solid matrix, pores, and fractures. In this study, the binarization threshold was selected with reference to the attenuation coefficient of air, which is small, and was 0.0021 when tested with this CT system.
2.4. Re-Scaling Process of the Renormalization Group Method
The American physicist K.G. Wilson [29] first used the renormalization group idea in quantum field theory to study a critical phenomenon. He proposed that the renormalization group had similar properties near the fixed point and obtained the phase transition critical phenomenon. The basic idea of the renormalization group is that the correlation length of the system tends to infinity near the critical point. By changing the finite natural scale to observe the system, similar results can be obtained, i.e., the system has self-similarity or scale invariance, which implies that the behavior of the system can be evaluated on a larger scale. Scale amplification inevitably leads to the loss of some details of the system but does not affect the main characteristics of the system, as shown in Figure 3. This method can be used to study the pore and fracture characteristics of oil shale on a large scale on the premise that the main attributes of the pore and fracture structure will not be lost. Due to computer performance limitations, this work only studied the digital core, with an original side length of 1170 × 1170 × 1170 pixels. The edge length after renormalization group processing was 390 × 390 × 390 pixels. After renormalization, the actual width of each pixel was 15 μm.
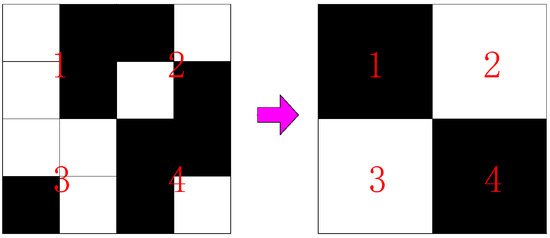
Figure 3.
Rescaling process of the renormalization group method (schematic).
3. Results and Discussion
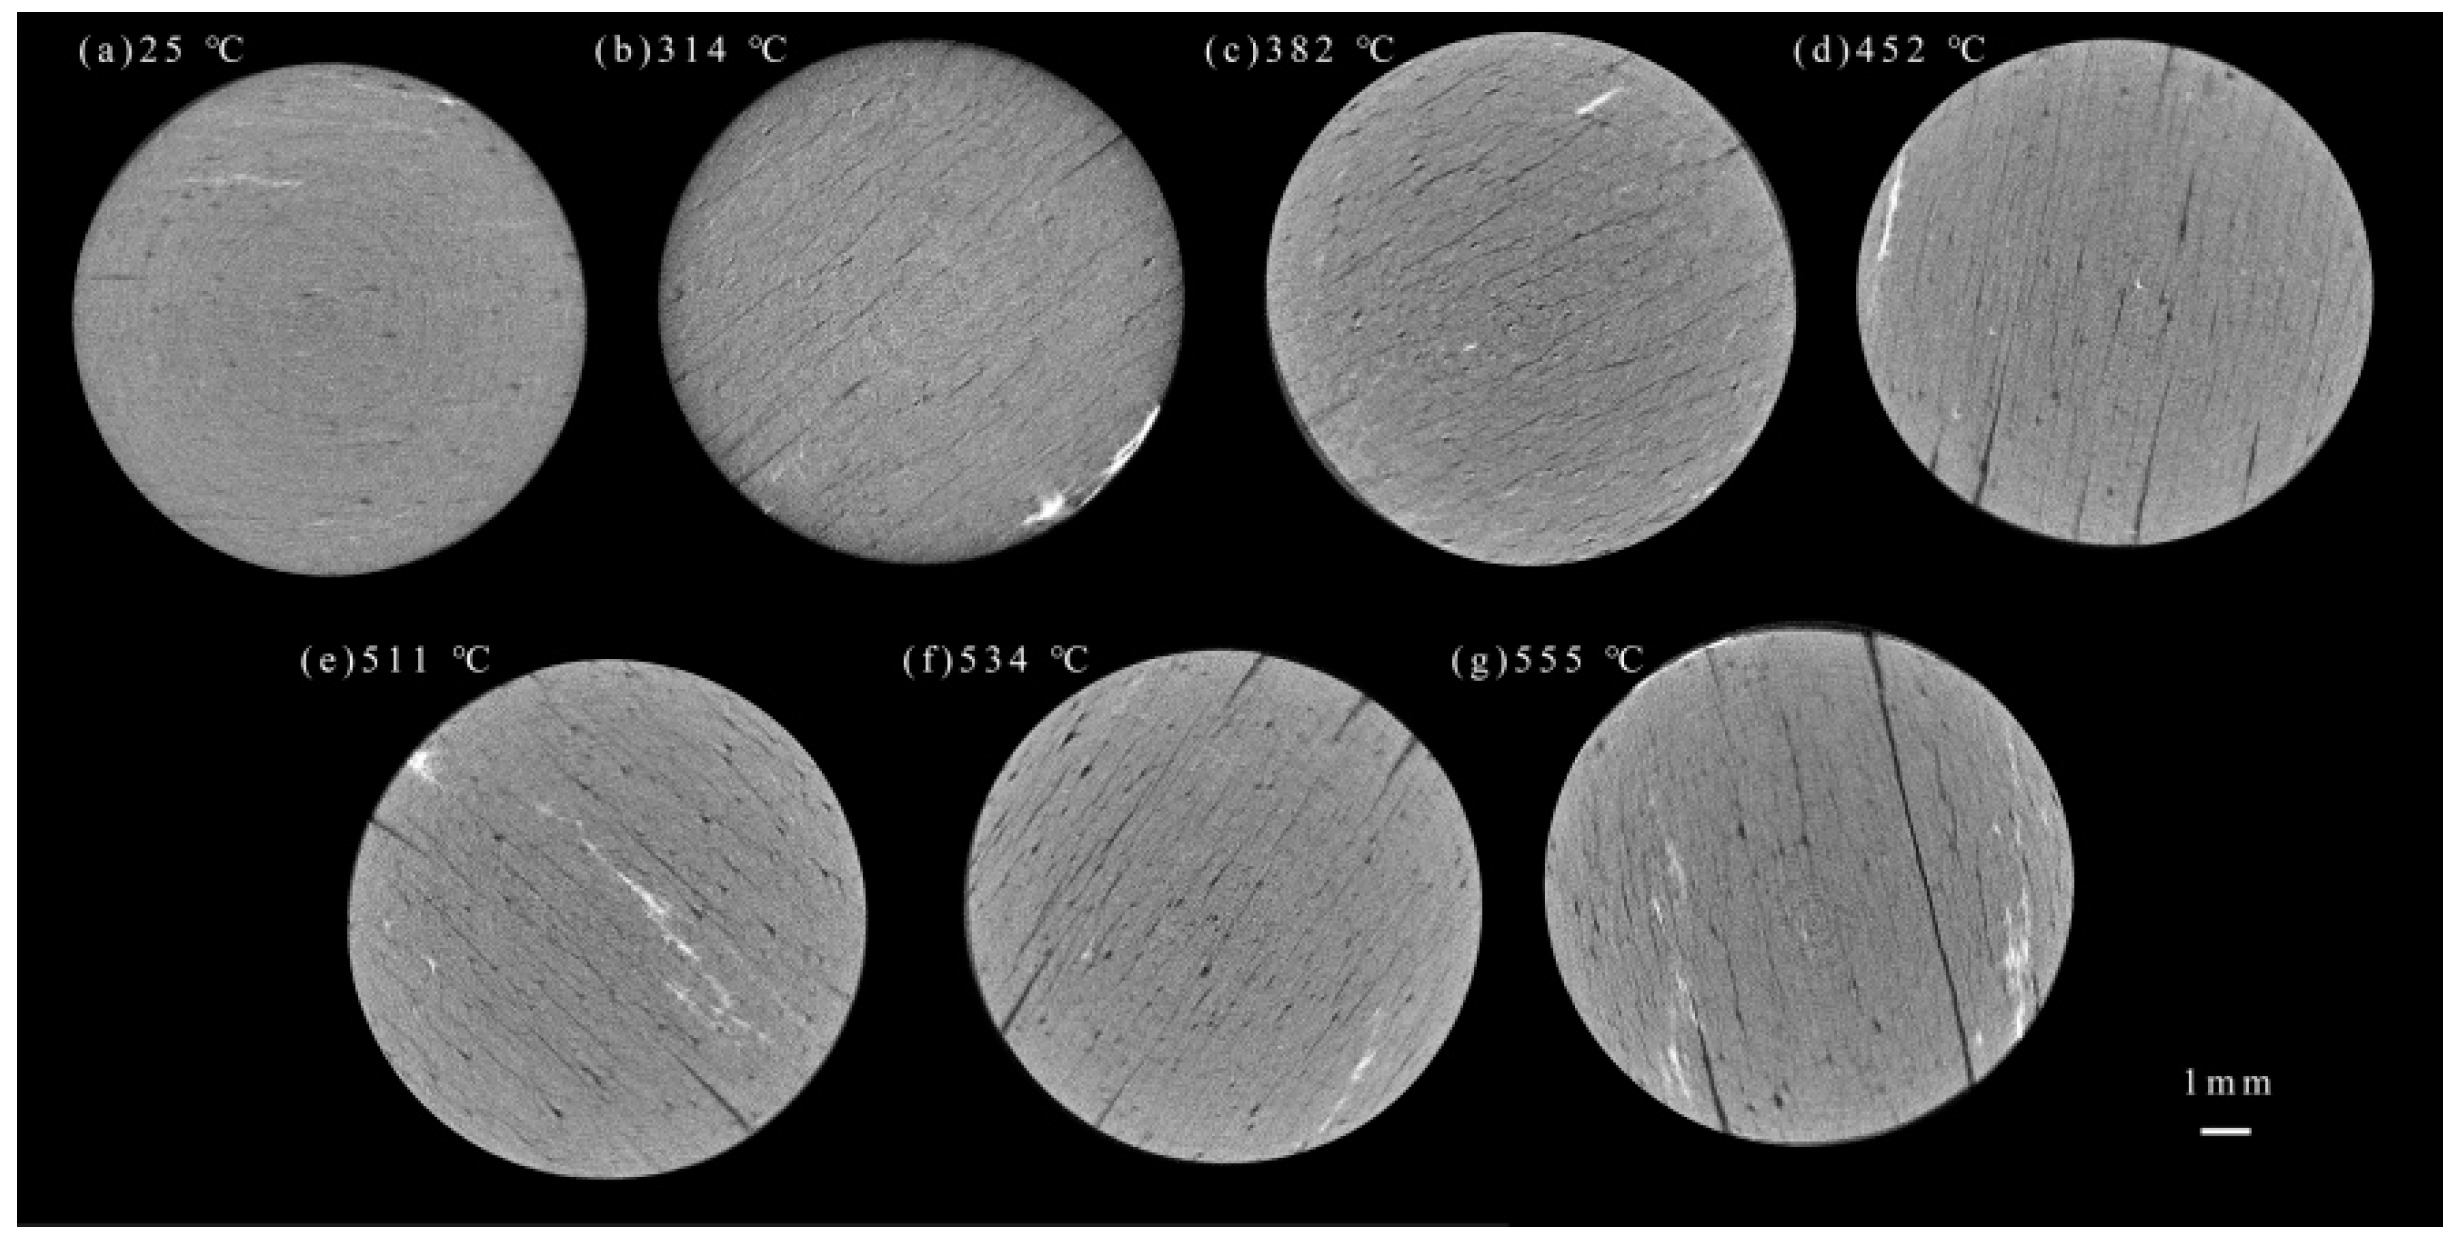
Figure 4 shows the micro-CT gray slices of each sample after the superheated steam pyrolysis at different temperatures. Due to the length limitation of the paper, only one representative CT gray slice was selected for each of the seven samples. Each pixel in the CT slice has its own gray value. The color continuously changes from black to white, which indicates the different densities of different positions in the oil shale. In the slice, the white part is hard mineral particles with a high density, the black part is pores and fractures, and the gray area represents clay minerals and kerogen. A cube with a side length of 1170 × 1170 × 1170 pixels was cut in each DCOS after pyrolysis to analyze the connectivity of the internal pores and fractures of the oil shale after pyrolysis with superheated steam, and the real side width of the cube selected was 5.85 mm. After the renormalization group processing, the edge length of the DCOS was 390 × 390 × 390 pixels, and the real width of each pixel was 15 μm. To facilitate the analysis, the DCOSs were put into a unified three-dimensional Cartesian coordinate system, and the sedimentary bedding plane of the oil shale was parallel to the xoz plane in the three-dimensional Cartesian coordinate system through the spatial rotation.
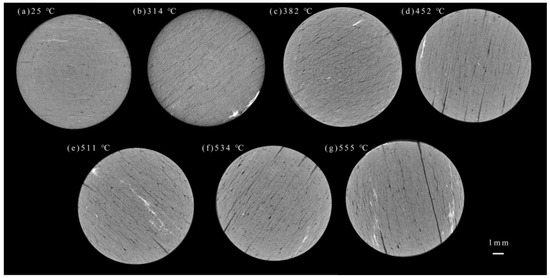
Figure 4.
Representative CT slices of the seven samples: (a) 25 °C; (b) 314 °C; (c) 382 °C; (d) 452 °C; (e) 511 °C; (f) 534 °C; (g) 555 °C.
3.1. Pore and Fracture Distribution of Oil Shale after Pyrolysis by Superheated Steam at Different Temperatures
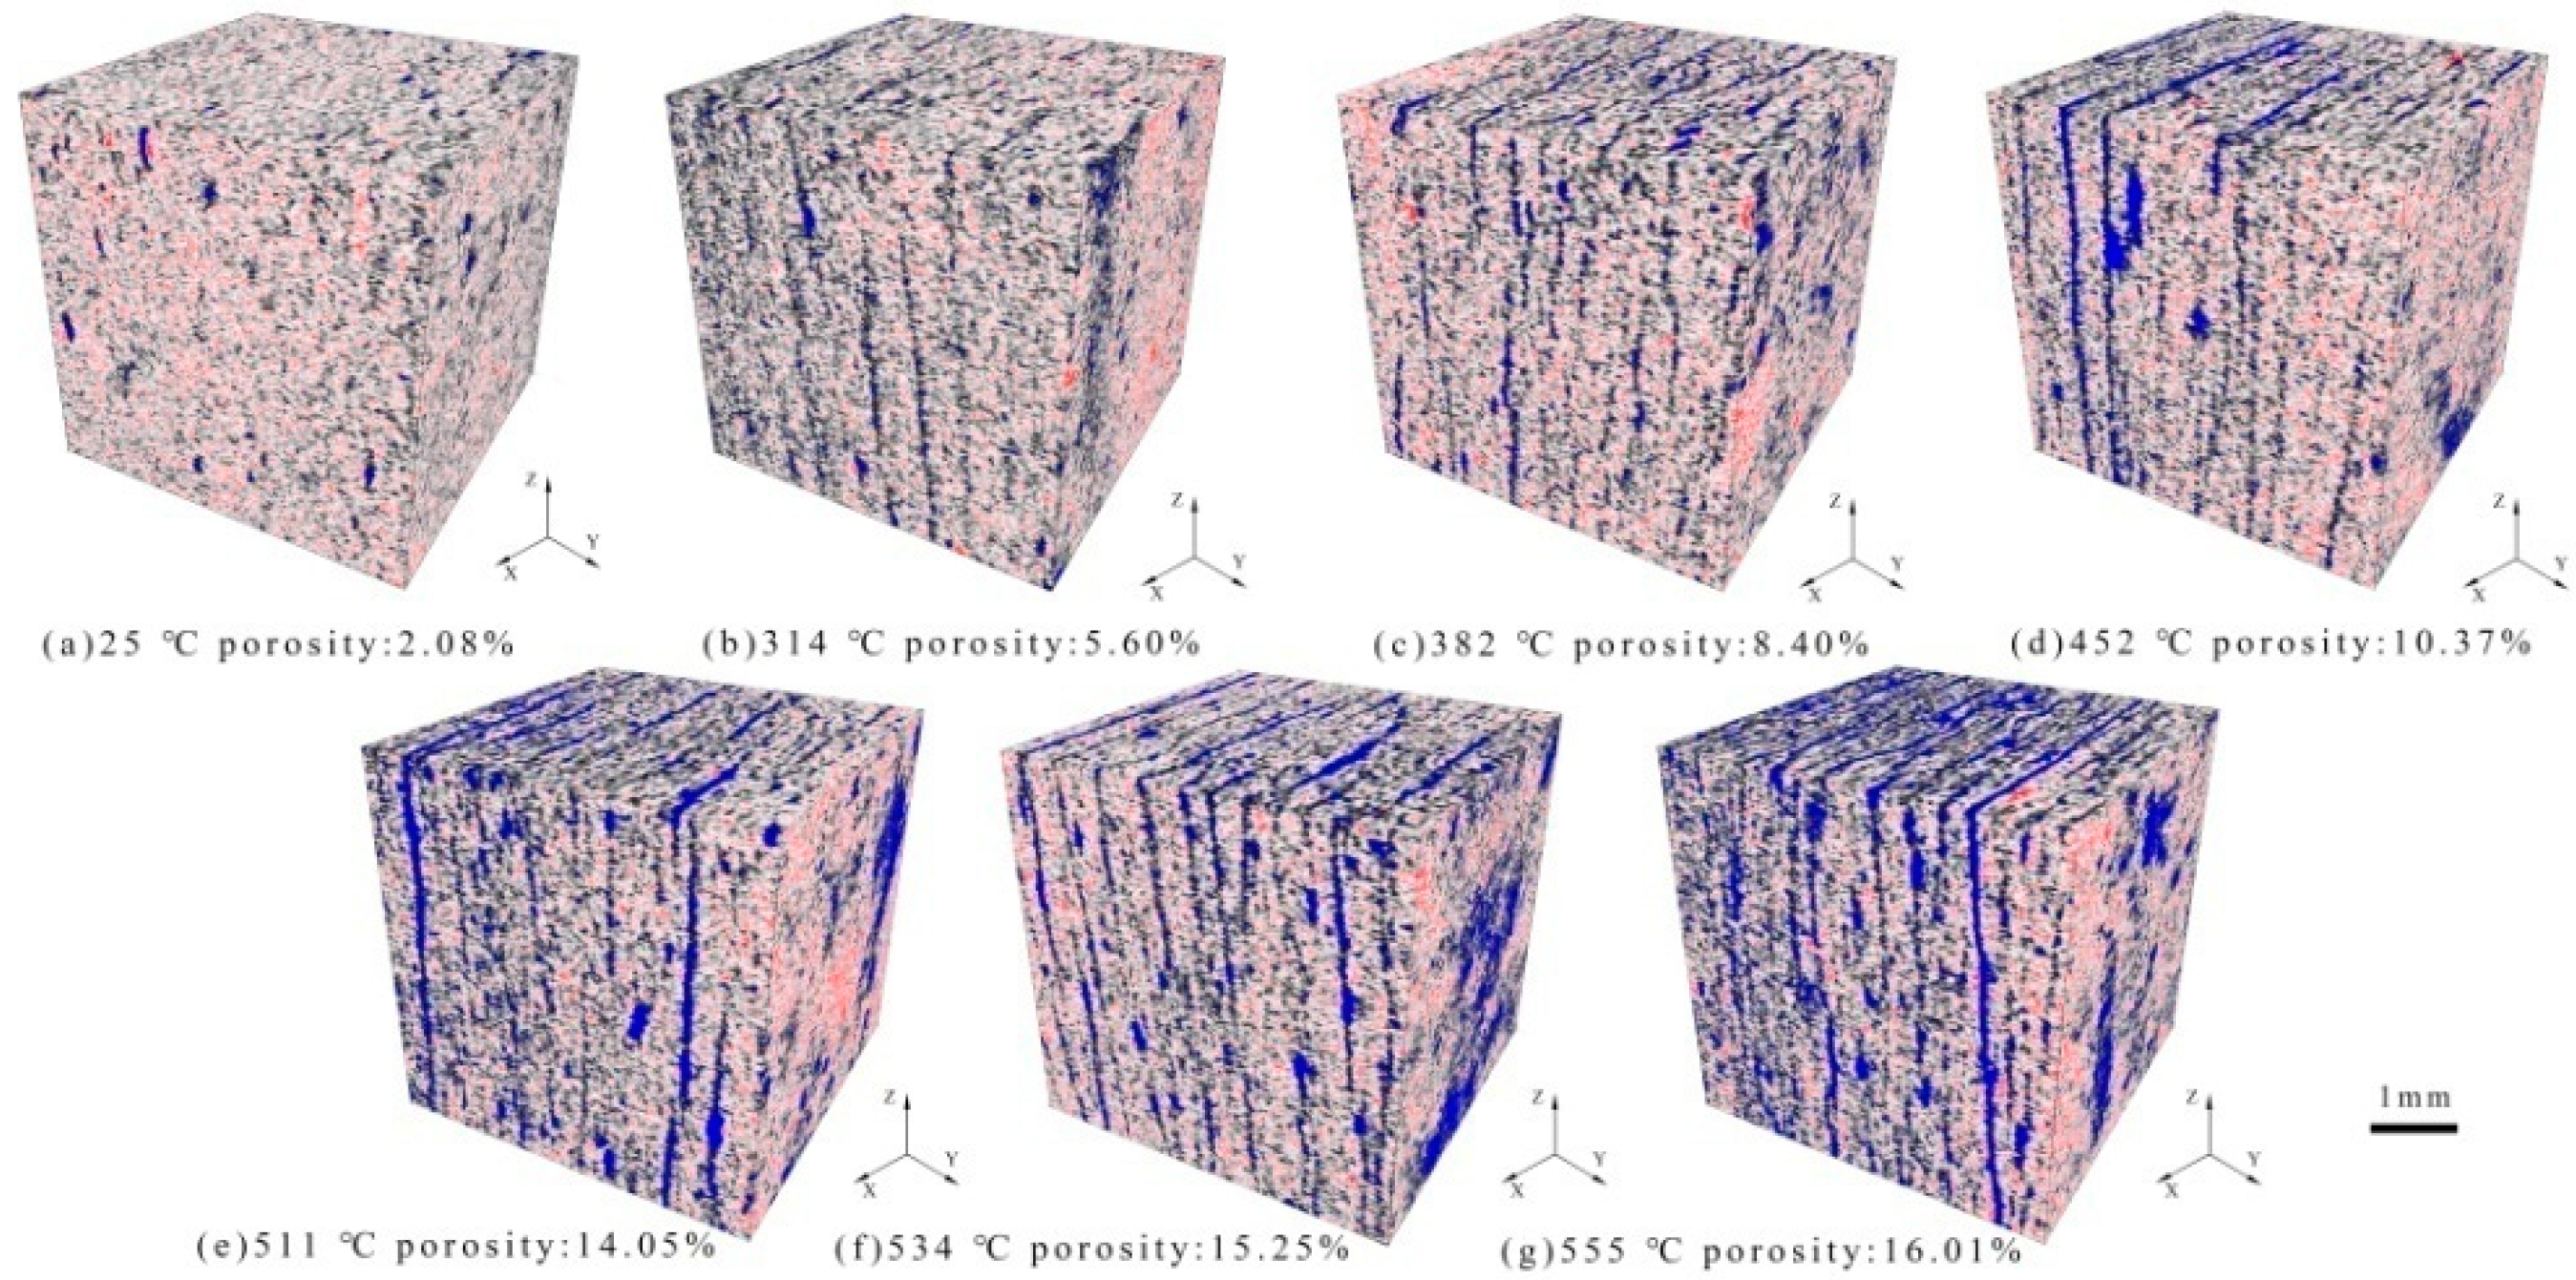
The 3D rendering of the DCOSs after steam pyrolysis at different temperatures is shown in Figure 5, where the blue part is the pore or fracture space, and the remainder is the solid skeleton. Figure 5a shows that the oil shale was relatively dense at room temperature (25 °C), and there was only a small amount of pore in the oil shale. It can be seen from Figure 5b that there were few cracks in the DCOS pyrolyzed by 314 °C steam, which is the main reason for the increase in porosity at this temperature. In this temperature range, the kerogen in the oil shale was not pyrolyzed, while free water and attached water in the oil shale were transformed in phase under the action of temperature and escaped from the weak bedding plane after becoming gas water. After the steam pyrolysis at 382 °C, there were more pores and cracks inside the oil shale, and some of the fractures penetrated the entire digital core. With a further increase in steam temperature, kerogen pyrolysis generated shale oil and gas products, which were driven outward by the flowing steam. Hence, the fractures in oil shale are not blocked by shale oil, and the steam can smoothly enter the oil shale, which enhances the heating effect and further pyrolysis of the oil shale. It is known that 400–550 °C is the main temperature range of oil shale pyrolysis. Figure 5d–g show that the pores and fractures of the oil shale continuously developed with the increase in steam temperature. After 450 °C, some large fractures penetrated the entire DCOS, and a large number of pores formed after kerogen pyrolysis.
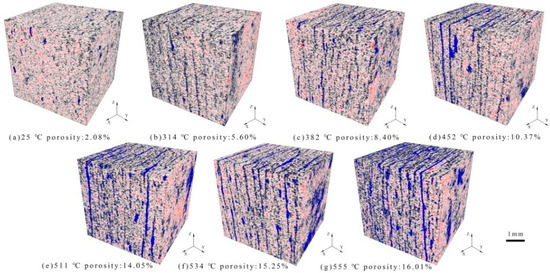
Figure 5.
3D volume-rendered digital cores of oil shale (DCOSs) (the pore space is shown in blue): (a) 25 °C porosity: 2.08%; (b) 314 °C porosity: 5.60%; (c) 382 °C porosity: 8.40%; (d) 452 °C porosity: 10.37%; (e) 511 °C porosity: 14.05%; (f) 534 °C porosity: 15.25%; (g) 555 °C porosity: 16.01%.
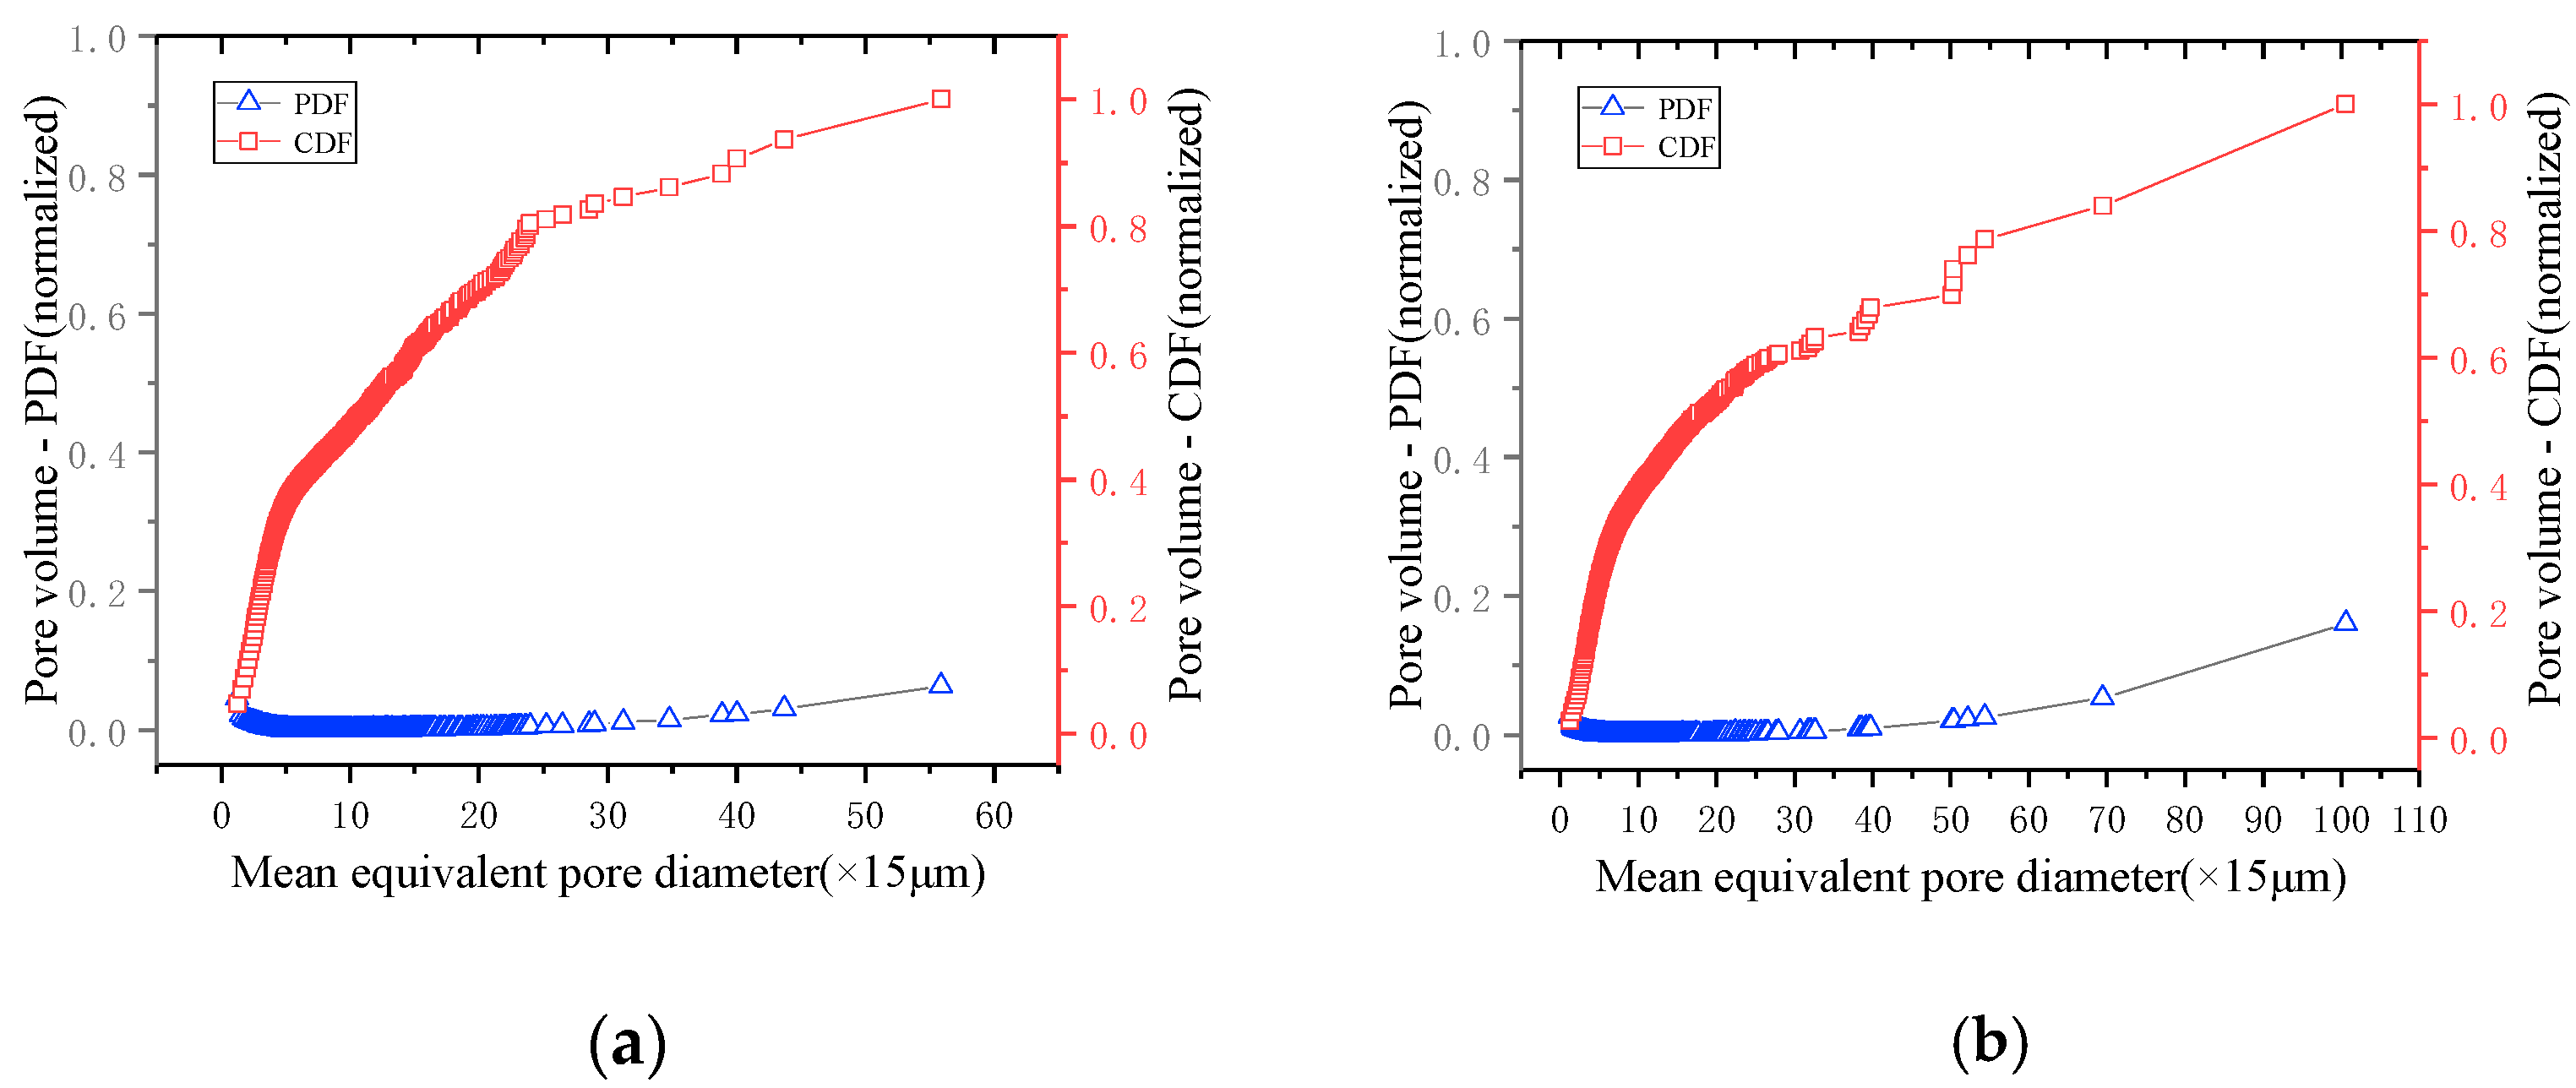
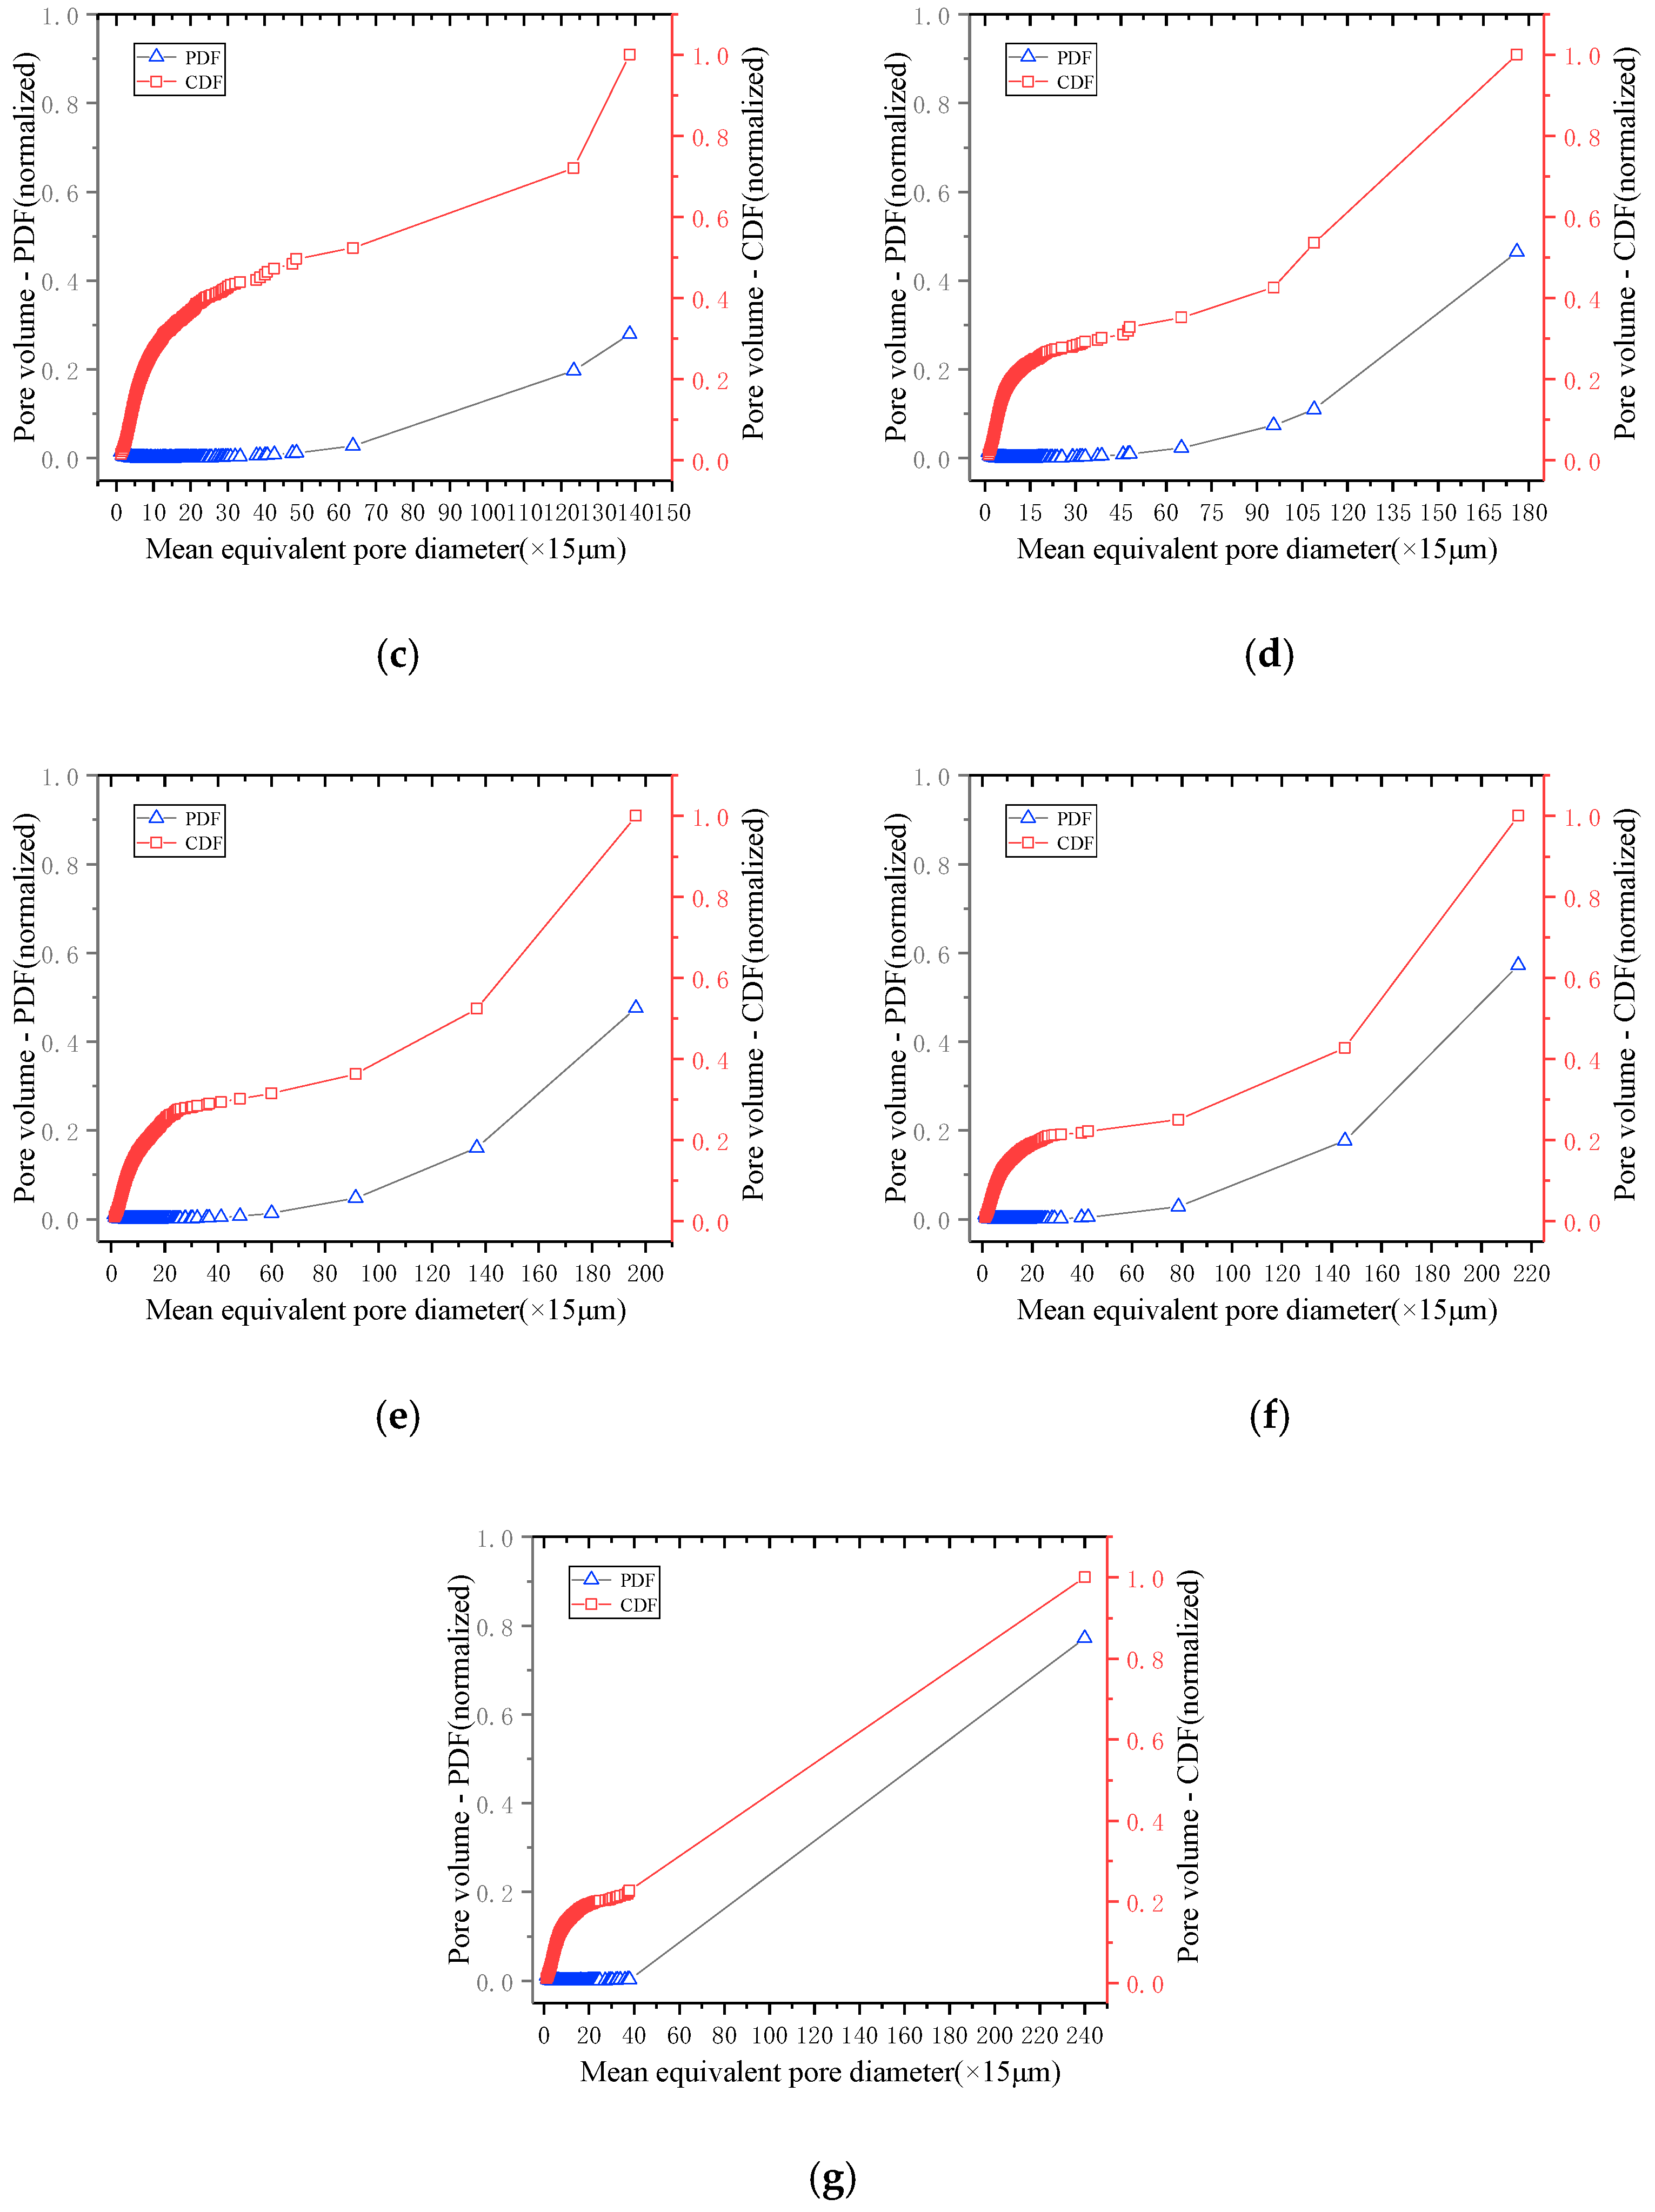
In the DCOSs, a single pore or fracture was divided into different groups according to the average equivalent pore diameter, and a relationship curve between the pore volume and the average equivalent pore diameter was obtained, as shown in Figure 6. Figure 6a shows that at 25 °C, the pore space inside the DCOS was dominated by pores with an equivalent pore diameter of 1–30 pixels (the actual width of each pixel was 15 μm, and the size of the digital core was 3903 pixels), which accounted for more than 80% of the total pore space, and the equivalent pore diameter of the largest pore cluster was 55 pixels. With the increase in temperature, more massive pore-fracture clusters gradually formed. When the pyrolysis temperature was 314 °C (Figure 6b), the equivalent pore diameter of the largest pore-fracture cluster reached 100 pixels, which accounted for 16.0% of the total void space, and the equivalent pore diameter of the second-largest pore-fracture cluster reached 69 pixels, which accounted for 5.3% of the entire void space. A dominant pore-fracture cluster appeared in the DCOS after the pyrolysis with superheated steam at 555 °C (Figure 6g). Its equivalent pore diameter reached 240 pixels, which accounted for 77.2% of all the void spaces, and the second size pore-fracture cluster only accounted for 3.0% of the total void spaces. Generally, with the increase in the superheated steam temperature, the porosity of the oil shale gradually increased. During the continuous generation of pores and fractures in the oil shale, pore-fracture clusters with absolute dominant volume progressively appeared.
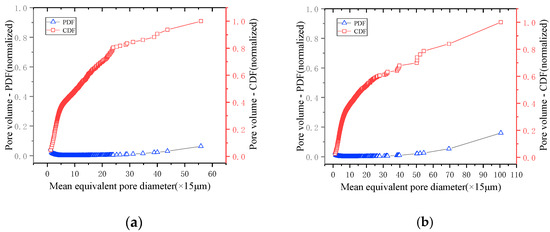
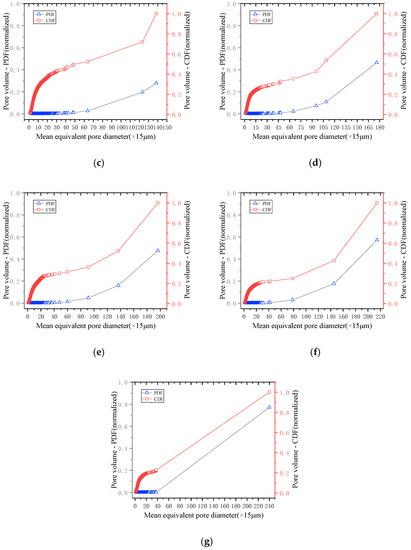
Figure 6.
Pore volume distribution at different steam pyrolysis temperatures (both probability density function (PDF) and cumulative distribution function (CDF)): (a) 25 °C; (b) 314 °C; (c) 382 °C; (d) 452 °C; (e) 511 °C; (f) 534 °C; (g) 555 °C.
3.2. Study on the Evolution of Pore and Fracture Connectivity of Oil Shale after Pyrolysis at Different Superheated Steam Temperatures
The pore and fracture space constitute the void space in the oil shale. The randomly distributed pores and fractures connect to form a sizeable connected cluster, which is called a cluster, and the cluster with the largest volume is called the largest cluster. According to the percolation theory for porous media, when the porosity reaches a certain critical value, the volume of the largest cluster sharply increases. Then, the largest cluster spans the entire structure from one boundary plane to its opposite boundary plane and becomes an effective flow path. In this case, the connectivity and permeability characteristics of the porous medium are considered to have experienced a qualitative transformation. In finite-size systems, the effective porosity P is defined as:
where M(L) is the volume of the largest cluster, and L3 is the total volume of the finite-size system.
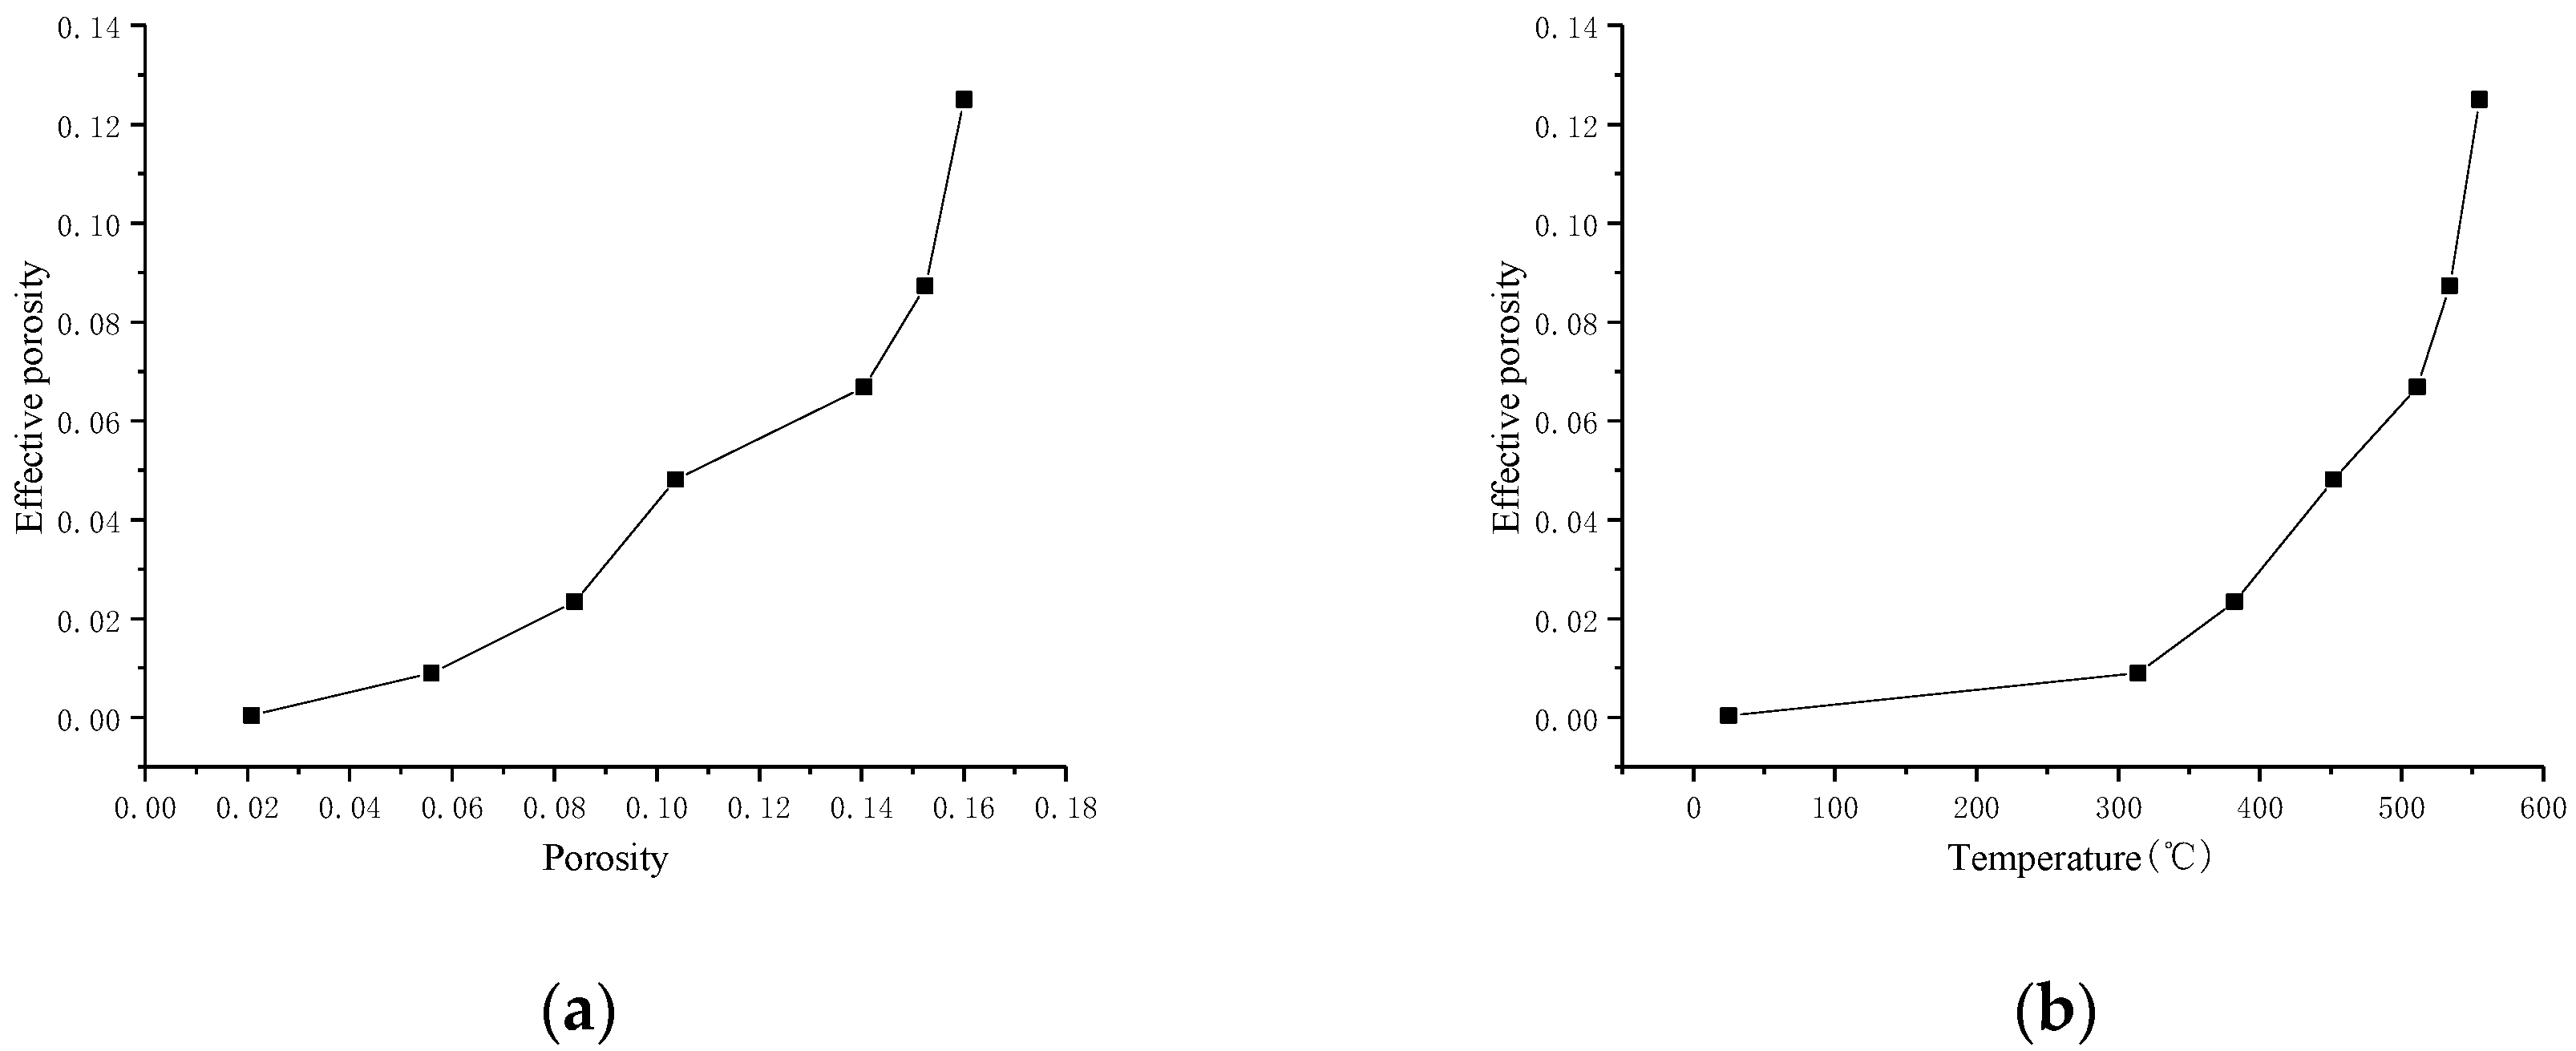
After pyrolysis at different superheated steam temperatures, the curves of the effective porosity of the oil shale at different temperatures and porosities were as shown in Figure 7. Figure 7 shows that the effective porosity P was very small at room temperature (0.047%), which indicates that the volume scale of all the clusters in the oil shale was very small. The effective porosity P of the oil shale slowly increased from room temperature to 314 °C, increased faster from 314 to 511 °C, and rapidly increased after 511 °C. Compared with ideal homogeneous porous media [30], the curve of the effective porosity P of the DCOSs with porosity is more complicated. It has distinct anisotropic characteristics and no exact mutation position.
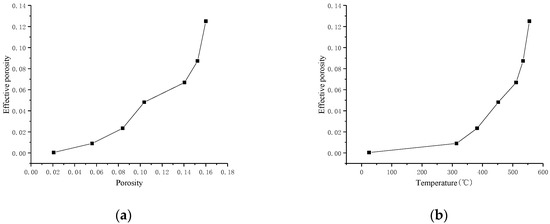
Figure 7.
Curves of effective porosity of oil shale at: (a) different porosities; (b) different temperatures.
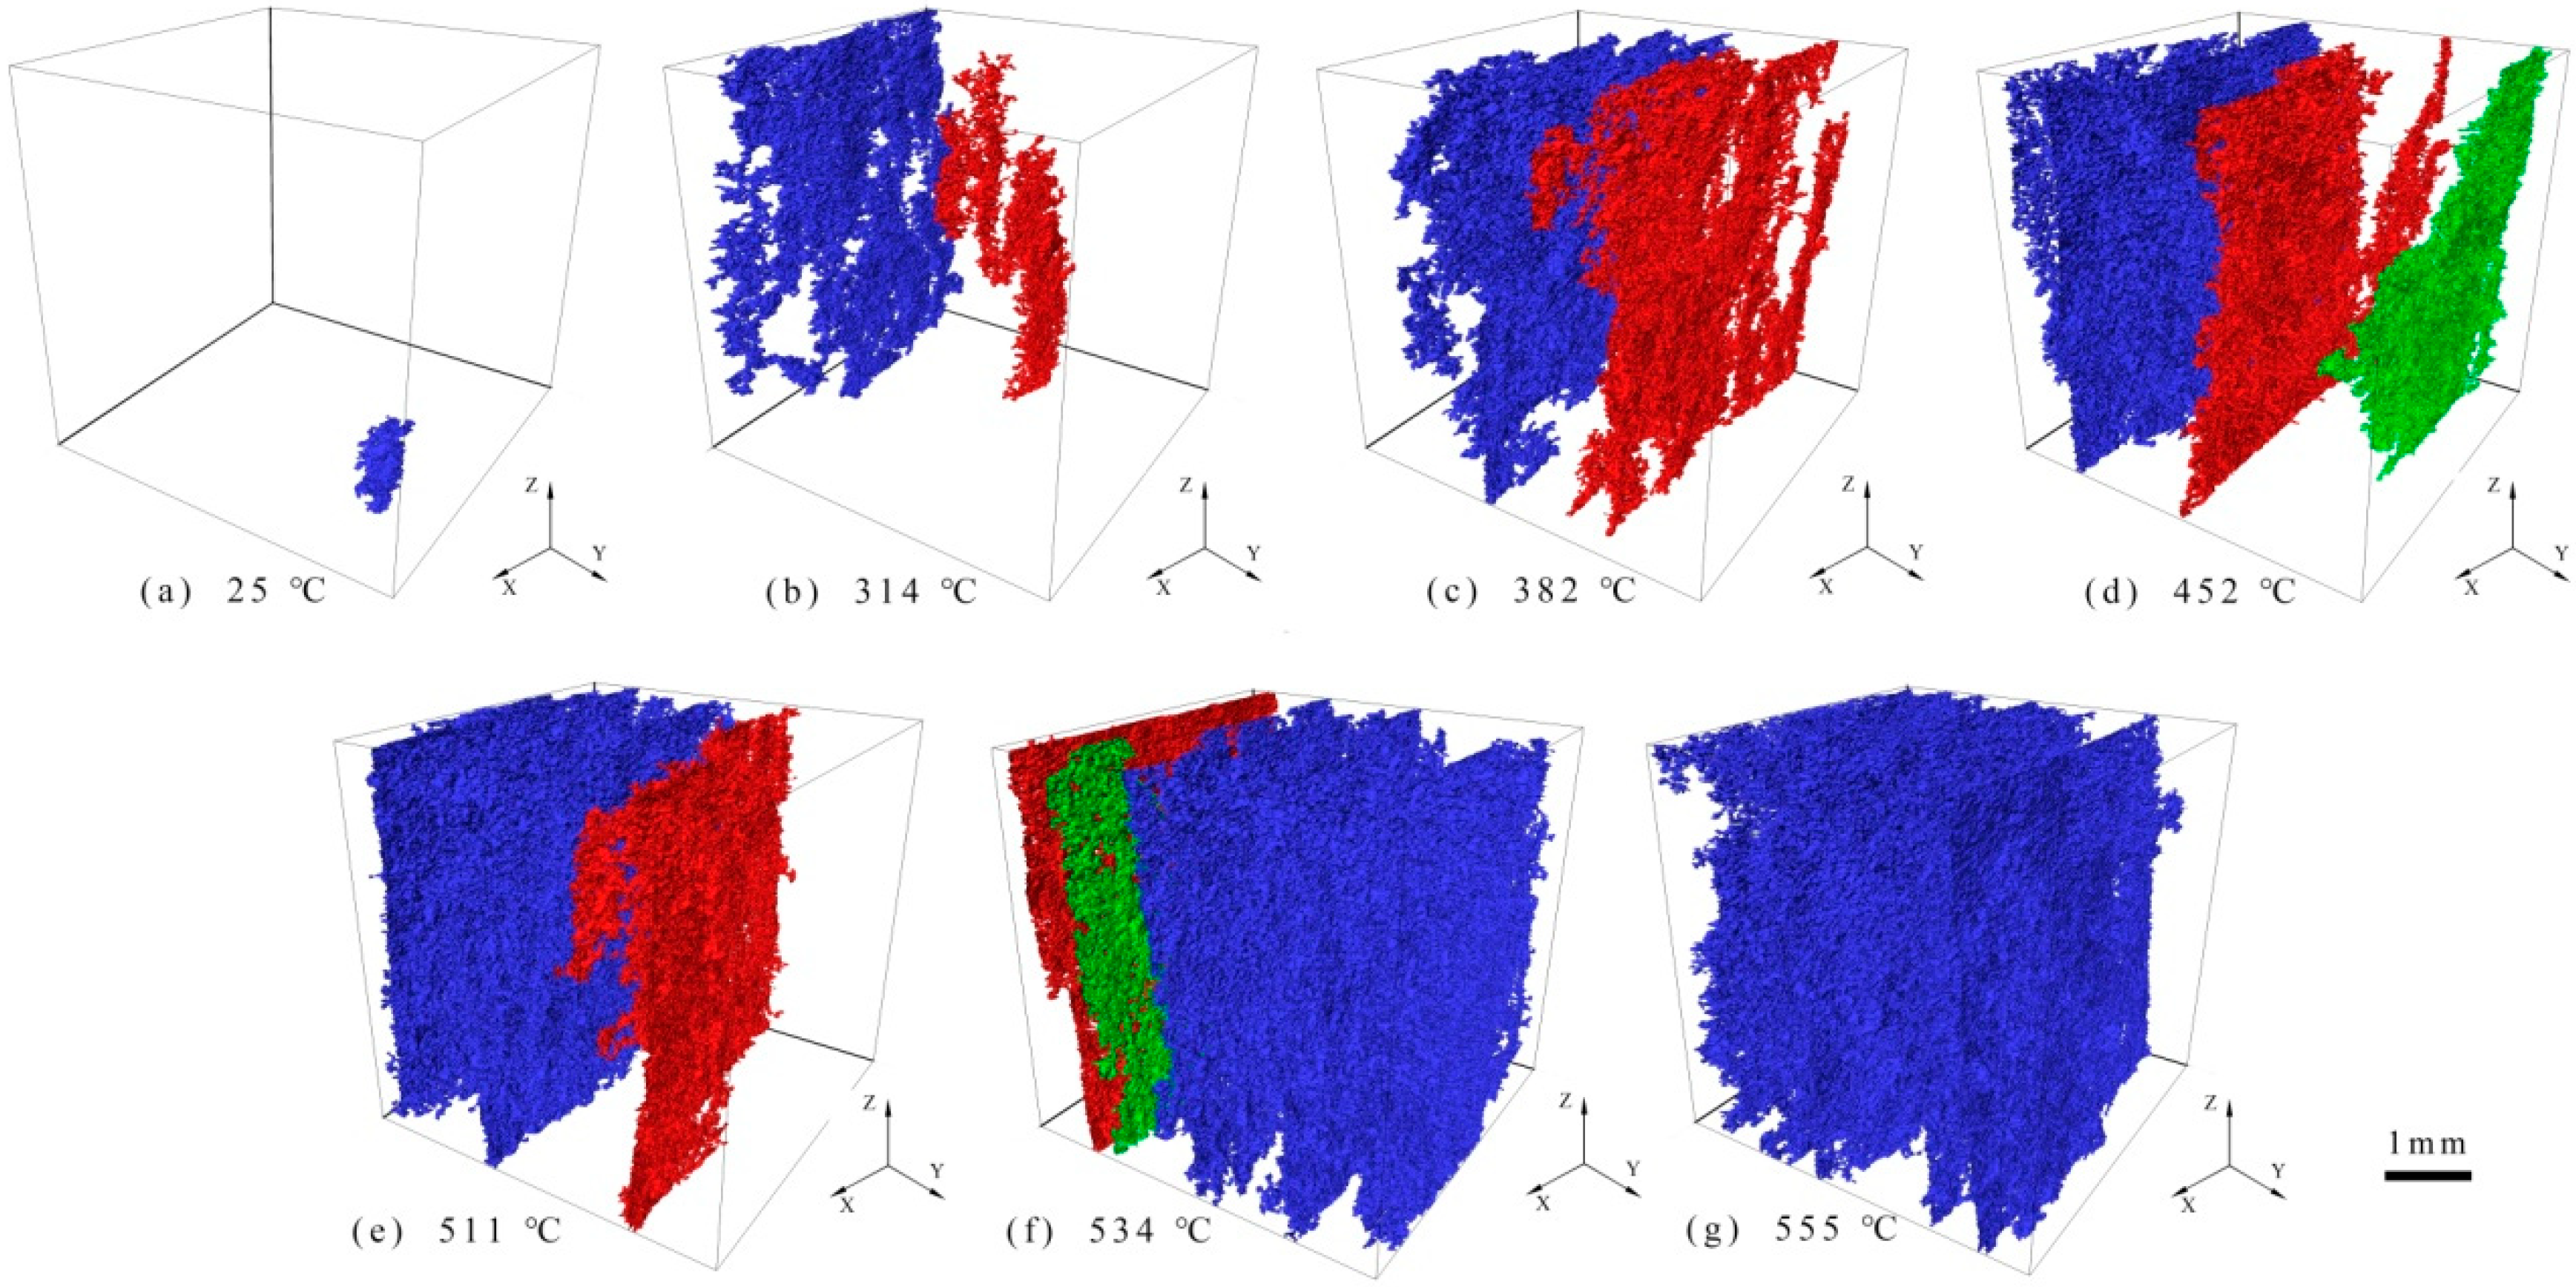
Figure 8 shows the three-dimensional rendering of the largest pore-fracture cluster in the DCOSs and the percolating pore-fracture clusters (the pore-fracture cluster that spans the entire DCOS from one boundary plane to its opposite boundary plane), where the largest pore-fracture cluster is shown in blue. The other percolating pore-fracture clusters are shown in red and green. Figure 8a shows that the largest cluster in the DCOS at room temperature was a relatively large pore, which indicates that the oil shale at room temperature was complete and dense. From Figure 8b, it can be seen that there were two single fractures in the DCOS after the pyrolysis with superheated steam at 314 °C, which connected the upper and lower ends of the DCOS along the z-axis direction. However, the effective porosity P was only 0.899%, indicating that the fracture size was still small. When the pyrolysis temperature was higher than 314 °C (Figure 8c–g), a series of isolated fractures formed in the DCOS through the thermal cracking. The larger fractures connected with the relative boundary of the DCOS along the bedding direction. When the temperature reached the pyrolysis temperature for kerogen, a series of pores formed after the pyrolysis of kerogen. The new pores gradually connected with the adjacent fractures, which expanded the pore-fracture clusters in the oil shale along the direction perpendicular to the sedimentary bedding. This process is illustrated in Figure 9. After the pyrolysis with 555 °C superheated steam (Figure 8g), the percolating pore-fracture clusters in the digital core of the oil shale merged into one, which occupied a dominant position in volume. It connected the boundary of the entire DCOS along the directions parallel to and perpendicular to the sedimentary bedding plane.
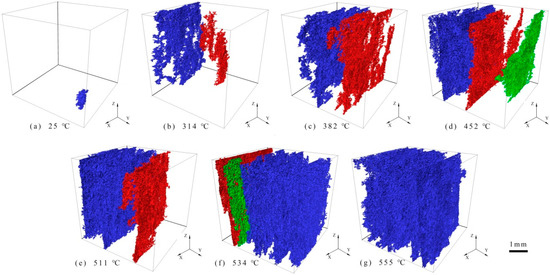
Figure 8.
Distributions of the largest pore-fracture cluster and percolating clusters in DCOSs after the superheated steam pyrolysis at different temperatures. For the sake of distinction, the largest pore-fracture cluster is rendered in blue for each DCOS: (a) 25 °C; (b) 314 °C; (c) 382 °C; (d) 452 °C; (e) 511 °C; (f) 534 °C; (g) 555 °C.

Figure 9.
Schematic diagram of the formation of the sizeable pore-fracture cluster by the interconnection of smaller pores and fractures.
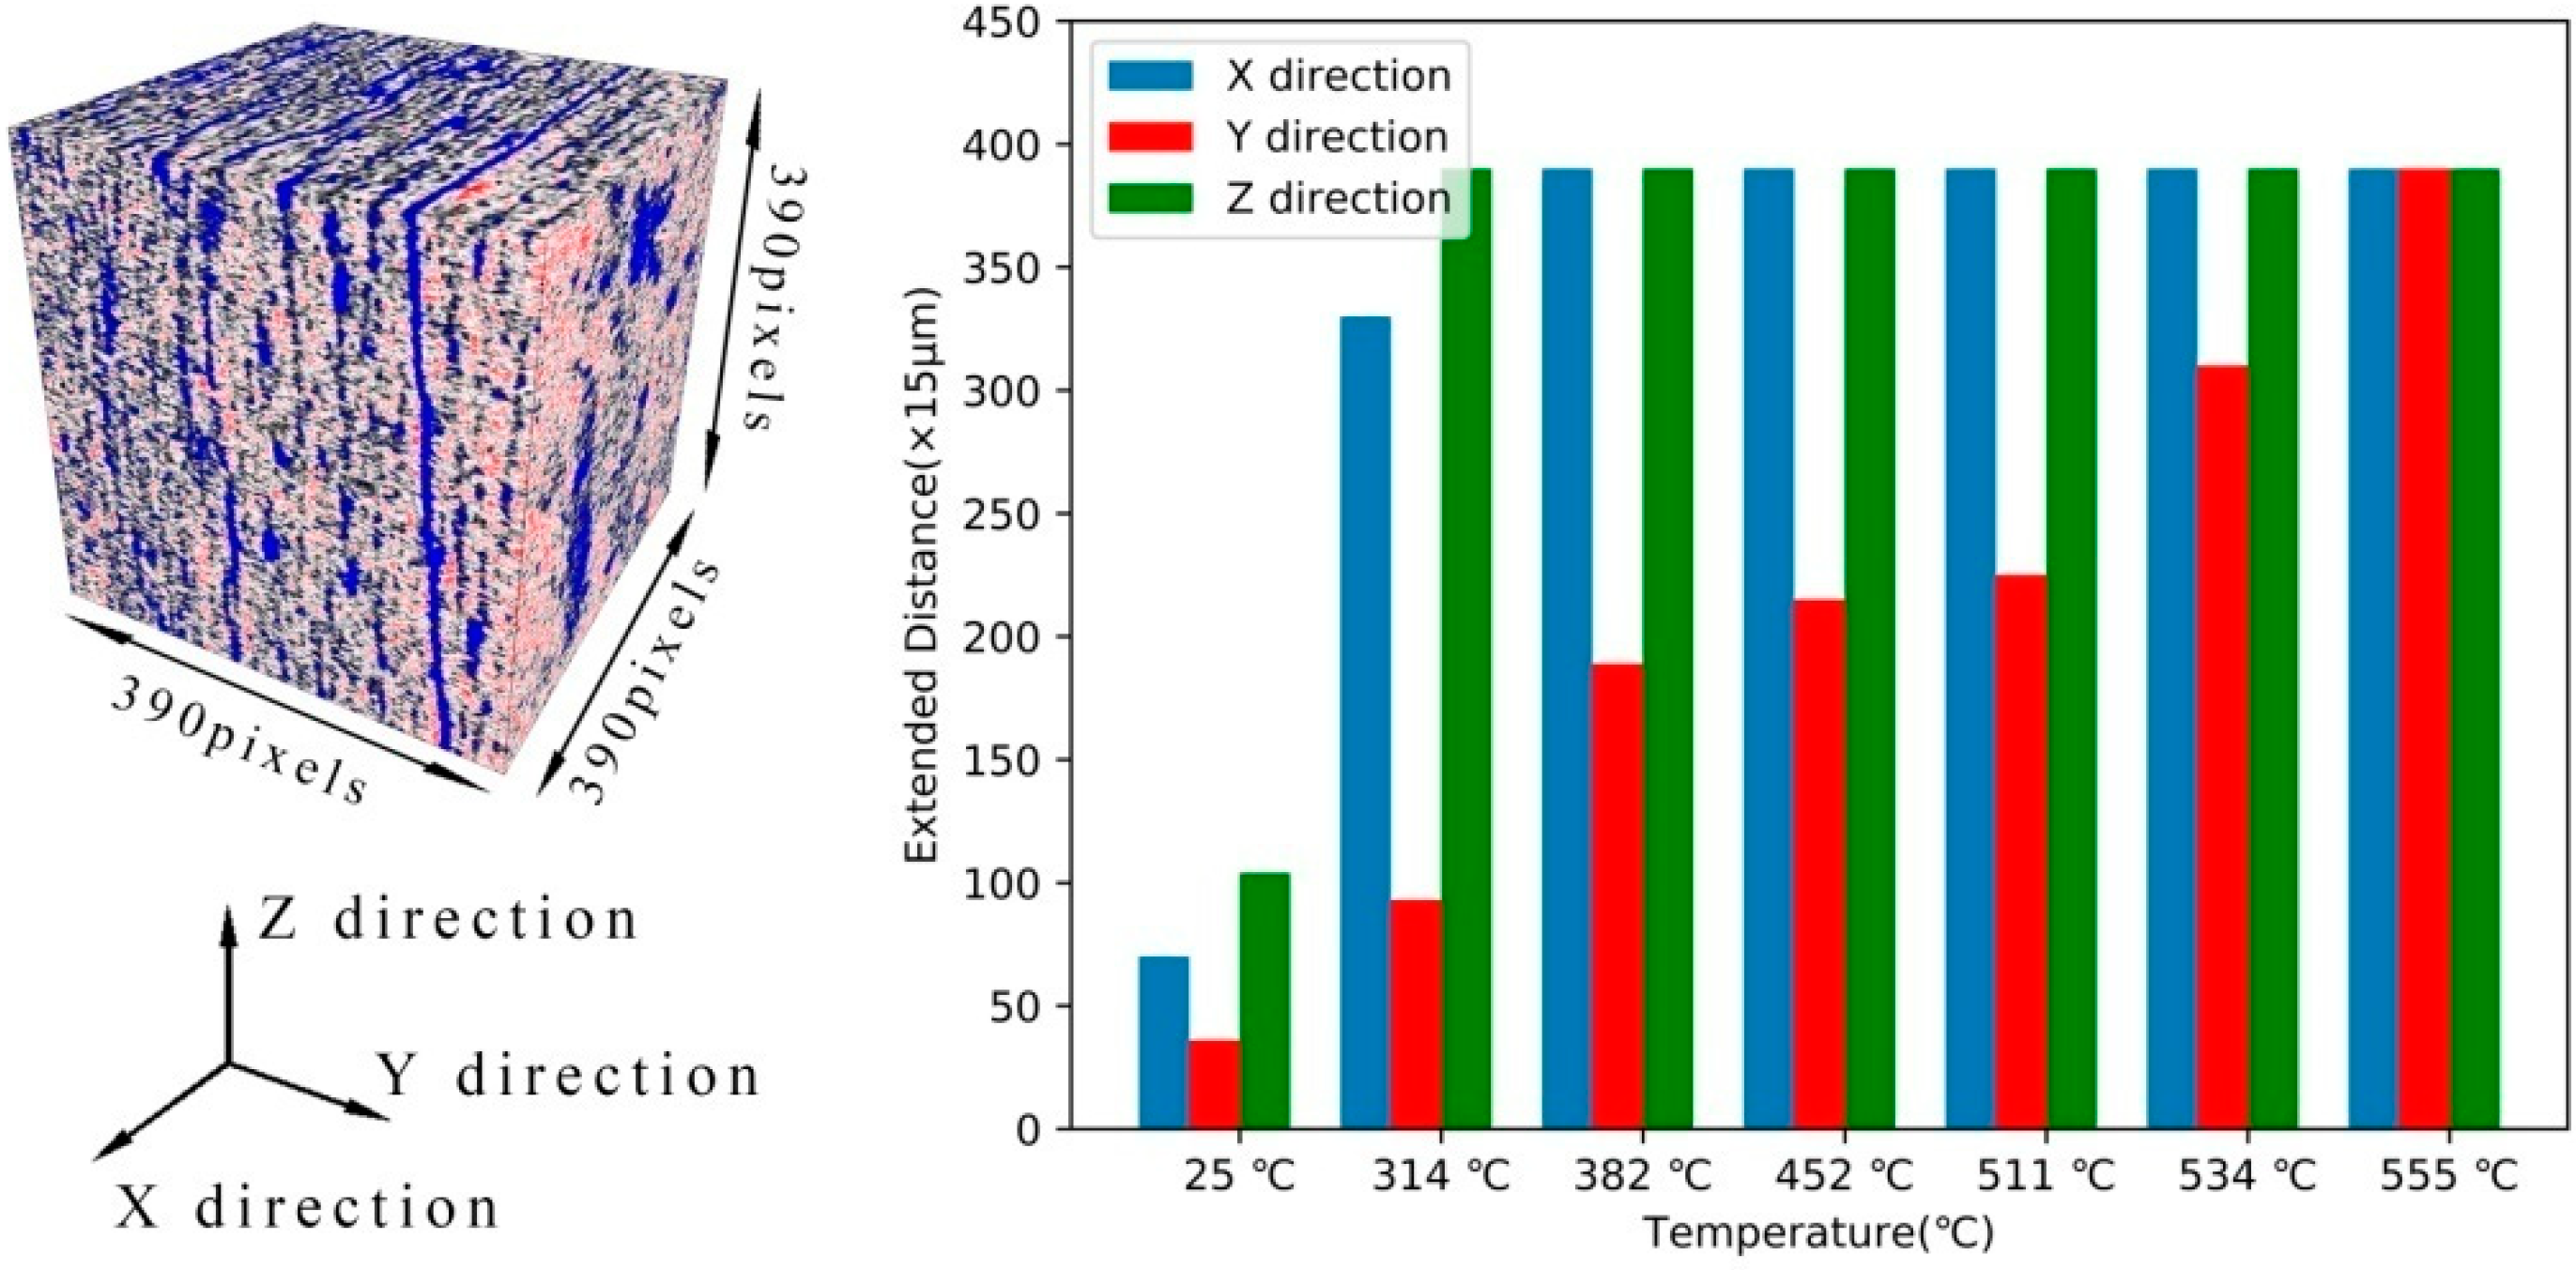
The change in the extension length of the largest pore-fracture cluster in the DCOSs with the pyrolysis temperature in three-dimensional space is shown in Figure 10. In the coordinate system established in this paper, the xoz plane is parallel to the direction of the sedimentary bedding. Figure 10 shows that with the increase in pyrolysis temperature, the evolution law of the largest pore-fracture cluster in the oil shale had strong anisotropic characteristics. At room temperature, the largest pore-fracture cluster had a small extension length in three directions. With the increase in pyrolysis temperature, the largest pore-fracture cluster quickly connected the boundary of the DCOS along the x and z directions, forming an effective flow path. However, it was not until 555 °C that the relative boundary of the DCOS was connected along the direction perpendicular to the sedimentary bedding.
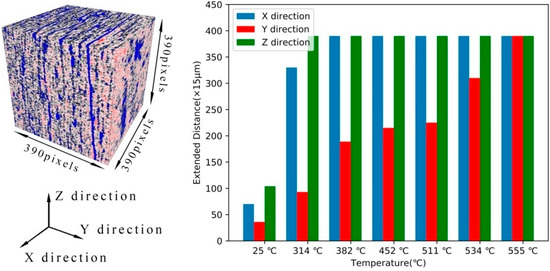
Figure 10.
Extension length of the largest pore-fracture cluster in the x, y, and z directions at different pyrolysis temperatures.
3.3. Porosity Variation of Oil Shale CT Slices in Directions Vertical and Parallel to the Sedimentary Bedding and Its Effect on the Permeability
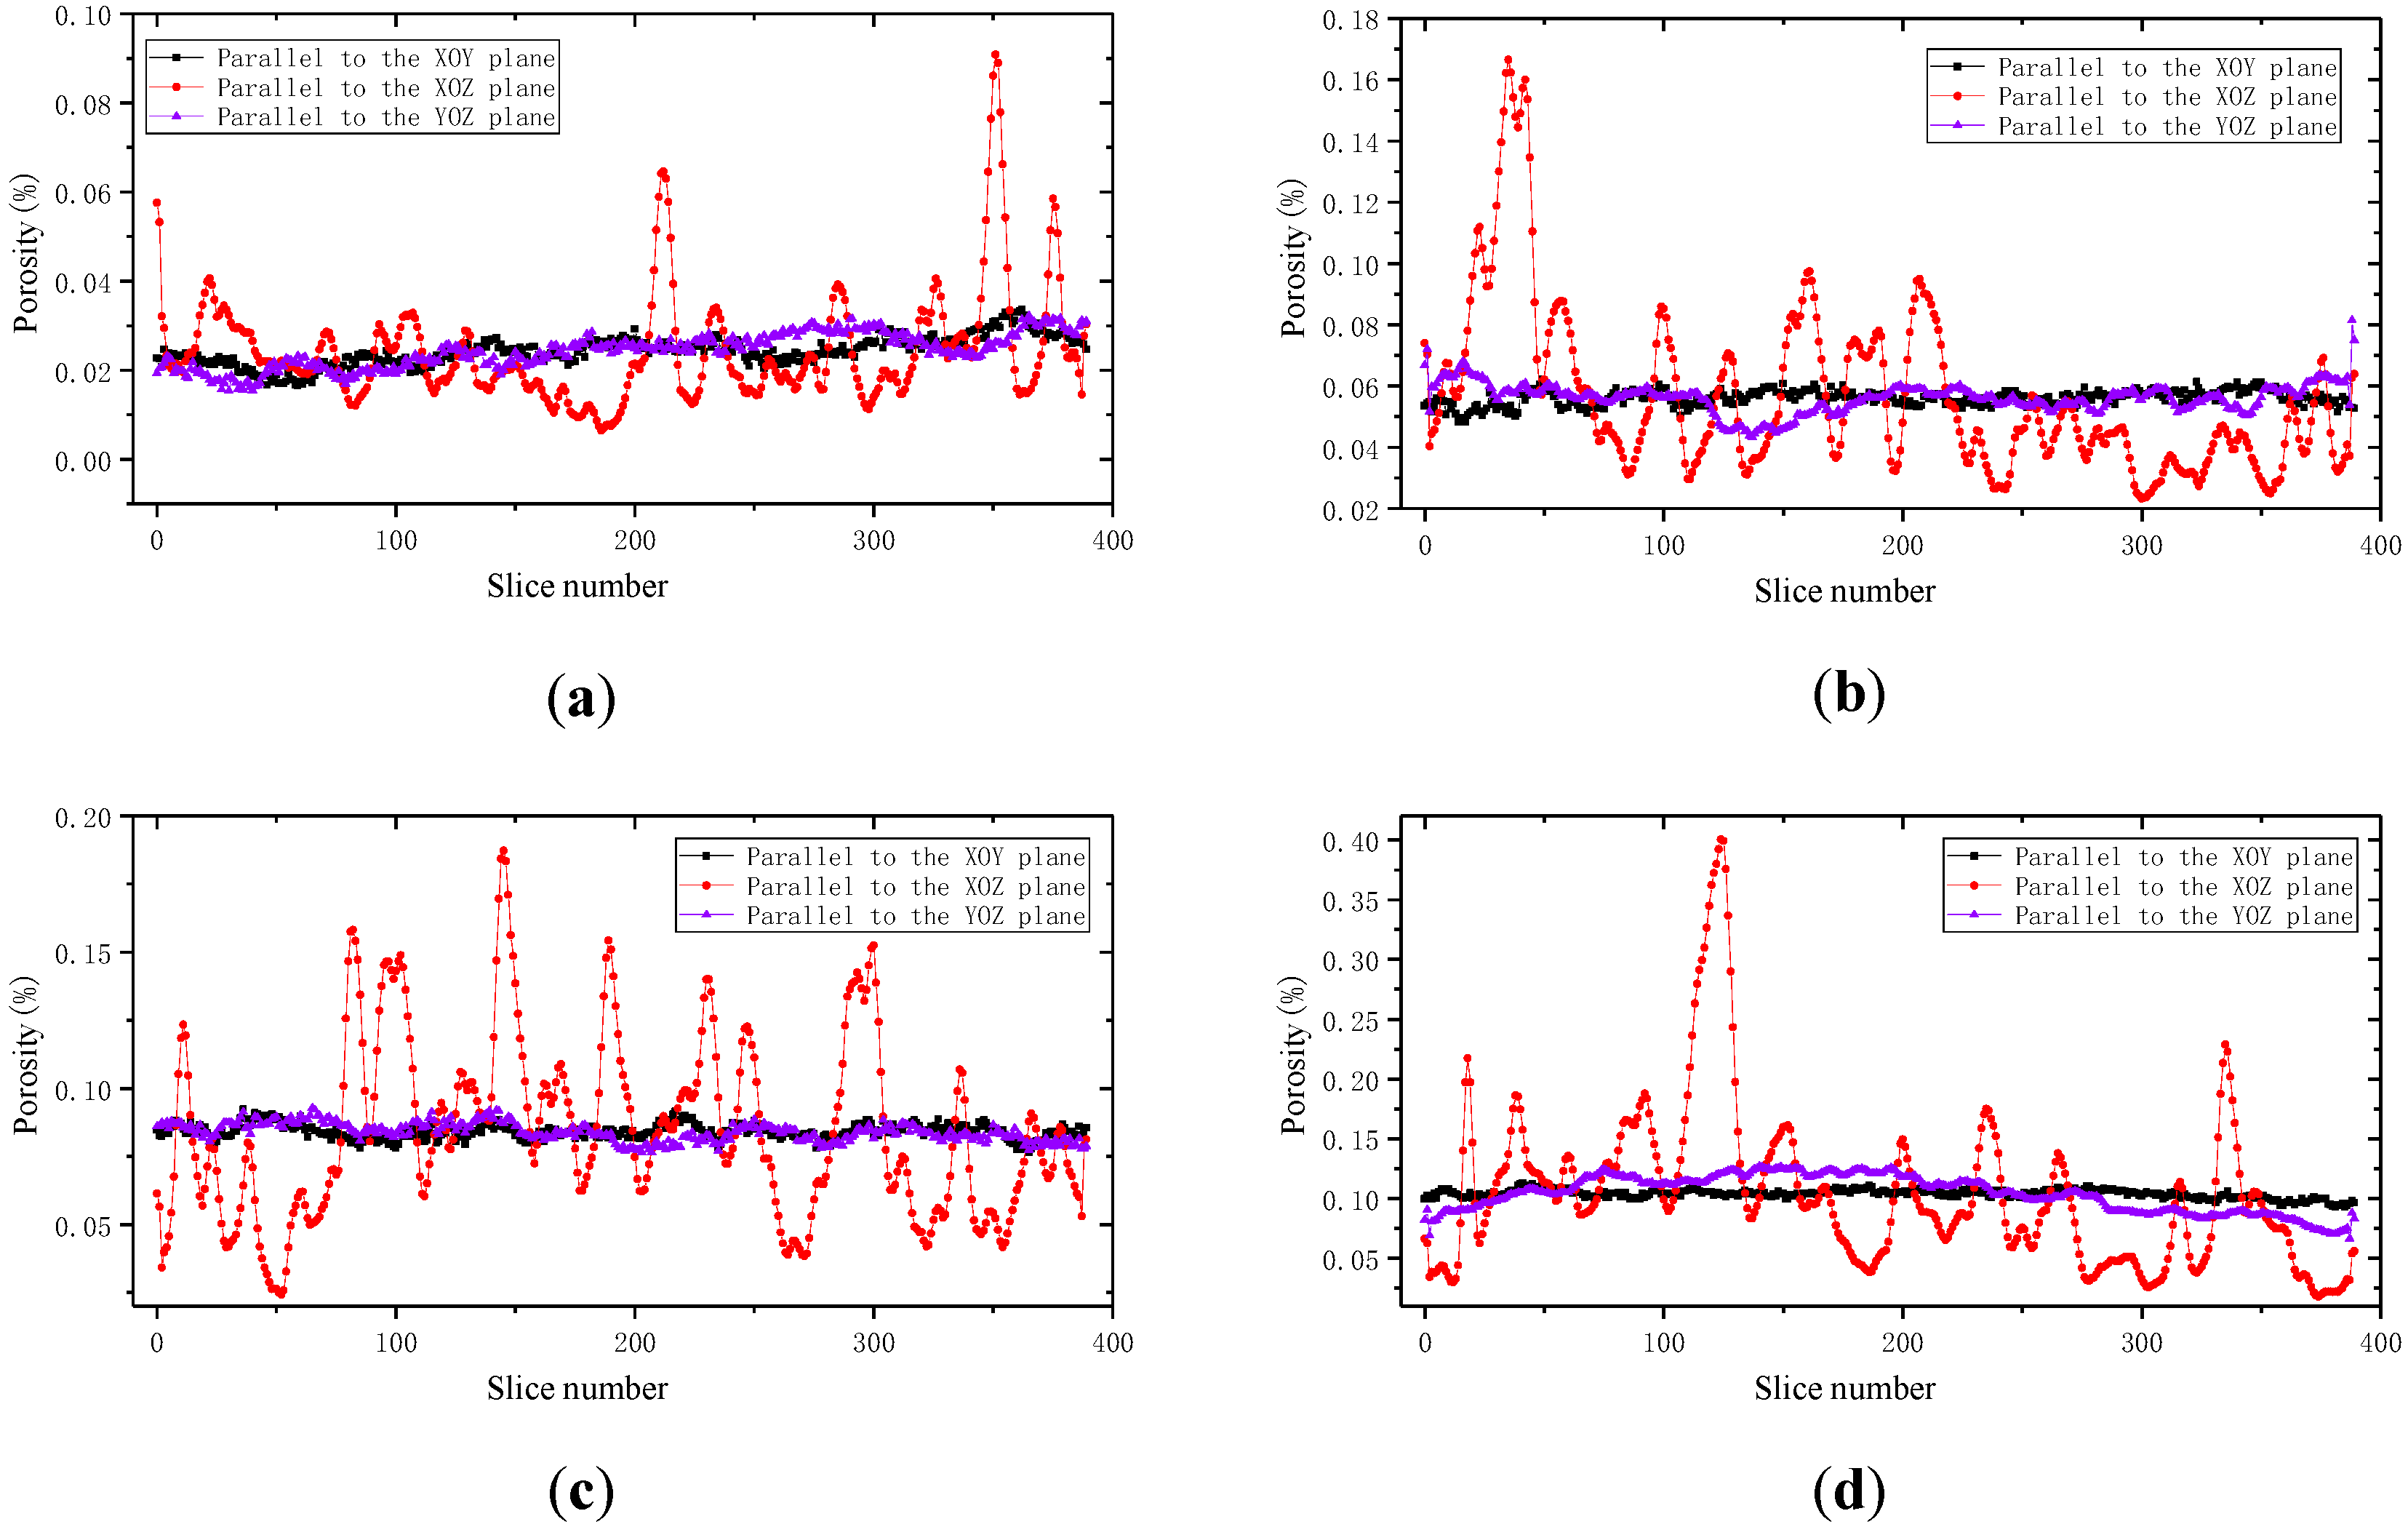
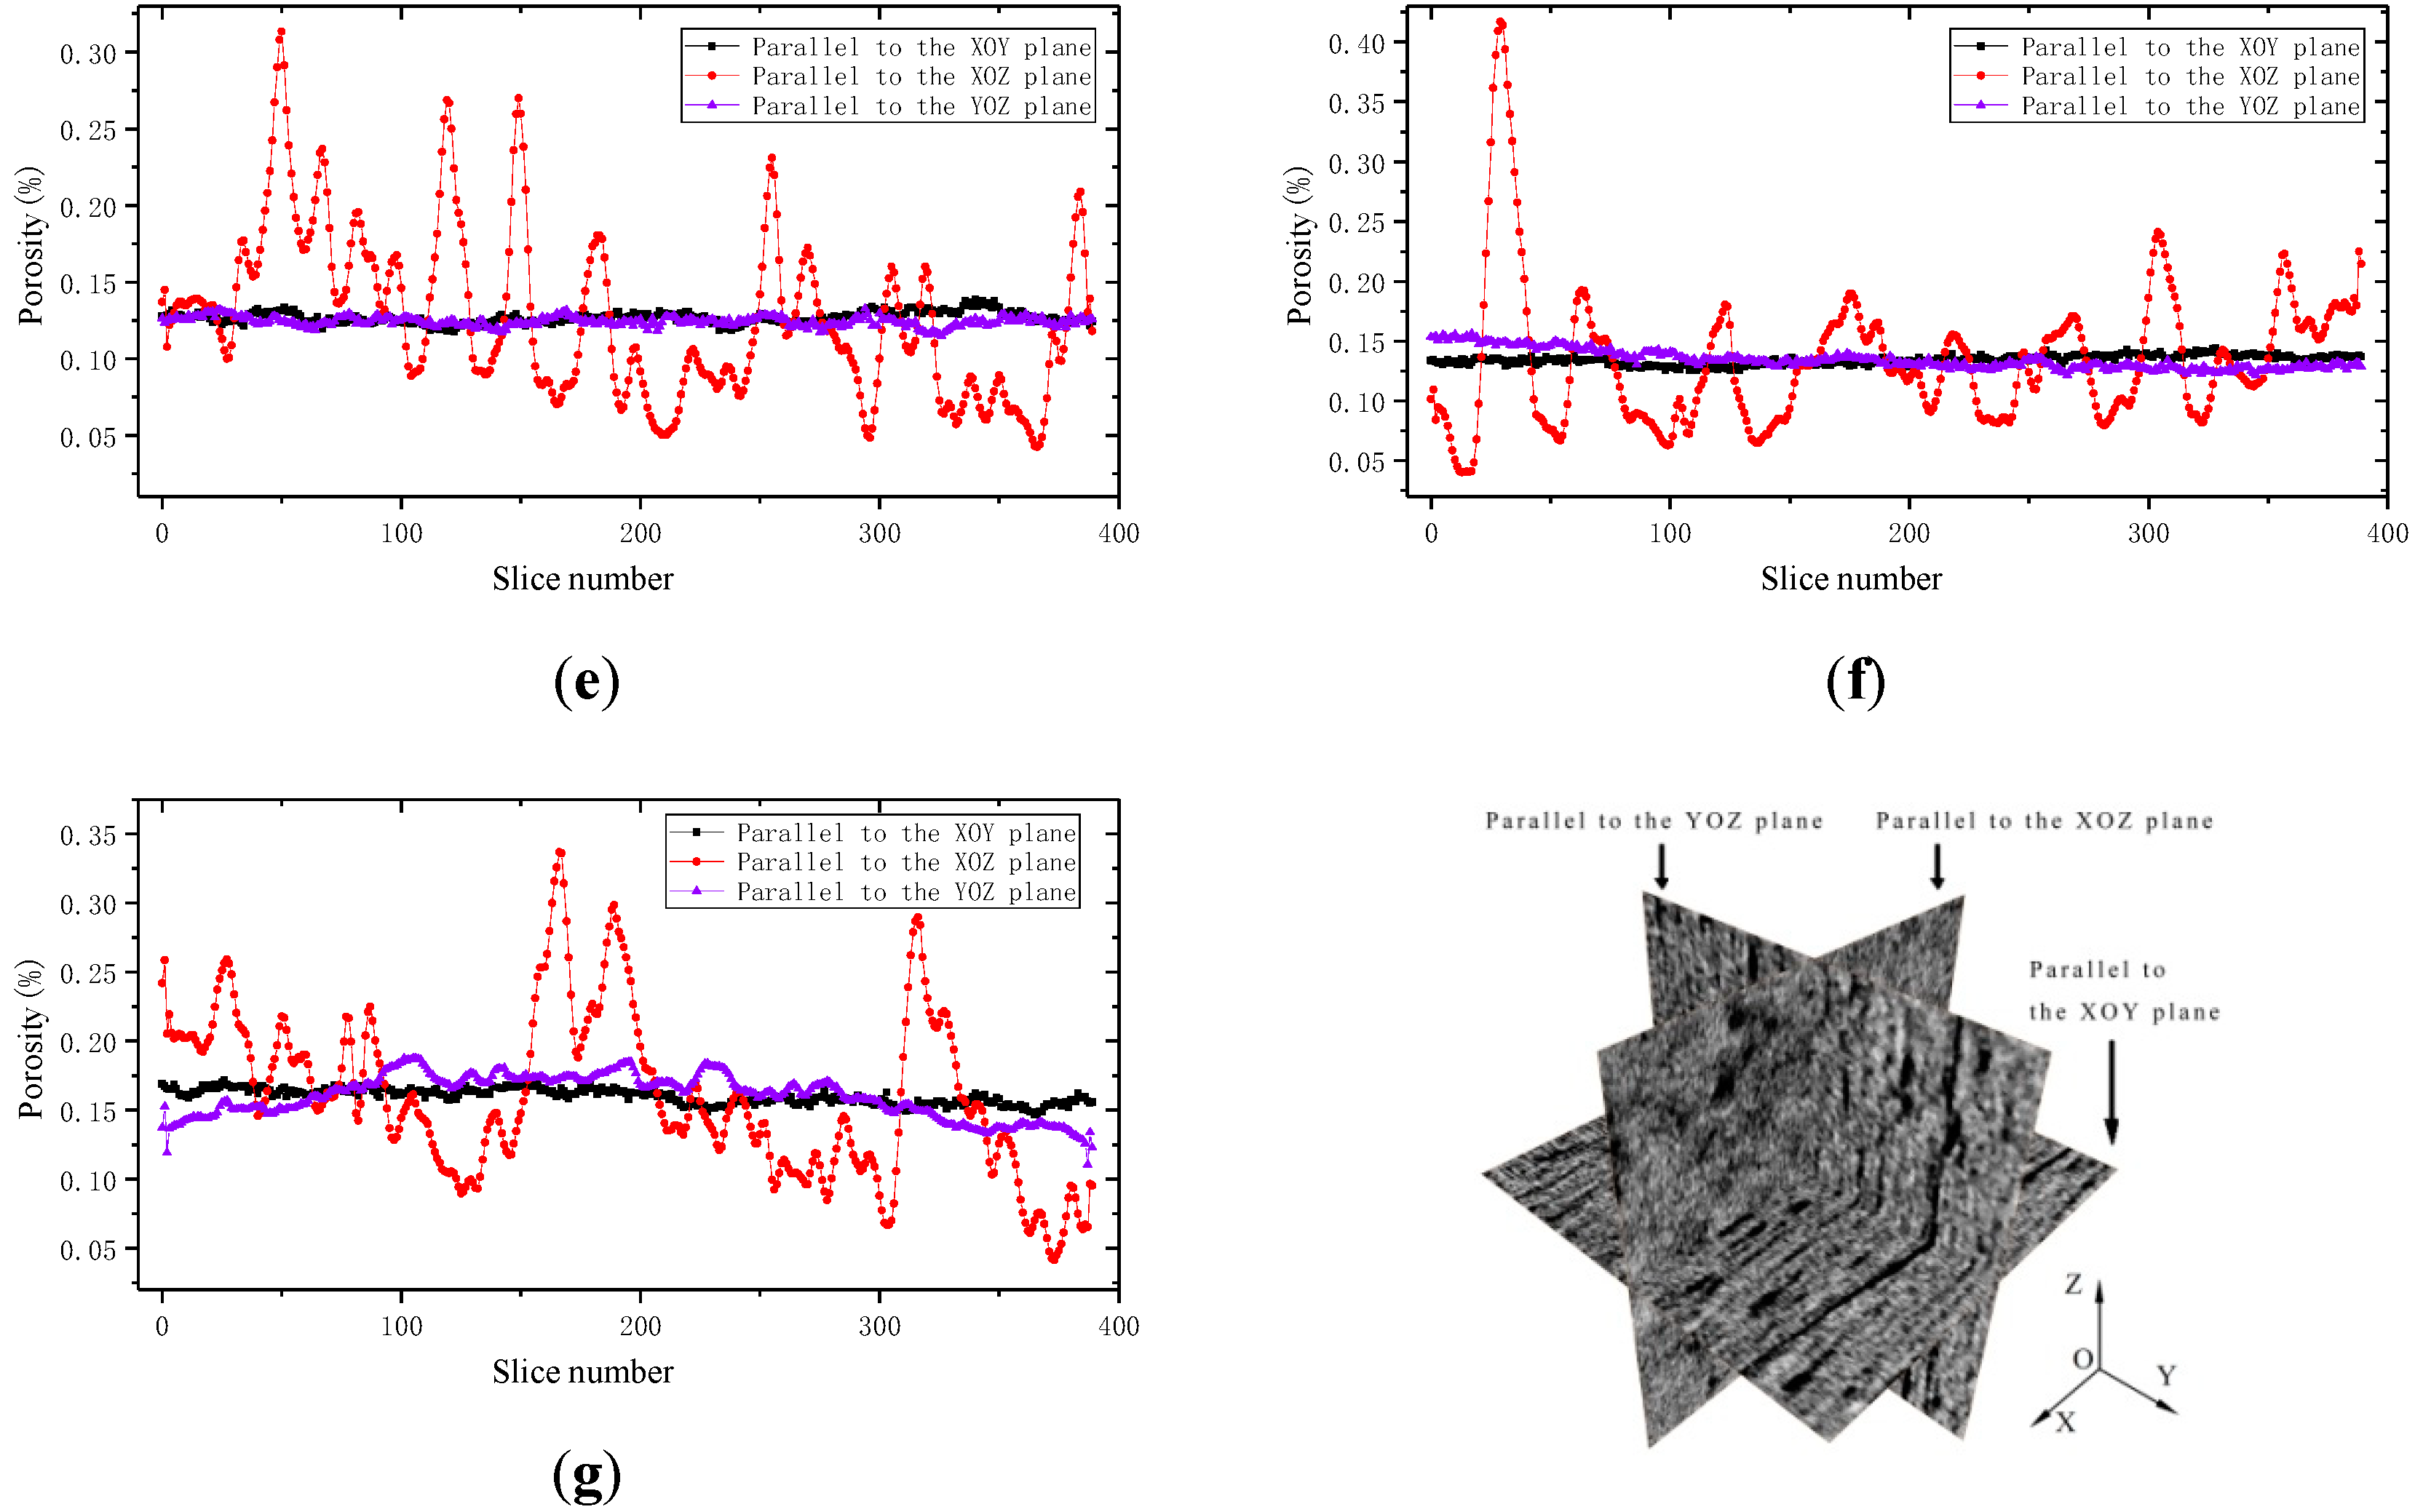
The change curves of the porosity of CT slices parallel to the xoy, xoz, and yoz planes in the DCOSs after the pyrolysis with superheated steam at different temperatures are shown in Figure 11. For the convenience of discussion, the sedimentary bedding planes of all the 3D DCOSs for analysis are parallel to the xoz coordinate plane. Figure 11 shows that the porosity of the slices parallel to the xoy and yoz planes barely fluctuated, and the two curves almost coincide, while in the direction parallel to the xoz plane, the porosity of the slices at different locations greatly fluctuated. In the slices parallel to the xoz plane, the porosity generally peaked at the locations with fractures, since the oil shale is an anisotropic sedimentary rock, and the fractures were mainly distributed along the direction of the sedimentary bedding plane. When the slice parallel to the sedimentary bedding plane moved to the location with fractures, the porosity sharply increased. Compared with the fracture, the pore size was small, and its contribution to the porosity was relatively tiny. Therefore, in the direction parallel to the xoz plane, where there was no fracture, the porosity was generally lower than the average porosity of the DCOS.
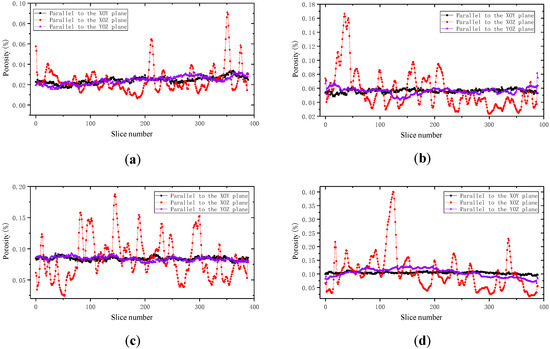
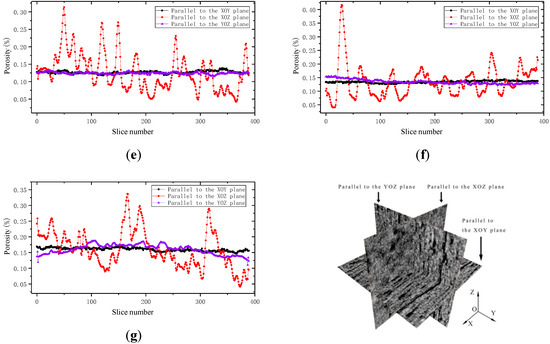
Figure 11.
Change curves of porosity of CT slices parallel to the xoy, xoz, and yoz planes in the DCOSs after the pyrolysis with superheated steam at different temperatures: (a) 25 °C, average porosity: 2.08%; (b) 314 °C, average porosity: 5.60%; (c) 382 °C, average porosity: 8.40%; (d) 452 °C, average porosity: 10.37%; (e) 511 °C, average porosity: 14.05%; (f) 534 °C, average porosity: 15.25%; (g) 555 °C, average porosity: 16.01%.
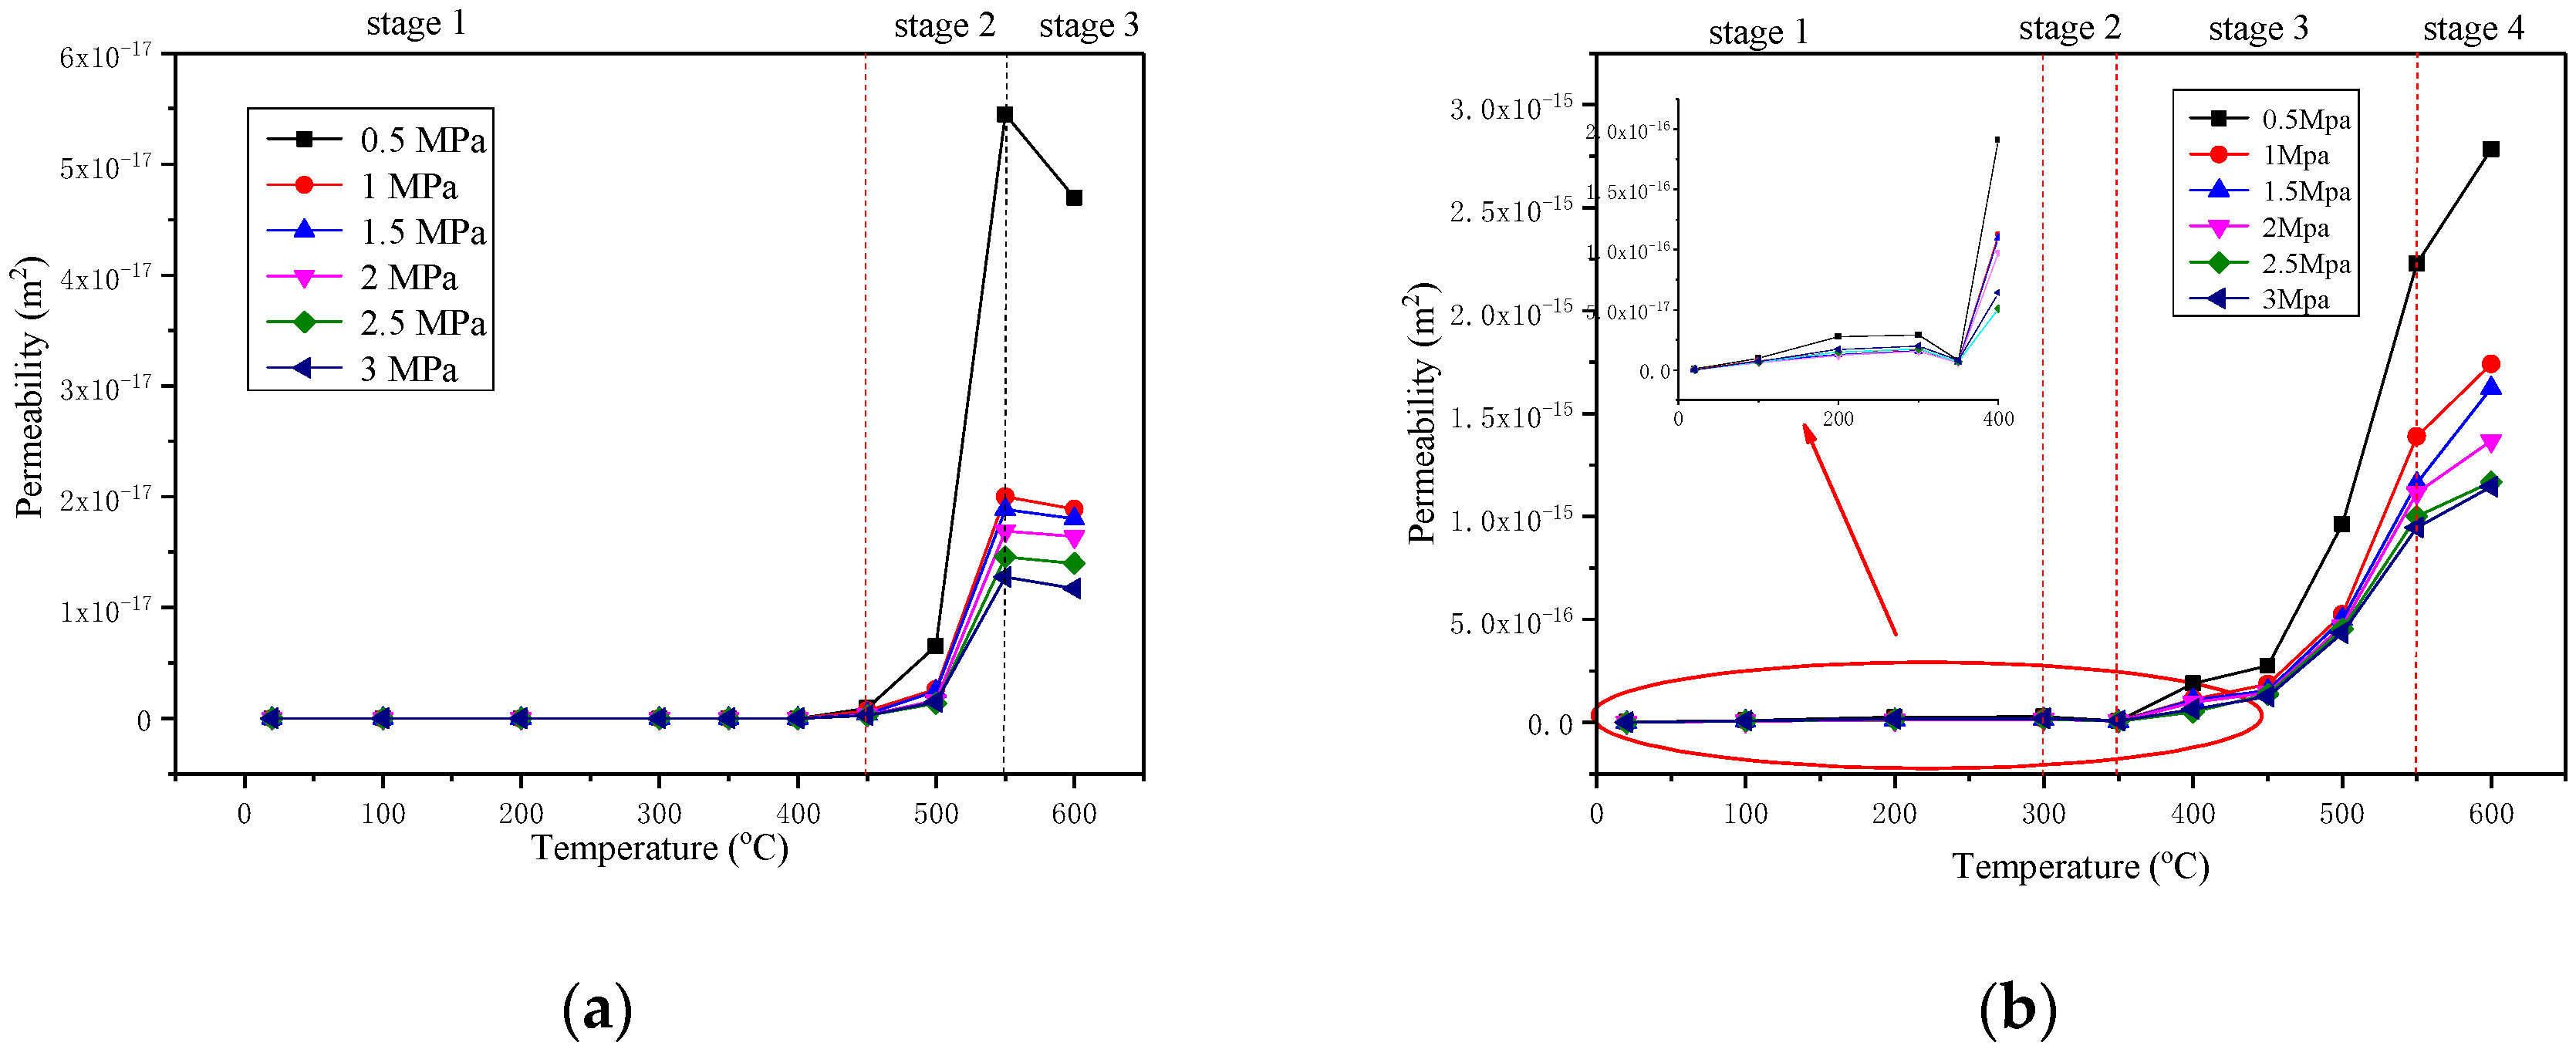
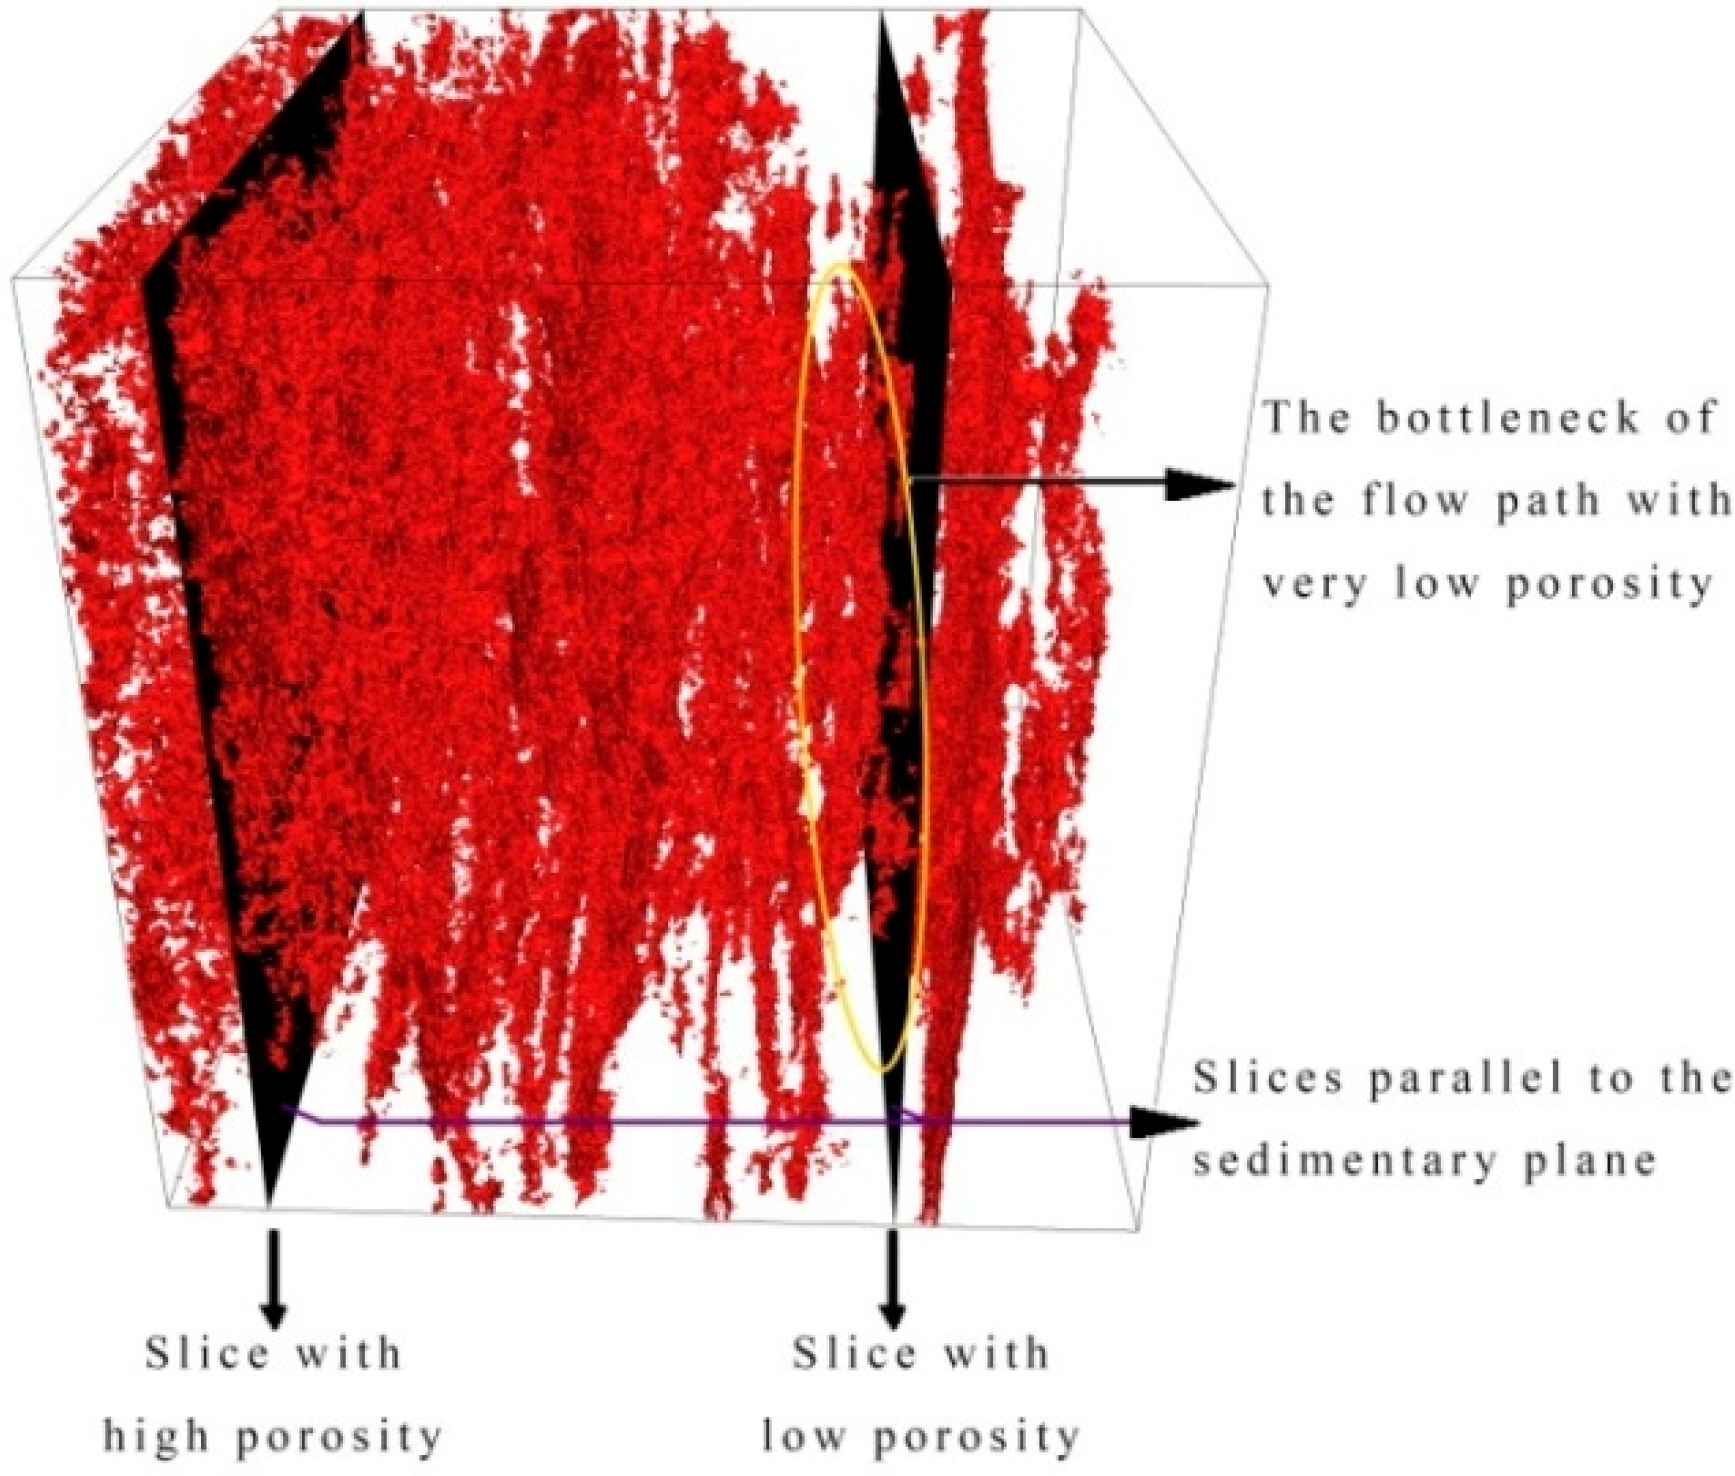
The results reported in [31] show that from room temperature to 600 °C, the permeability of the oil shale parallel to the sedimentary bedding direction was far higher than that perpendicular to the sedimentary bedding direction (Figure 12). Figure 11 shows that at all pyrolysis steam temperatures, there were positions with porosity below 5% in the direction parallel to the xoz plane. The size of the largest pore-fracture cluster sharply shrank at these positions with very low porosity (Figure 13), and they formed the bottleneck of the flow path, which made the permeability of the oil shale in the direction perpendicular to the sedimentary bedding far less than that in the direction parallel to the sedimentary bedding. From the analysis of Section 3.2, we know that in the low-temperature stage, although there were fractures parallel to the sedimentary bedding direction in the oil shale under the effect of temperature, the fractures were isolated from one another. These fractures did not contribute to the permeability perpendicular to the sedimentary bedding direction, but they would have increased the permeability parallel to the sedimentary bedding direction. With the increase in pyrolysis temperature, the pores that formed after kerogen pyrolysis connected with the adjacent fractures and made the isolated fractures connect with one another, which increased the permeability perpendicular to the sedimentary bedding direction.
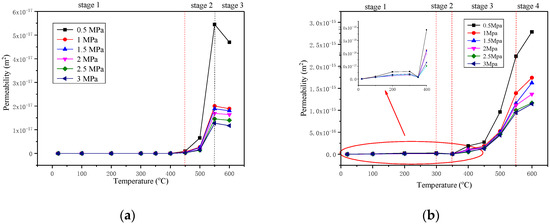
Figure 12.
Variation of permeability at different temperatures (Wang et al. [31]): (a) Variation of permeability perpendicular to the sedimentary bedding with temperature; (b) Variation of permeability parallel to the sedimentary bedding with temperature.
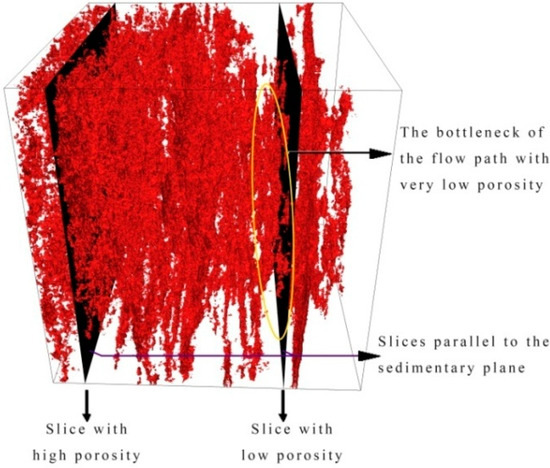
Figure 13.
Schematic image of the bottleneck of the flow path in oil shale perpendicular to the sedimentary bedding direction.
4. Conclusions
In this paper, the evolution and connectivity of the pores and fractures in the 3D digital core of oil shale after pyrolysis with superheated steam at different temperatures were studied. The conclusions are as follows.
After the pyrolysis by superheated steam, the pores and fractures inside the oil shale continuously developed and exhibited extreme anisotropy. In the direction parallel to the sedimentary bedding, when the steam temperature was higher than 314 °C, the fractures along the bedding direction were observed in the digital core of the oil shale and penetrated the entire DCOS. In the direction perpendicular to the sedimentary bedding, with the increase in steam temperature, the pores produced by kerogen pyrolysis in the oil shale connected with the adjacent fractures. Then, the pore-fracture clusters expanded in the direction perpendicular to the sedimentary bedding. However, the largest pore-fracture cluster only slowly expanded in the direction perpendicular to the sedimentary bedding. It was not until 555 °C that the largest pore-fracture cluster penetrated the entire DCOS in the direction perpendicular to the sedimentary bedding. In the microscopic scale of the oil shale studied in this paper (≥15 μm), from room temperature to 555 °C, there were always some positions with porosity below 5% in the direction perpendicular to the sedimentary bedding. The largest pore-fracture cluster sharply shrank in size at these positions with very low porosity and formed the bottleneck of the flow path, which made the permeability of the oil shale in the direction perpendicular to the sedimentary bedding far lower than that in the direction parallel to the sedimentary bedding. Overall, with heating using superheated steam, the pores and fractures in the oil shale are fully developed and have good connectivity, which provides an effective seepage channel for the injection of steam and the migration of oil and gas products.
Author Contributions
Conceptualization, D.Y. and X.H.; methodology, X.H.; software, X.H.; validation, X.H., D.Y. and Z.K.; formal analysis, X.H.; investigation, Z.K.; resources, D.Y.; data curation, D.Y.; writing—original draft preparation, X.H.; writing—review and editing, X.H.; visualization, X.H.; supervision, D.Y.; project administration, D.Y.; funding acquisition, D.Y. All authors have read and agreed to the published version of the manuscript.
Funding
This research was funded by the National Key Research and Development Program of China, grant number 2019YFA0705501 and 2019YFA0705502.
Acknowledgments
We would like to thank Lei Wang for his fruitful discussions during this research.
Conflicts of Interest
The authors declare no conflict of interest.
References
- Solum, M.S.; Mayne, C.L.; Orendt, A.M.; Pugmire, R.J.; Adams, J.; Fletcher, T.H. Characterization of macromolecular structure elements from a green river oil shale, I. Extracts. Energy Fuels 2014, 28, 453–465. [Google Scholar] [CrossRef]
- Jiang, X.M.; Han, X.X.; Cui, Z.G. New technology for the comprehensive utilization of Chinese oil shale resources. Energy 2007. [Google Scholar] [CrossRef]
- Dyni, J.R. Geology and resources of some world oil-shale deposits. Oil Shale 2003, 20, 193–465. [Google Scholar] [CrossRef]
- Wang, L.; Zhao, Y.; Yang, D.; Kang, Z.; Zhao, J. Effect of pyrolysis on oil shale using superheated steam: A case study on the Fushun oil shale, China. Fuel 2019, 253, 1490–1498. [Google Scholar] [CrossRef]
- Sun, Y.; Bai, F.; Liu, B.; Liu, Y.; Guo, M.; Guo, W.; Wang, Q.; Lü, X.; Yang, F.; Yang, Y. Characterization of the oil shale products derived via topochemical reaction method. Fuel 2014. [Google Scholar] [CrossRef]
- Sun, Y.; Kang, S.; Wang, S.; He, L.; Guo, W.; Li, Q.; Deng, S. Subcritical Water Extraction of Huadian Oil Shale at 300 °C. Energy Fuels 2019, 33, 2106–2114. [Google Scholar] [CrossRef]
- Handbook of alternative fuel technologies. Choice Rev. Online 2015. [CrossRef]
- Akob, D.M.; Mumford, A.C.; Orem, W.; Engle, M.A.; Klinges, J.G.; Kent, D.B.; Cozzarelli, I.M. Wastewater Disposal from Unconventional Oil and Gas Development Degrades Stream Quality at a West Virginia Injection Facility. Environ. Sci. Technol. 2016. [Google Scholar] [CrossRef] [PubMed]
- Hammad, M.; Zurigat, Y.; Khzai, S.; Hammad, Z.; Mobydeen, O. Fluidized bed combustion unit for oil shale. Energy Convers. Manag. 1998. [Google Scholar] [CrossRef]
- Soone, J.; Doilov, S. Sustainable utilization of oil shale resources and comparison of contemporary technologies used for oil shale processing. Oil Shale 2003. [Google Scholar] [CrossRef]
- Jaber, J.O.; Probert, S.D. Exploitation of Jordanian Oil-shales. Appl. Energy 1997. [Google Scholar] [CrossRef]
- Ryan, R.C.; Fowler, T.D.; Beer, G.L.; Nair, V. Shell’s in situ conversion process-from laboratory to field pilots. In Oil Shale: A Solution to the Liquid Fuel Dilemma; American Chemical Society: Washington, DC, USA, 2010; pp. 161–183. [Google Scholar]
- Symington, W.A.; Kaminsky, R.D.; Meurer, W.P.; Otten, G.A.; Thomas, M.M.; Yeakel, J.D. ExxonMobil’s ElectrofracTM process for in situ oil shale conversion. In ACS Symposium Series; ACS Publications: Washington, DC, USA, 2010. [Google Scholar]
- Zhao, J.; Yang, D.; Kang, Z.; Feng, Z. A micro-CT study of changes in the internal structure of Daqing and Yan’an oil shales at high temperatures. Oil Shale 2012, 29, 357–367. [Google Scholar] [CrossRef]
- Kang, Z.; Zhao, Y.; Yang, D. Review of oil shale in-situ conversion technology. Appl. Energy 2020, 269, 115121. [Google Scholar] [CrossRef]
- Wang, L.; Yang, D.; Li, X.; Zhao, J.; Wang, G.; Zhao, Y. Macro and meso characteristics of in-situ oil shale pyrolysis using superheated steam. Energies 2018, 11, 2297. [Google Scholar] [CrossRef]
- Saif, T.; Lin, Q.; Gao, Y.; Al-Khulaifi, Y.; Marone, F.; Hollis, D.; Blunt, M.J.; Bijeljic, B. 4D in situ synchrotron X-ray tomographic microscopy and laser-based heating study of oil shale pyrolysis. Appl. Energy 2019, 235, 1468–1475. [Google Scholar] [CrossRef]
- Saif, T.; Lin, Q.; Butcher, A.R.; Bijeljic, B.; Blunt, M.J. Multi-scale multi-dimensional microstructure imaging of oil shale pyrolysis using X-ray micro-tomography, automated ultra-high resolution SEM, MAPS Mineralogy and FIB-SEM. Appl. Energy 2017, 202, 628–647. [Google Scholar] [CrossRef]
- Saif, T.; Lin, Q.; Bijeljic, B.; Blunt, M.J. Microstructural imaging and characterization of oil shale before and after pyrolysis. Fuel 2017, 197, 562–574. [Google Scholar] [CrossRef]
- Saif, T.; Lin, Q.; Singh, K.; Bijeljic, B.; Blunt, M.J. Dynamic imaging of oil shale pyrolysis using synchrotron X-ray microtomography. Geophys. Res. Lett. 2016. [Google Scholar] [CrossRef]
- Zhao, J.; Hu, Q.; Liu, K.; Jin, Z.; Dultz, S.; Kaufmann, J.; Fan, Y. Pore connectivity characterization of shale using integrated wood’s metal impregnation, microscopy, tomography, tracer mapping and porosimetry. Fuel 2020. [Google Scholar] [CrossRef]
- Wu, J.; Yuan, Y.; Niu, S.; Wei, X.; Yang, J. Multiscale characterization of pore structure and connectivity of Wufeng-Longmaxi shale in Sichuan Basin, China. Mar. Pet. Geol. 2020. [Google Scholar] [CrossRef]
- Zhou, X.P.; Zhao, Z. Digital evaluation of nanoscale-pore shale fractal dimension with microstructural insights into shale permeability. J. Nat. Gas Sci. Eng. 2020. [Google Scholar] [CrossRef]
- Tiwari, P.; Deo, M.; Lin, C.L.; Miller, J.D. Characterization of oil shale pore structure before and after pyrolysis by using X-ray micro CT. Fuel 2013, 107, 547–554. [Google Scholar] [CrossRef]
- Tiwari, P.; Deo, M. Compositional and kinetic analysis of oil shale pyrolysis using TGA-MS. Fuel 2012. [Google Scholar] [CrossRef]
- Liu, X.; Lai, J.; Fan, X.; Shu, H.; Wang, G.; Ma, X.; Liu, M.; Guan, M.; Luo, Y. Insights in the pore structure, fluid mobility and oiliness in oil shales of Paleogene Funing Formation in Subei Basin, China. Mar. Pet. Geol. 2020. [Google Scholar] [CrossRef]
- Kang, Z.; Wang, W.; Zhao, Y.; Liang, W.; Yang, D.; Zhao, J.; Zhao, D. Three-dimensional percolation mechanism in oil shale under different temperatures based on micro-CT. Yanshilixue Yu Gongcheng Xuebao/Chinese. J. Rock Mech. Eng. 2014, 33, 1837–1842. [Google Scholar] [CrossRef]
- Stauffer, D.; Aharony, A. Introduction to Percolation Theory; CRC Press: Boca Raton, FL, USA, 2018. [Google Scholar]
- Wilson, K.G. The renormalization group: Critical phenomena and the Kondo problem. Rev. Mod. Phys. 1975, 47, 773. [Google Scholar] [CrossRef]
- Schaap, M.G. Percolation Theory for Flow in Porous Media. Soil Sci. Soc. Am. J. 2006. [Google Scholar] [CrossRef]
- Wang, G.; Yang, D.; Zhao, Y.; Kang, Z.; Zhao, J.; Huang, X. Experimental investigation on anisotropic permeability and its relationship with anisotropic thermal cracking of oil shale under high temperature and triaxial stress. Appl. Therm. Eng. 2019, 146, 718–725. [Google Scholar] [CrossRef]
Publisher’s Note: MDPI stays neutral with regard to jurisdictional claims in published maps and institutional affiliations. |
© 2020 by the authors. Licensee MDPI, Basel, Switzerland. This article is an open access article distributed under the terms and conditions of the Creative Commons Attribution (CC BY) license (http://creativecommons.org/licenses/by/4.0/).


