Article

Wave-to-Wire Model of an Oscillating-Water-Column Wave Energy Converter and Its Application to Mediterranean Energy Hot-Spots

1
Department of Industrial Engineering, Università degli Studi di Firenze, 50135 Florence, Italy
2
Department of Civil and Environmental Engineering, Università degli Studi di Firenze, 50135 Florence, Italy
*
Author to whom correspondence should be addressed.
Energies 2020, 13(21), 5582; https://doi.org/10.3390/en13215582
Submission received: 28 September 2020 / Revised: 19 October 2020 / Accepted: 21 October 2020 / Published: 26 October 2020
(This article belongs to the Special Issue Distributed Energy Production by Means of Renewable Resources)

Abstract

:
Oscillating water column (OWC) systems are among the most credited solutions for an effective conversion of the notable energy potential conveyed by sea waves. Despite a renewed interest, however, they are often still at a demonstration phase and additional research is required to reach industrial maturity. Within this framework, this study provides a wave-to-wire model for OWC systems based on an impulse air turbine. The model performs a comprehensive simulation of the system to estimate the attendant electric energy production for a specific sea state, based on analytical models of the primary (fixed chamber) and secondary (air turbine) converters coupled with the tertiary converter (electric generator). A rigid piston model is proposed to solve the hydrodynamics, thermodynamics, and hydrodynamics of the chamber, in a coupled fashion with the impulse turbine aerodynamics. This is solved with a novel method by considering the cascades as sets of blades, each one consisting of a finite number of airfoils stacked in the radial direction. The model was applied for two Mediterranean sites located in Tuscany and Sardinia (Italy), which were selected to define the optimal geometry of the turbine for a specified chamber. For each system, the developed analytical wave-to-wire model was applied to calculate the performance parameters and the annual energy production in environmental conditions typical of the Mediterranean Sea. The selected impulse turbines are able to convert 13.69 and 39.36 MWh/year, with an efficiency of 4.95% and 4.76%, respectively, thus proving the interesting prospects of the technology.

Graphical Abstract

1. Introduction

The global energy demand is constantly increasing and is still mainly supplied by fossil fuels, which are cost-effective but are strongly related to the well-known negative impact on the environment. At present, renewable energy sources are progressively gaining importance in the global energy scenario. Among them, wave energy has a huge unexploited potential [1,2]. The total wave power incident on the ocean-facing coastline of the world is estimated to be around 0.5 and 2.2 TW [3,4]. Despite this massive amount of energy transported by sea waves, its harvesting remains a technological challenge. The main obstacles to the growth of the wave energy conversion sector have been identified as the uncertainties on the device performance and reliability owed to the early development stage [5], the uncompetitive levelized cost of energy (LCOE) of technologies for wave harvesting [6,7], and the uncertainties on the environmental impacts of the wave farms [8,9].
The development of technologies for the exploitation of wave energy can be fostered by the design of reliable and resilient wave energy converters (WECs) with affordable and competitive construction, operational, and maintenance costs. Moreover, these systems should be designed to convert the maximum amount of energy for a specific location. To achieve this objective, fast predictive analytical models of the system performance are required to carry out the early-stage design optimization for determining the most suitable configuration of the system for a specific wave climate. Subsequently, more advanced evaluations of the system operation can be performed with computational fluid dynamics (CFD) and experiments. These models should be able to simulate all the different stages of the wave energy conversion chain that characterize the specific WEC.
A wide variety of wave energy converters have been proposed so far [10]. In this study, attention is given to oscillating water column (OWC) systems, which are the most widely studied, exhibiting consolidated and diffused concepts due to their structural simplicity and reliability conferred by the absence of mechanical parts moving under the water. In its traditional configuration, an oscillating water column system is composed of a hollow chamber, partially submerged, and a power take-off (PTO), consisting of an air turbine and an electrical generator. The chamber is equipped with two openings, one subject to the incident wave motion and crossed by the water below the still water level (SWL) and one placed above this level, crossed by the air. The wave-induced motion of the inner water column alternatively expands and compresses an upstanding air volume, driving a bidirectional airflow through an air turbine, which is in turn connected to an electrical generator. The air turbines used in OWC systems are generally of self-rectifying type [11]. Otherwise, the bidirectional airflow can be rectified by using non-return air valves. The effectiveness of the latter approach was proved for small-size devices, such as navigation buoys [12], but it is considered unpractical for larger devices.
In the present work, a wave-to-wire analytical model of a stationary OWC system was developed. The primary converter, represented by the chamber, is coupled with the secondary converter, represented by the self-rectifying air turbine, and the electric generator. The model is a comprehensive, fast, and reliable engineering tool for the prediction of the energy extraction by an OWC system, allowing for the joint design of the chamber and the air turbine for the specific wave conditions of a selected installation site. The model was applied to determine the optimal geometry and operational conditions of an impulse turbine for a specific chamber and two specific wave energy hot-spots in the Mediterranean Sea. The operating curves and the performance parameters of the optimal configurations are shown for the selected wave conditions.
In the remainder of this introduction section, a brief overview on the state of the art on the OWC device and air turbines (Section 1.1) and a literature review of the existing wave-to-wire models for OWC systems (Section 1.2) are provided.

1.1. OWC Chamber and Impulse Turbine Overview

The oscillating water column system is one of the few technologies currently tested at the prototype scale in real environmental conditions. The first important application of an OWC system dates to 1970 when several navigation buoys powered by wave energy were installed in Japan [12]. The first OWC plant similar to the current ones was a shore-fixed system with a tandem Wells turbine rated at 40 kW and built on a shoreline gully in Sanze, in Japan, where it operated for about six months [13]. Since that time, several study cases were realized worldwide with various rated power outputs and different turbine designs, even though the Wells turbine has been by far the most often applied due to its simplicity and reliability. Explanations on the development and the working principles of this technology are presented in literature reviews regarding the chambers and air turbines for OWC systems [14,15,16,17,18].
Despite the relatively large experience gathered through the operation of prototypes in real conditions, research at a fundamental level is still needed. In particular, the joint optimization of the primary and secondary converters is a key aspect for the selection of the correct configuration of the entire system for a specific wave climate.
Concerning the primary converter, laboratory tests on small-scale models [19,20,21,22] and analytical and numerical studies were extensively performed. The earlier studies on the OWC systems rely on the potential flow theory, under which the dynamics of the oscillating column is schematized, either with the rigid piston [23,24,25] or the uniform pressure distribution approximations [26]. In these modeling approaches, the OWC hydrodynamic coefficients are analytically [27,28], numerically [29,30], or experimentally [31,32] determined. Recently, models based on CFD are experiencing a great expansion for analyzing the interaction between incident waves and OWC structures, including the nonlinear and viscous effects [33,34,35,36,37,38]. The aforementioned modeling approaches were applied to study the effect of different design parameters of the primary conversion efficiency.
Regarding the air turbine, Wells and impulse turbines are the most widespread technologies applied to OWC systems, with the former being used in the first prototypes due to its simplicity and the latter being recently favorably reconsidered due to the wider operating range and lower acoustic emissions. Many analyses of the aerodynamics were performed by applying analytical or CFD models and with laboratory and real field experiments. Generally, the duct comprising the turbine was considered for the optimization of the secondary converter itself and the airflow conditions at the turbine inlet were applied based on conventional literature results [39]. In order to further investigate the airflow field, the motion of the air volume in the system chamber was in some cases modeled with a sinusoidal function [40].
Focusing on bidirectional axial flow impulse turbines, which are the subject of the present study, the first application of this kind of turbine in an OWC device was in the center pipe buoy designed by Masuda in 1947 and installed in the Bay of Osaka, in Japan, as a floating navigation aid [12]. In 1988, Kim et al. suggested the application of an impulse turbine as a self-rectifying machine for OWC systems [41]. In 1999, Maeda et al. performed experiments to determine the optimal geometry of the stators and rotor, with a particular focus on the angle of incidence of the flow impacting the rotor [42]. In 2001, Setoguchi et al. reviewed the state of the art of impulse air turbines for OWC systems and presented the optimal design parameters and their effects on the performance and the self-starting characteristics [43]. In 2004, the study was extended to the impact of the Reynolds number and the hub to tip ratio [40]. More recently, in 2014, Cui and Liu performed CFD analyses to determine the effects of the rotor solidity, considered in terms of the ratio between the number of stator and rotor blades, on the turbine performance [44]. In 2015, Badhurshah and Samad carried out CFD analyses coupled with a multiple-surrogate-assisted genetic algorithm based on a multi-objective optimization to improve the energy extraction of an axial impulse turbine [45]. In 2017, Ezhilsabareesh et al. proposed a shape optimization procedure based on CFD and a multiple-surrogate algorithm with a multi-objective function [46]. In 2018, Badhurshah et al. performed an optimization procedure to determine the number of rotor blades and guide vanes, guide vane angles, and guide vane profile to maximize the turbine efficiency [39]. In 2020, Ciappi et al. developed an analytical model that couples the hydrodynamics, thermodynamics, and aerodynamics of the chamber with the aerodynamics of the air turbine; the operating curves and the performance of two OWC systems embedding a Wells and an impulse turbine were investigated and compared [47].
Efforts towards the development of coupled hydro-aerodynamic models of the OWC system were also done by coupling a CFD model of the chamber with simplified correlations that express the main performance parameters of a Wells turbine [48]. However, CFD analyses require relevant computational resources, while introducing a degree of uncertainty due to the potential errors and discrepancies in the simulation of complex flows. The uncertainties are mostly related to the prediction of flow separation [49], recirculation zones [50], and sharp discontinuities [51]. Therefore, the use of CFD in the design optimization may lead to suboptimal solutions that could lack of reliability [52,53].
Overall, upon examination of the research activities performed over the last few years, it is apparent that, in most of the cases, the analyses for the optimization of the primary and the secondary converters were carried out separately by different research groups. However, a holistic approach is needed, going into the direction of a combined optimization of the converters for specific wave conditions. Indeed, the optimal damping for the OWC chamber depends on its geometry and the local characteristics of the incident wave and, in turn, the performance of the air turbine depends on the pressure difference made available by the chamber [11,35,38,48]. For these reasons, analytical wave-to-wire models are the most suited solution for the primary design of OWC wave energy converters, allowing for investigation of a wide variety of design solutions with the need of reduced computational power and time.

1.2. OWC Wave-to-Wire Literature Review

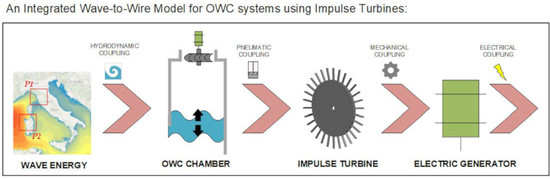
The power conversion chain of an OWC system is composed of several stages, starting with the periodic harvesting of the power transported by the sea waves and ending with the transfer of electrical power to the grid. The models that investigate the entire conversion chain are referred to as wave-to-wire models. In these models, four main stages are considered: absorption, transmission, generation, and conditioning. During the absorption stage, the wave motion is transformed into oscillating pneumatic power inside the OWC chamber. Throughout the transmission stage, this power is converted into mechanical power with an air turbine. In the generation stage, the electric generator, connected with mechanical transmission to the turbine and subject to a control strategy, converts the mechanical power into electrical power. Finally, during the conditioning stage, the electric power is adjusted to be delivered into the grid. These stages involve the analysis of the hydrodynamics, thermodynamics, and aerodynamics of the chamber, the aerodynamics of the turbine, and the rotor dynamics of the turbine and the electric generator.
Several wave-to-wire models for OWC systems have been presented in the literature. Typically, these models focus on the analysis of the chamber or the electric generator, while the level of detail regarding the turbine is limited to the use of simplified correlations expressing the mass flow rate, the pressure variation, the power, and the efficiency. This, in turn, represents the key point of the novelty of the present study, where a more refined analytical model of the turbine is included within the wave-to-wire chain. In fact, the proposed approach allows the direct solution of the aerodynamics of the impulse turbine, achieving a higher accuracy in the determination of the turbine operation, and consequently of the overall system energy conversion dependent on the specific oncoming waves.
Literature reviews regarding wave-to-wire models for OWC systems were published by Nielsen et al. in 2014 [54], Faÿ et al. in 2015 [55], Falcão and Henriques [18], Penalba and Ringwood in 2016 [56], Wang et al. in 2018 [57], and Maria-Arenas et al. in 2019 [58]. In particular, Nielsen et al. summarized the existing technologies for energy conversion from waves to wire for different typologies of wave energy converters. Faÿ et al. presented key aspects of the control strategies for OWC systems to improve energy extraction and power quality. Falcão and Henriques published a detailed review of the development of the technologies for OWC systems. Three different control logics were considered: the reactive phase control, the phase control by latching, and the turbine rotational speed control with airflow rate control. Penalba and Ringwood presented a review of the components of wave-to-wire models, including the dynamics, the constraints, and several examples of linear electric generators and pneumatic, hydraulic, mechanical, or magnetic transmission systems driving rotary electrical generators. Wang et al. considered the control strategies for enhancing the hydrodynamics of the primary capture system, adjusting the speed or the efficiency of the power take-off and regulating the electric power fed into the grid or supplied to the load. Maria-Arenas et al. focused on the damping, reactive, latching, and model predictive control strategies applied to different typologies of wave energy converters. The main contributions to the development of wave-to-wire models are briefly described below, while further details and other articles can be found in the literature [18,54,55,56,57,58].
In 1999, Falcão and Justino developed an analytical model to simulate the power transformation from the sea waves to the turbine shaft of an OWC system consisting of a bottom-fixed floating chamber, a Wells turbine, and a valve to control the airflow. The utilization of a valve mounted in parallel with the turbine, named by-pass or relief valve, and of a valve installed in the turbine duct was considered and compared. This control approach allows increased energy exploitation, in particular for turbines drastically affected by rotor stalling, such as Wells turbines [26].
In 2011, Amundarain et al. investigated two control strategies based on the rotational speed and air valve regulation for an electric generator connected to a Wells turbine in an OWC system. The purposes were to control the stalling behavior of the mechanical converter and increase the average power output of the generator. Both the strategies raise and smooth the electric power in complementarity: the rotational speed control strategy increases the maximum pressure drop across the turbine rotor, avoiding the stall and delivering the maximum power to the grid, while the valve control strategy regulates the airflow and the pressure drop across the turbine to control the delivered power according to the grid demand [59].
In 2013, Henriques et al. presented an analytical model of the phase control by latching of an axisymmetric OWC spar-buoy equipped with a biradial turbine and operating in regular wave conditions. The compressibility effects of the air inside the chamber on the fast opening and closing of the air valve in series with the turbine and on the energy conversion were assessed [60]. The following year, the analysis was extended to irregular waves and two alternative strategies for the latching and unlatching were comparatively considered [61]. Subsequently, Portillo et al. performed analytical and experimental studies of the latching control combined with the control of the turbine rotational speed under regular and irregular waves [62].
In 2015, Kelly et al. presented an analytical wave-to-wire model of a backward bent duct buoy OWC system operating with an impulse turbine. The hydrodynamics, thermodynamics, and aerodynamics of the chamber were thoroughly analyzed and calibrated with experiments. To solve the aerodynamics of the impulse turbine, global correlations were applied. The rotor torque was coupled with the frictional losses, the rotor inertia, and the electrical torque to determine the variation of the turbine rotational speed [63].
In 2015 and 2016, Song and Park analyzed the parameters that optimize the operation of an OWC system composed by a fixed chamber, an impulse turbine and an ideal direct current generator, focusing on two control strategies in the time domain and under an irregular wave environment. Instant tracking control of the maximum turbine efficiency and constant control of the angular velocity of the turbine rotor were investigated [64,65].
In 2016, Henriques et al. presented an analytical model of power take-off control for a spar-buoy OWC system operating with an impulse biradial turbine. Experimental analyses were carried out to simulate two control configurations based on a high-speed stop valve positioned in series with the turbine and a relief valve mounted in parallel to the turbine. Both the configurations were beneficial to the control of the rotational speed, but only the latter was even able to prevent the negative and positive peaks in the air pressure [66]. On the same test rig, Henriques et al. investigated a real-time latching control strategy based on the prediction of the wave motion to increase the turbine power output [67]. Subsequently, the test rig was utilized to validate a constrained latching control algorithm relying on a sliding high-speed stop valve in series with the turbine to boost the generator load and to limit the power peaks [68].
Bailey et al. presented a numerical wave-to-wire model for a moored floating OWC system of backward bent duct buoy type, embedded with an impulse turbine. The hydrodynamics and aerodynamics of the chamber were modeled in detail and coupled with global correlations expressing the airflow rate, the pressure variation, the power, and the efficiency of the turbine. A control strategy was applied to optimize the annual energy conversion in a large variety of sea states representative of the West Coast of Canada [69].
In 2018, Suchithra et al. investigated the energy conversion process of an OWC system using a wave-to-wire model under regular and irregular waves for different sea climates. An analytical model of the chamber was used to determine its hydrodynamics, thermodynamics, and aerodynamics, while the interaction of a Wells turbine with the system was approximated with an equivalent pressure drop imposed by a calibrated opening, and global correlations were applied to determine the operating parameters [25].
In 2019, Henriques et al. presented wave-to-wire models to analyze the dynamics and the control of air turbines and electric generators for the OWC plant installed in the breakwater of the Bay of Biscay, located in Mutriku, in Spain [70]. The performance of a Wells and a biradial turbine were determined and compared. The impact of control strategies on the power and the efficiency of the turbine and the pneumatic and electrical power was assessed.
Faÿ et al. developed six algorithms to control the biradial turbine designed for the OWC plant of Mutriku. A wave-to-wire model was proposed for one chamber of the plant and the effects of the control strategies on the energy conversion and power output quality and reliability were evaluated in irregular sea states. A set of adaptive and predictive algorithms was considered and both turbine speed controllers and latching strategies were analyzed and validated utilizing an electrical test infrastructure [71].
Benreguig et al. developed wave-to-wire models of two OWC systems using the same floating spar-buoy structure and embedded with a radial-inflow turbine with twin-rotor configuration or the Tupperwave turbine. The Tupperwave operation is based on two large accumulator chambers of fixed volume with non-return valves to generate a unidirectional airflow that drives a unidirectional turbine in a closed-circuit. The instantaneous efficiency of the turbine was maximized by adapting the braking torque of the electric generator to the mechanical turbine torque of the rotor expected at the maximum efficiency. A bypass valve, positioned in parallel to the turbine, was utilized to avoid the overload of the generator [72].

1.3. Contribution of the Study

Upon examination of the current status of the technology, reported in Section 1.1 and Section 1.2, it is noticeable that OWC systems still need to undergo a real industrial development process prior to becoming a consolidated technology for energy conversion from the sea. This is mainly due to the still very high levelized cost of energy, which in turn is connected to the high capital cost of the system. Indeed, relevant infrastructures need to be built and the yearly production of energy is limited for most sea climates. On the economic side, these issues can be tackled by promoting the diffusion of OWC systems in combination with the existing structures as breakwaters in harbors, developing new solutions like preassembled offshore floating platforms (possibly dedicated to the production and storage of energy), and by fostering the industrial standardization of specific components as the secondary converters. On the other hand, improving the energy conversion efficiency is a key issue to make this technology competitive.
In this view, the development of fast and reliable integrated wave-to-wire tools for the analysis and design of OWC systems, like the approach presented in the study, is of capital relevance for the competitiveness of the OWC technology. The proposed model allows the joint selection of the primary and secondary converters for a specific location already from the very beginning of the design process. In particular, during the preliminary phase of the design, the reduced computational time and power required by the model enable the investigation of a wide variety of configurations. This approach is key for maximizing the overall performance of the system, as the two converters are intrinsically connected by the fluid dynamics of the flowing air, which in turn depends on the specific sea climate of the application site.
A possible further development of the model can be in support of in situ OWC control strategies. In principle, considering that the incident wave conditions can be efficiently forecasted, days in advance, the availability of a tool, able to rapidly select the best OWC setting for maximizing the harvested energy, is of certain importance. In this respect, as proved in the present article, the regulation of the rotational speed of the turbine can be a strategy for increasing the energy conversion.

2. Methodology

An analytical wave-to-wire model of an OWC wave energy converter was developed by coupling the three converters comprising the system: the chamber, the turbine, and the electric generator. The model was applied to evaluate the energy harvested by various configurations of the impulse turbine in two selected sites, characterized by wave conditions typical of the Mediterranean Sea.

2.1. Pneumatic (Primary) Converter Model

The analytical model for the OWC chamber is based on the well-established concept of the so-called rigid piston model [23,24,25,73,74]. The model applies the linear wave theory and relies on the hypotheses of incompressible and irrotational flow. Although proven to be sufficiently predictive, the rigid piston schematization may determine approximated calculations of the pressure distributions on the inner free surface of the device; however, this phenomenon would have significant effects on the results only when the diameter of the chamber is comparable with the incident sea wavelength. Since the dimensions of the OWC chamber of the present applications are small compared to the incident wavelength λ, the use of the rigid piston model can be considered appropriate. The chamber is assumed to be detached and fixed regarding the sea bottom and it is subject to the action of unidirectional waves moving in seawater of constant depth. Therefore, the only possible motion mode is the heave oscillation of the water column internal to the system [47].

2.1.1. Rigid Piston Model

In the rigid piston model, the oscillating water column is schematized as a rigid piston and the force balance on the internal volume of water is expressed in Equation (1) through the application in the vertical direction of Newton’s second law.
m w z ¨ + B z ˙ + Cz = f exc + f add + f pto
where mw is the mass of the water column, z is the level of the free surface relative to the still water level (positive when above the SWL), C is the hydrostatic restoring coefficient, B is the damping coefficient, fexc is the excitation force due to the hydrodynamic pressure exerted by the incident wave on the bottom of the water column, fadd is the added mass force, and fpto is the force determined by the air pressure oscillation inside the chamber. The values of mw, B, and C can be calculated from Equations (2)–(4), respectively, by considering the damping coefficient as a function of the inertial properties of the system and the hydrostatic restoring coefficient [25,73,75].
m w = ρ w A c ( D + z )
B = 0.2 C ( m w + m add )
C = ρ w gA c
where ρw is the seawater density, Ac the area of the horizontal cross-section of the chamber, D the draught of the chamber, madd the added mass in the vertical direction, and g the gravitational acceleration. The added mass madd is determined based on free decay tests that were previously performed, as shown in Section 2.2.
Within the linear wave theory, the water surface displacement of a sea wave ηw can be written through Equation (5) as a sinusoidal function.
η w = H 2 cos ( kx ω t )
where H is the wave height, x the axial position, t the time, ω the wave angular frequency, and k the wavenumber, calculated by solving the dispersion relation ω2 = kgtanh(kh) for the specific seawater depth h.
The dynamic pressure pw decreases with the depth along the vertical direction, as expressed through Equation (6).
p w = η w ρ w g cosh ( k ( h + z ) ) cosh ( kh )
Under the hypothesis of small dimensions of the device compared to the incident wavelength, the diffraction effects of the sea wave can be neglected. Therefore, the wave excitation force acting on a seawater level equivalent to the front wall draught D of the chamber may be written as in Equation (7).
f exc = η w A c ρ w g cosh ( k ( h D ) ) cosh ( kh )
The added mass force fadd exerted on the water column by the added mass is determined through Equation (8) as a function of the acceleration υ ˙ z , w z ¨ of the water particles relative to the water column in the vertical direction.
f add = m add ( υ ˙ z , w z ¨ )
The force fpto, due to the pressurization and depressurization of the air chamber, can be calculated with Equation (9).
f pto = A c p c
where pc is the instantaneous value of the difference in air pressure between the chamber and the atmosphere. Finally, the equation of motion of the water column is expressed by Equation (10).
m w z ¨ + B z ˙ + A c ρ w gz = η w A c ρ w g cosh ( k ( h D ) ) cosh ( kh ) + m add ( υ ˙ z , w η ¨ w ) A c p c
The air inside the chamber is modeled as an ideal gas and its alternate compression and expansion are assumed as adiabatic and isentropic processes [18]. The mass flow rate of the air across the turbine is given by Equation (11) and has a positive sign for outward flows.
m ˙ = d ( ρ a V ) dt
where ρa is the air density and V the air volume inside the chamber. Under these hypotheses, the relation between the air mass flow rate and the pressure oscillation of the chamber can be expressed through Equation (12).
m ˙ = A c ρ a z ˙ V 1 s 2 dp c dt = ρ a q ˙ ( V 0 + A c z ) 1 s 2 dp c dt
where s is the speed of sound in the air, q ˙ the volume airflow rate, and V0 the chamber volume in unperturbed conditions.
Under the assumption of small values of the volume Acz regarding the volume V0, the contribution of this term becomes negligible and the linear relation of Equation (13) can be obtained.
m ˙ = ρ a q ˙ V 0 1 s 2 dp c dt

2.1.2. Added Mass Determination with Free Decay Tests

The added mass of the OWC chamber is obtained from free decay laboratory tests previously performed on a fixed, bottom detached OWC model in a 1:50 scale with prismatic shape (Figure 1). The tests were performed at the LABIMA, the Maritime Engineering Laboratory of the University of Florence [22].
As a first approximation, the added mass was assumed as frequency-independent [25]. The tests were performed by imposing an initial higher water level to the inner free surface of the model and sampling the resulting free surface oscillation, as noticeable in Figure 2.
From the decay response of the damped oscillating system, the logarithmic decrement ς can be determined through Equation (14).
ς = ln 1 n ( χ ( t 0 ) χ ( t n ) )
where n is the number of peaks considered and χ(t0) and χ(tn) are the surface displacements at the first and the last peak, respectively.
The damping ratio ζ can be determined by the logarithmic decrement as in Equation (15).
ζ = ς ( 2 π ) 2 + ς 2
The damped natural period Tdn,owc is determined as the average time elapsed between consecutive peaks in the signal, with associated damped natural frequency ωdn = 2π/Tdn,owc. The undamped natural frequency ωun is expressed through Equation (16).
ω un = ω dn 1 ζ 2
The undamped natural period of the chamber Tun,owc, is consequently obtained as Tun,owc = 2π/ωun. From the undamped natural frequency, the added mass is estimated as in [31,76].
m add = ρ a gA c ω un 2 m 0
where m0 is the initial value of the water mass.
The geometry of the OWC chamber, considered for determining madd, is the one associated with the tested model that showed higher primary efficiency of about 73% as obtained in the laboratory tests [22]. The OWC chamber geometrical parameters that maximize the primary efficiency for waves with fixed significant wave height of 2 m and energy period of 7 s are listed in Table 1. The model was tested in a water depth of 0.5 m and its PTO was simulated by using a calibrated circular vent tube, located on the top cover of the chamber, with diameter 0.03 m and length 0.1 m.

2.2. Mechanical (Secondary) Converter Model

An analytical model of an impulse turbine operating with the bidirectional airflow converted by the chamber from the sea waves was developed within this study. The literature on this topic is indeed still scarce, also due to the complex aerodynamics of this type of machine. However, a fast and sufficiently reliable tool for the simulation of impulse turbines as the secondary converter in OWC systems is key to allow more significant energy estimations for the technology. To this end, the solution of the aerodynamics of the impulse turbine with the proposed method is achieved using an analogy with the consolidated analytical approach in turbomachinery. The turbine cascades are modeled as sets of blades, formed by a finite number of airfoils stacked in the radial direction.

2.2.1. Impulse Turbine Model

An impulse turbine for oscillating water column systems is generally composed of one rotor row and two stator rows. The stators are positioned on the opposite sides of the rotor and in turn act as inlet guide vane (IGV) or outlet guide vane (OGV), depending on the direction of the airflow during each flow phase. The axial flow at the turbine inlet is deflected and accelerated by the IGV and, after the interaction with the rotor blade, it is further decelerated and straightened by the OGV (Figure 3). The role of stators is to control the angle of the flow impacting the rotor to minimize the aerodynamic losses and to avoid the onset of aerodynamic stall due to the separation of the boundary layer (Figure 4).
Since the turbine operates in bidirectional flow conditions, the cascades need to have either a symmetric or an adjustable geometry. Therefore, the IGV is an accelerating row and the OGV is a diffusive row.
The proposed analytical model is based on the application to the present case of the experimental correlations that are widely used for the design of axial turbomachines, in accordance with the similarities between these applications. A single blade is considered as a finite number of airfoils stacked in the radial direction. Each airfoil has its distinctive geometry and is subject to specific flow conditions [47].
The procedure starts with the definition of the geometry of both the rotor and stator rows in terms of blade number and profile shape. Then, an iterative procedure for calculating the flow angles and the chord length of the blades is performed by means of the Zweifel criterion and the Carter and Hughes criterion, based on the uniform and axial airflow at the turbine inlet [77].
The Zweifel’s criterion of Equation (18) defines as 0.8 the optimal ratio between the real and ideal blade loading in order to minimize the aerodynamic losses.
Γ i Γ id , i = 2 ȶ i l x , i cos 2 α 2 , i ( tan α 1 , i + tan α 2 , i ) = 0.8
where Γ is the real blade loading, Γid the ideal blade loading, ȶ the pitch, lx the length of the axial chord, α the absolute flow angle, and the subscripts 1, 2, and i refer to the cascade inlet and outlet and the generic blade element, respectively.
The criterion of Carter and Hughes applies Equation (19) to determine the flow deviation across a cascade, based on its geometry.
δ i = M CH , i Θ i ȶ i l i
where δ is the flow deviation, MCH is a coefficient function of the stagger angle, l is the chord length, and Θ is the camber angle, which is the change in angle between the leading and trailing edges (Figure 3).
The first step of the iterative procedure is the application of the Zweifel’s criterion to initialize the values of the chord length of the cascades based on their geometric angles. Subsequently, the criterion of Carter and Hughes is used to calculate the flow deviation across the cascades and the criterion of Zweifel to determine the chord length of the rows. The convergence criterion of the iterative procedure is set to 10−3 for the chord length.
After the determination of the velocity triangles upstream and downstream from the inlet guide vane and the rotor cascade, an iterative procedure is applied to calculate the flow deviation downstream of the outlet guide vane to define the velocity triangle at the turbine outlet. In this case, dealing with a diffusing cascade, the empirical rule formulated by Howell in Equation (20) is used to estimate the nominal deviation of the flow from the camber angle and pitch to chord ratio [77].
δ i * = M HW , i Θ i ( ȶ i l i ) 1 2
where δ* is the nominal flow deviation and MHW is a coefficient that depends upon the shape of the camber line and the blade setting. The calculations are iterated until the convergence criterion of 10−3 is reached for the outlet flow angle.
The power PƬ transferred by the flow to the turbine is determined by integrating the contribution of each blade element along the span, obtained with Euler’s theorem for turbomachinery of Equation (21), which relates the specific work to the velocity triangles of the rotor row.
P Τ , i = ρ a , i A Τ , i v x , i U i ( v θ 2 , i + v θ 3 , i )
where AΤ is the area of the turbine annulus, v the absolute velocity, U the blade velocity, the subscripts x and ϑ refer, respectively, to the axial and circumferential components of the velocity vectors, and the subscripts 2 and 3 indicate the inlet and outlet sections of the rotor, respectively.
The correlation of Ainley and Mathieson is applied for the evaluation of the aerodynamic losses of the inlet guide vane and the rotor cascade [77]. It relies on experimental data from the test on axial turbomachines in gas and steam applications and is widely used if the Mach number is lower than 0.6 as in the present case. In the general formulation of Equation (22), the global losses of the cascade YAM are determined by the contributions of the profile losses Ypr, the secondary losses Yse, the tip leakage losses Ytc, and the trailing edge losses Yte.
Y AM = [ ( Y pr + Y se ) cf + Y tc ] Y te
where cf is a correction factor that is a function of the Reynolds number.
For the evaluation of the aerodynamic losses of the outlet guide vane, the correlation of Howell is used [77]. It was obtained from experimental data measured on diffusive profiles of compressors. The correlation subdivides the cascade losses in profile losses on the blade surfaces, skin friction losses on the annulus walls, and secondary losses for the contributions not included in the previous two. The estimation of the losses of Equation (23) is based on an equivalent overall drag coefficient CD,HW given by the sum of the effects of the profile, skin friction, and secondary drag coefficients (CD,pr, CD,sf, and CD,se respectively).
C D , HW = C D , pr + C D , sf + C D , se
The equivalent overall drag coefficient is utilized to determine the pressure losses across the outlet guide vane. By summing these losses and the pressure losses across the inlet guide vane and rotor row determined through the correlation of Ainley and Mathieson, the pressure losses of the turbine are finally calculated [77].

2.2.2. Literature Validation and Comparison

The analytical model of the impulse turbine developed was validated through the comparison with literature experimental data obtained for a model at a laboratory scale [40]. The scarcity of reliable experimental data at a larger scale for these devices is indeed a problem to carry out proper validations of simulation approaches, as some of the losses are altered by additional effects that are not directly scalable, such as the geometrical accuracy of small blades, the surface roughness, and the blade gap in comparison to the span. However, experimental data are key to understanding if models are at least able to correctly capture the physics of the problem.
Figure 5 reports the comparison between the literature experimental data and the predictions of the analytical model developed for the same impulse turbine. To improve the readability of the comparison, the dependent parameters are made nondimensional by dividing them by their maximum value. The parameters are the flow coefficient φ, the input coefficient CA, the torque coefficient CT, and the turbine efficiency ξΤ, which are defined in Equations (24)–(27), respectively.
φ m = v x , m U m
C A , m = ( p ƭ 1 p 4 ) q ˙ 1 2 ρ a ( v x , m 2 + U m 2 ) blZv x , m
C T , m = τ 1 2 ρ a ( v x , m 2 + U m 2 ) b l Z r m
ξ Τ = Ω τ ( p ƭ 1 p 4 ) q ˙ = C T , m φ C A , m
where vx is the axial component of the air velocity, pƭ1 is the total pressure at the turbine inlet, p4 is the static pressure at the turbine outlet, b is the blade height, Z is the blade number, r is the blade radius, Ω is the turbine rotational speed, and the subscript m refers to the blade midspan.
Upon examination of the results, it is noticeable that all the curves of the analytical model and the literature experimental model have a similar trend. In Figure 5a, the analytical model underestimates the input coefficient for all the values of the flow coefficient, due to a lower total-to-static pressure drop across the turbine. In Figure 5b, the slight discrepancies between the two models can be addressed to the underestimation by the analytical model of the torque exerted by the airflow on the rotor, as a result of the flow angle variation across the rotor cascade. In Figure 5c, it is visible that the two curves of efficiency are similar, as a consequence of the predictions of the pressure drop and the torque. However, the results are considered very promising within the limitations discussed above.

2.3. Electric (Tertiary) Converter Model

The model of the OWC system includes the coupling of the turbine aerodynamics and the electric generator dynamics, as the system operation depends on the interaction of the secondary and tertiary converters, as well as the primary converter, represented by the chamber.
The mechanical torque produced by the impulse turbine is transmitted to the electric motor by a mechanical coupling at the shaft. Since a simplified control system was implemented, this aspect was modeled by neglecting the aerodynamic friction torque caused by the wind losses. Thus, the relation can be expressed through Equation (28).
J Ω ˙ = τ Τ τ g
where J is the rotational inertia of the rotor, Ω ˙ the rotor angular acceleration, and τ Τ and τ g the torque of the turbine and the generator, respectively.
The control system implemented is based on monitoring the instantaneous values of the turbine torque and the rotor rotational speed in design conditions. When the turbine torque is negative, the generator is disconnected from the rotor, which decelerates according to its inertia. On the contrary, when the torque is positive, the logic of Equation (29) is pursued.
{ Ω ( t ) Ω 0 τ g = τ Τ Ω ( t ) < Ω 0 τ g = 0
where Ω 0 is the design rotational speed of the rotor.
For positive values of the turbine torque, the rotor is free to accelerate and the generator is disconnected until the design speed is reached; once the rotational speed equals or exceeds the design speed, the electric load is instantly connected.
The electrical power made available by the generator is finally calculated with Equation (30) by multiplying the turbine power of Equation (21) for the organic efficiency ξ o and the electrical efficiency ξ e of the generator. Both these efficiencies were assumed equal to 0.95 for taking into account the typical values of the losses.
P e = ξ o ξ e P T

2.4. Wave-to-Wire Model

The flow chart of the wave-to-wire model is represented in Figure 6. Firstly, the wave height and period of each wave condition that are representative of the application site are determined. Subsequently, an iterative cycle that couples the analytical models of the primary and the secondary converters is used to compute the operating curves of the turbine for each specific wave condition. Finally, the system performance parameters are calculated and the annual energy extraction is determined.

3. Results and Discussion

The wave-to-wire model developed was exemplarily applied to evaluate the OWC performance for its hypothetical installation in selected highly energetic points in two coastal areas in Italy. Subsequently, an optimization procedure was performed to determine the impulse turbines that maximize the annual energy extraction. Finally, the operating curves and the performance parameters were determined for the two optimal configurations of the OWC wave energy converter.

3.1. Application Site Selection

The selected points, located on a 50 m water depth, were identified as wave energy hot-spots [78]. The first point (P1) is located in the central sea of Tuscany (latitude: 4826150 m N, longitude: 587255 m E, WGS84–UTM32 coordinates, Figure 7) and has a mean annual wave power of 3.3 kW/m. The second point (P2) is located in front of the northwest coast of Sardinia (latitude: 4509971 m N, longitude: 424733 m E, WGS84–UTM32 coordinates, Figure 7) and it is characterized by a mean annual wave power of 10.5 kW/m that is remarkably higher compared to P1. The evaluation of the energy potential of the sea waves at the two points is based on a wave hindcasting dataset based on 20 years, obtained by using the third-generation spectral wave model WAVEWATCH III® [79]. The hindcasting dataset, developed and validated at the University of Florence, provides wave data for the whole Mediterranean Sea for the period 2000–2109 with sampling of 1 h [80]. The spectral domain of the numerical model is set to 25 frequencies, between 0.042 and 0.41 Hz, and the grid resolution is set to 0.05° in both the latitude and the longitude. Based on these data, the deep-water wave specific power Pw, concerning the wavefront corresponding to each sea state, was calculated with Equation (31).
P w = 1 64 g 2 π ρ w H m 0 2 T m 1 , 0
where Hm0 is the significant wave height and Tm−1,0 is the energy period.
The mean annual sea wave power at the two points obtained from the hindcast dataset in this work differs for less than 15% from the value obtained in [80], which was based on a 5-year-long dataset provided by the French Research Institute for Exploitation of the Sea with the MED6MIN model. The scatter matrix of the available annual wave specific energy AE for classes of different wave periods and heights, based on the wave power Pw and the relative frequency of occurrence of each wave class, is reported in Figure 7.

3.2. Turbine Optimization

A set of parametric analyses were performed to determine the optimal geometry of the turbine for the two application sites located in Tuscany and Sardinia. For completeness, the wave conditions imposed are resumed in the scatter matrices reported in Table 2 and Table 3 for Tuscany and in Table 4 and Table 5 for Sardinia.
These values were obtained from the hindcast dataset of Figure 7 by considering waves with a height lower than 5 m to operate in conditions that avoid the entrance of seawater in the turbine duct. This selection allows considering approximately 90% and 83% of the energy exploitable from the sea waves for the application sites located in Tuscany and Sardinia, respectively.
Regarding the design of the chamber used in the two selected installation sites described above, its main geometrical parameters are reported in Table 6. The shape and size of the chamber were obtained scaling up by a factor 50 the geometry of Table 1 and tested with positive results in laboratory experiments. The rules of the similitude analysis were followed for scaling the geometry.
Focusing now on the secondary converter, the geometrical parameters and the operating conditions of the impulse turbine were varied in the parametric analyses according to the ranges reported in Table 7. These were selected based on experience and analogy with other literature cases in order to define a sufficiently wide design space. The tip clearance is 1% of the blade height and it was kept constant.
Finally, as a result of the optimization analysis, Table 8 reports the geometrical features and the working rotational speed that maximize the energy extracted during one year for the application sites located in Tuscany and Sardinia. Upon examination of Table 8, it is noticeable that fairly similar optimal designs were found, with the optimal turbine for Sardinia being slightly larger than that for Tuscany. A more detailed overview on the effects on this difference will be apparent from the comparison between the operating curves reported in Section 3.3.

3.3. Operating Curves

The aerodynamic performance of the impulse turbine predicted by the wave-to-wire model is presented in terms of nondimensional and dimensional parameters, following the traditional practice in turbomachinery [77]. The nondimensional parameters are the flow coefficient, the input coefficient, the torque coefficient, and the turbine efficiency. The dimensional parameters are the torque, the power, and the static-to-static pressure variation across the turbine.
To represent the operating curves of the two selected impulse turbines, the sea wave conditions that provide the highest contribution to the overall energy conversion of the system were considered for each turbine. The significant wave height Hm0 is 1.5 and 3.5 m and the energy period Tm−1,0 is 5.5 and 8.5 s for the application sites located in Tuscany and Sardinia, respectively. The performance parameters of the selected turbines are shown as functions of the turbine flow coefficient or the volumetric flow rate. Positive values of φ and q ˙ correspond to the outflow phase, during which the airflow exits from the system, while negative values correspond to the inflow when the airflow enters the system. Typically, higher values of the performance parameters to parity of turbine flow coefficient are reached during the outflow phase, as a result of the higher airflow density. Indeed, the air conditions at the inlet are atmospheric for the inflow, while they depend on the positive pressure gradient inside the OWC chamber for the outflow.
The input coefficient of Figure 8a monotonically increases with the rise of the absolute value of the flow coefficient. The increase is significantly smaller for the case of the impulse turbine installed in Tuscany than for the case of the impulse turbine positioned in Sardinia, mainly due to the reduced pressure drop and volume flow rate disposable for the operation of the former. Indeed, the higher wave amplitude determines a greater pressure difference between the chamber and the ambient and the passage of a greater airflow rate. The speed of rise of the input coefficient is similar for the two cases.
From a perusal of Figure 8b, it can be noticed that the torque coefficient is negative for low absolute values of the flow coefficient when the viscous forces prevail on the pressure forces acting on the blade surfaces of the rotor. For higher flow incidence angles, the torque generated by the rotor is positive, as the contribution of the pressure forces is dominant. The curves of the two turbines are both monotonically increasing and have a similar rate of rise. The higher values are reached by the impulse turbine operating in Sardinia.
In Figure 9a, the relation between the static-to-static pressure drop and the volume flow rate is shown. For both cases, the relation is quadratic in the entire operating range. The pressure difference between the turbine inlet and the atmosphere made available by the chamber is higher for the wave conditions investigated for the turbine located in Sardinia due to the greater sea wave amplitude. For both the cases, higher pressure drops are obtained for the outflow phase than for the inflow phase, due to the higher density of the airflow.
Figure 9b denotes that the torque of the two turbines is negative at low incidence angles of the airflow, as the viscous forces prevail on the pressure forces. When these latter overcome the others, the torque becomes positive. For both the cases analyzed, the curves are monotonically increasing and stall conditions are not reached. The maximum torque and its speed of rise are higher for the case analyzed in Sardinia.
The considerations done for the torque are valid even for the turbine power of Figure 9c, as the two turbines rotate at the same speed.
The curves of efficiency of Figure 9d show that the efficiency becomes positive when the incidence angle of the flow determines the prevalence of the pressure forces on the viscous forces. For both the inflow and outflow phases, the two curves increase until their peaks are reached and subsequently decrease. This behavior is more pronounced for the case analyzed in Sardinia than for the case investigated in Tuscany. Indeed, for the former case, the operating range is wider, while for the latter the decline after the peaks is very slight, due to the smaller operating range.
The performance parameters of the two turbines are compared even under the same wave conditions, shown in Figure 10 and Figure 11. With this aim, a high energetic sea state with a significant wave height Hm0 of 2.5 m and an energy period Tm−1,0 of 7.5 s was considered. For both the application sites, this condition provides the second-highest contribution to the annual energy transport.
Figure 10a,b denote that the input and torque coefficients have a similar trend when the two impulse turbines operate in the same wave conditions, as their geometry is similar.
The turbine installed in Tuscany reaches higher maximum values for both coefficients. The rate of rise of the curves is instead comparable for the two cases.
The relation between the volumetric static-to-static pressure drop of Figure 11a is similar for the two turbines under equal wave conditions. The torque and consequently the power extracted by the turbine rotor are higher for the turbine working in Sardinia to parity of flow coefficient, as noticeable in Figure 11b,c. The curves of efficiency of the two turbines depicted in Figure 11d have a comparable trend, with slightly higher maximum values reached by the case of Sardinia. The operating range is moderately wider for the impulse turbine operating in Tuscany.
The time series of the variation of the free surface level inside the OWC chamber regarding the still water level is depicted in Figure 12a,b for the two wave energy converters operating in Tuscany and Sardinia, respectively.
Considering the sea wave conditions corresponding to the maximum contribution to the global energy conversion (Hm0 = 1.5 m and Tm−1,0 = 5.5 s for Tuscany and Hm0 = 3.5 m and Tm−1,0 = 8.5 s for Sardinia), the variation of the free surface level is significantly higher for the application site located in Sardinia due to the greater wave height. Under equivalent wave conditions (Hm0 = 2.5 m and Tm−1,0 = 7.5 s), the curves are almost coincident, with only slightly higher absolute values reached inside the chamber installed in Tuscany owing to the slightly lower damping of the system.
The impulse turbine selected for the application sites located in Tuscany and Sardinia are able to convert 13.69 MWh/year and 39.36 MWh/year under the wave conditions identified in Table 2, Table 3, Table 4 and Table 5, respectively. The control system allows an increase of the annual energy transformation of 7.16% and 3.60% for the turbines operating in the two applications sites, respectively.
The efficiency of the energy conversion from waves to the wire is 5.50% and 5.74% for the systems operating in Tuscany and Sardinia, respectively, in the wave conditions of Table 2, Table 3, Table 4 and Table 5 considered by the model. In Table 9, the efficiencies calculated for the single converters composing the analyzed OWC systems is resumed.
The system efficiency drops down to 4.95% and 4.76%, respectively, by taking into account the overall energy transported by the sea.
Literature data allowing for a direct comparison with the performance calculated through the proposed wave-to-wire model are not available for OWC wave energy converters operating in the selected reference sites. With the aim of providing an example for a partial comparison, the power production and efficiency of an existing European wave farm located in the Atlantic Ocean and based on the OWC concept can be considered, even if the wave spectrum of this location is significantly different with respect to those of the selected application sites located in the Mediterranean Sea. The OWC plant of Mutriku, in Spain, operates with 14 Wells turbines rated 18.5 kW each, delivering total annual energy of 246,468 MWh with a plant efficiency index of 26%. Therefore, each turbine converts 17.605 MWh/year [81]. It is expected that greater efficiency of the OWC system studied could be achieved by adopting two geometries of the chamber specifically designed for the installation in each of the two selected sites, due to the increase of the primary efficiency.

4. Conclusions

An integrated model to simulate the wave-to-wire energy conversion of an OWC wave energy converter using an impulse turbine is proposed. The tool is of engineering type, thus able to run smoothly on a normal computer, but it is sufficiently accurate to provide a first energy assessment, pivotal to evaluate the correct siting and the expectable performance. The model combines a rigid piston model for evaluating the hydrodynamics, thermodynamics, and hydrodynamics of the OWC chamber (primary converter) coupled with the turbine (secondary converter) aerodynamics and the electric generator (tertiary converter). This was solved through an original model based on the design practice of axial turbomachines. In particular, the cascades were modeled as sets of blades, consisting of a finite number of airfoils. A control strategy based on the turbine torque was applied to increase the energy conversion to electricity (tertiary converter). The model was validated against laboratory experiments available in the literature, obtaining satisfactory agreement.
By means of the new model, the operation of an oscillating water column system was analyzed in two representative sea states typical of a moderate wave climate of the central Mediterranean Sea. The sea wave conditions for the application sites were determined in terms of energy transport and frequency for each combination of significant wave height Hm0 and energy period Tm-1, 0 in a sea depth of 50 m. The wave conditions considered are characteristic of two reference sites located in the central area of Tuscany (latitude: 4826150 m N, longitude: 587255 m E, WGS84–UTM32 coordinates) and in front of the northwest coast of Sardinia (latitude: 4509971 m N, longitude: 424733 m E, WGS84–UTM32 coordinates). In these sites, in particular, the optimal turbine configurations for a specified chamber were defined. For each system, the analytical wave-to-wire model developed was applied to calculate the performance parameters and the annual energy conversion in environmental conditions typical of the Mediterranean Sea. The impulse turbines selected for the application sites located in Tuscany and Sardinia are able of converting 13.69 MWh/year and 39.36 MWh/year, respectively. The control system allows an increase of the annual energy transformation of 7.16% and 3.60% for the turbines operating in the two applications sites, respectively. The efficiency of the energy conversion from waves to the wire is 5.50% for the case of Tuscany and 5.74% for the case of Sardinia, in the reference wave conditions considered for comparison. The efficiency reduces to 4.95% and 4.76%, respectively, by taking into account the overall energy transported by the sea.

Author Contributions

Conceptualization, G.M., L.C. (Lorenzo Cappietti), A.B. and L.C. (Lorenzo Ciappi); methodology, G.M., L.C. (Lorenzo Cappietti), A.B. and L.C. (Lorenzo Ciappi); software calculations, L.C. (Lorenzo Ciappi) and L.C. (Lapo Cheli); validation, L.C. (Lorenzo Ciappi), L.C. (Lapo Cheli), I.S. and A.B.; formal analysis, investigation, and resources, all authors; data curation, Lorenzo Ciappi and Lapo Cheli; writing (original draft preparation), L.C. (Lorenzo Ciappi); writing (review and editing), L.C. (Lorenzo Ciappi), I.S. and L.C. (Lapo Cheli); visualization, L.C. (Lorenzo Ciappi); supervision, G.M., L.C. (Lorenzo Cappietti) and A.B.; project administration, G.M. and L.C. (Lorenzo Cappietti). All authors have read and agreed to the published version of the~manuscript.

Funding

This research received no external funding.

Conflicts of Interest

The authors declare no conflict of interest.

Nomenclature

Latin symbols
AArea, m2 m ˙ Mass airflow rate, kg/s
AEAnnual specific wave energy, kWh/mMCHNominal flow deviation coefficient, m
BRadiation damping coefficient, Ns/mMHWFlow deviation coefficient, m1/2
BcChamber width, mnPeak number, -
bBlade height, mPPower, W
CHydrostatic restoring coefficient, N/mpPressure, Pa
CAInput coefficient, - q ˙ Volume airflow rate, m3/s
CDDrag coefficient, -rRotor radius, m
CTTorque coefficient, -rfRelative frequency, %
cfCorrection factor, -sSound speed, m/s
DFront wall draught length, mtTime, s
fForce, NȶRotor pitch, -
FcFront wall freeboard length, mTPeriod, s
GChamber height, mTm−1,0Sea wave energy period, s
gGravitational acceleration, m/s2UBlade velocity, m/s
HSea wave height, mVVolume, m3
hSeawater depth, mvAir absolute velocity, m/s
Hm0Significant sea wave height, mWChamber length, m
JRotational inertia, m2kgwAir relative velocity, m/s
kWavenumber, 1/mxAxial coordinate, m
lChord length, mYLoss coefficient, -
mMass, kgZBlade number, -
m ˙ Mass airflow rate, m3/szVertical coordinate, m
Greek symbols
αAbsolute flow angle, °ρDensity, kg/m3
ΓBlade loading, NςLogarithmic decrement, -
δFlow deviation angle, °τTorque, Nm
ζDamping ratio, - υ ˙ Water particle acceleration, m/s2
ηSea wave displacement, mφTurbine flow coefficient, -
ΘCamber angle, °χSeawater surface displacement, m
λIncident sea wavelength, mΩTurbine rotational speed, rad/s
ξEfficiency, -ωSeawater angular frequency, rad/s
Subscripts and superscripts
*Nominal valueidIdeal
0Initial conditionmBlade midspan
1IGV inlet sectionnPeak number
2Rotor inlet sectionoOrganic
3Rotor outlet sectionprProfile
4OGV outlet sectionptoPower take-off
aAirRotRotor
addAddedseSecondary
AMAinley and MathiesonsfSkin friction
cChamberƬTurbine
dnDamped naturalƭTotal condition
eElectricaltcTip clearance
excExcitationteTrailing edge
extExternalunUndamped natural
HWHowellwSeawater
iBlade element indexϑTangential direction
Acronyms and abbreviations
CFDComputational fluid dynamicsOWCOscillating water column
IGVInlet guide vanePTOPower take-off
LCOELevelized cost of energySWLStill water level
OGVOutlet guide vaneWECWave energy converter

References

  1. Aderinto, T.; Li, H. Ocean Wave Energy Converters: Status and Challenges. Energies 2018, 11, 1250. [Google Scholar] [CrossRef] [Green Version]
  2. Taveira-Pinto, F.; Iglesias, G.; Rosa-Santos, P.; Deng, Z.D. Preface to Special Topic: Marine Renewable Energy. J. Renew. Sustain. Energy 2015, 7, 061601. [Google Scholar] [CrossRef] [Green Version]
  3. Mo̸rk, G.; Barstow, S.; Kabuth, A.; Pontes, M.T. Assessing the Global Wave Energy Potential. In 29th International Conference on Offshore Mechanics and Arctic Engineering; ASME: Shanghai, China, 2010; Volume 49118, pp. 447–454. [Google Scholar] [CrossRef]
  4. Gunn, K.; Stock-Williams, C. Quantifying the global wave power resource. Renew. Energy 2012, 44, 296–304. [Google Scholar] [CrossRef]
  5. Astariz, S.; Iglesias, G. The economics of wave energy: A review. Renew. Sustain. Energy Rev. 2015, 45, 397–408. [Google Scholar] [CrossRef]
  6. Castro-Santos, L.; Garcia, G.; Estanqueiro, A.; Justino, P.A. The Levelized Cost of Energy (LCOE) of wave energy using GIS based analysis: The case study of Portugal. Int. J. Electr. Power Energy Syst. 2015, 65, 21–25. [Google Scholar] [CrossRef] [Green Version]
  7. Chang, G.; Jones, C.A.; Roberts, J.D.; Neary, V.S. A comprehensive evaluation of factors affecting the levelized cost of wave energy conversion projects. Renew. Energy 2018, 127, 344–354. [Google Scholar] [CrossRef]
  8. Millar, D.; Smith, H.C.; Reeve, D. Modelling analysis of the sensitivity of shoreline change to a wave farm. Ocean Eng. 2007, 34, 884–901. [Google Scholar] [CrossRef]
  9. Palha, A.; Mendes, L.; Fortes, J.; Brito-Melo, A.; Sarmento, A. The impact of wave energy farms in the shoreline wave climate: Portuguese pilot zone case study using Pelamis energy wave devices. Renew. Energy 2010, 35, 62–77. [Google Scholar] [CrossRef]
  10. Melikoglu, M. Current status and future of ocean energy sources: A global review. Ocean Eng. 2018, 148, 563–573. [Google Scholar] [CrossRef]
  11. Falcão, A.; Henriques, J.; Gato, L. Self-rectifying air turbines for wave energy conversion: A comparative analysis. Renew. Sustain. Energy Rev. 2018, 91, 1231–1241. [Google Scholar] [CrossRef]
  12. Masuda, Y. Wave-Activated Generator. In Proceedings of the International Colloquium on the Exposition of Oceans, Bordeaux, France, 9–12 March 1971. [Google Scholar]
  13. Masuda, Y.; McCormick, M.E. Experiences in Pneumatic Wave Energy Conversion in Japan. In Utilization of Ocean Waves: Wave to Energy Conversion; McCormick, M.E., Kim, Y.C., Eds.; ASCE: New York City, NY, USA, 1986. [Google Scholar]
  14. Whittaker, T.J.T.; McIlwaine, S.J.; Raghunathan, S. A review of the Islay shoreline wave power station. In Proceedings of the First European Wave Energy Symposium, Edinburgh, Scotland, 21–24 July 1993; pp. 283–286. [Google Scholar]
  15. Boake, C.B.; Whittaker, T.J.T.; Folley, M. Overview and Initial Operational Experience of the LIMPET Wave Energy Plant. In Proceedings of the Twelfth International Offshore and Polar Engineering Conference, Kitakyushu, Japan, 26–31 May 2002. [Google Scholar]
  16. Heath, T.V. A review of oscillating water columns. Philos. Trans. R. Soc. A Math. Phys. Eng. Sci. 2012, 370, 235–245. [Google Scholar] [CrossRef] [Green Version]
  17. Falcão, A.; Gato, L. Air Turbines; Elsevier BV: Amsterdam, The Netherlands, 2012; Volume 8, pp. 111–149. [Google Scholar]
  18. Falcão, A.F.; Henriques, J.C. Oscillating-water-column wave energy converters and air turbines: A review. Renew. Energy 2016, 85, 1391–1424. [Google Scholar] [CrossRef]
  19. Ning, D.-Z.; Wang, R.-Q.; Zou, Q.-P.; Teng, B. An experimental investigation of hydrodynamics of a fixed OWC Wave Energy Converter. Appl. Energy 2016, 168, 636–648. [Google Scholar] [CrossRef]
  20. Zabihi, M.; Mazaheri, S.; Namin, M.M. Experimental hydrodynamic investigation of a fixed offshore Oscillating Water Column device. Appl. Ocean Res. 2019, 85, 20–33. [Google Scholar] [CrossRef]
  21. Liu, Z.; Xu, C.; Qu, N.; Cui, Y.; Kim, K. Overall performance evaluation of a model-scale OWC wave energy converter. Renew. Energy 2020, 149, 1325–1338. [Google Scholar] [CrossRef]
  22. Crema, I.; Simonetti, I.; Cappietti, L.; Oumeraci, H. Laboratory Experiments on Oscillating Water Column Wave Energy Converters Integrated in a Very Large Floating Structure. In Proceedings of the 11th European Wave and Tidal Energy Conference, Nantes, France, 6–11 September 2015. [Google Scholar]
  23. Evans, D.V. The Oscillating Water Column Wave-energy Device. IMA J. Appl. Math. 1978, 22, 423–433. [Google Scholar] [CrossRef]
  24. Falcão, A.F.; Henriques, J.C.; Cândido, J.J. Dynamics and optimization of the OWC spar buoy wave energy converter. Renew. Energy 2012, 48, 369–381. [Google Scholar] [CrossRef]
  25. Suchithra, R.; Ezhilsabareesh, K.; Samad, A. Development of a reduced order wave to wire model of an OWC wave energy converter for control system analysis. Ocean Eng. 2019, 172, 614–628. [Google Scholar] [CrossRef]
  26. Falcão, A.O.; Justino, P. OWC wave energy devices with air flow control. Ocean Eng. 1999, 26, 1275–1295. [Google Scholar] [CrossRef]
  27. Evans, D.V.; Porter, R. Efficient Calculation of Hydrodynamic Properties of OWC-Type Devices. J. Offshore Mech. Arct. Eng. 1997, 119, 210–218. [Google Scholar] [CrossRef]
  28. Malara, G.; Arena, F. Response of U-Oscillating Water Column arrays: Semi-analytical approach and numerical results. Renew. Energy 2019, 138, 1152–1165. [Google Scholar] [CrossRef]
  29. Brito-Melo, A.; Hofmann, T.; Sarmento, A.J.N.A.; Clement, A.H. Numerical modelling of OWC-shoreline devices including the effect of surrounding coastline and non-flat bottom. Int. J. Offshore Polar Eng. 2001, 11. [Google Scholar]
  30. Rezanejad, K.; Soares, C.G.; López, I.; Carballo, R. Experimental and numerical investigation of the hydrodynamic performance of an oscillating water column wave energy converter. Renew. Energy 2017, 106, 1–16. [Google Scholar] [CrossRef]
  31. Çelik, A.; Altunkaynak, A. Experimental investigations on the performance of a fixed-oscillating water column type wave energy converter. Energy 2019, 188, 116071. [Google Scholar] [CrossRef]
  32. Çelik, A.; Altunkaynak, A. Estimation of Water Column Surface Displacement of a Fixed Oscillating Water Column by Simple Mechanical Model with Determination of Hydrodynamic Parameters via Physical Experimental Model. J. Waterw. Port Coast. Ocean Eng. 2020, 146. [Google Scholar] [CrossRef]
  33. Iturrioz, A.; Guanche, R.; Lara, J.L.; Vidal, C.; Losada, I. Validation of OpenFOAM® for Oscillating Water Column three-dimensional modeling. Ocean Eng. 2015, 107, 222–236. [Google Scholar] [CrossRef]
  34. Vyzikas, T.; Deshoulières, S.; Giroux, O.; Barton, M.; Greaves, D. Numerical study of fixed Oscillating Water Column with RANS-type two-phase CFD model. Renew. Energy 2017, 102, 294–305. [Google Scholar] [CrossRef] [Green Version]
  35. Simonetti, I.; Cappietti, L.; Elsafti, H.; Oumeraci, H. Optimization of the geometry and the turbine induced damping for fixed detached and asymmetric OWC devices: A numerical study. Energy 2017, 139, 1197–1209. [Google Scholar] [CrossRef]
  36. Simonetti, I.; Cappietti, L.; Elsafti, H.; Oumeraci, H. Evaluation of air compressibility effects on the performance of fixed OWC wave energy converters using CFD modelling. Renew. Energy 2018, 119, 741–753. [Google Scholar] [CrossRef]
  37. Rezanejad, K.; Gadelho, J.; Soares, C.G. Hydrodynamic analysis of an oscillating water column wave energy converter in the stepped bottom condition using CFD. Renew. Energy 2019, 135, 1241–1259. [Google Scholar] [CrossRef]
  38. Shalby, M.; Elhanafi, A.; Walker, P.; Dorrell, D.G. CFD modelling of a small–scale fixed multi–chamber OWC device. Appl. Ocean Res. 2019, 88, 37–47. [Google Scholar] [CrossRef]
  39. Badhurshah, R.; Dudhgaonkar, P.; Jalihal, P.; Samad, A. High efficiency design of an impulse turbine used in oscillating water column to harvest wave energy. Renew. Energy 2018, 121, 344–354. [Google Scholar] [CrossRef]
  40. Setoguchi, T.; Takao, M.; Santhakumar, S.; Kaneko, K. Study of an Impulse Turbine for Wave Power Conversion: Effects of Reynolds Number and Hub-to-Tip Ratio on Performance. J. Offshore Mech. Arct. Eng. 2004, 126, 137–140. [Google Scholar] [CrossRef]
  41. Kim, T.W.; Kaneko, K.; Setoguchi, T.; Inoue, M. Aerodynamic performance of an impulse turbine with self-pitch-controlled guide vanes for wave power generator. In Proceedings of the 1st KSME-JSME Thermal and Fluid Engineering Conference, Seoul, Korea, 1–3 November 1988. [Google Scholar]
  42. Maeda, H.; Santhakumar, S.; Setoguchi, T.; Takao, M.; Kinoue, Y.; Kaneko, K. Performance of an impulse turbine with fixed guide vanes for wave power conversion. Renew. Energy 1999, 17, 533–547. [Google Scholar] [CrossRef]
  43. Setoguchi, T.; Santhakumar, S.; Maeda, H.; Takao, M.; Kaneko, K. A review of impulse turbines for wave energy conversion. Renew. Energy 2001, 23, 261–292. [Google Scholar] [CrossRef]
  44. Cui, Y.; Liu, Z. Effects of Solidity Ratio on Performance of OWC Impulse Turbine. Adv. Mech. Eng. 2014, 7, 121373. [Google Scholar] [CrossRef]
  45. Badhurshah, R.; Samad, A. Multiple surrogate based optimization of a bidirectional impulse turbine for wave energy conversion. Renew. Energy 2015, 74, 749–760. [Google Scholar] [CrossRef]
  46. Ezhilsabareesh, K.; Rhee, S.H.; Samad, A. Shape optimization of a bidirectional impulse turbine via surrogate models. Eng. Appl. Comput. Fluid Mech. 2017, 12, 1–12. [Google Scholar] [CrossRef]
  47. Ciappi, L.; Cheli, L.; Simonetti, I.; Bianchini, A.; Talluri, L.; Cappietti, L.; Manfrida, G. Analytical Models of Oscillating Water Column Systems Operating with Air Turbines in the Mediterranean Sea. In Proceedings of the 15th Conference on Sustainable Development of Energy, Water and Environment Systems, Cologne, Germany, 1–5 September 2020. [Google Scholar]
  48. Torres, F.R.; Teixeira, P.R.; Didier, E. A methodology to determine the optimal size of a wells turbine in an oscillating water column device by using coupled hydro-aerodynamic models. Renew. Energy 2018, 121, 9–18. [Google Scholar] [CrossRef]
  49. Mishra, A.A.; Mukhopadhaya, J.; Iaccarino, G.; Alonso, J. Uncertainty Estimation Module for Turbulence Model Predictions in SU2. AIAA J. 2019, 57, 1066–1077. [Google Scholar] [CrossRef]
  50. Launder, B.; Tselepidakis, D.P.; Younis, B.A. A second-moment closure study of rotating channel flow. J. Fluid Mech. 1987, 183, 63. [Google Scholar] [CrossRef]
  51. Craft, T.; Launder, B.; Suga, K. Development and application of a cubic eddy-viscosity model of turbulence. Int. J. Heat Fluid Flow 1996, 17, 108–115. [Google Scholar] [CrossRef]
  52. Cook, L.W.; Mishra, A.A.; Jarrett, J.P.; Willcox, K.E.; Iaccarino, G. Optimization under turbulence model uncertainty for aerospace design. Phys. Fluids 2019, 31, 105111. [Google Scholar] [CrossRef]
  53. Mishra, A.A.; Mukhopadhaya, J.; Alonso, J.; Iaccarino, G. Design exploration and optimization under uncertainty. Phys. Fluids 2020, 32, 085106. [Google Scholar] [CrossRef]
  54. Nielsen, K.; Kramer, M.M.; Ferri, F.; Zurkinden, A.S.; Alves, M. Overview of Wave to Wire Models, DCE Technical Report Number 173; Aalborg University: Aalborg, Denmark, 2014; ISSN 1901-726X. [Google Scholar]
  55. Faÿ, F.X.; Henriques, J.C.C.; Marcos, M.; Robles, E. Review of control strategies for oscillating water column wave energy converters. In Proceedings of the 11th European Wave and Tidal Energy Conference, Nantes, France, 6–11 September 2015. [Google Scholar]
  56. Penalba, M.; Ringwood, J.V. A Review of Wave-to-Wire Models for Wave Energy Converters. Energies 2016, 9, 506. [Google Scholar] [CrossRef] [Green Version]
  57. Wang, L.; Isberg, J.; Tedeschi, E. Review of control strategies for wave energy conversion systems and their validation: The wave-to-wire approach. Renew. Sustain. Energy Rev. 2018, 81, 366–379. [Google Scholar] [CrossRef]
  58. Maria-Arenas, A.; Garrido, A.J.; Rusu, E.; Garrido, I. Control Strategies Applied to Wave Energy Converters: State of the Art. Energies 2019, 12, 3115. [Google Scholar] [CrossRef] [Green Version]
  59. Amundarain, M.; Alberdi, M.; Garrido, A.J.; Garrido, I. Modeling and Simulation of Wave Energy Generation Plants: Output Power Control. IEEE Trans. Ind. Electron. 2010, 58, 105–117. [Google Scholar] [CrossRef] [Green Version]
  60. Henriques, J.; Falcão, A.; Gomes, R.; Gato, L. Latching Control of an Oscillating Water Column Spar-Buoy Wave Energy Converter in Regular Waves. J. Offshore Mech. Arct. Eng. 2013, 135, 021902. [Google Scholar] [CrossRef]
  61. Henriques, J.; Chong, J.C.; Falcão, A.; Gomes, R. Latching Control of a Floating Oscillating Water Column Wave Energy Converter in Irregular Waves. In Proceedings of the 33rd International Conference on Ocean, Offshore and Arctic Engineering, Volume 9A, San Francisco, CA, USA, 8–13 June 2014. [Google Scholar] [CrossRef]
  62. Portillo, J.C.C.; Henriques, J.C.C.; Falcão, A.F.O.; Gomes, R.P.F.; Gato, L.M.C. Theoretical and experimental investigation on causal latching and rotational speed control of an OWC spar-buoy wave energy converter, Renew. In Proceedings of the 1st International Conference on Renewable Energies Offshore, Lisbon, Portugal, 24–26 November 2014. [Google Scholar]
  63. Kelly, J.F.; Wright, W.M.D.; Sheng, W.; O’Sullivan, K. Implementation and Verification of a Wave-to-Wire Model of an Oscillating Water Column with Impulse Turbine. IEEE Trans. Sustain. Energy 2015, 7, 546–553. [Google Scholar] [CrossRef]
  64. Song, S.-K.; Park, J.B. Modeling and control strategy of an oscillating water column-wave energy converter with an impulse turbine module. In Proceedings of the 15th International Conference on Control, Automation and Systems (ICCAS), Busan, Korea, 13–16 October 2015. [Google Scholar]
  65. Song, S.K.; Park, J.B. Control Strategy of an Impulse Turbine for an Oscillating Water Column-Wave Energy Converter in Time-Domain Using Lyapunov Stability Method. Appl. Sci. 2016, 6, 281. [Google Scholar] [CrossRef] [Green Version]
  66. Henriques, J.; Gomes, R.; Gato, L.; Falcão, A.; Robles, E.; Ceballos, S. Testing and control of a power take-off system for an oscillating-water-column wave energy converter. Renew. Energy 2016, 85, 714–724. [Google Scholar] [CrossRef]
  67. Henriques, J.; Gato, L.; Falcão, A.; Robles, E.; Faÿ, F.-X. Latching control of a floating oscillating-water-column wave energy converter. Renew. Energy 2016, 90, 229–241. [Google Scholar] [CrossRef]
  68. Henriques, J.; Gato, L.; Lemos, J.; Gomes, R.; Falcão, A. Peak-power control of a grid-integrated oscillating water column wave energy converter. Energy 2016, 109, 378–390. [Google Scholar] [CrossRef] [Green Version]
  69. Bailey, H.; Robertson, B.R.; Buckham, B.J. Wave-to-wire simulation of a floating oscillating water column wave energy converter. Ocean Eng. 2016, 125, 248–260. [Google Scholar] [CrossRef]
  70. Henriques, J.; Portillo, J.; Sheng, W.; Gato, L.; Falcão, A. Dynamics and control of air turbines in oscillating-water-column wave energy converters: Analyses and case study. Renew. Sustain. Energy Rev. 2019, 112, 571–589. [Google Scholar] [CrossRef]
  71. Faÿ, F.-X.; Henriques, J.; Kelly, J.; Mueller, M.; Abusara, M.; Sheng, W.; Marcos, M. Comparative assessment of control strategies for the biradial turbine in the Mutriku OWC plant. Renew. Energy 2020, 146, 2766–2784. [Google Scholar] [CrossRef]
  72. Benreguig, P.; Kelly, J.; Pakrashi, V.; Murphy, J. Wave-to-Wire Model Development and Validation for Two OWC Type Wave Energy Converters. Energies 2019, 12, 3977. [Google Scholar] [CrossRef] [Green Version]
  73. Gervelas, R.; Trarieux, F.; Patel, M.H. A time-domain simulator for an oscillating water column in irregular waves at model scale. Ocean Eng. 2011, 38, 1007–1013. [Google Scholar] [CrossRef]
  74. Iturrioz, A.; Guanche, R.; Armesto, J.A.; Alves, M.; Vidal, C.; Losada, I. Time-domain modeling of a fixed detached oscillating water column towards a floating multi-chamber device. Ocean Eng. 2014, 76, 65–74. [Google Scholar] [CrossRef]
  75. Patel, M.; Harrison, J. The mechanics of a compliant motion suppression system for semisubmersibles. J. Sound Vib. 1986, 106, 491–507. [Google Scholar] [CrossRef]
  76. McCormick, M.E. Ocean Engineering Mechanics with Applications; Cambridge University Press: New York, NY, USA, 2009. [Google Scholar]
  77. Dixon, S.L. Fluid Mechanics and Thermodynamics of Turbomachinery, 5th ed.; Elsevier: Amsterdam, The Netherlands, 2005; ISBN 9781856177931. [Google Scholar]
  78. Vannucchi, V.; Cappietti, L. Wave Energy Assessment and Performance Estimation of State of the Art Wave Energy Converters in Italian Hotspots. Sustainability 2016, 8, 1300. [Google Scholar] [CrossRef] [Green Version]
  79. Tolman, H.L. User Manual and System Documentation of Wavewatch III Version 4.18; NOAA/NWS/NCEP/MMAB Tech. Note; NOAA, NSW, NCEP: College Park, MD, USA, 2014; Volume 316, p. 194.
  80. Pelli, D.; Cappietti, L.; Oumeraci, H.; Soares, C. Assessing the wave energy potential in the Mediterranean Sea using Wavewatch III. Prog. Renew. Energ. Offshore 2016, 21–26. [Google Scholar] [CrossRef]
  81. Ibarra-Berastegi, G.; Sáenz, J.; Ulazia, A.; Serras, P.; Esnaola, G.; Garcia-Soto, C. Electricity production, capacity factor, and plant efficiency index at the Mutriku wave farm (2014–2016). Ocean Eng. 2018, 147, 20–29. [Google Scholar] [CrossRef] [Green Version]
Figure 1. (a) Image and (b) scheme of the chamber model tested with small-scale experiments at the LABIMA (Maritime Engineering Laboratory of the University of Florence).
Energies 13 05582 g001
Figure 2. Time series of the free surface oscillation inside the oscillating water column (OWC) chamber in the free decay tests.
Energies 13 05582 g002
Figure 3. Scheme of the blade-to-blade section of the impulse turbine cascades.
Energies 13 05582 g003
Figure 4. (left) Velocity triangles at the inlet and outlet of the turbine rotor and (right) rendering of the turbine rotor optimized for the installation in Sardinia, indicating the main geometric parameters.
Energies 13 05582 g004
Figure 5. Comparison of the results of the analytical model with the experimental data of Setoguchi [40] in terms of (a) input coefficient, (b) torque coefficient, and (c) efficiency.
Energies 13 05582 g005
Figure 6. Flow chart of the developed wave-to-wire model and its application to the selected key sites.
Energies 13 05582 g006
Figure 7. (left) Location of the wave energy hot-spots selected for the application of the wave-to-wire model in the study; (right) scatter matrix of the available annual specific wave energy AE for classes of different significant wave height Hm0 and energy period Tm−1,0.
Energies 13 05582 g007
Figure 8. (a) Input coefficient and (b) torque coefficient as functions of the flow coefficient at the blade midspan, under the wave conditions maximizing the energy conversion.
Energies 13 05582 g008
Figure 9. (a) Static-to-static pressure drop versus volumetric flow rate, (b) turbine torque, (c) power, and (d) efficiency as functions of the flow coefficient at the blade midspan, under the wave conditions maximizing the energy conversion.
Energies 13 05582 g009
Figure 10. (a) Input coefficient and (b) torque coefficient as functions of the flow coefficient at the blade midspan, under the wave conditions maximizing the energy conversion.
Energies 13 05582 g010
Figure 11. (a) Static-to-static pressure drop versus volumetric flow rate, (b) turbine torque, (c) power, and (d) efficiency as functions of the flow coefficient at the blade midspan, under equal wave conditions.
Energies 13 05582 g011
Figure 12. Time series of the free surface level inside the chamber for the OWC systems operating in (a) Tuscany and (b) Sardinia.
Energies 13 05582 g012
Table 1. Main geometrical parameters and properties of the OWC chamber at the laboratory scale.
Chamber Outer SectionChamber Inner SectionChamber HeightFront Wall Draught LengthFront Wall Freeboard LengthAdded MassUndamped Natural Frequency
Ac,ext (m2)Ac (m2)G (m)D (m)Fc (m)madd (kg)ωun (rad/s)
0.0400.0330.290.090.164.286.7
Table 2. Scatter matrix of the annual specific wave energy AE available in Tuscany, for classes of different significant wave height Hm0 and energy period Tm−1,0, for the wave conditions considered.
AE (kWh/m)Tm−1,0 (s)
2.53.54.55.56.57.58.59.510.511.512.5
Hm0 (m)4.5000005011713227000
3.50000181842177038485250
2.50002213003398150049318370
1.501427620454233289213653513400
0.59011531129692318119427100
Table 3. Scatter matrix of the relative frequency of the wave conditions considered for Tuscany, for classes of different significant wave height Hm0 and energy period Tm−1,0.
rf, %Tm−1,0 (s)
2.53.54.55.56.57.58.59.510.511.512.5
Hm0 (m)4.5000000.0080.1620.0400.00800
3.500000.0050.4780.4050.0790.0160.0040.001
2.50000.0150.7631.7290.6740.1980.0670.0020.002
1.500.0410.6503.9426.9034.0871.7020.3920.03400
0.53.43631.4423.9412.004.6681.5080.4700.0720.01000
Table 4. Scatter matrix of the annual specific wave energy AE available in Sardinia, for classes of different significant wave height Hm0 and energy period Tm−1,0, for the wave conditions considered.
AE (kWh/m)Tm−1,0 (s)
2.53.54.55.56.57.58.59.510.511.512.5
Hm0 (m)4.50000032475705834718650
3.500002775733103903057323294
2.5000338446810345533412277556
1.50992355506829304760934400
0.521708103349999610000
Table 5. Scatter matrix of the relative frequency of the wave conditions considered for Sardinia, for classes of different significant wave height Hm0 and energy period Tm−1,0.
rf, %Tm−1,0 (s)
2.53.54.55.56.57.58.59.510.511.512.5
Hm0 (m)4.5000000.0511.0490.7230.0810.0070
3.500000.0831.4882.3800.6260.0600.0050.001
2.50000.2352.6235.2632.3940.4930.0270.0020.002
1.500.0282.17410.7011.144.3060.7600.0380.00400
0.50.79519.3121.908.6581.4570.0820.0130.002000
Table 6. Main geometrical parameters and properties of the OWC chamber.
Chamber Outer SectionChamber Inner SectionChamber HeightFront Wall Draught LengthFront Wall Freeboard LengthAdded MassUndamped Natural Frequency
Acext (m2)Ac (m2)G (m)D (m)Fc (m)madd (kg)ωun (rad/s)
10082.514.54.585350000.95
Table 7. Test plan of the parametric analysis of the impulse turbine.
ParameterMinimumMaximumInterval
Rotational speed (rpm)3001200300
Turbine casing radius (m)0.510.05
Hub to tip ratio, -0.60.70.05
Stator blade number, -26302
Rotor blade number, -30402
Table 8. Geometry and rotational speed of the two impulse turbines.
ParameterTuscanySardinia
Rotational speed (rpm)300300
Turbine casing radius (m)0.80.85
Hub to tip ratio, -0.650.7
Stator blade number, -2626
Rotor blade number, -3030
Tip clearance, %11
Rotational inertia (m2 kg)63.5798.62
Table 9. Efficiencies calculated for the converters of the OWC investigated systems.
EfficiencyTuscanySardinia
Primary converter, %24.2125.39
Secondary converter, %25.1725.05
Tertiary converter, %90.2590.25
Publisher’s Note: MDPI stays neutral with regard to jurisdictional claims in published maps and institutional affiliations.

