Abstract
Artificial intelligence-based solutions and applications have great potential in various fields of electrical power engineering. The problem of the electrical reliability of power equipment directly refers to the immunity of high-voltage (HV) insulation systems to operating stresses, overvoltages and other stresses—in particular, those involving strong electric fields. Therefore, tracing material degradation processes in insulation systems requires dedicated diagnostics; one of the most reliable quality indicators of high-voltage insulation systems is partial discharge (PD) measurement. In this paper, an example of the application of a neural network to partial discharge images is presented, which is based on the convolutional neural network (CNN) architecture, and used to recognize the stages of the aging of high-voltage electrical insulation based on PD images. Partial discharge images refer to phase-resolved patterns revealing various discharge stages and forms. The test specimens were aged under high electric stress, and the measurement results were saved continuously within a predefined time period. The four distinguishable classes of the electrical insulation degradation process were defined, mimicking the changes that occurred within the electrical insulation in the specimens (i.e., start, middle, end and noise/disturbance), with the goal of properly recognizing these stages in the untrained image samples. The results reflect the exemplary performance of the CNN and its resilience to manipulations of the network architecture and values of the hyperparameters. Convolutional neural networks seem to be a promising component of future autonomous PD expert systems.
1. Introduction
Artificial intelligence (AI) is one of the most active topics of this decade. It has experienced explosive growth and is expected to penetrate almost all domains (engineering, metering and control, biomedicine and autonomous vehicles, to mention a few). This will pave the way for more accurate, faster and more cost-effective solutions. As a subset of AI, machine learning is experiencing unprecedented development, especially in the area of artificial neural networks, with many current variants and deployed applications. Scientists are excited about the potential of deep learning and the performance of convolutional neural networks. Thus, AI-based solutions and applications have great potential in various fields of electrical power engineering. The problem of the electrical reliability of power equipment is directly related to the immunity of high-voltage insulation systems to operating stresses, overvoltages and other stresses—in particular, those involving strong electric fields. Therefore, tracing material degradation processes in insulation systems requires dedicated diagnostics. The electric field exposure in insulation systems is a factor that is responsible for initiating and developing various forms of electrical discharges. These refer to discharges in the internal gaseous cavities, called voids, and on the surface of the insulation systems. The so-called partial discharge (PD) refers to cases in which no full insulation breakdown occurs; i.e., there is no direct bridging of the electrodes. Long-lasting PD stress has an influence on the reliability and lifetime of electrical power equipment.
Neural networks are applied in a broad spectrum of application areas; they share the common objective of being able to automatically learn features from massive databases and generalize their responses to circumstances that are not encountered during the learning phase [1,2]. Currently, convolutional neural networks (CNN), a successor of multi-level perceptron (MLP)-based networks, are predominantly being used in signal and image processing. Over the last three decades, it has been reported that neural networks have been successfully applied for PD pattern recognition, diagnostics and monitoring applications [3,4,5,6,7,8,9,10,11,12,13,14,15,16,17,18,19,20,21,22,23,24,25,26,27,28,29,30,31,32,33,34,35,36,37,38]. In order to reduce the complexity of the recognition process, the statistical operators are often derived from PD distributions and applied to the classification procedures [5,6,7,8,11,12,13,14,15]. In early applications, due to computational complexity, a strong reduction of the PD phase resolution was applied [8,9]. PD pattern recognition has been performed in various domains; i.e., it has been applied either to phase or pulse magnitude distributions [13], to a pulse time waveform [16,25,34] or to PD images [14,21,36]. The real challenge for this approach concerns patterns containing a superposition of multiple defects that occur in high-voltage electrical insulation [18,21,25]. In this paper, an example of the application of a neural network to partial discharge images is presented, which is based on the convolutional neural network architecture, and used to recognize the stages of the aging of high-voltage electrical insulation based on PD images.
2. Partial Discharge Phase-Resolved Acquisition
The progressive deterioration of high-voltage insulation caused by partial discharges is one of the key factors limiting the lifetime of electrical power equipment. Thus, one of the most commonly accepted and reliable quality indicators of high-voltage (HV) insulation systems is PD measurement. Partial discharges occur in the HV technical insulation systems of power equipment. A PD is usually defined as an electrical discharge that takes place locally, in only one part of an insulation system, that does not directly result in losing the insulating properties of the power device. However, long-lasting partial discharges result in micro and macroscopic deteriorations, leading to insulation breakdowns. Partial discharges may appear in solid, liquid and gaseous insulation systems; those bringing about destructive consequences take a variety of forms of interactions and multi-stage characters of the accompanying processes. The phase-resolved partial discharge analysis method is currently the most popular tool in PD-based diagnostics for high-voltage electrical insulation. This technique allows for the registration of individual PD pulses with respect to the phase angle of the applied voltage. The methodology relies on coupled two-dimensional multi-channel analyzers and is graphically shown in Figure 1. Since PD physical processes demonstrate a statistical behavior, a method based on phase-resolved PD acquisition is especially useful. The phase position of a particular discharge with respect to the high-voltage AC cycle brings additional information, which allows for PD form separation and the recognition of non-coherent forms on a phase-resolved plane. The PD patterns acquired in this way, revealing various stages of discharge development, are treated in this paper as images.
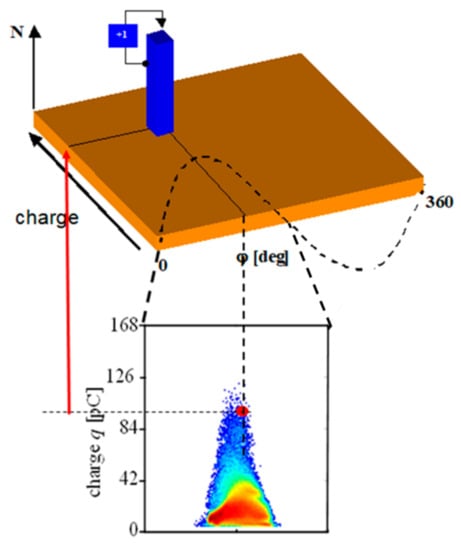
Figure 1.
Partial discharge phase-resolved methodology.
In the monitoring test, the specimens were aged under a high voltage, up to 20 kV, and the measurement results were saved continuously within a predefined time period. The PD measurements, at AC voltage, were performed using a wideband acquisition system, ICM+ (Power Diagnostix, Aachen, Gemany), connected to a host computer via a GPIB (General Purpose Interface Bus) interface [39,40,41]. The phase-resolved measurements in AC mode were recorded within 60 s, resulting in a D(φ, q, n) pattern (8 × 8 × 16 bit).
3. Machine Learning and Partial Discharge Image Recognition
Machine learning (ML) is a very popular topic in various disciplines; great progress in this field has recently been observed. ML refers to the ability of algorithms with tunable parameters that are adjusted automatically and adapted accordingly to previously seen data. In general terms, machine learning can be considered to be a subdomain of artificial intelligence. The applied algorithms can be considered as the building blocks of computer learning, leading systems to behave more intelligently by generalizing rather than only operating on data elements, in contrast to a conventional dataset system. Thus, machine learning is learning based on experience and can be classified into unsupervised learning and supervised learning. The first approach aims to group and interpret data based only on input data, whereas the latter method relies on predictive models based on both input and output data. Unsupervised learning implies that the algorithm itself will find patterns and relationships among different data clusters. The dataset in machine learning usually consists of a multi-dimensional entry associated with several attributes or features. Unsupervised learning can be further divided into clustering and association. Clustering refers to the automatic grouping of similar objects into sets. In turn, supervised learning implies an algorithm’s ability to recognize elements based on provided samples with the goal of recognizing new data based on training data. Supervised learning algorithms include, for example, decision trees, support vector machines (SVM), naive Bayes classifiers, k-nearest neighbors and linear regressions [7,8,9,10,11,12,13,14,15,16,17,18,19,20,34,35,36,37]. Supervised learning can be further divided into classification and regression: classification means that samples belong to two or more classes, with the goal of predicting the class of unlabeled data from the already-labeled data and thus identifying to which category an object belongs; regression is understood as predicting an attribute associated with an object.
Probably the most popular examples of machine learning are artificial neural networks. The machine-learning workflow consists of several steps. The first step is preprocessing; i.e., data preparation in a form on which the network can train. This involves collecting images and properly resizing and labeling them up to the normalization stage (for example). The second step refers to the definition of the neural network topology in terms of the number of layers to be used in a model, the size of the input and output layers, the type of the implemented activation functions, whether or not dropout will be used, the number of epochs, the sizes of the training sets and many other factors. In fact, setting up all of the hyperparameters of a neural network framework is an art and relies greatly on experience. In the following stage, an instance of the model is fit with training data. Usually, the higher the number of epochs, the greater the performance of the neural network; however, too many training epochs may lead to overfitting and performance degradation. After training comes model evaluation by comparing the model’s performance against a validation dataset (a dataset on which the model has not been trained). The performance of a neural network is determined by the application of various metrics. The most common is “accuracy,” which reflects the number of correctly classified images divided by the total number of images in the dataset.
Partial discharge image recognition refers to the ability to distinguish and recognize between different PD types and sources within the insulating system of electrical power equipment, which often consists of complex insulation (a combination of gaseous, solid and liquid phases). Moreover, discriminating between the internal discharges that occur in insulating systems and the external interference and disturbances is a critical element of pattern recognition for on-site measurements that are performed in a hazardous environment. The classification stage represents the recognition of the source from the data. Usually, this stage is twofold and consists of extracting a feature vector from the data followed by recognizing a corresponding source. The identification and classification of partial discharge features is a fundamental requirement for an effective insulation diagnosis. Partial discharges can affect an insulation system’s reliability in different ways. Some electrical insulation systems (for example, mica-based system) are designed to withstand a certain level of partial discharges occurring in the distributed micro-voids, while others (e.g., polymer-based systems) are degraded very quickly by partial discharge activity.
As PD recognition is very complicated, only experts with extensive personal experience are able to discriminate between various discharge phenomena and assess the risk of potential insulation breakdown. Initially, experts mainly relied on the apparent charge magnitude; later, they also took the pulse density, phase and amplitude distributions into account after the introduction of acquisition systems. In the early 1990s, the introduction of PD phase-resolved acquisition and 3D-representation as well as ultra-wide-band detection and pulse registration created new possibilities and tools for automatic pattern recognition and expert systems. A phase-resolved PD pattern is treated as an image; therefore, image-processing algorithms are used for extracting and distinguishing the features of an image.
Today’s PD expert systems are often based on statistical parameters and the stochastic nature of PD processes. The most important attributes of partial discharges include their amplitude, rise time, phase position (with respect to alternating voltage), occurrence rate and time interval to the preceding and successive PD pulses. It is known that a strong correlation exists between PD patterns and the sources causing the discharges [25,42,43,44]. For pattern recognition, various techniques have been employed (e.g., statistical tools, neural networks, fuzzy logic, time-series analysis, principal component analysis, wavelets, etc.), which are supported in the preprocessing phase by advanced signal and image processing techniques. A PD pattern analysis can be performed on PD pulse shape, PD distributions (pulse-height, pulse-phase, pulse-energy, etc.) or PD-derived images. Expert systems based on statistical operators are very sensitive to the harmonics in high voltages; thus, special attention should be paid to the interpretation and classification stage [45].
The discussed PD pattern-recognition techniques are applied to almost all HV objects, such as transformers, generators, motors, bushings, components, GIS (Gas Insulated Switchgear), cables and joints. Many of the algorithms described above rely on a solid reference library containing either generic defect patterns or a set of attributes. As the amount of data is huge (especially in the monitoring applications), there is a need for data compression and a reduction of identification time (mainly in real-time analyzers). The time needed for identification can be significantly reduced by the proper selection of distinguishing parameters for the features. The most challenging aspects of today’s partial discharge pattern recognition applications are related to multi-source PD classification, the separation between real internal PDs and both noise and disturbances. The purpose of applying neural networks for the diagnostics of high-voltage insulating systems is to recognize PD images and their qualifications to the appropriate group of images that are characteristic of the typical discharge forms or to trace the dynamic changes in PD images in the case of monitoring. For image recognition, back-propagation networks and self-organizing Kohonen’s maps have often been applied in recent years; currently, convolutional neural networks are particularly promising [12,13,14,21,22,23,24].
Partial discharge images have also introduced a new category in PD evaluation, referring to qualitative analysis and defect discrimination. A kind of system that requires no calibration in absolute units (pC, mV, mA, etc.) and in which qualitative discrimination could be performed by the analysis of the shapes of statistically accumulated images would be very desirable, especially in on-site or monitoring measurements. This direction has been a visible trend in PD expert systems over the last few decades.
4. Architecture of Deep Convolutional Neural Networks
Artificial neural networks (ANN) have been a constant focus of research since the beginning of the 1990s, evolving from simple multi-layer perceptrons (MLP) to advanced deep topologies today. One of the key accelerators for this was certainly the development of computational power, both based on the CPU (central processing unit) and GPU (graphics processing unit), as well as the rapid development of algorithms, architectures and programming environments such as Tensor Flow by Google [46]. This approach has disrupted several industries and businesses due to their unprecedented capabilities, versatility and speed of implementation. One of the most advanced directions in AI currently is the deep learning architecture based on convolutional neural networks (CNN). The CNN topology consists of convolutional layers in which the output of each neuron is a function of usually only a smaller subset of the previous layer’s neurons, in contrast to the MLP structure, where each layer’s neurons connect to all of the neurons in the next layer (fully connected layers); i.e., each neuron’s output is a transformation of the previous layer that is introduced with an activation function. In their basic structure, neural networks consist of neurons with learnable weights and biases. The convolution operation transforms an input image (matrix I) and a typically much smaller weight matrix (called a kernel or filter M) to an output matrix O according to the following formula:
where L is the number of filters in the previous layer, l is the filter index and M and N refer to the size of the filter.
In this way, a convolutional layer is spatially focused and lighter than a fully connected one, allowing the convolutional representations to learn much more quickly. Typically, various kernels are applied in order to preserve the complexity of an image, give depictions of different parts of the image and generate a collection of feature maps (FM). A graphical illustration of feature map layer creation is shown in Figure 2. The size and number of filters of each convolution layer should be predefined during the network architecture phase. The filter Mk coefficients are unknown elements of a CNN, which will be specified by a backpropagation method during the training process. Backpropagation is a technique used for the evaluation of connections between neurons. When it receives an input, each neuron can completely and independently calculate the output value and the local gradient of the input (taking into account the output value). This phase is called a forward pass. When this phase is over, the backpropagation training phase starts. During the backpropagation, each neuron learns the gradient of its output value considering the complexity of the entire network. The neuron takes the gradient of the whole network topology and multiples it with each gradient with which it is connected.
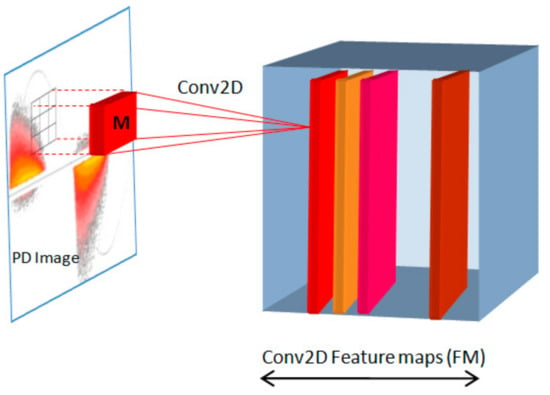
Figure 2.
Graphical illustration of feature map layer creation (M—filter). PD—partial discharge.
The common filter sizes used in CNNs are 3 or 5, creating a 3 × 3 or 5 × 5 mask of pixels, respectively. In the case of a full-color image (e.g., RGB), the dimensions of this filter are 3 × 3 × 3 (Figure 3). The filter is shifted across the image according to a parameter called “stride”; this defines the number of pixels by which the filter will be moved after each iteration. A conventional stride value for a convolutional neural network is 2.
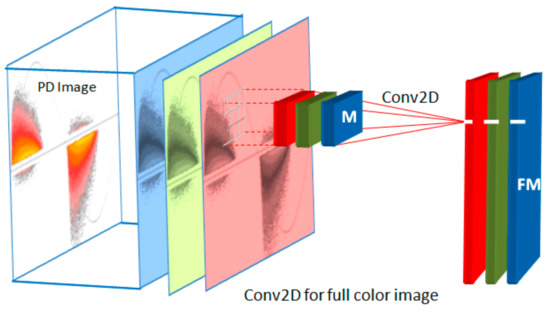
Figure 3.
Creation of feature map for full-color image (FM—feature maps).
The basic assumption in CNN networks (especially in image processing) is that each neuron is strongly affected by its neighbors and that distant neurons have only a small impact. This reflects the property of an image where the spatial correlation between pixels usually decreases as the pixels become more distant from each other. The convolutional neural network topology consists of main four elements:
- ■
- Convolution;
- ■
- Activation;
- ■
- Pooling;
- ■
- Classification by fully connected layers.
In the first step, the feature kernel and an image are lined up, and the multiplication of each image pixel by the corresponding feature pixel is performed. Then, the total sum of these values is divided by the total number of pixels providing output strength. This signal is passed through an activation function in the following step. In most cases, the rectified linear unit (ReLU) transform function is applied [1,29,32]:
This activates a node in a network if the input is above a specified threshold. In case the input is below zero, the output is zero; however, when the input rises above a certain threshold, it has a linear relationship with the input variable. In this way, all of the negative values from the convolution are removed and changed to zero, while all the positive values remain unchanged.
The next step is called pooling, in which the downsampling (compression) and smoothing of the feature map (FM) are performed. This process is usually undertaken by taking the averages or the maximum of a sample of the signal and helps to prevent overfitting, which is where the network learns facets of the training cases too well and fails to generalize new data. MaxPooling is the most commonly applied approach, which obtains the maximum value of the pixels within an individual filter. Thus, in the case of a 2 × 2 pooling filter, a quarter of the information is preserved, and three-quarters are dropped. A similar function is executed by the dropout operation, which is performed by multiplying the weight matrix of neurons W with a mask vector D. A visualization of the dropout operation is shown in Figure 4. Depending of the position of 1 and 0 in a mask vector D, certain neurons are discarded in matrix W (i and j refer to the position of a neuron in a layer; k is the layer number), providing a reduced topology WD (Figure 4b), which results in a shorter training time for each epoch.
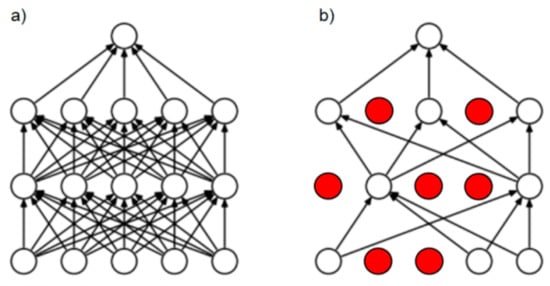
Figure 4.
Visualization of dropout operation: (a) full network; (b) network after dropout.
Another tuning operation is batch normalization. When the input data to the network are normalized, the hidden layers in the CNN can also be normalized to speed up the learning. Thus, batch normalization normalizes the output of a previous activation layer by subtracting the mean of a batch and dividing it by the standard deviation of a batch. The final classification step is based on fully connected layers (FCs), meaning that the neurons of the preceding layers are connected to every neuron in the subsequent layers (similar to an MLP neural network). As a preparation, a prior flattening operation is required to present the data in the form of a vector. The primary purpose of the ANN is to analyze the cluster of input features and fuse them into different attributes that will be used in the classification. Thus, the layers form collections of neurons that represent different features of an image. When enough of these neurons are activated in response to an unknown input image, the image will be classified properly. The general architecture of a convolutional neural network is shown in Figure 5.

Figure 5.
General architecture of a convolutional neural network. FC: fully connected layers.
5. Experimental Results
The application of convolutional neural networks to a sequence of partial discharge images is presented here. As one of the key indicators of high-voltage insulation deterioration, partial discharges are often used in monitoring systems. The test specimen was aged under high electric stress, and the measurement results were saved continuously within a predefined time period. The sequence of the phase-resolved PD images taken from the long-term aging experiment was analyzed. The four distinguishable classes of the electrical insulation degradation process were defined, mimicking the changes that occurred within the electrical insulation in the specimens (i.e., start, middle, end and noise/disturbance), with the goal of properly recognizing these stages in the untrained image samples. Representative PD images of the distinctive classes in the long-term monitoring of the electrical insulation aging are shown in Figure 6. The presented results were developed in the Python environment with the TensorFlow, Keras, and Scikit-learn deep-learning frameworks [46,47]. The machine-learning algorithms implemented in these environments expect the data to be represented and stored in a two-dimensional array in a particular format ([n_samples, n_features]), where a sample can be a PD image and a feature is a distinct label of the class. The PD image has three spatial dimensions; i.e., width, height and a third dimension (the depth corresponding to the number of channels of the image). The input set consisted of 250 training images of each class and 25 test images per class.

Figure 6.
Representative PD images of distinctive classes in the long-term monitoring of the aging of electrical insulation.
An exemplary set of both the training and test images is shown in Figure 7. In both cases, the four distinguishable classes (start, middle, end and noise/disturbance) of the electrical insulation degradation stages are presented.
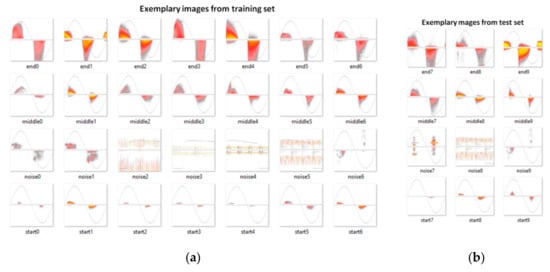
Figure 7.
Exemplary set of training (a) and test (b) partial discharge images exhibiting distinguishable classes (start, middle, end and noise/disturbance) of electrical insulation degradation stages.
The exemplary convolutional neural network architecture used in the experiments is presented in Figure 8. As mentioned above, designing, configuring and testing neural networks is a complex task with a huge number of hyperparameters and many degrees of freedom. In the presented example, the structure as well as the hyperparameters were chosen by trial and error.

Figure 8.
Exemplary convolutional neural network architecture applied to PD images.
The CNN consists of up to six convolutional Conv2D and MaxPooling layers, followed by up to five fully connected (FC) hidden layers, each having from 128 to 1024 sigmoidal nodes. The output layer has a number of outputs that is equal to the number of recognized classes of PD images.
6. Discussion
The exemplary parameters of the test CNN network architecture applied to PD images are illustrated in Figure 9. The individual blocks represent consecutive layers in the network structure, indicating the input and output dimensions. The first part refers to the Conv2D convolutional feature maps (FM, including the MaxPooling and DropOut stages), while the fully connected (FC) dense network after the flattening operation is depicted in the second part.
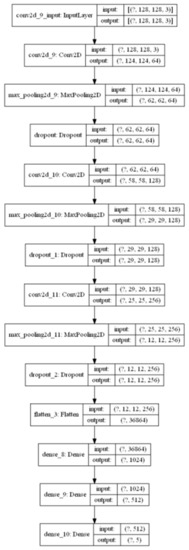
Figure 9.
Exemplary parameters of the test convolutional neural network (CNN) architecture applied to PD images.
In the preprocessing phase, PD images were resized to a format of 128 × 128 × 3 and individually labeled. The feature mask kernel was set to 5 × 5 pixels (also to a dimension of 3 × 3 in some test cases), and up to six convolutional layers were implemented. The number of convolution kernels M was changed between 32 and 128. The dense fully connected layers were defined with 512 or 1024 neurons and the activation function ReLu, followed by an output layer with the Softmax activation function and a number of neurons corresponding to the number of classes to be recognized. The model was trained with various batch sizes (e.g., 32–256) and numbers of epochs (10–200), and the data were split into training and validation sets (20–30%). A dropout operation of 0.2 to 0.5 after the convolution and future map layers was tested.
According to the general rules, adding more feature map layers is recommended if the existing network is not able to recall the image attributes properly, whereas extra dense layers are needed in the case of network abstraction expansion. On the other hand, network expansion in terms of a feature map and hidden layers might lead to overfitting, in contrast to an overly small model that would be underfit. There are also various strategies regarding the selection of the size of the convolution layers; i.e., either they should be kept at the same size or the size should be increased as they go deeper in subsequent stages. The whole data package of PD images can be divided into three categories: a training set, a validation set and a test set. The first set is used to fit the parameters, such as by adjusting the weights. The role of the validation set is to tune the parameters, including the matching of the architecture. The test set is used to assess the performance in terms of generalization and the power of prediction.
The recognition score presented below is composed of the form of an array, in which the rows correspond to the distinguishable classes and the columns to the number of the test set. The contents of the score array show the numeric recognition probability along with a color palette. The exemplary trial of PD monitoring stage recognition is shown in Figure 10. The performance was assessed by the accuracy and loss metric parameters. A training accuracy of 97% and a validation accuracy of 92% were achieved in this case. The accuracy adjustment after 30 epochs is shown in Figure 10a and that after 200 epochs is shown in Figure 10b, where the saturation effect is visible. Comparisons of the partial discharge recognition score after 10 epochs and after 50 epochs are shown in Figure 10c and Figure 10d, respectively.
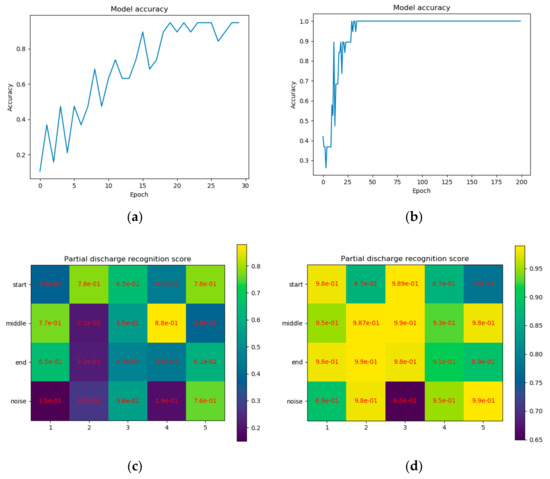
Figure 10.
Exemplary recognition trial of PD monitoring stages using a convolutional neural network: (a) accuracy adjustment after 30 epochs; (b) after 200 epochs; (c) partial discharge recognition score after 10 epochs; (d) after 50 epochs. Rows in the score matrix correspond to distinguishable classes, and columns refer to the number of test sets.
The visualization of the output filter banks provides an illustration of the automatic feature extraction (as shown in Figure 11). A comparison of the filters in the first layer (Figure 11a) and third layer (Figure 11b) shows that when going deeper in the network structure in terms of the convolution number, the feature map changes from fine (focused on details) to coarser (revealing the general aspects and the providing compression).
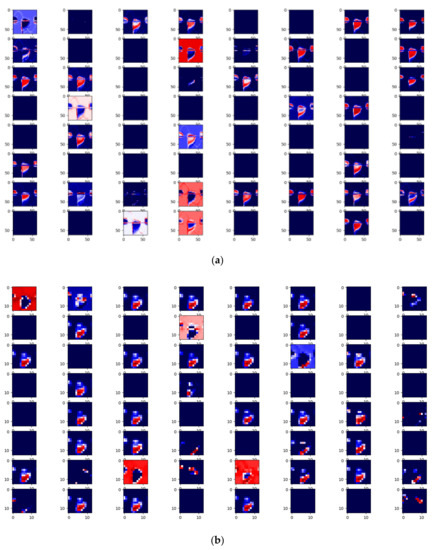
Figure 11.
Visualization of output filter banks in convolutional layers, providing an illustration of automatic feature extraction: (a) first Conv2D layer; (b) third Conv2D layer.
Another assessment criterion of the CNN is a confusion matrix (also called an error matrix), which is a technique used to summarize the performance of a classification algorithm. Each column of the matrix refers to the instances in a predicted class, while each row expresses the instances in an actual (true) class. Thus, this is a way of tabulating the number of misclassifications; i.e., the number of predicted classes that ended up in an incorrect classification slot based on the true classes. By definition, a confusion matrix size is equal to the number of observations or classes. An exemplary confusion matrix for a set of 400 validation PD images subdivided into four classes (start, middle, end and noise) representing the insulation stages of electrical insulating aging monitoring is shown in Figure 12.
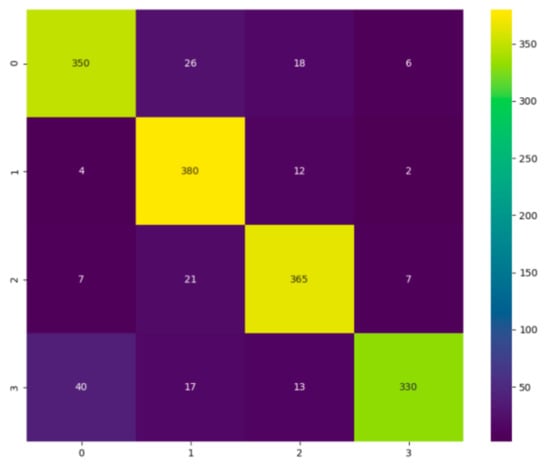
Figure 12.
Exemplary confusion matrix for a set of 400 validation PD images subdivided into four classes (start, middle, end and noise) representing the insulation stages of electrical insulating aging monitoring. Each column of the confusion matrix refers to instances of the predicted class, while each row exhibits instances of the actual class.
Another interpretation of the network performance may be seen in terms of the following terminology:
- TP—true positives;
- TN—true negatives;
- FP—false positives;
- FN—false negatives.
TruePositive (TP) and TrueNegative (TN) are defined as the number of images that are classified correctly; FalsePositive (FP) and FalseNegative (FN) are defined as the number of images misclassified into another class.
One general metric for evaluating classification models is called accuracy A; i.e., the fraction of predictions that the model got correct.
Further, the following two matrices are used:
■ Precision P—correct proportion of positive identifications:
■ Recall R—correct proportion of actual positives:
These define the overall measure (called F1 in statistical analysis) of a model’s accuracy and combine precision and recall:
The measure F1 for a multiclass case with a number P of classes will be equal to the following [48]:
A comparison of the multilabel classification performance of the CNN is shown in Table 1. The results are presented for an exemplary PD image belonging to the “end” class from the test data set in the form of the accuracy A of the proper assignment to the actual class “end”. The result for the training and validation accuracy precision shows that a tradeoff should be made between the model complexity, the tuning of the hyperparameters and time constraints.

Table 1.
Exemplary comparison of PD image multilabel classification performance of CNN.
Different 2D convolution topologies were tested (usually with 64–128 filter channels); each stage was followed by the MaxPooling layer. Applying a lower number of filters (16–32) resulted in the rapid downgrading of the accuracy by 30%. Two types of kernel sizes were compared: 3 × 3 and 5 × 5 (input image size of 128 × 128 pixels; stride was equal to 2). It was noticed that mixing kernel sizes within consecutive convolution stages (e.g., 5 × 5, followed by 3 × 3) decreased the recognition performance. Up to four fully connected FC layers were tested (1024-1024-512-4). It was observed also that increasing the number of layers has certain limitations with respect to the accuracy and is done at the cost of network complexity and computational time. At a certain point, the network will reach an overfit, but this is a very complex topic since there is also an interplay between the number of neurons in each layer and the number of layers and other hyperparameters. This effect is highlighted in Table 1, rows 1 and 5, where the results show that topology 1024-1024-512-4 has an accuracy of 99.14%, while the reduced one, 1024-512-4, shows an oaccuracy of 99.21% for the same kernels. A tradeoff was observed between the numbers of convolutional layers and fully connected layers. The applied DropOut operation did not result in an improvement in accuracy (rather in an increased speed of calculation). The results presented above reflect the exemplary CNN’s performance and its resilience to manipulations of the network architecture and values of the hyperparameters.
7. Conclusions
This paper reports the application of a convolutional neural network to partial discharge images with the aim of recognizing the stages of aging of high-voltage electrical insulation. The presented example refers to the monitoring of electrical insulation deterioration. The PD images represented the phase-resolved patterns. The performance of the applied architecture was tested by manipulating the number of feature maps, the size of convolutional layers and kernels as well as the values of hyperparameters. The assessment was based on the recognition score, confusion matrix and accuracy metric. A tradeoff between these parameters was demonstrated.
PD images represent a new category of diagnostic evaluation, referring to qualitative analysis and defect discrimination. A system that requires no calibration in absolute units and in which qualitative discrimination could be performed by the analysis of the shapes of statistically accumulated images would be very desirable, especially in on-site diagnostics or monitoring measurements. This research direction is a currently visible trend in future autonomous PD expert systems. The most challenging aspects of today’s partial discharge image recognition are related to multi-source PD classification, the separation between real internal PDs and both noise and disturbances. Thus, future work will focus on adjusting the CNN architecture and hyperparameters for multi-source PD recognition for diagnostic applications.
Funding
This research received no external funding.
Conflicts of Interest
The author declares no conflict of interest.
References
- Gonzales, R.C. Deep convolutional neural networks. IEEE Signal Process. Mag. 2018, 11, 79–87. [Google Scholar] [CrossRef]
- Tadeusiewicz, R.; Chaki, R.; Chaki, N. Exploring Neural Networks with C#; CRC Press: Boca Raton, FL, USA, 2014; ISBN 1482233398. [Google Scholar]
- Niemeyer, L.; Fruth, B.; Gutfleisch, F. Simulation of partial discharges in insulation systems. In Proceedings of the 7th International Symposium on High Voltage Engineering (ISH’91), Dresden, Germany, 26–30 August 1991. [Google Scholar]
- Baumgartner, R.; Fruth, B.; Lanz, W.; Pettersson, K. Partial discharge—Part IX: PD in gas-insulated substations—Fundamental considerations. IEEE EI Mag. 1991, 7, 5–13. [Google Scholar]
- Fruth, B.; Niemeyer, L. The importance of statistical characteristics of partial discharge data. IEEE Trans. Electr. Insul. 1992, 27, 60–69. [Google Scholar] [CrossRef]
- Hozumi, N.; Okamoto, T.; Imajo, T. Discrimination of partial discharge patterns using a neural network. IEEE Trans. Electr. Insul. 1992, 27, 550–556. [Google Scholar] [CrossRef]
- Phung, B.T.; Blackburn, T.R.; James, R.E. The use of artificial neural networks in discriminating partial discharge patterns. In Proceedings of the IET 6th International Conference on Dielectric Materials, Measurements and Applications, Manchester, UK, 7–10 September 1992; pp. 25–28. [Google Scholar]
- Suzuki, H.; Endoh, T. Pattern recognition of partial discharge in XLPE cables using a neural network. IEEE Trans. Electr. Insul. 1992, 27, 543–549. [Google Scholar] [CrossRef]
- Florkowski, M. Partial discharge analyzer supported by neural network as a tool for monitoring and diagnosis. In Proceedings of the 8th International Symposium on High Voltage Engineering (ISH’93), Yokohama, Japan, 23–27 August 1993. [Google Scholar]
- Okamoto, T.; Hozumi, N. Partial discharge pattern recognition with a neural network system. In Proceedings of the 8th International Symposium on High Voltage Engineering (ISH’93), Yokohama, Japan, 23–27 August 1993. [Google Scholar]
- Okamoto, T.; Tanaka, T. Partial discharge pattern recognition for three kinds of model electrodes with a neural network. In Proceedings of the International Conference on Partial Discharge, Canterbury, UK, 28–30 September 1993; Volume 378, pp. 76–81. [Google Scholar]
- Hanai, E.; Oyama, M.; Aoyagi, H.; Murase, H.; Ohshima, I. Application of neural networks to diagnostic system of partial discharge in GIS. In Proceedings of the 8th International Symposium on High Voltage Engineering (ISH’93), Yokohama, Japan, 23–27 August 1993. [Google Scholar]
- Gulski, E.; Krivda, A. Neural network as a tool for recognition of partial discharges. IEEE Trans. Electr. Insul. 1993, 28, 984–1000. [Google Scholar] [CrossRef]
- Satish, L.; Zaengl, W.S. Artificial neural networks for recognition of 3-D partial discharge patterns. IEEE Trans. Dielectr. Electr. Insul. 1994, 1, 265–275. [Google Scholar] [CrossRef]
- Lee, J.; Hozumi, N.; Okamoto, T. Discrimination of phase-shifted partial discharge patterns by neural network using standarization method. In Proceedings of the 1994 IEEE International Symposium on Electrical Insulation (ISEI’94), Pittsburgh, PA, USA, 5–8 June 1994; pp. 314–317. [Google Scholar]
- Mazroua, A.A.; Bartnikas, R.; Salama, M.M.A. Discrimination between PD pulse shapes using different neural network paradigms. IEEE Trans. Dielectr. Electr. Insul. 1994, 1, 1119–1131. [Google Scholar] [CrossRef]
- Florkowski, M. Application of image processing techniques to partial discharge patterns. In Proceedings of the International Symposium on High Voltage Engineering, Graz, Austria, 28 August–1 September 1995; p. 5649. [Google Scholar]
- Cachin, C.; Wiesmann, H.J. PD recognition with knowledge-based preprocessing and neural networks. IEEE Trans. Dielectr. Electr. Insul. 1995, 2, 578–589. [Google Scholar] [CrossRef]
- Krivda, A. Automated recognition of partial discharges. IEEE Trans. Electr. Insul. 1995, 2, 796–821. [Google Scholar] [CrossRef]
- Hücker, T.; Kranz, H.G. Requirements of automated PD diagnosis systems for fault identification in noisy conditions. IEEE Trans. Dielectr. Electr. Insul. 1995, 2, 544–556. [Google Scholar] [CrossRef]
- Florkowski, M. Partial Discharge Image Recognition Using Neural Network for High Voltage Insulation Systems; Monographies No 45; AGH Publishing House: Kraków, Poland, 1996. [Google Scholar]
- Hoof, M.; Freisleben, B.; Patsch, R. PD source identification with novel discharge parameters using counterpropagation neural networks. IEEE Trans. Dielectr. Electr. Insul. 1997, 4, 17–32. [Google Scholar] [CrossRef]
- Kranz, H.G. Fundamentals in computer aided PD processing, PD pattern recognition and automated diagnosis in GIS. IEEE Trans. Dielectr. Electr. Insul. 2000, 2, 12–20. [Google Scholar] [CrossRef]
- Contin, A.; Cavallini, A.; Montanari, G.C.; Pasini, G.; Puletti, F. Artificial intelligence methodology for separation and classification of partial discharge signals. In Proceedings of the IEEE Conference on Electrical Insulation and Dielectric Phenomena, Victoria, BC, Canada, 15–18 October 2000. [Google Scholar]
- Bartnikas, R. Partial discharges and their mechanism, detection and measurement. IEEE Trans. Dielectr. Electr. Insul. 2002, 9, 763–808. [Google Scholar] [CrossRef]
- Wu, M.; Cao, H.; Cao, J.; Nguyen, H.; Gomes, J.B.; Krishnaswamy, S.P. An overview of state-of-the-art partial discharge analysis techniques for condition monitoring. IEEE Electr. Insul. Mag. 2015, 31, 22–35. [Google Scholar] [CrossRef]
- Catterson, V.M.; Sheng, B. Deep neural networks for understanding and diagnosing partial discharge data. In Proceedings of the IEEE Electrical Insulation Conference (EIC), Seattle, WA, USA, 7–10 June 2015; pp. 218–221. [Google Scholar]
- Masud, A.A.; Albarracín, R.; Ardila-Rey, J.A.; Muhammad-Sukki, F.; Illias, H.A.; Bani, N.A.; Munir, A.B. Artificial neural network application for partial discharge recognition: Survey and future directions. Energies 2016, 9, 574. [Google Scholar] [CrossRef]
- Li, G.; Wang, X.; Li, X.; Yang, A.; Rong, M. Partial discharge recognition with a multi-resolution convolutional neural network. Sensors 2018, 18, 3512. [Google Scholar] [CrossRef]
- Barrios, S.; Buldain, D.; Comech, M.P.; Gilbert, I.; Orue, I. Partial discharge classification using deep learning methods—Survey of recent progress. Energies 2019, 12, 2485. [Google Scholar] [CrossRef]
- Duan, L.; Hu, J.; Zhao, G.; Chen, K.; He, J.; Wang, S.X. Identification of partial discharges defects based on deep learning method. IEEE Trans. Power Deliv. 2019, 34, 1557–1568. [Google Scholar] [CrossRef]
- Peng, X.; Yang, F.; Wang, G.; Wu, Y.; Li, L.; Bhatti, A.A.; Zhou, C.; Hepburn, D.M.; Reid, A.J.; Judd, M.D.; et al. A convolutional neural network based deep learning methodology for recognition of partial discharge patterns from high voltage cables. IEEE Trans. Power Deliv. 2019, 34, 1460–1469. [Google Scholar] [CrossRef]
- Puspitasari, N.; Khayam, U.; Suwarno, S.; Kakimoto, Y.; Yoshikawa, H.; Kozako, M.; Hikita, H. Partial discharge waveform identification using image with convolutional neural network. In Proceedings of the 54th International Universities Power Engineering Conference (UPEC), Bucharest, Romania, 3–6 September 2019; pp. 1–4. [Google Scholar]
- Dai, J.; Teng, Y.; Zhang, Z.; Yu, Z.; Sheng, G.; Jiang, X. Partial discharge data matching method for GIS case-based reasoning. Energies 2019, 12, 3677. [Google Scholar] [CrossRef]
- Ullah, I.; Khan, R.U.; Yang, F.; Wuttisittikulkij, L. Deep learning image based defect detection in high voltage electrical equipment. Energies 2020, 13, 392. [Google Scholar] [CrossRef]
- Tuyet-Doan, V.-N.; Nguyen, T.-T.; Nguyen, M.-T.; Lee, J.-H.; Kim, Y.-H. Self-attention network for partial-discharge diagnosis in gas-insulated switchgear. Energies 2020, 13, 2102. [Google Scholar] [CrossRef]
- Song, S.; Qian, Y.; Wang, H.; Zang, Y.; Sheng, G.; Jiang, X. Partial discharge pattern recognition based on 3D graphs of phase resolved pulse sequence. Energies 2020, 13, 4103. [Google Scholar] [CrossRef]
- Li, S.; Nuchkrua, T.; Zhao, H.; Yuan, Y.; Boonto, S. Learning-based adaptive robust control of manipulated pneumatic artificial muscle driven by H2-based metal hydride. In Proceedings of the IEEE 14th International Conference on Automation Science and Engineering (CASE), Munich, Germany, 20–24 August 2018; pp. 1284–1289. [Google Scholar]
- Florkowski, M.; Florkowska, B.; Zydron, P. Partial discharge echo obtained by chopped sequence. IEEE Trans. Dielect. Electr. Insul. 2016, 23, 1294–1302. [Google Scholar] [CrossRef]
- Florkowski, M. Hyperspectral imaging of high voltage insulating materials subjected to partial discharges. Measurement 2020, 164, 108070. [Google Scholar] [CrossRef]
- Florkowski, M.; Krześniak, D.; Kuniewski, M.; Zydroń, P. Partial discharge imaging correlated with phase-resolved patterns in non-uniform electric fields with various dielectric barrier materials. Energies 2020, 13, 2676. [Google Scholar] [CrossRef]
- Cavallini, A.; Montanari, G.C.; Contin, A.; Puletti, F. A new approach to the diagnosis of solid insulation sytem based on PD signal inference. IEEE Electr. Insul. Mag. 2003, 19, 23–30. [Google Scholar] [CrossRef]
- Florkowska, B.; Florkowski, M.; Włodek, R.; Zydroń, P. Mechanism, Measurements and Analysis of Partial Discharges in Diagnostics of High Voltage Insulating Systems; PAN Press: Warszawa, Poland, 2001; ISBN 83-910387-5-0. (In Polish) [Google Scholar]
- Sahoo, N.C.; Salama, M.M.A.; Bartnikas, R. Trends in partial discharges pattern classification: A survey. IEEE Trans. Dielectr. Electr. Insul. 2005, 12, 248–264. [Google Scholar] [CrossRef]
- Florkowski, M. Influence of high voltage harmonics on partial discharge patterns. In Proceedings of the 5th International Conference on Properties and Applications of Dielectric Materials, Seoul, Korea, 25–30 May 1997. [Google Scholar]
- An End-To-End Open Source Machine Learning Platform. Available online: https://www.tensorflow.org/ (accessed on 21 May 2020).
- Scikit-Learn: Machine Learning in Python. Pedregosa et al. JMLR 12. 2011. Available online: https://scikit-learn.org/ (accessed on 3 July 2020).
- Kukanov, I.; Hautamäki, V.; Siniscalchi, S.M.; Li, K. Deep learning with maximal figure-of-merit cost to advance multi-label speech attribute detection. In Proceedings of the IEEE Spoken Language Technology Workshop, San Diego, CA, USA, 3–16 December 2016; ISBN 978-1-5090-4903-5. [Google Scholar]
Publisher’s Note: MDPI stays neutral with regard to jurisdictional claims in published maps and institutional affiliations. |
© 2020 by the author. Licensee MDPI, Basel, Switzerland. This article is an open access article distributed under the terms and conditions of the Creative Commons Attribution (CC BY) license (http://creativecommons.org/licenses/by/4.0/).