Article

Analysing the Material Suitability and Concentration Ratio of a Solar-Powered Parabolic trough Collector (PTC) Using Computational Fluid Dynamics

1
Department of Engineering, University of Exeter, Exeter EX4 4QF, UK
2
Ex-Environmental Engineering Department, School of Energy Resources, Environment, Chemical and Petrochemical Engineering, Egypt-Japan University of Science and Technology, Alexandria 21934, Egypt
3
City of Scientific Research and Technological Applications (SRTA), Alexandria 21934, Egypt
4
Water and Water structures Engineering Department, Faculty of Engineering, Zagazig University, Zagazig 44519, Egypt
*
Authors to whom correspondence should be addressed.
Energies 2020, 13(20), 5479; https://doi.org/10.3390/en13205479
Submission received: 9 June 2020 / Revised: 27 September 2020 / Accepted: 15 October 2020 / Published: 20 October 2020
(This article belongs to the Special Issue Accelerating the Adoption of Solar Energy towards a Low-Carbon Future)

Abstract

:
Solar-powered desalination is a sustainable solution for countries experiencing water scarcity. Several studies have presented different solutions to provide cleaner production in desalination systems. Parabolic trough collector (PTC) is one of these solutions that has proven to be superior among solar concentrators. Furthermore, a number of studies have investigated the use of PTC for distillation of saline water in response to water scarcity. In this study, a modified PTC model was developed, in which the heat exchanger was replaced by a condensation tube to reduce the energy consumption, and a black layer was introduced to the surface of the receiver to enhance its absorptance. As a reference case, the system productivity according to average solar intensities in Zagazig, located at 30°34′N 31°30′E in the North East of Egypt, is estimated. The results indicated that the maximum production rate that can be attained is 1.72 kg/h. Then, the structure of the system is evaluated with the aid of Computational Fluid Dynamics (CFD) modelling, in order to enhance its productivity. Many materials are examined and the results recognised copper as the most suitable material amongst marine grade metals (i.e., aluminium, galvanised steel and stainless steel) to construct the receiver tube. This is due to its superior thermal performance, satisfactory corrosion resistance, and acceptable cost. Afterwards, the selected receiver tube was employed to identify the optimal Concentration Ratio (CR). Consequently, a CR of 90.56 was determined to be the optimum value for Zagazig and regions with similar solar radiation. As a result, the system’s productivity was enhanced drastically, as it was estimated that a maximum production rate of 6.93 kg/h can be achieved.

1. Introduction

Freshwater represents only 3% of Earth’s water, whereas the remaining 97% is saline. Most of the freshwater resources are used for agriculture and plant cultivation. Population growth and industrialisation has caused overexploitation of the freshwater resources in some regions, such as the Middle East and North Africa, and this has led to the emergence of water scarcity [1]. Lack of freshwater has resulted in exponential desertification alongside an increase in water prices. The rise of water scarcity has encouraged the search for a technology that could compensate for the water shortage in these regions. Desalination of saline water could be an effective method for addressing the water scarcity problem. Desalination is the process of extracting minerals from saline water in order to produce potable water with standards for human consumption and irrigation. Conventional desalination is achieved by either employing thermal energy in order to allow the water to evaporate, and hence separate it from the minerals, or by the use of a membrane to execute the salt removal [2]. However, both methods require a significant amount of energy in order to carry out the process, which is primarily obtained from burning fossil-fuel. As a result, countries with limited resources will be unable to employ these techniques because of the high cost of natural energy resources (i.e., natural gas and diesel). Due to resource limitation, the long-term operation of the processes would be unsustainable. The use of solar energy as a renewable source for desalination has been widely researched, given the significant solar intensity, and the availability of solar energy throughout the year in the Middle East and North Africa [3].
However, despite its significant potential, solar energy has not been properly utilised in the Middle East and North Africa for power generation and desalination [4,5,6]. This is attributed to these regions’ heavy reliance on conventional desalination processes, as well as the availability of fossil fuels [7]. Nevertheless, a number of studies have been conducted concerning the employment of solar energy for desalination [7,8,9,10,11,12,13,14,15], and the results are promising. The availability of solar energy enables countries to utilise solar thermal technologies to acquire freshwater with minimal operational costs in comparison to conventional processes, and with less carbon footprint and a cleaner technology [16,17]. The conventional desalination methods such as Multi-stage Flash Distillation, Multiple Effect Distillation (MED) and Reverse Osmosis (RO) need 15.5 kWh (thermal energy and electricity), 7.5 kWh (thermal energy and electricity) and 3 kWh (electricity), respectively, to produce 1 m3 of potable water which corresponds to carbon footprints of 2.716, 1.164, 2.238 kg CO2 [18]. Therefore, cleaner solutions with reduced carbon footprints are required for desalination.
Qiblawey and Banat [19] studied the feasibility of thermal solar desalination by comparing different existing solar collection methods. Their evaluation was focussed upon the use of salinity-gradient ponds, flat plate collectors (FPC), evacuated tube collectors (ETC), and parabolic trough collectors (PTC). They concluded that the use of PTC is preferred due to its ability to raise the temperature drastically, whilst the other methods have a restricted capacity. Salinity ponds were identified as the second favoured technique in regions where land is inexpensive, as it is capable of developing and storing heat energy.
The use of photovoltaics (PV) to power reverse osmosis (RO) (without the use of batteries) has been investigated experimentally and computationally [20,21]. A maximum rate of 46.21 kg/h production was reported when the prototype was tested in the UK, and also estimated (using a MATLAB-Simulink model) a doubled rate in regions near the equator when a PV array of only 2.4 kWP is employed. In contrast, Kalogirou [22] studied the merger of solar collectors with conventional phase-change desalination procedures. His work was focussed on the incorporation of solar collectors with multiple-effect boiling (MEB). This selection was influenced by Porteous [23], who compared the MEB process with other desalination methods. Kalogirou utilised parabolic trough collectors (PTC) for steam generation, due to their maximal efficiency at high inlet temperatures when compared to other collectors [22]. This system was modelled according to Cyprus’ daily solar radiation of 1000–2000 kWh/m2 to predict its productivity with respect to the area occupied by the solar collectors. In this study, for areas of 10, 60, 540, and 2160 m2, maximum amounts of 0.26, 1.82, 20.32 and 83.54 kg/h were produced, respectively.
Zarza et al. [24] conducted a comparative study between the use of photovoltaics to power the RO process and the incorporation of the PTC in the MEB system. In addition, the incorporation of solar energy with phase-change desalination in regions of high pollution was investigated as the boiling process guarantees the absence of micro-germs in the product.
Al-Othman et al. [25] examined the merger of PTC and solar ponds with the multi-stage-flash (MSF) process in the UAE, where the solar intensity average is 6.3 kWh/m2 per day [26]. The study achieved a production rate of 57,914.11 kg/h of freshwater from 1,232,215.09 kg/h seawater feed. The obtained results indicated that 76% of the MSF energy requirements were satisfied by two PTCs with a total aperture area of 3160 m2, whilst the remainder was fulfilled by a four-meter depth solar pond with a surface area of 0.53 km2.
Nafaa et al. [27] evaluated the performance of a PV desalination system with the aid of MATLAB/Simulink software. The system comprised a solar cell, a DC/AC converter, a resistor load (evaporator) and a condenser connected to the evaporator. The PV converts the radiation into direct current, which then flows through the converter and leaves with an amplified voltage. Afterwards, it enters the resistor and the heater wire, respectively, in order to execute the evaporation process. Finally, vapour condenses in the heat exchanger. This model was simulated under different solar intensities; however, the highest flow rate of 2.952 kg/h of desalinated water was recorded at 1000 W/m2.
The use of solar stills for distilled water production was the first manifestation of direct solar desalination [28,29,30,31]. Nevertheless, Kabeel and Abdelgaied [3] reported a yield range of 0.08 to 0.15 kg/h for every m2. This motivated them to evaluate the incorporation of solar collectors with solar stills for the purpose of performance enhancement. They constructed a system with an improved solar still that comprised an oil heat exchanger and a phase change material (PCM) integrated with a parabolic trough concentrator (PTC) [3]. Oil was circulated through the collector and the heat exchanger in a closed loop, while the PCM was installed to perform as both latent and sensible heat storage. As the system operated, the saline water experienced an increase in its temperature due to the solar radiation absorbed by the absorber plate, as well as the high temperature oil flowing in the heat exchanger. The experimental data demonstrated an increase in the freshwater productivity of 140.4%, indicating a yield of 0.33 kg/h for every m2 for the enhanced solar still against a production rate of 0.14 kg/h for every m2 for the conventional solar still for solar intensity values between 360 and 1150 W/m2.
Behnam and Shafii [32] investigated the performance of a solar desalination system with an air bubble, column humidifier, evacuated tube collectors (ETC) and thermosyphon heat pipes (HP) in Tehran (solar intensity 3.5–4.5 kWh/m2 [33]). Their system was oriented to allow the ETC to increase the temperature of the HP and hence execute the humidification process. To enhance the heat and mass transfer, air bubbles were generated within the saline water contained by the humidifier. As air becomes saturated, it travels through an insulated duct into the dehumidifier, where it condenses against the coils that convey the cooling fluid. Additionally, they studied the performance of the system against the water level within the humidifier, the air flow and the fluid used to occupy the space between the ETC and the HP. Their conclusion was that the addition of oil to the space results in a production rate increase of 0.26 kg/h.m2 and an improved efficiency of 65%, while the other parameters had a negligible impact on the performance.
Schwarzer et al. [34] conducted a study on a parabolic trough concentrator with solar stills without a tracking system in solar intensities ranging between 200–1050 W/m2. They achieved a production rate of 0.46–0.55 kg/m2/h, which can increase to 1000–2000 litres of distilled water per day in large-scale units. Saettone [35] analysed the use of parabolic trough collectors solely for water desalination by testing them in solar radiation ranges between 700 and 850 W/m2. This system comprised a PTC with a length of 2.5 m, a 1m long absorber cavity made of black aluminium to guarantee the reception of reflected radiation, a copper tube and a heat exchanger. The test was performed upon three cavities: uninsulated, one-sided insulation layer and two-sided insulation with a glass cover for wind protection. Furthermore, a PV panel was used to power the heat exchange process. During operation, saline water flows through the absorber cavity at a controlled level, ensuring that the receiver is not completely full in order to maintain the structural integrity of the cavity. As a result, the saline water evaporates, and the vapour is extracted through the copper tube to the heat exchanger to execute the condensation process. The three tested cavities indicated production rates of 0.1, 0.17 and 0.2 kg/h of freshwater, demonstrating an improved performance for the thermally insulated and wind protected cavity. A similar system was also examined by Arun and Sreekumar [36] at solar intensities ranging from 415 to 715 W/m2. Initially, they investigated the performance of the system with a stainless steel receiver tube and glass covered copper by measuring the inlet and outlet temperatures. The results indicated a maximum outlet temperature of 75 °C for the stainless steel receiver, and an outlet temperature of 103 °C for the glass covered copper tube. Therefore, the latter was then employed during the testing of the system’s productivity and thermal efficiency. They achieved a yield of 2.3 kg/h (tested from 11:00 a.m. to 3:00 p.m.) and 12.74% efficiency (obtained for the maximum outlet temperature value). Narayanan and Vijay [37] studied the desalination of saline water by the use of parabolic trough collectors in India, where the solar radiation average is 5 kWh/m2/day. They employed an evacuated tube as a receiver and introduced a solar tracking system to the PTC for maximal radiation capture. Their results indicated an average production rate of 0.68 kg/h with a water quality that satisfies drinkable water standards.
Chaouchi et al. [38] performed an investigation on the performance of a solar desalination system utilising a solar parabolic dish. This type of collector can induce a greater increase in the fluid temperature due to its significant geometric concentration ratio (CR). They initially estimated the production rate theoretically by analysing the heat balance on the water mass and the receiver with the aid of the Gauss–Newton method. This indicated a maximum yield of 1.45 kg/h, corresponding to a solar radiation of 465 W/m2, whereas the experimental data demonstrated a maximum production rate of 1.27 kg/h, corresponding to the same solar intensity value.
Although the great potential of using PTC solely as a sustainable desalination procedure has been realised in several studies, prototypes were similar in terms of employing a heat exchanger to execute the condensation process. However, employing such principle can reduce the efficiency of this system, as an additional source of energy is required to operate the condenser. Furthermore, only Arun and Sreekumar [36] examined the utilisation of different materials for the receiver tube. Their work demonstrated an enhanced thermal performance for the evacuated copper tube while the stainless steel tube showed a lower efficiency. Nevertheless, the impact of seawater upon the examined materials was not explored to verify their suitability for freshwater production. Additionally, previous studies did not examine the effect of PTC’s geometric concentration ratio (CR) with respect to solar irradiation on the productivity of the system.
The aim of this study is to examine the feasibility of using PTC solely to desalinate water. The studied model will be similar to previous systems in terms of operation principle. However, the heat exchanger will be replaced by a large tube that surrounds the end of the receiver tube to allow the condensation to occur upon its surface. This is done to eliminate additional energy requirements. Subsequently, a combination of different materials to construct the receiver tube is assessed to test their effect on the system performance. This is achieved by Computational Fluid Dynamics (CFD) simulation. In addition, the required concentration ratio of the parabolic trough collector (PTC) to enhance the performance is identified by varying the receiver tube surface temperature using CFD modelling.

2. Materials and Methods

Figure 1 illustrates a conceptual configuration of a modified solar PTC desalination system. This system collects solar radiation and focusses it on the receiver tube to increase the temperature of the saline water in order to accelerate the evaporation of saline water flowing through it. The system allows the extraction of vapour induced from the receiver tube to execute the condensation process. In this system, saline water is directed into the collection tank by a submersible pump. This flow is controlled by a ball valve to eliminate overflow issues. The brine level within the tank achieves a certain level set by the level controller to ensure the receiver tube is filled to half only. This was done according to Saettone’s [35] methodology to prevent saltwater from entering the condensation tube. Afterwards, the circulated seawater experiences an increase in its temperature due to the high surface temperature of the receiver tube, caused by the concentrated radiation. Consequently, evaporation occurs, and the vapour escapes from the receiver tube through the four holes that are positioned 1.6 m from the inlet. Finally, the steam enters the condensation tube surrounding the holes and condenses against its surface, while the remaining brine within the tube returns to the reservoir to be recirculated. In this system, condensation tube is naturally cooled with ambient air. Therefore, eliminating energy needed form cooling.
In this system, the largest size available aluminium tube (152 mm) was chosen for the parabola to attain the highest concentration possible. Aluminium was selected due to its corrosion resistance when placed in the atmosphere, and its significant melting temperature. This helps to increase the durability of the collector, and to eliminate failures due to undesired radiation absorption. In addition, it was also selected to construct the condensation tube because of its relatively insignificant absorptivity, causing a negligible temperature increase due to radiation, and thus guaranteeing a satisfactory condensation rate. Flexible mirrors were placed inside the parabolic trough to allow the reflection of sunrays [39]. Additionally, a black layer was applied on the surface of the receiver tube to enhance its absorptivity. The condensation tube was designed based on the size (area) of the receiver tube where the holes are located in order to extract the water vapour and allow it to condense against its surface. This methodology is adopted to enhance the system’s efficiency by reducing the energy consumption (and hence a cleaner production), whereas studies explored in the literature review required an additional power source to operate the incorporated condenser. Table 1 portrays the initial PTC model’s specifications.
Parabolic Trough Collectors (PTCs) are designed to direct the solar radiation on to a single line along the receiver tube. The collector’s area is directly proportional to the magnification of solar energy received by the tube, whereas the receiver tube surface area is inversely proportional. This amplification is represented by the concentration ratio (CR) [42].
C R = A P T C A r t
According to Bellos and Tzivanidis [43], the amount of available solar beam irradiation ( Q ˙ s ) is a function of the collector area ( A P T C ), as well as the direct beam solar irradiation ( I b ).
Q ˙ s = A P T C × I b
This expression can be utilised to identify the amount of heat the receiver absorbs with the aid of the following equation:
Q ˙ a b s = Q ˙ s × η o p t i c a l
To simplify the calculation process, the optical efficiency value that will be substituted in Equation (4) will be the maximum optical efficiency.
η o p t i c a l m a x i m u m = α × τ × ρ c × S
where
S   = A P T C A s h a d d e d A P T C
Kalogirou [22] and Alarcón et al. [44] reported maximum thermal efficiency values between 40% and 65% for PTC. Harris and Lenz [45] found a maximum thermal efficiency of 60%–70% in their Parabolic dish concentrator system. This will be employed to predict the amount of useful heat energy in the system. Moreover, greater efficiency values will also be utilised to examine the system’s productivity when the losses are minimised.
η t h = Q ˙ u Q ˙ s = Q ˙ a b s   Q ˙ l o s s Q ˙ s
After the estimation of useful heat energy, the saline water outlet temperature can be computed using the equation below.
Q ˙ u = m ˙ s c p T o u t T i n
The outer surface temperature can then be obtained by substituting the acquired outlet temperature:
Q ˙ = U A T w T s .  
According to the theoretical method proposed by Chaouchi et al.’s [38] to calculate the distillation rate, the absorbed heat is equivalent to the evaporation heat flow ( Q v ˙ ) and the heat loss (i.e., convective and radiative). The latter was approximated in Equation (7) to identify the useful heat, which can be employed to determine Q v ˙ as demonstrated below.
Q ˙ u Q v ˙ = 0
where
Q v ˙ = m ˙ w × L v
The aforementioned theory is primarily employed to estimate the production rate of the system. For the construction of the receiver tube, the impact of seawater on the materials’ performance was considered using Computational Fluid Dynamics (CFD) modelling. After a suitable material was chosen for the condenser, the CFD model was used for the enhancement process. To conduct this analysis, the geometry of the system was constructed in SolidWorks (Dassault Systèmes, SolidWorks Corp., Waltham, MA, USA) and then imported to ANSYS Fluent 19.0 (ANSYS Inc., Canonsburg, PA, USA). The 3D geometry was meshed, and the material properties and boundary conditions were set. Prior to performing a CFD simulation, it is essential to conduct a mesh dependency study on the receiver tube to ensure grid independent results. Ideally, such a study is performed upon the analysed 3D model; however, the lack of computational resources imposed the use of a 2D model instead Initially, the elements size was varied from 15 mm to 5 mm until the convergence was realised as demonstrated in Figure 2. Then, another study was conducted to determine the required number of inflation layers to achieve grid independent results (Figure 3). Therefore, 8 mm element size (for cells) alongside 7 inflation layers were selected to be applied upon the 3D model. The receiver tube that was constructed in SolidWorks (see Figure 4) was imported into ANSYS Design Modeller to define the domains with the details in Table 2.
Firstly, the inner surface of the pipe was filled to allow the analysis of fluids within the receiver. Afterwards, the generated domain was divided to facilitate the assignment of both saline water and air regions. Finally, the boundary conditions (i.e., seawater inlet and outlet, water vapour outlets and outer surface of the receiver tube) were set in order that they could be adjusted during the simulation setup. The selection of a multiphase model was governed by the physics of the flow within the receiver tube, in which it is classified as an open channel flow. Therefore, the (Volume of Fluid) VOF model was chosen due to its superiority in terms of analysing such problems. Additionally, k-omega Shear Stress Transport (SST) turbulence model was selected to perform the CFD simulation of the receiver tube. This is attributed to its ability of solving a variety of problems accurately [46], as it converts the k-epsilon model into k-omega in the near-wall regions, whilst fully turbulent regions far from walls are analysed with aid of the standard k-epsilon model [47]. Furthermore, it is extensively employed to model heat transfer systems and recommended to be used alongside the VOF model [46]. Table 3 and Table 4 summarise the post-processing procedure adopted to perform the simulation.
The daily solar irradiation in Zagazig was identified to facilitate the estimation of the distillation rate (Figure 5).
Prior to performing the test, identifying the thermophysical properties of saline water is essential for both the theoretical calculations and the CFD simulation (see Table 4). The velocity of saline water is assumed to be 0.354 m/s, indicating a fully developed turbulent flow within the receiver tube.

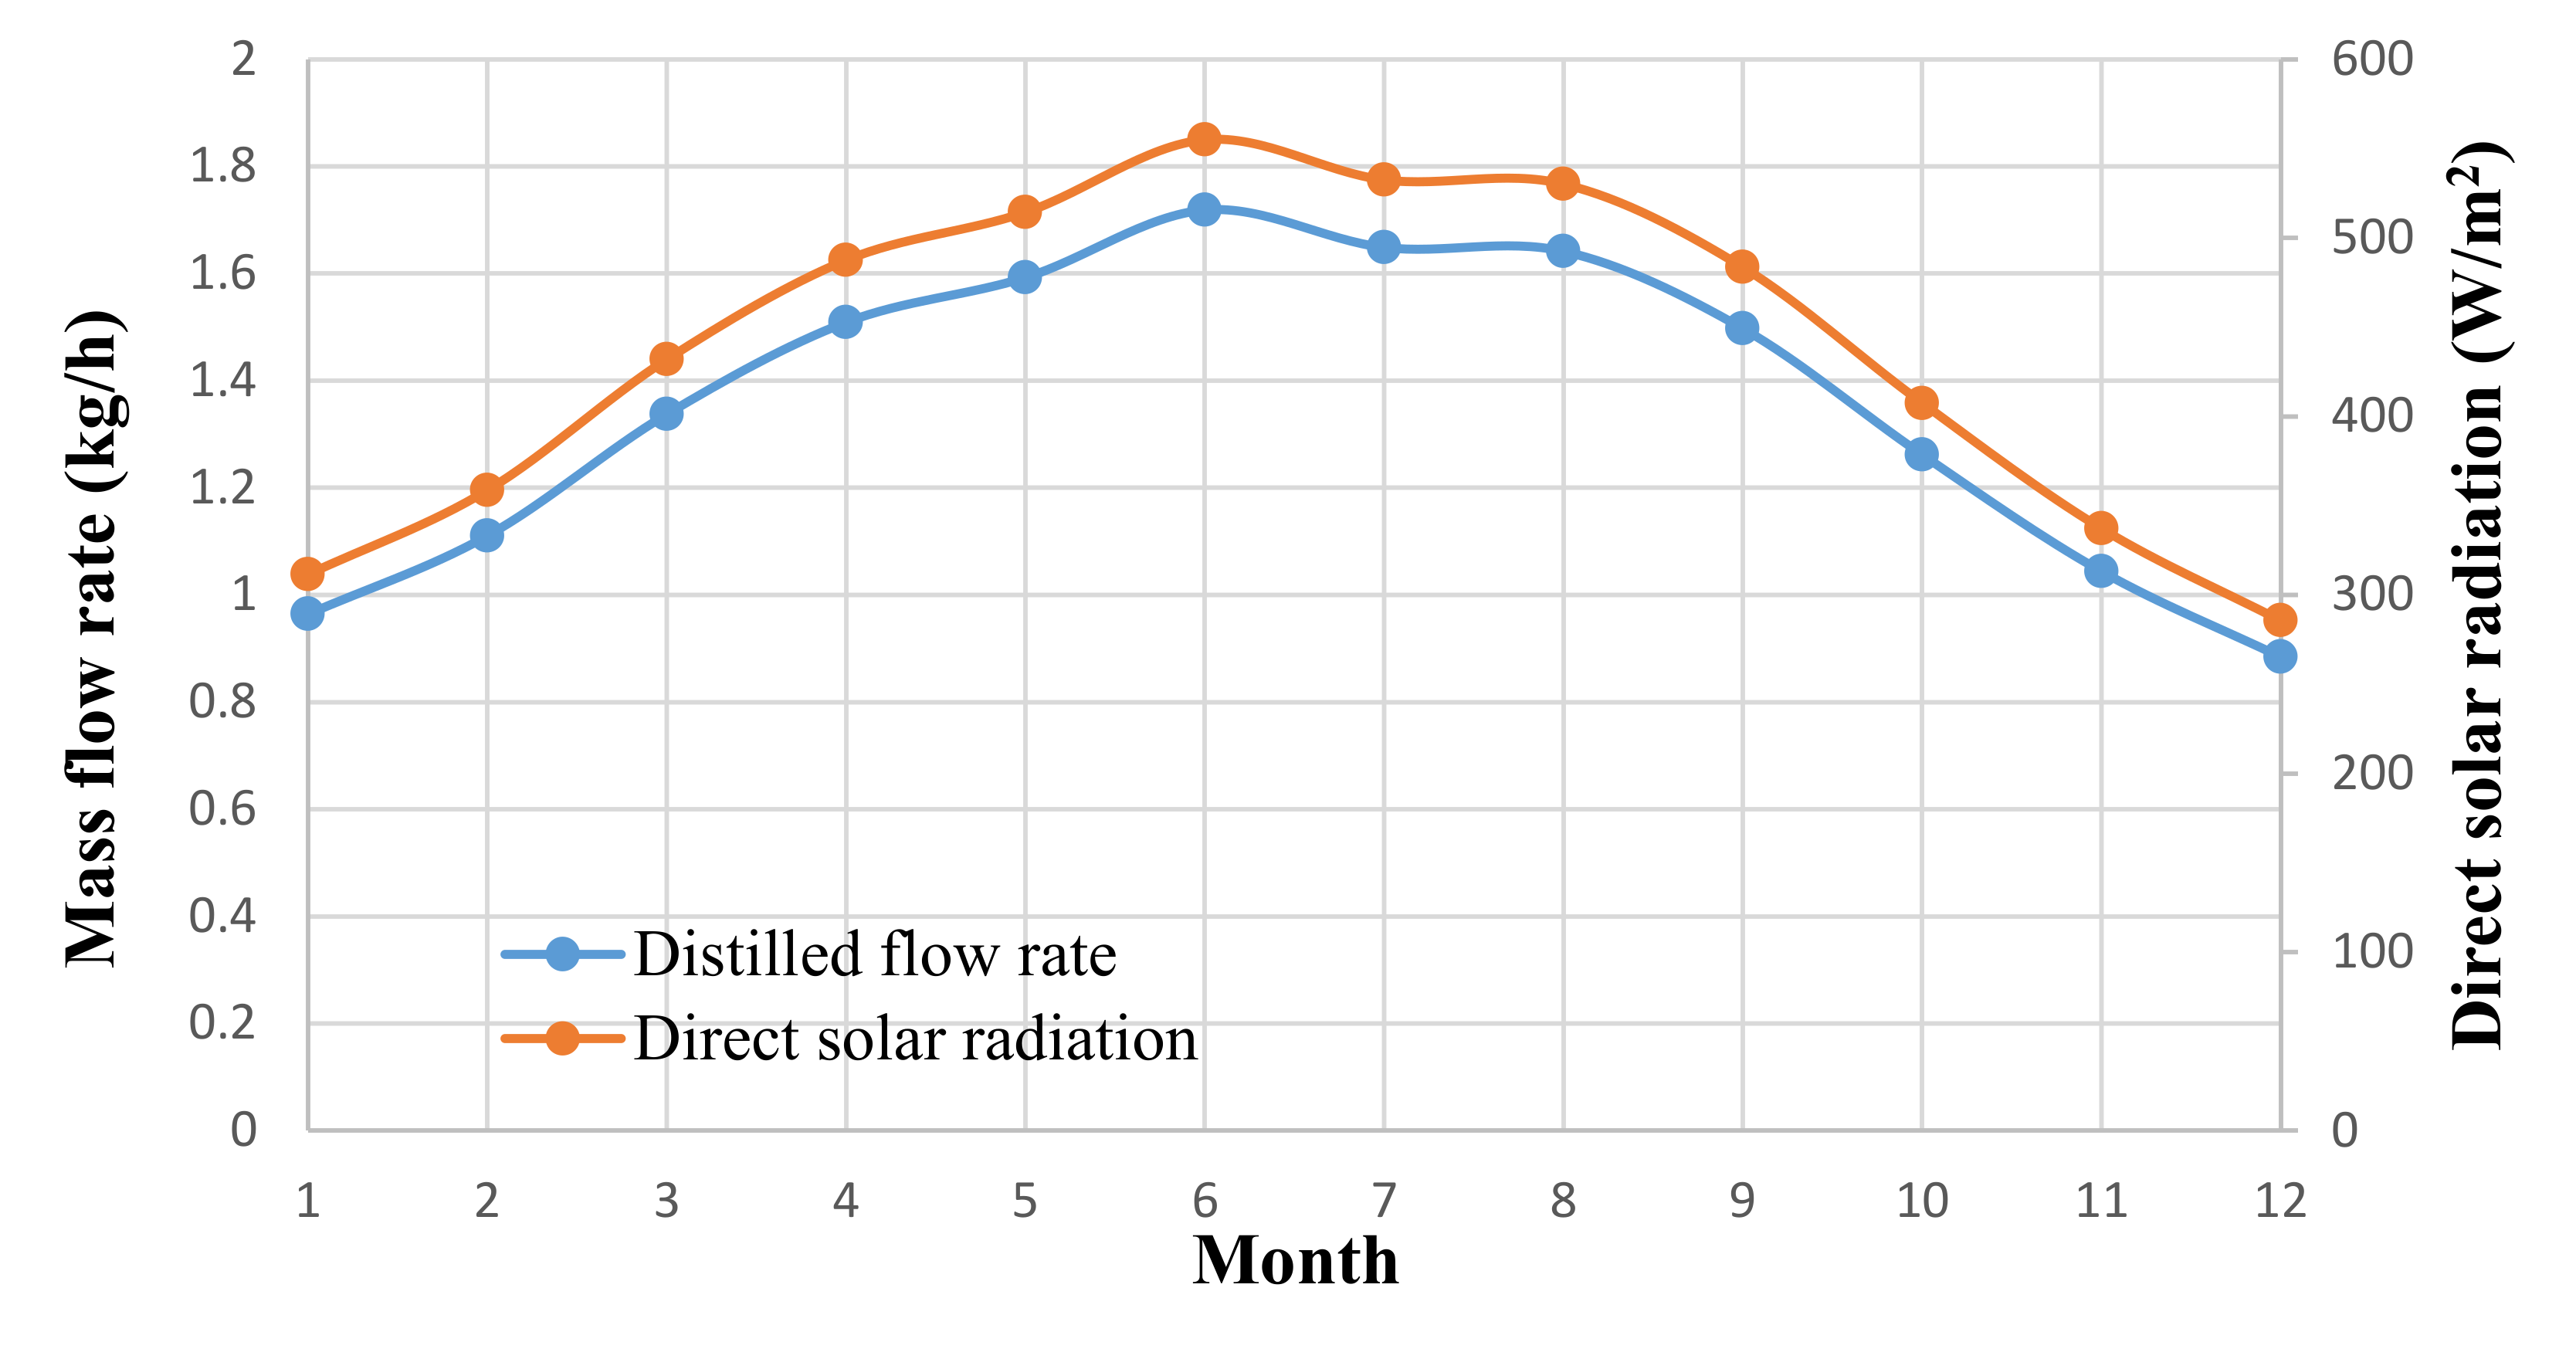
3. Results and Discussion

As a reference case, parameters that are shown in Table 1, seawater parameters indicated in Table 4 and average beam solar intensities of the case study of Zagazig were utilised to evaluate system productivity due to its high solar intensity [48]. This is achieved by firstly obtaining Q ˙ s using Equation (2), then employing Equation (6) to identify Q ˙ u at the lowest thermal efficiency reported in literature (40%) for a PTC system [22,41]. This was done to ensure an acceptable and comparable results in respect to the literature. Finally, Equations (9) and (10) were utilised to estimate the distilled flow rate (see Figure 6).
In addition, to analyse the functionality of the system, the receiver tube material was assessed using the CFD model for different marine grade metals: stainless steel, galvanised steel, aluminium and copper. This is done by inputting an arbitrary surface temperature of 100 °C to observe the increase in the seawater temperature, and then examining the thermal performance against the materials’ corrosivity when subjected to saline water as well as their cost. This then allowed the selection of most suitable receiver tube material.
Furthermore, using the CFD model, the surface temperature of the receiver tube is varied from 75 to 200 °C with an interval of 25 °C to identify the most suitable material for the receiver tube. This is performed to investigate the maximum vapour volume fraction induced within the domain and the brine outlet temperature as the surface temperature changes to compute Q ˙ u . It is then employed to determine Q ˙ s at the lowest thermal efficiency that was previously reported (40%). Then, the A P T C was calculated using the average direct solar intensities of the case study of Zagazig, in Egypt, in order to obtain CR, therefore allowing the determination of the required CR to induce a maximum vapour volume fraction that approach 1 while eliminating excessive increase in the vapour temperature. The latter is an essential factor to ensure that the condensation tube performs optimally.
Figure 6 allowed the observation of the production rate variation throughout the year in Zagazig. Moreover, it resulted in identifying 1.72 kg/h as the maximum production rate that can be attained in the reference case. Moreover, the thermal performance (i.e., brine outlet temperature and maximum vapour volume fraction) was assessed using the CFD model (see Figure 7 and Figure 8), whereas corrosivity parameters were acquired from previous studies (corrosion parameters: length: 50 mm, seawater temperature: 60 °C, experiment duration for corrosion potential: 24 h and corrosion rate experimental duration: 1 year) (Table 5). The evaluated materials demonstrated a comparable thermal performance. Nevertheless, copper was regarded as superior as a result of achieving a marginally greater brine outlet temperature and maximum vapour volume fraction. Furthermore, aluminium and galvanised steel indicated a poor performance in terms of corrosivity in contrast to stainless steel (grade 316) and copper. Therefore, employing them to construct the receiver tube was not considered despite their insignificant costs. Stainless steel (grade 316) showed the greatest corrosion resistance and cost among the examined metals, whereas copper possessed slightly less corrosion resistance and a moderate cost. Thus, copper receiver tube was deemed as the most suitable choice for such a system. The CR values indicated in Table 6 correspond to the optimum receiver tube (copper) surface temperature. Moreover, the examination of Figure 9 allowed the identification of 90.56 as an optimal CR value for Zagazig, as well as regions with similar solar intensities. This is attributed to its ability of realising a maximum vapour volume fraction that approaches 1 (0.94) at an outlet temperature of 111 °C. In contrast, lower CR values failed to generate a satisfactory vapour volume fraction. Whilst significantly greater CR figures achieved a comparable maximal vapour dryness; however, an excessive increase in the outlet temperature was observed. Nevertheless, this statement is valid only if the receiver tube is constructed of copper, and its size is equivalent to the size of the pipe employed in this investigation.
The improvement process resulted in alteration of the reference case design according to the targeted region (see Table 7).
However, parameters such as ρ c , α and τ remained unchanged. Furthermore, the maximal distilled flow rate of the improved system was estimated to be 6.93 kg/h, indicating a significant enhancement by 403% to the system’s performance for Zagazig.
However, productivities of the initial and improved system were estimated theoretically and therefore testing this system is vital to determine the reliability of the adopted theoretical model. Furthermore, experimenting the proposed design principle is essential in order to evaluate the functionality of utilising the condensation tube instead of the heat exchanger to execute the condensation process. The reference case could potentially produce 1.72 litres/h at the observed thermal efficiency in Zagazig, surpassing the maximal yield reported by Chaouchi et al. [38] (1.27 litres/h), with minimal carbon footprint. Nevertheless, the maximal productivity of this system was inferior to Nafaa et al. [27] and Arun and Sreekumar’s [36] highest production rates (2.952 kg/h and 2.3 kg/h, respectively), because of design’s CR and the utilisation of stainless steel (grade 316) as a receiver tube. However, the improvement procedure resulted in enhancing the system’s productivity drastically. This was realised by observing Figure 10, as the lowest output estimated for the enhanced design was greater than maximal yields reported in the literature for direct solar desalination systems.
The developed model showed that the proposed design can be effortlessly operated to distil seawater, thus facilitating the utilisation of this technology in regions that suffer from water scarcity, instead of or conjointly with solar stills.
In addition, the proposed system’s sustainability can be improved by addressing environmental problems resulting from disposal of the rejected water (brine) into the sea. Therefore, future research could evaluate the merger of salinity ponds with this technology.

4. Conclusions

This investigation developed a PTC system model to distil seawater in the Middle East and North Africa using a cleaner sustainable technology in response to water scarcity. The designed model differed from previous systems in terms of the replacement of the heat exchanger by a condensation tube and the introduction of a black layer to the receiver tube. This was done to enhance the system’s efficiency and increase the receiver tube absorptance, respectively. It was estimated that the model can achieve a maximum production rate of 1.72 kg/h in the case study area at the reference case. However, CFD modelling was employed to improve its productivity in order to surpass direct desalination systems yields. Firstly, copper was identified as the most suitable material to construct the receiver tube due to its superior thermal performance, insignificant corrosivity and acceptable price. Then, a CR value of 90.56 was recognised as optimum as it was able to induce a maximum vapour volume fraction that approaches 1 without causing excessively increasing in the vapour outlet temperature. Consequently, the system’s production rate was improved dramatically, as a maximal production rate of 6.93 kg/h was estimated to be attained in Zagazig.

Author Contributions

Conceptualization, M.A., A.A.J., M.D.; methodology, M.A., H.A.; software, M.A., H.A.; validation, M.A., H.A.; formal analysis, M.A., H.A.; investigation, M.A., A.A.J. A.N.; resources, M.A., A.A.J.; data curation, M.A., H.A.; writing—original draft preparation, M.A., H.A., A.H.S.; writing—review and editing, M.A., M.D., A.A.J. R.F., A.N., H.E.S.F., A.H.S.; visualization, H.A., M.A.; supervision, M.A., A.A.J.; project administration, M.A.; funding acquisition, A.A.J., A.N., R.F. All authors have read and agreed to the published version of the manuscript.

Funding

This paper is based on work that was supported by Science, Technology, and Innovation Funding. Authority (STIFA) of Egypt, Grant No. (30771) and the British Council (BC) of UK, Grant No. (332435306), through the project titled “A Novel Standalone Solar-Driven Agriculture Greenhouse-Desalination System: That Grows its Energy and Irrigation Water” via the Newton–Mosharafa funding scheme.

Acknowledgments

The authors would like to acknowledge the help of Julian Yates and Jordi Castan Guillen (technical staff at Exeter University).

Conflicts of Interest

The authors declare no conflict of interest.

Nomenclature

ρ : Saline water density (kg/m3)
V : Saline water velocity (m/s)
D : Receiver tube inner diameter (m)
μ : Dynamic viscosity of saline water (kg/m·s)
c p : Specific heat capacity (J/K)
k s : Saline water thermal conductivity (W/m K)
A PTC : Surface area of the collector (m2)
A rt : Surface area of the receiver tube (m)
P : Pressure (Pa)
S Mx : External forces (N)
S My : External forces (N)
S Mz : External forces (N)
Φ : Dissipation function to describe viscous stresses effects
S i : External forces (N)
m ˙ v e : Mass transfer from the liquid phase to the vapour phase (kg/s/m3)
r :   Mass transfer intensity factor (s−1)
α l : Phase volume fraction
ρ i : Density of the fluid (kg/m3)
T : Temperature of the liquid (°C)

References

  1. Allan, T. The Middle East Water Question: Hydropolitics and the Global Economy; Bloomsbury Publishing: London, UK, 2012. [Google Scholar]
  2. Al-Karaghouli, A.A.; Kazmerski, L. Renewable energy opportunities in water desalination. In Desalination, Trends and Technologies; 2011; pp. 149–184. Available online: https://www.intechopen.com/books/desalination-trends-and-technologies/renewable-energy-opportunities-in-water-desalination (accessed on 10 May 2020).
  3. Kabeel, A.E.; Abdelgaied, M. Observational study of modified solar still coupled with oil serpentine loop from cylindrical parabolic concentrator and phase changing material under basin. Sol. Energy 2017, 144, 71–78. [Google Scholar] [CrossRef]
  4. Abdelrassoul, R.A. Potential for economic solar desalination in the Middle East. Renew. Energy 1998, 14, 345–349. [Google Scholar] [CrossRef]
  5. Moser, M.; Trieb, F.; Fichter, T. Potential of concentrating solar power plants for the combined production of water and electricity in MENA countries. J. Sustain. Dev. Energy Water Environ. Syst. 2013, 1, 122–140. [Google Scholar] [CrossRef] [Green Version]
  6. Breyer, C.; Gerlach, A.; Beckel, O.; Schmid, J. Value of solar PV electricity in MENA region. In Proceedings of the 2010 IEEE International Energy Conference, Manama, Bahrain, 18–22 December 2010. [Google Scholar]
  7. Tsikalakis, A.; Tomtsi, T.; Hatziargyriou, N.; Poullikkas, A.; Malamatenios, C.; Giakoumelos, E.; Jaouad, O.C.; Chenak, A.; Fayek, A.; Matar, T. Review of best practices of solar electricity resources applications in selected Middle East and North Africa (MENA) countries. Renew. Sustain. Energy Rev. 2011, 15, 2838–2849. [Google Scholar] [CrossRef]
  8. Fath, H.E.S.; Ghazy, A. Solar desalination using humidification—Dehumidification technology. Desalination 2002, 142, 119–133. [Google Scholar] [CrossRef]
  9. Mosleh, H.J.; Mamouri, S.J.; Shafii, M.; Sima, A.H. A new desalination system using a combination of heat pipe, evacuated tube and parabolic trough collector. Energy Convers. Manag. 2015, 99, 141–150. [Google Scholar] [CrossRef]
  10. Nafey, A.S.; Fath, H.E.S.; El-Helaby, S.O.; Soliman, A. Solar desalination using humidification–dehumidification processes. Part II. An experimental investigation. Energy Convers. Manag. 2004, 45, 1263–1277. [Google Scholar] [CrossRef]
  11. Qtaishat, M.R.; Banat, F. Desalination by solar powered membrane distillation systems. Desalination 2013, 308, 186–197. [Google Scholar] [CrossRef]
  12. AlMadani, H. Water desalination by solar powered electrodialysis process. Renew. Energy 2003, 28, 1915–1924. [Google Scholar] [CrossRef]
  13. Tong, X.; Liu, S.; Chen, Y.; Crittenden, J. Thermodynamic analysis of a solar thermal facilitated membrane seawater desalination process. J. Clean. Prod. 2020, 256, 120398. [Google Scholar] [CrossRef]
  14. Santosh, R.; Arunkumar, T.; Velraj, R.; Kumaresan, G. Technological advancements in solar energy driven humidification-dehumidification desalination systems—A review. J. Clean. Prod. 2019, 207, 826–845. [Google Scholar] [CrossRef]
  15. Sharon, H.; Reddy, K. A review of solar energy driven desalination technologies. Renew. Sustain. Energy Rev. 2015, 41, 1080–1118. [Google Scholar] [CrossRef]
  16. Fath, H.E. Solar distillation: A promising alternative for water provision with free energy, simple technology and a clean environment. Desalination 1998, 116, 45–56. [Google Scholar] [CrossRef]
  17. Ullah, I.; Rasul, M.G. Recent Developments in Solar Thermal Desalination Technologies: A Review. Energies 2019, 12, 119. [Google Scholar] [CrossRef] [Green Version]
  18. Liu, J.; Chen, S.; Wang, H.; Chen, X. Calculation of carbon footprints for water diversion and desalination projects. Energy Procedia 2015, 75, 2483–2494. [Google Scholar] [CrossRef] [Green Version]
  19. Qiblawey, H.M.; Banat, F. Solar thermal desalination technologies. Desalination 2008, 220, 633–644. [Google Scholar] [CrossRef]
  20. Thomson, A.M. Reverse-Osmosis Desalination of Seawater Powered by Photovoltaics without Batteries. Ph.D. Thesis, Loughborough University, Loughborough, UK, 2003. [Google Scholar]
  21. Lacroix, C.; Perier-Muzet, M.; Stitou, D. Dynamic Modeling and Preliminary Performance Analysis of a New Solar Thermal Reverse Osmosis Desalination Process. Energies 2019, 12, 4015. [Google Scholar] [CrossRef] [Green Version]
  22. Kalogirou, S. Use of parabolic trough solar energy collectors for sea-water desalination. Appl. Energy 1998, 60, 65–88. [Google Scholar] [CrossRef]
  23. Porteous, A. Saline Water Distillation Processes; Longman: London, UK, 1975. [Google Scholar]
  24. Zarza, E.; Ajona, J.; León, J.; Gregorzewski, A.; Genthner, K. Solar thermal desalination project at the Plataforma Solar de Almeria. Sol. Energy Mater. 1991, 24, 608–622. [Google Scholar] [CrossRef]
  25. Al-Othman, A.; Tawalbeh, M.; Assad, M.E.H.; Alkayyali, T.; Eisa, A. Novel multi-stage flash (MSF) desalination plant driven by parabolic trough collectors and a solar pond: A simulation study in UAE. Desalination 2018, 443, 237–244. [Google Scholar] [CrossRef]
  26. Assi, A.; Jama, M. Estimating global solar radiation on horizontal from sunshine hours in Abu Dhabi–UAE. In Proceedings of the Advances in Energy Planning, Environmental Education and Renewable Energy Sources, Proceedings of the 4th WSEAS International Conference on Renewable Energy Sources, Kantaoui, Sousse, Tunisia, 3–6 May 2010. [Google Scholar]
  27. Nafaa, H.; Farhat, M.; Lassaad, S. A PV water desalination system using backstepping approach. In Proceedings of the 2017 International Conference on Green Energy Conversion Systems (GECS), Hammamet, Tunisia, 23–25 March 2017. [Google Scholar]
  28. Kalogirou, S.A. Solar Energy Engineering: Processes and Systems; Academic Press: Amsterdam, The Netherlands, 2013. [Google Scholar]
  29. Parsa, S.M.; Rahbar, A.; Javadi, Y.D.; Koleini, M.; Afrand, M.; Amidpour, M. Energy-matrices, exergy, economic, environmental, exergoeconomic, enviroeconomic, and heat transfer (6E/HT) analysis of two passive/active solar still water desalination nearly 4000m: Altitude concept. J. Clean. Prod. 2020, 261, 121243. [Google Scholar] [CrossRef]
  30. Salah, A.H.; Hassan, G.E.; Fath, H.; Elhelw, M.; Elsherbiny, S. Analytical investigation of different operational scenarios of a novel greenhouse combined with solar stills. Appl. Therm. Eng. 2017, 122, 297–310. [Google Scholar] [CrossRef]
  31. Akrami, M.; Salah, A.H.; Dibaj, M.; Porcheron, M.; Javadi, A.A.; Farmani, R.; Fath, H.E.; Negm, A. A Zero-Liquid Discharge Model for a Transient Solar-Powered Desalination System for Greenhouse. Water 2020, 12, 1440. [Google Scholar] [CrossRef]
  32. Behnam, P.; Ghasempour, R. Examination of a solar desalination system equipped with an air bubble column humidifier, evacuated tube collectors and thermosyphon heat pipes. Desalination 2016, 397, 30–37. [Google Scholar] [CrossRef]
  33. Ahmad, F. Valuation of solar power generating potential in Iran desert areas. J. Appl. Sci. Environ. Manag. 2018, 22, 967. [Google Scholar] [CrossRef] [Green Version]
  34. Schwarzer, K.; Da Silva, E.V.; Hoffschmidt, B.; Schwarzer, T. A new solar desalination system with heat recovery for decentralised drinking water production. Desalination 2009, 248, 204–211. [Google Scholar] [CrossRef]
  35. Saettone, E.A. Desalination using a parabolic-trough concentrator. Appl. Sol. Energy 2012, 48, 254–259. [Google Scholar] [CrossRef]
  36. Arun, C.; Sreekumar, P. Modeling and performance evaluation of parabolic trough solar collector desalination system. Mater. Today Proc. 2018, 5, 780–788. [Google Scholar] [CrossRef]
  37. Narayanan, S.R.; Vijay, S. Desalination of water using parabolic trough collector. Mater. Today Proc. 2020, 21, 375–379. [Google Scholar] [CrossRef]
  38. Chaouchi, B.; Zrelli, A.; Gabsi, S. Desalination of brackish water by means of a parabolic solar concentrator. Desalination 2007, 217, 118–126. [Google Scholar] [CrossRef]
  39. Panahi, R.; Khanjanpour, M.H.; Javadi, A.A.; Akrami, M.; Rahnama, M.; Ameri, M. Analysis of the thermal efficiency of a compound parabolic Integrated Collector Storage solar water heater in Kerman, Iran. Sustain. Energy Technol. Assess. 2019, 36, 100564. [Google Scholar] [CrossRef]
  40. Jamali, H. Investigation and review of mirrors reflectance in parabolic trough solar collectors (PTSCs). Energy Rep. 2019, 5, 145–158. [Google Scholar] [CrossRef]
  41. Gad, H.; El-Gayar, S. Absorptance of Different Local Coated Surfaces to Global Solar Radiation in Egypt. J. Sol. Energy Res. 2016, 1, 18–24. [Google Scholar]
  42. Zheng, H. Chapter 2—Solar Energy Utilization and Its Collection Devices. In Solar Energy Desalination Technology; Zheng, H., Ed.; Elsevier: Amsterdam, The Netherlands, 2017; pp. 47–171. [Google Scholar]
  43. Bellos, E.; Tzivanidis, C. Thermal analysis of parabolic trough collector operating with mono and hybrid nanofluids. Sustain. Energy Technol. Assess. 2018, 26, 105–115. [Google Scholar] [CrossRef]
  44. Alarcón, J.A.; Hortúa, J.E.; Lopez, A. Design and construction of a solar collector parabolic dish for rural zones in Colombia. Tecciencia 2013, 7, 14–22. [Google Scholar] [CrossRef]
  45. Harris, J.A.; Lenz, T.G. Thermal performance of solar concentrator/cavity receiver systems. Sol. Energy 1985, 34, 135–142. [Google Scholar] [CrossRef]
  46. Andersson, B. Computational Fluid Dynamics For Engineers; Cambridge University Press: Cambridge, UK, 2012; pp. 89–100. [Google Scholar]
  47. Versteeg, H.; Malalasekera, W. An Introduction to Computational Fluid Dynamics; Pearson Education Ltd.: Harlow, UK, 2007; pp. 91–92. [Google Scholar]
  48. Akrami, M.; Gilbert, S.J.; Dibaj, M.; Javadi, A.A.; Farmani, R.; Salah, A.H.; Fath, H.E.S.; Negm, A. Decarbonisation Using Hybrid Energy Solution: Case Study of Zagazig, Egypt. Energies 2020, 13, 4680. [Google Scholar] [CrossRef]
  49. Global Solar Atlas. Available online: https://globalsolaratlas.info/map (accessed on 10 May 2020).
  50. Compere, C.; Le Bozec, N. Behaviour of stainless steel in natural seawater. In Proceedings of the First Stainless Steel Congress in Thailand, Bangkok, Thailand, 15–17 December 1997. [Google Scholar]
  51. Heiser, J.H.; Poo, S. Corrosion of Barrier Materials in Seawater Environments. 1995, Brookhaven National Lab. Available online: https://inis.iaea.org/search/search.aspx?orig_q=RN:27032332 (accessed on 10 May 2020).
  52. Al-Moubaraki, A.H.; Al-Rushud, H.H. The red sea as a corrosive environment: Corrosion rates and corrosion mechanism of aluminum alloys 7075, 2024, and 6061. Int. J. Corros. 2018. [Google Scholar] [CrossRef] [Green Version]
  53. Tulhill, A. Guidelines for the use of copper alloys in seawater 11. Mater. Perform. 1987, 26, 13–22. [Google Scholar]
  54. Diaconu, A.; Solomon, C.; Benea, L.; Dumitraşcu, V.; Mardare, L. Corrosion Resistance of Zinc Coated Steel in Sea Water Environment. Ann. Dunarea Jos Univ. Galati Fascicle IX Metall. Mater. Sci. 2015, 38, 34–39. [Google Scholar]
Figure 1. A Schematic presentation the Parabolic Trough Collector (PTC) operation.
Energies 13 05479 g001
Figure 2. Mesh convergence study by varying elements’ size from 15 mm to 5 mm.
Energies 13 05479 g002
Figure 3. Inflation layer convergence study by varying number of layers from 1 to 9.
Energies 13 05479 g003
Figure 4. Parabolic trough Collector in (a) 3D and (b) 2D with dimensions in mm.
Energies 13 05479 g004
Figure 5. Annual solar irradiation for Zagazig [49].
Energies 13 05479 g005
Figure 6. Freshwater production rate variation throughout the year according to a thermal efficiency of 40% for the reference case.
Energies 13 05479 g006
Figure 7. Temperature contours corresponding to surface temperature (100 °C) for different receiver tube materials.
Energies 13 05479 g007
Figure 8. Vapour volume fraction contours corresponding to an outer surface temperature of 100 °C for different receiver tube materials.
Energies 13 05479 g008
Figure 9. Evaluation of the obtained CR integers with respect to the maximum vapour volume fraction and outlet temperature to determine the optimal CR, for Zagazig.
Energies 13 05479 g009
Figure 10. Improved system distilled flow rate variation with respect to average beam solar radiation.
Energies 13 05479 g010
Table 1. Initial designed PTC model.
Feature/Parameter A P T C  
(m2)
A r t
(m2)
Receiver Tube Size C R ρ c α τ S η o p t i c a l (maximum)
Value0.360.15 m2Outer diameter: 32 mm, thickness: 4 mm2.40.9 [40]0.886 [41]10.580.47
Table 2. Seawater thermophysical properties at 34 °C.
ParameterValue
ρ (at 34 °C)1020 kg/m3
c p (at 34 °C)4011 kJ/kgK
μ (at 34 °C)0.00087 Ns/m2
h 1765.82 W/m2K
L v 334 kJ/kg
Table 3. Multiphase modelling set-up.
Multiphase ModelVolume Fraction Parameters (Formulation)Body Force FormulationVOF Sub-ModelsInterface ModellingSurface Tension Coefficient (n/m)
Volume of Fluid (VOF)ImplicitImplicit body forceOpen channel flowSharp0.07 [48]
Table 4. Turbulence modelling set-up.
Turbulence ModelTurbulence Intensity (%)Turbulence Viscosity Ratio
k-omega SST510
Table 5. Comparative analysis between marine grade metals to construct the receiver tube according to the thermal performance, corrosivity, and cost.
MaterialBrine Outlet Temperature (°C)Maximum Vapour Volume FractionCorrosion Potential (mV)Corrosion Rate (miles/year)Receiver Tube Cost ($)
Stainless steel (grade 316)62.5 0.00523 −180 [50]0.59 [51]149.38
Aluminium (Al 6061)67.70.065 −1035 [52]3.1496 [51]23.55
Copper67.740.072 −330 [53]1 [53]33.38
Galvanised steel67.420.0428 −1055.9 [54]7.6 [54]14.48
Table 6. Concentration Ratio (CR) values required for different outer surface temperatures according to Zagazig solar intensities.
Outer Surface Temperature (°C)Required CR in Zagazig
7534.67
10055.54
12575.56
15090.36
175117.30
200181.56
Table 7. Improved PTC desalination system design specifications for Zagazig.
Feature/Parameter A P T C  
(m2)
A r t
(m2)
Receiver Tube Size C R ρ c α τ S η o p t i c a l (maximum)
Value13.6300.150Outer diameter: 32 mm, thickness:4 mm90.3600.9 [40]0.886 [41]10.9890.789
Publisher’s Note: MDPI stays neutral with regard to jurisdictional claims in published maps and institutional affiliations.

