Article

Numerical Simulation and Experimental Investigation of Temperature and Residual Stress Distributions in a Circular Patch Welded Structure

1
Bestprojekt d.o.o., Bureau of Energetic and Mechanical Engineering Ltd., Petrovaradinska 7, 10000 Zagreb, Croatia
2
LTEF Laboratory for Thermodynamics and Energy Efficiency, Faculty of Electrical Engineering, Mechanical Engineering and Naval Architecture, University of Split, Ruđera Boškovića 32, 21000 Split, Croatia
3
Faculty of Mechanical Engineering and Naval Architecture, University of Zagreb, Ivana Lučića 5, 10000 Zagreb, Croatia
*
Author to whom correspondence should be addressed.
Energies 2020, 13(20), 5423; https://doi.org/10.3390/en13205423
Submission received: 28 September 2020 / Revised: 14 October 2020 / Accepted: 15 October 2020 / Published: 17 October 2020
(This article belongs to the Special Issue Numerical Modeling and Machine Learning Techniques)

Abstract

:
In this study, we performed a numerical simulation and experimental measurements on a steel circular patch welded structure to investigate the temperature and residual stress field distributions caused by the application of buried-arc welding technology. The temperature histories during the welding and subsequent cooling process were recorded for two locations, with the thermocouples mounted inside the plate close to the weld bead. On the upper surface of the welded model, the temperature-time changes during the cooling process were monitored using an infrared camera. The numerically calculated temperature values correlated well with the experimentally measured ones, while the maximum deviation of the measured and calculated temperatures was within 9%. Based on the numerical result analysis regarding circumferential and radial stresses after the completion of the welding process, it is concluded that both stresses are primarily tensile within the circular disk. Outside the disk, the circumferential stresses turn from tensile to compressive, while on the other hand the radial stresses disappear towards the ends of the plate.

1. Introduction

Metal active gas (MAG) welding is one the most reliable procedures for joining various structural components. MAG is applied in many industries due to its low manufacturing cost and fast yet simple performance. While conducting this technique, a large amount of molten wire metal fills the groove between the structural components of the base material. As the heat input of the filler material is very high and its cooling rate is rapid afterwards, permanent plastic deformations and residual stresses occur in the weld area and its vicinity [1,2,3,4,5]. The plastic deformations disturb the external appearance of the welded structure making its assembly difficult. Removing such deformations with mechanical or thermal procedures [6,7,8,9] is often a time consuming task, which significantly impacts the final price of the welded structure. On the other hand, the residual stresses in the weld and the heat affected zone can promote crack initiation, especially in dynamically loaded structures.
Since the occurrence of residual stresses and deformations due to welding is an inevitable phenomena, it is necessary to know their distribution as accurately as possible in order to take adequate measures already at the design stage to reduce them. For this purpose, it is reasonable to apply numerical methods in order to avoid expensive experimental measurements [10,11,12,13,14,15,16]. Regarding the above mentioned residual stresses and deformations caused by MAG welding, there are numerous numerical and experimental studies in the scientific literature for all important forms of welded structures, some of which are elaborated below.
Based on the experimental measurements, Adamczuk et al. [17] presented a methodology for angular deformation predictions for multi pass butt-welded steel plates. Costa et al. [18] investigated residual stresses numerically and experimentally and compared them using the X-ray procedure due to cold-wire and conventional MAG welding. In their work, Heinze et al. [19] studied the influence of thermal material properties on the weld pool size and metallurgical properties of welded joints. Furthermore, Kung et al. [20] numerically simulated and experimentally measured the influence of a welding jig position on the residual stresses and deformations for a multi pass butt-welded sample. Deng et al. [21] took into account geometrical and material nonlinearities and investigated the influence of a weld reinforcement shape on the deformations in the MAG welded plates. In their work, Deng et al. [22] numerically simulated and experimentally measured the deformations of middle-thick T-joint steel plates welded with the MAG procedure. Some possibilities of speeding-up numerical simulations with the application of a combination of shell and solid finite elements on a T-joint welded sample were suggested by Perić et al. [23]. Furthermore, to additionally shorten the welding process simulation time, Perić et al. [24] presented a simplified numerical T-joint model, where only the finite element reactivation or element birth/death technique was applied in the thermal numerical analysis, while the mechanical analysis was performed in one step. Prajadhiana et al. [25] investigated T-joint welding deformations using virtual manufacturing tools and simplified numerical procedures.
Numerical simulations and experimental investigations of deformations and residual stresses are not only limited to the butt-welded and T-joint welded structures described above but are widely performed on large complex MAG welded panel structures that find widespread application in many industries. Deng et al. [26] calculated the welding deformations on a large panel structure using the inherent strain method (ISM). The needed data for ISM calculations were obtained from a small-scale model where the full thermal-elastic-plastic (TEP) simulation procedure was applied. A similar approach was used by Azad et al. [27], Zhang et al. [28], Podder et al. [29], and many other authors. On the other side, Perić et al. [30] presented a simplified TEP procedure for the welding of residual stresses and deformation calculations in large structures. Here, heat input was applied by using the prescribed thermal boundary conditions instead of applying the heat flux to simulate the moving of the electrode in order to speed up the calculation process. Furthermore, Wu et al. [31] and Zhao et al. [32] investigated the residual stresses in MAG butt-welded pipes, while the residual stresses and deformations in MAG welded lap joints are studied by Lin et al. [33].
It is worth noting that all of the above cited studies of residual stresses and deformations were performed on conventional MAG welded structures. One of the main disadvantages of the conventional MAG process is the relatively low deposit rate and depth of penetration, thus the welding of thicker structures requires a large amount of welding passes, which prolongs the product manufacturing process and increases financial costs. With the development of high current MAG technology (also known as buried-arc welding) [34], the number of welding passes can be significantly reduced due to the increased deposit of molten metal. Unlike conventional MAG welded structures, where the residual stress and deformation fields and their magnitudes are well investigated, such studies in the scientific literature data regarding buried-arc welded structures are limited. In their previous studies, Perić et al. [35,36] numerically and experimentally investigated temperature fields, residual stresses, and deformations on butt-weld and T-joint fillet weld samples. In this paper, the numerical and experimental investigations of temperature and residual stress distributions are further extended to circular patch welded structures often used in repair welding applications.

2. Experimental Investigations

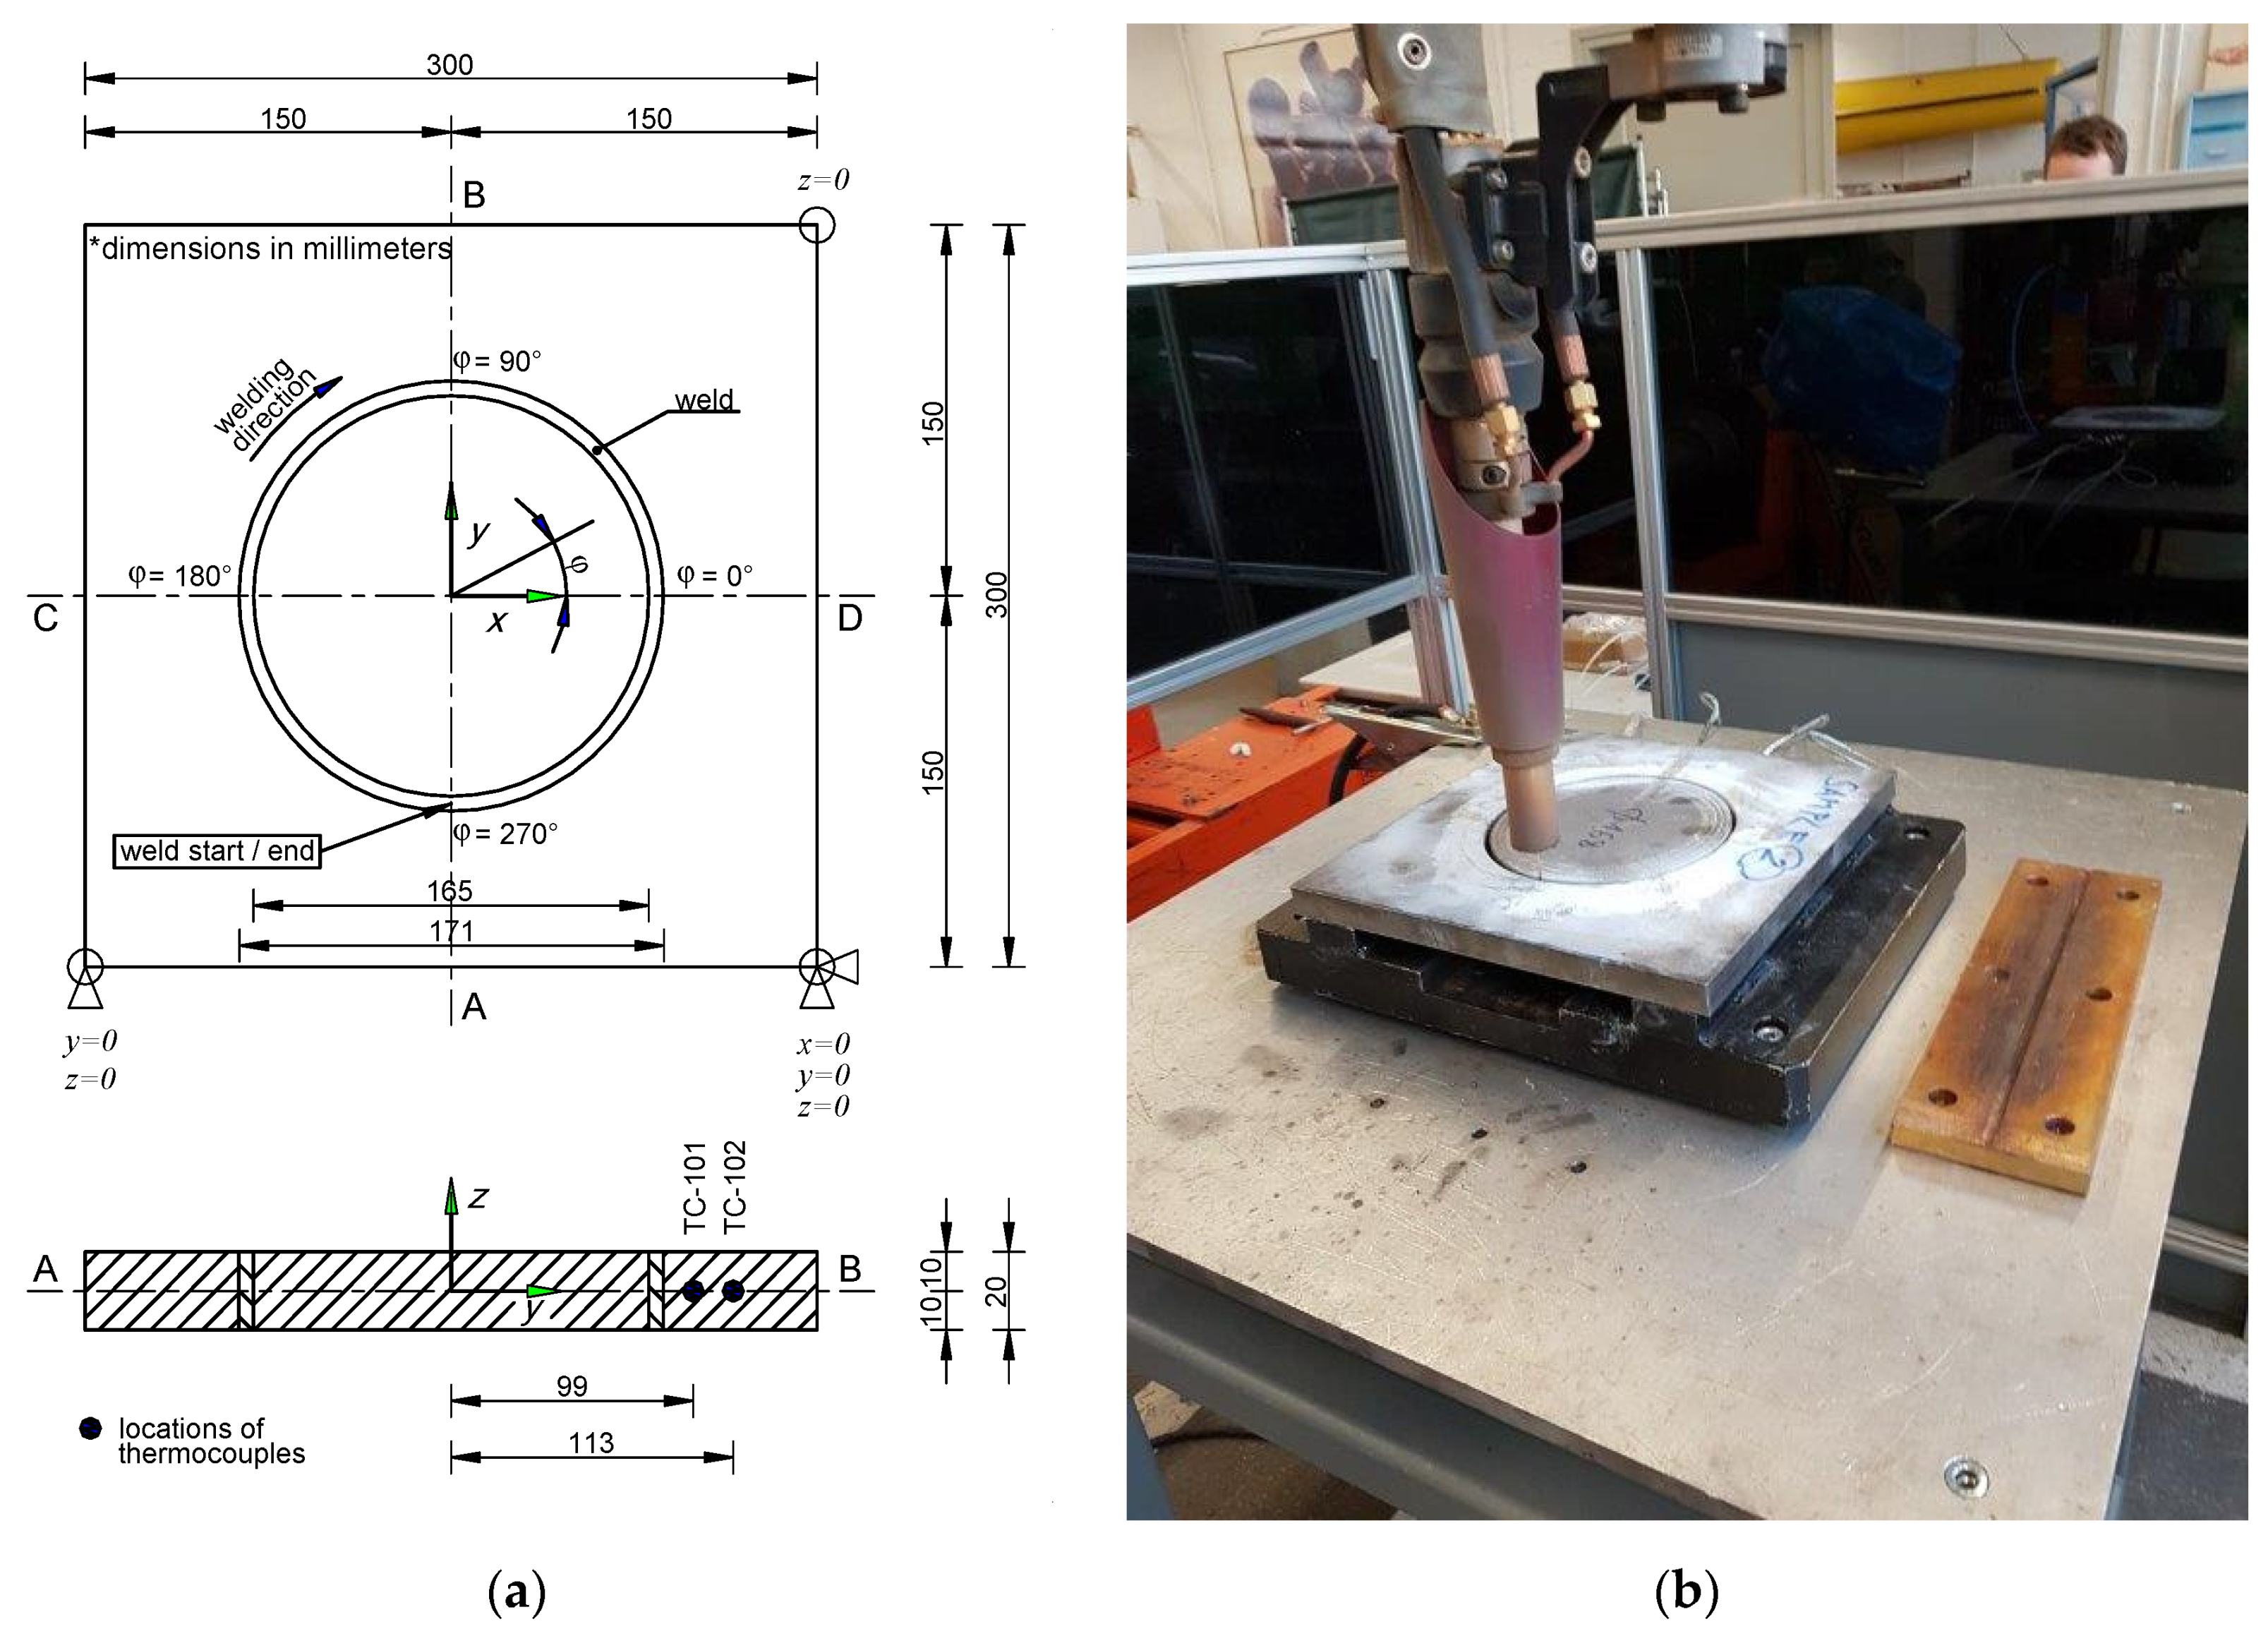
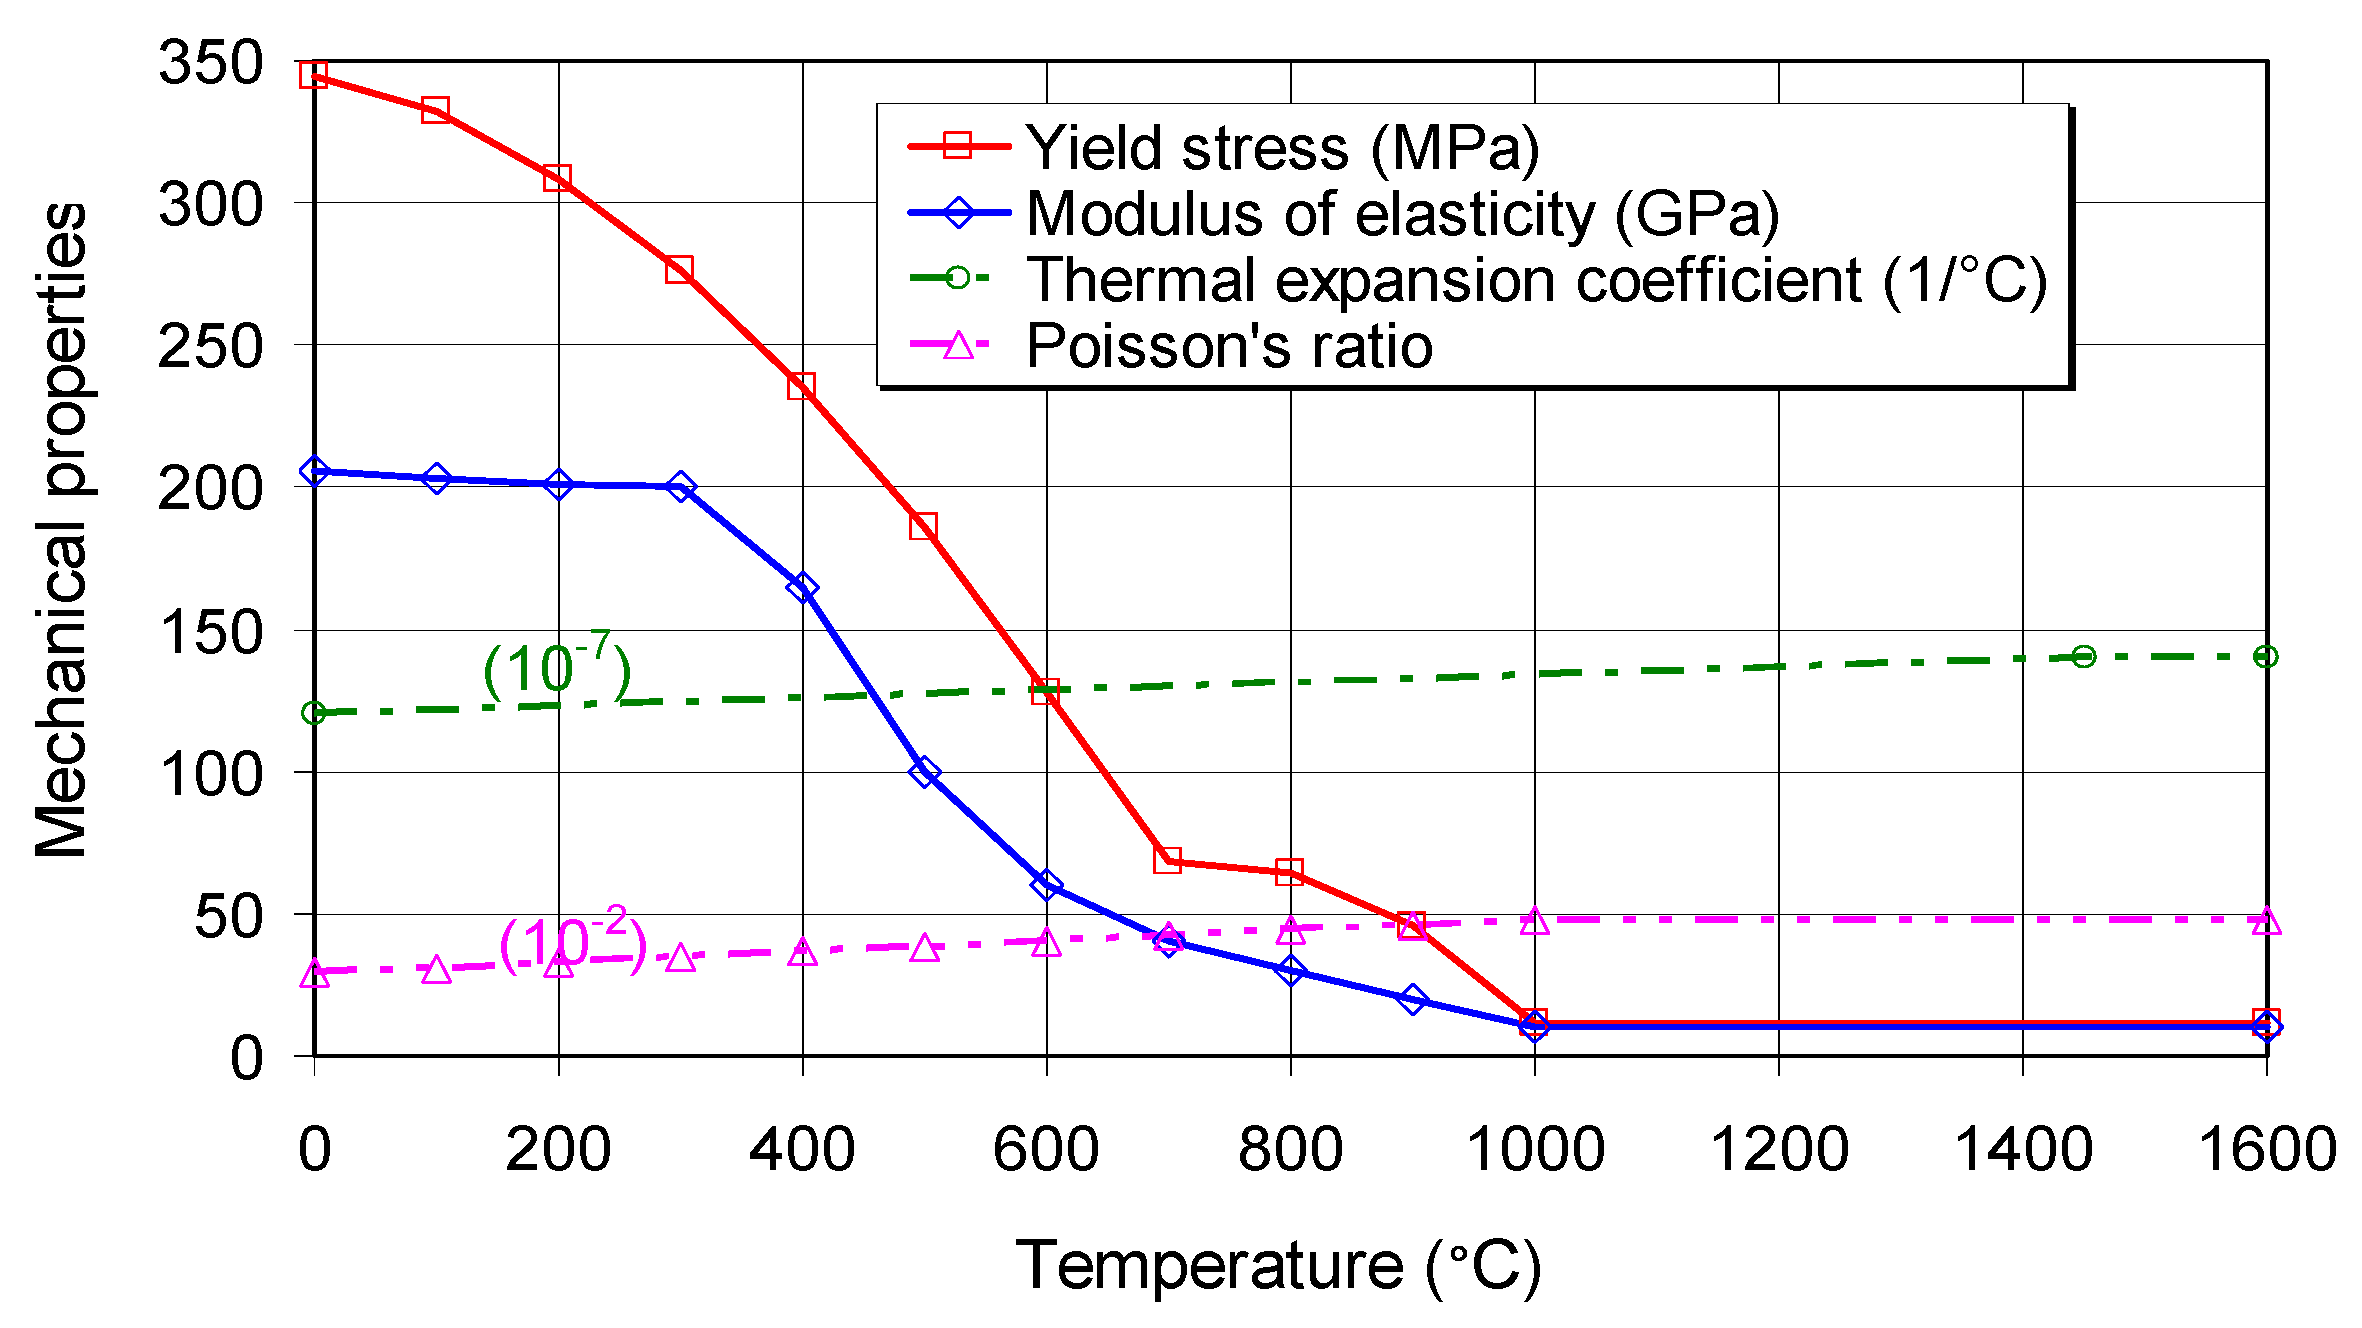
2.1. Model Geometry, Welding Conditions and Material Properties

A cylindrical disk of a diameter of 165 mm was welded to a steel plate with 300 mm × 300 mm × 20 mm dimensions, using the buried-arc welding procedure as shown in Figure 1. Such models are common in repair welding [37,38,39], where a small part of a previously damaged material, such as a crack, is replaced with a patch in the form of a circular disk or a rectangular plate. The model geometry and its dimensions are provided in Figure 1a. Before the start of welding, the cylindrical disk and plate with a previously cut hole with a diameter of 171 mm were tack-welded at the bottom side of the sample at positions ϕ = 0°, 90°, 180°, and 270°, respectively. The welding was performed in a single pass using a seven-axis robot (from OTC Daihen Corporation, Japan) with a neutral gun inclination and a welding wire in accordance with ISO 14341- A:G 42 4 C/M G3Si1. The welding start/end was at position ϕ = 270°, whereby the direction of the welding torch is indicated in Figure 1a. During the welding, the plate and circular disk were kept free without any mechanical fixtures. After welding, a visual testing was conducted according to ISO 17637 norm; no imperfections were found. The material of the welded model was S355J2+N low carbon steel which elemental composition, welding parameters, thermal and mechanical properties are given in Table 1 and Table 2, and Figure 2 and Figure 3, respectively. The experimental setup with the welded sample and robot are shown in Figure 1b.

2.2. Temperature Measurements

Temperature measurement during the welding and subsequent cooling process to the ambient temperature (24 °C) was performed using two NiCr-Ni thermocouples of K-type (TC-101 and TC-102, Figure 1a) mounted in the middle plane of the plate at a depth of 10 mm. The distances of the thermocouples from the center of the circular disk to the thermocouple positions were 99 and 113 mm (Figure 1a, line A-B, ϕ = 90°), respectively. The data transfer from the measuring spots to the computer was enabled via a data logger (from PICO Technology Ltd., UK). The applied thermocouples were able to measure temperatures in an interval of −220 to 1150 °C.
In addition to the thermocouples that measured the temperature responses at particular locations inside the plate, a non-contact temperature measurement was performed on the upper model surface using an infrared (IR) camera. Having completed the welding process, the temperature changes were monitored during the cooling time to ambient temperature. During the measurement, the IR camera was positioned approximately 1.5 m from the upper model surface. The IR camera used in this experiment was Flir SC2000 (from FLIR Systems AB; 320 × 240 pixels, spectral range of 7.5–13 μm) and had a sensitivity of 80 mK at 30 °C, field of view 24° × 18°, minimum focal distance of 0.5 m. and spatial resolution of 1.3 mrad. The thermograms after the weld completion were analyzed using ThermaCAM Researcher and GIMP software.

3. Numerical Model

3.1. Thermal Analysis

The numerical simulation was performed following the sequential approach in two separate numerical analyses: thermal and mechanical, using the Abaqus/Standard software. In the thermal analysis, the time-dependent temperature field distribution was first determined, which was afterwards applied as a thermal load in the mechanical analysis. Here, it was assumed that the total heat input from the welding device to the workpiece takes place via melting droplets. The imposed heat flux Q was uniformly distributed over the weld volume and was obtained from the Equation (1):
Q = η U I V H
In Equation (1) η, U and I are heat input efficiency, welding voltage, and welding current, respectively. Taking into account the values from Table 2, the total heat flux applied to the weld volume VH calculated according to Equation (1) is Q = 6.18 × 10¹⁰ Jm−3s−1. The convective heat transfer coefficient (hc = 10 Wm2K−1) and emissivity factor (ε = 0.9) were applied as boundary conditions in the thermal analysis on all the outer surfaces of the model. The moving of the heat source was simulated by applying the model change option which is contained as a standard tool in the Abaqus/Standard software. In the numerical simulation, the entire weld volume was divided into 104 element sets, which were deactivated in the first analysis step. In the next 104 steps, the element sets were activated set by set simulating the moving of the heat source and weld filler deposition. In each of the 104 steps, each element set was first added and, after that, the heat flux was imposed, whereby the time duration of each individual step was 1 s. After adding the last set of elements, the moving of the electrode stopped and the cooling process of 7500 s began. Since the tack-welds were very short and their heat input to the model was minor, they were neglected in the numerical simulation. In the thermal numerical simulation first order DC3D8 finite elements were used.

3.2. Mechanical Analysis

The calculated thermal field from the numerical analysis was imposed as a thermal load in the mechanical analysis. To shorten the simulation time, this analysis was performed in one step only, without applying the model change option. As mentioned earlier in the text, the circular disk and plate were free welded without any mechanical fixtures, but they were included in the mechanical analysis to prevent the motion of the model as a rigid body, as shown in Figure 1a. The weld filler and base material were considered as homogeneous elastic-perfectly plastic materials that yield according to the von Mises criterion and the associated flow rule [41,42]. Due to the lack of temperature dependent thermal and mechanical data for the weld filler, they were assumed equal to the base metal ones. Deng et al. [43] reported that the influence of the phase transformations on the final residual and deformation field is small in low-carbon steel welded structures; thus, the steel phase transformations were not considered in this study. Furthermore, the creep behavior of the material was not taken into account as the exposure of the material to high temperature cycles was very short. Finally, after introducing the mentioned material behavior simplifications, the total strain increment can be summarized in the form:
d ε t o t a l = { d ε e } + { d ε p } + { d ε t h }
In Equation (2) e, p, and th represents elastic, plastic, and thermal strain increments, respectively. In the mechanical analysis C3D8I finite elements with incompatible nodes were applied. A more detailed numerical procedure is available in the authors’ previous work [30].

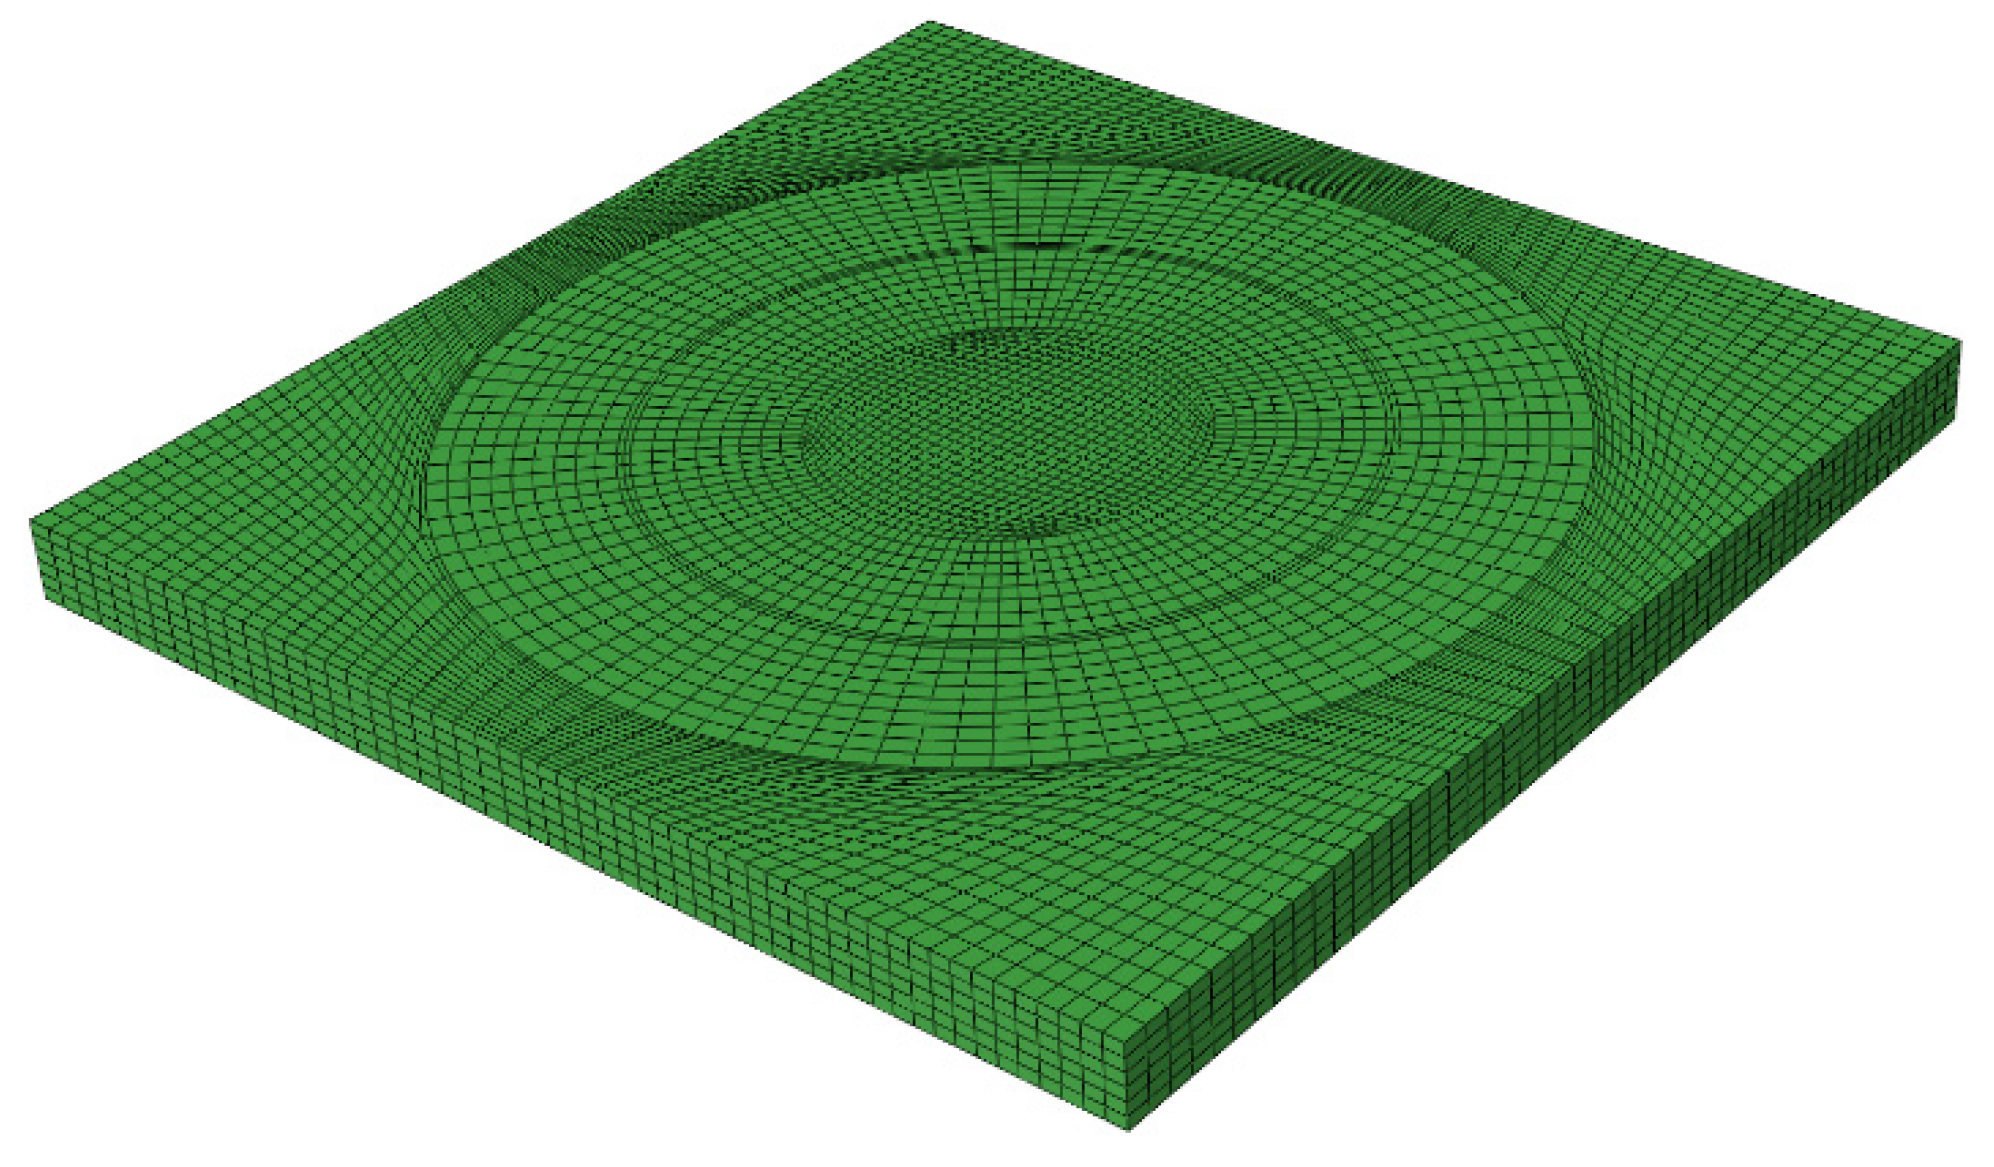
3.3. Finite Element Mesh

The finite element mesh was modeled with a total of 36,435 finite elements and is shown in Figure 4. The circular disk, plate, and weld filler were modelled as a single part. All the dimensions of the disk, plate, and gap are given in Figure 1. The mesh sensitivity was controlled by applying the submodeling technique [44,45], whereby the areas of high temperature gradients in the weld and its vicinity were carefully controlled. In both the thermal and mechanical analyses, the same mesh of finite elements was used with a conversion of DC3D8 elements from the thermal analysis to C3D8I elements in the mechanical analysis.

4. Results and Discussion

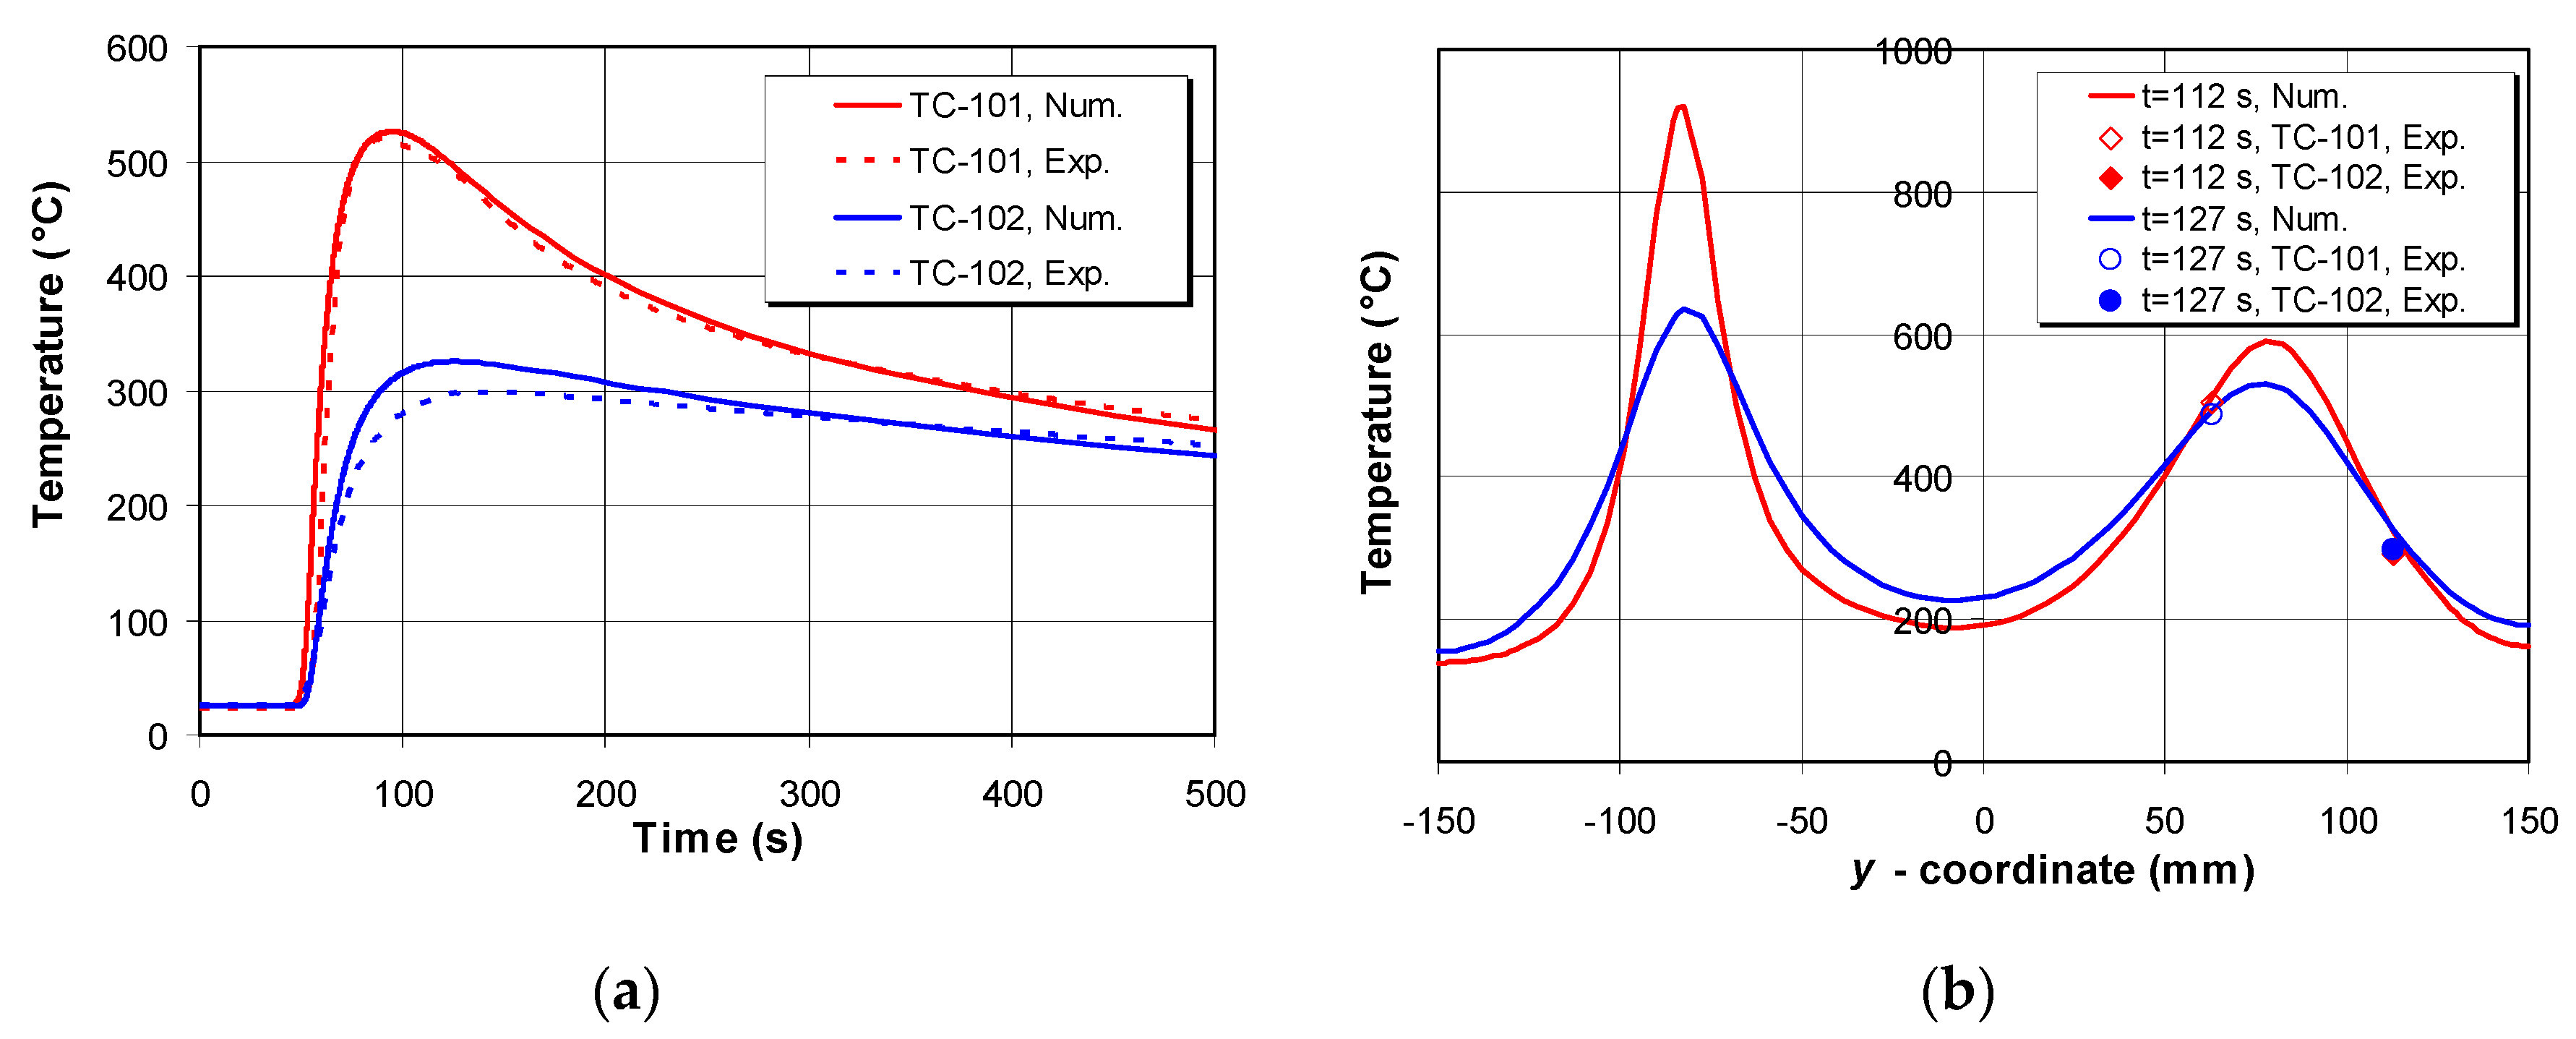
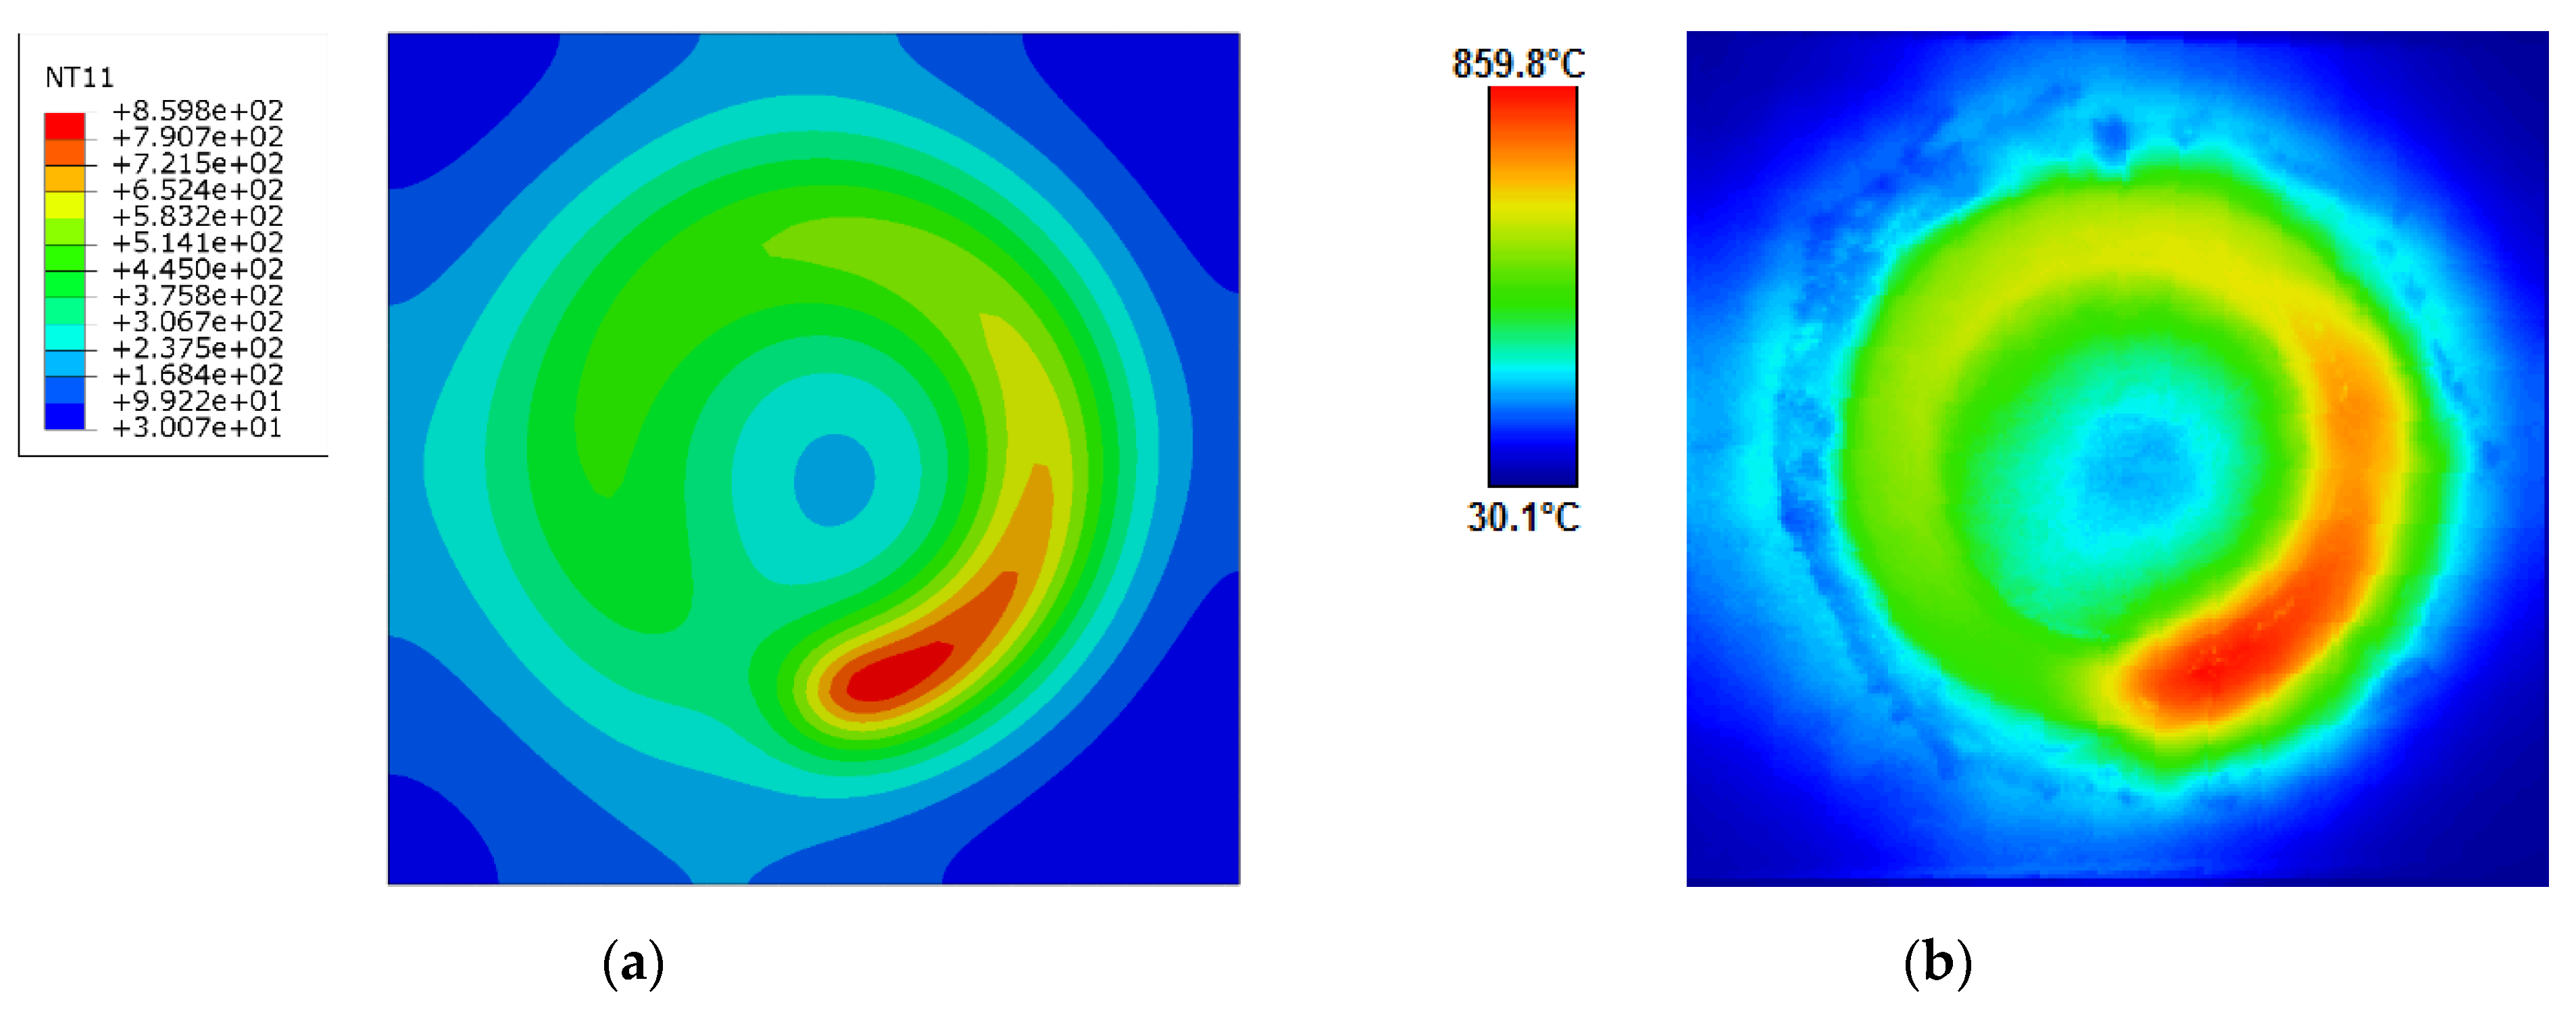
4.1. Temperature Field Distribution

The temperature histories recorded on the thermocouple positions TC-101 and TC-102 for the first 500 s after the beginning of the welding process are shown in Figure 5a. Here, it can be seen that the experimental measured peak temperatures reach values of 525 °C and 326 °C, while the numerical calculated ones are slightly lower: 519 °C and 298 °C, respectively. The slope of the temperature history curves show a sharp rise tendency when the electrode passes the measuring spots and were almost identical for the numerical simulation and experimental measurement, which clearly indicates that the actual thermal property values of S355J2+N steel are very close to the data given in Figure 2. Having reached peak temperatures, there is a temperature decrease due to the cooling process. An acceptable match of numerical and experimental results can be seen here, indicating that the temperature independent convective heat transfer coefficient used in the numerical model was a reasonable choice in this case.
The cooling curves for the time intervals of 112 s and 127 s after the beginning of the welding process are plotted in Figure 5b. The results are given for the upper side of the welded model (Figure 1a, line A-B, ϕ = 90). In Figure 5b, coordinate y = −150 mm denotes point A, while y = 150 mm represents point B (Figure 1a). In Figure 5b, a large difference in peak temperatures for the time of 112 s after the start of welding is noticeable (920 °C vs. 591 °C). The time of 112 s after the beginning of the welding process is in fact only 8 s after the electrode stopped, which was too short to equalize the temperatures throughout the model. On the other hand, the time of 127 s after the start of welding (in this case the time after the electrode stops is 23 s) was long enough for temperature equalization during the cooling process, so the differences in peak temperatures are significantly smaller (635 °C vs. 531 °C). In addition to the cooling curves obtained by the numerical simulation, in Figure 5b the experimental results obtained by the thermocouples are plotted where a good match of the results is confirmed.
A comparison of numerically calculated and experimentally recorded temperature fields with the use of an IR camera is shown in Figure 6. It is obvious that the numerical results follow the results of the temperature measurements very well, whereas in both cases the temperature range is between approximately 30 °C and 860 °C. It can be seen that the zone of high temperatures is slightly wider in the thermographic measurement than in the numerical simulation. As stated earlier in the text, it was assumed that all the heat from the welding device was transferred to the workpiece via melting droplets, but, in reality, a part of the heat was transferred by radiation to the surface of the workpiece. Since the zone in which the heat was transferred by radiation from the apparatus to the model surface is wider than the weld gap, the electrode trace obtained by the thermographic measurement is somewhat wider than obtained by the numerical simulation.

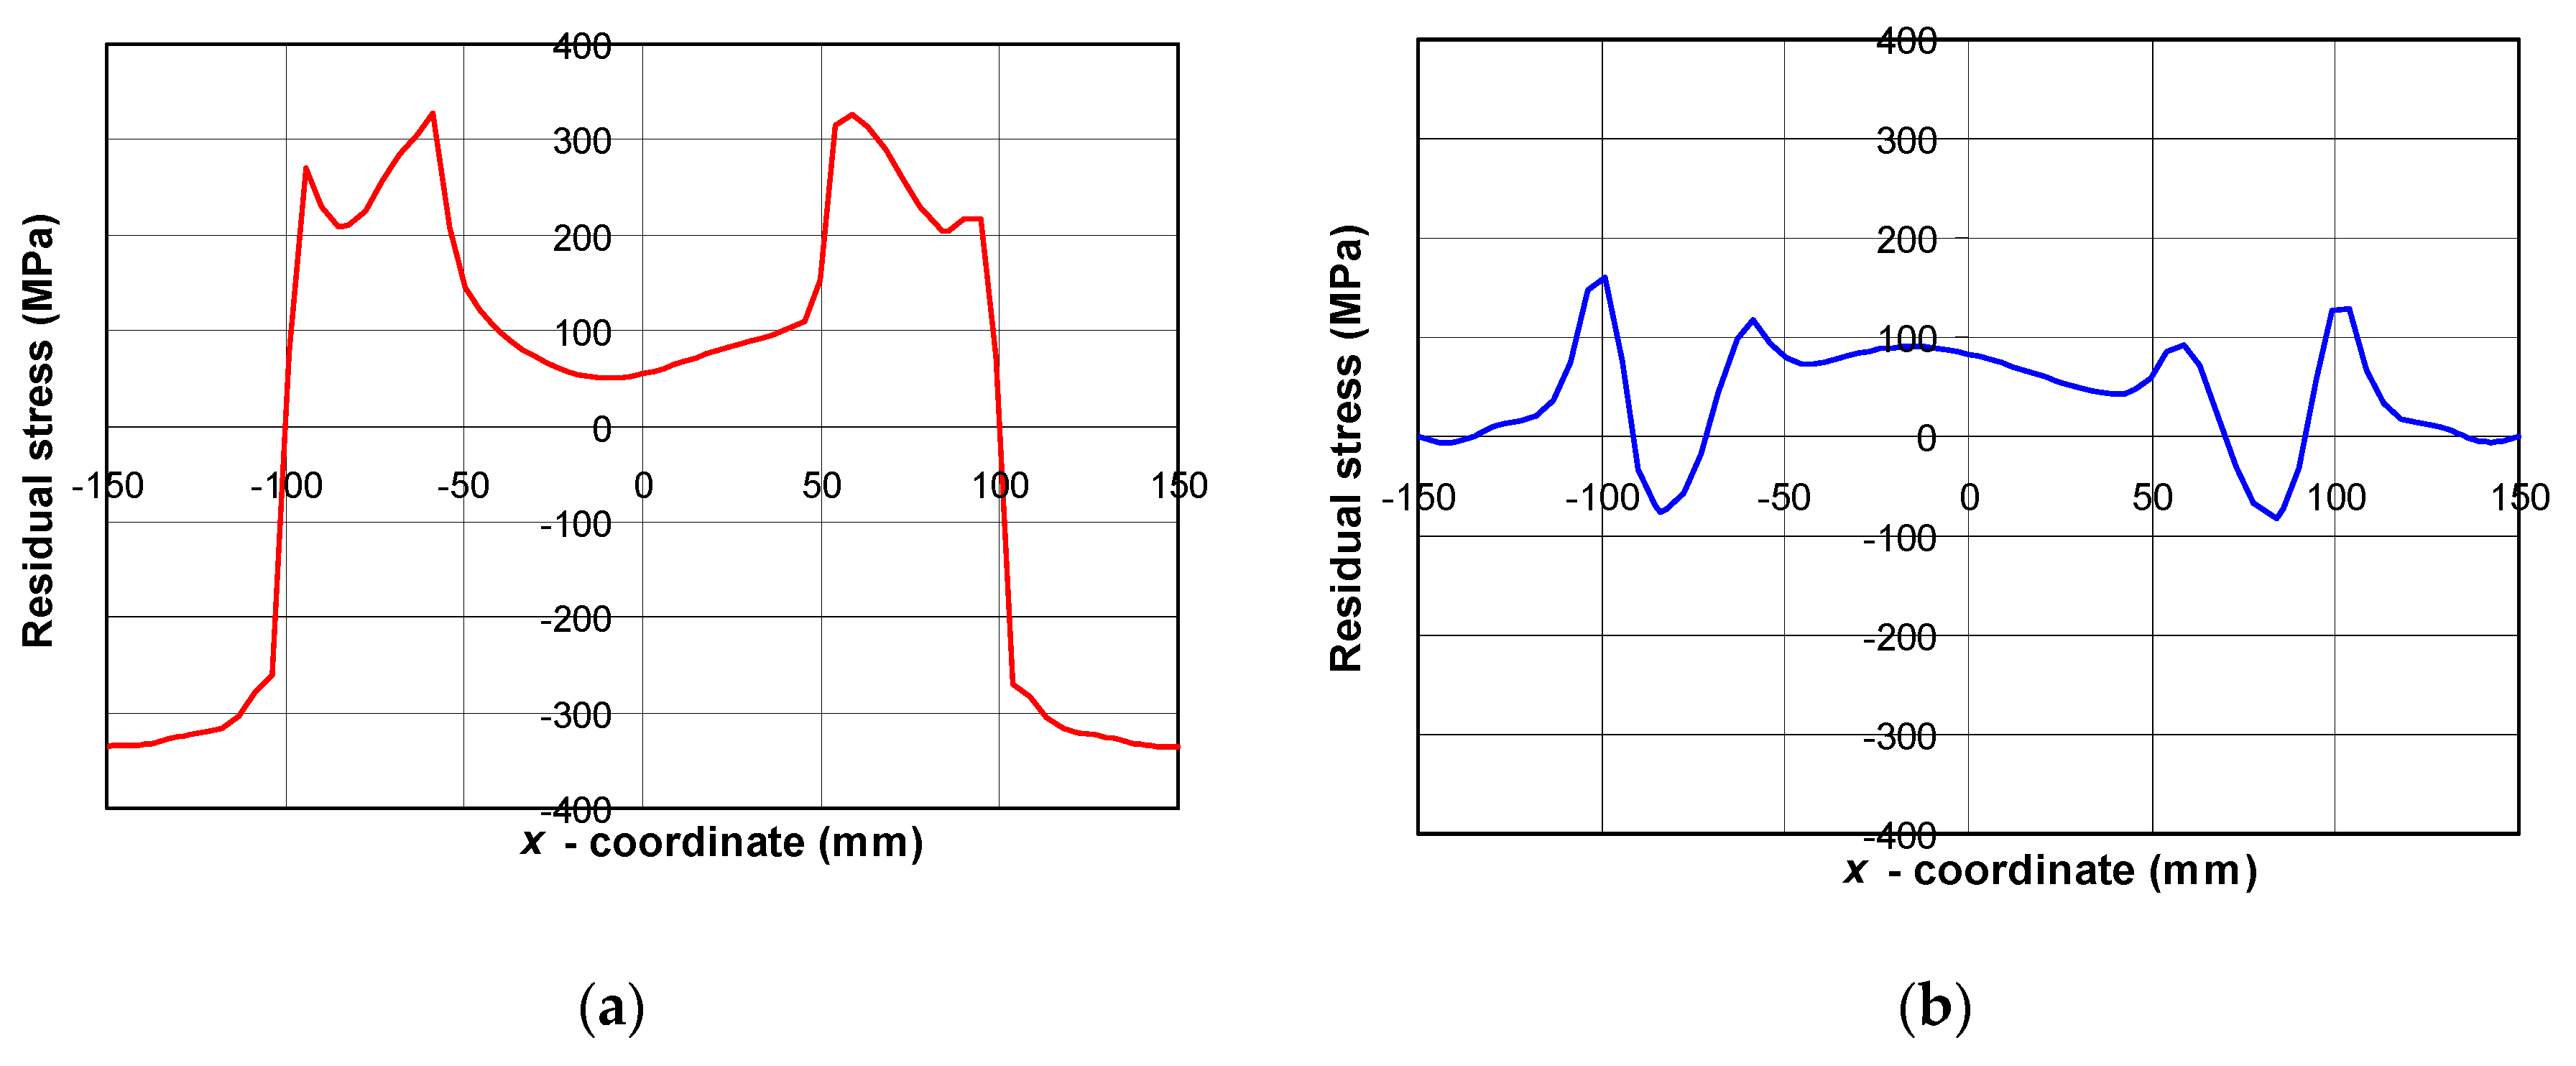
4.2. Residual Stress Field Distribution

The circumferential (tangent to the welding path) residual stress distribution along line C-D (Figure 1a) on the upper side of the welded model is plotted in Figure 7a. It can be seen that these stresses are tensile throughout the entire disk. The tensile circumferential stress reach a peak value of 327 MPa inside the disk on the coordinate x = −59 mm. In the rest of the model, towards the plate edges, the tensile circumferential residual stresses turn into compressive ones. Similar to the circumferential stresses, the radial stresses (perpendicular to the welding path) are primarily tensile throughout the disk area (Figure 7b). Outside the disk, they reach a tensile value of 160 MPa at the coordinate x = −99 mm and decrease towards the edges of the plate and decreased where they disappear completely. The compressive radial residual stresses have a peak value of −82 MPa at the coordinate x = 84 mm. In Figure 7a,b coordinate x = −150 mm denotes point C, while x = 150 mm represents point D (Figure 1a).
Looking at the full field circumferential and radial residual stress distributions (Figure 8) on the upper side of the welded model, it is noticeable that they are almost symmetric with respect to the x and y axis (Figure 1a). The residual stress symmetries also show a steady state tendency following the path of the electrode, only becoming lost in the welding start/end area, which was also noticed in previous research by other authors [46]. Upon analyzing both circumferential and radial residual stresses, it can be noted that both stresses are primarily tensile inside the circular disk. Outside the disk, the circumferential stresses turn from tensile to compressive, while on the other hand the radial stresses disappear towards the ends of the plate.

5. Conclusions

In this study, we investigated temperature and residual stress field distributions in a circular patch weld model. The main conclusions can be summarized as follows:
  • Temperature histories recorded by thermocouples match well with the numerical calculated ones. The effect of simplified heat flux affects the temperature distribution in the weld bead and its close vicinity, while this effect on the temperature distribution away from the weld bead is significantly smaller.
  • By measuring temperatures with the application of an IR camera on the upper surface of the model, a good correlation with the numerical simulation results was confirmed, whereas the largest deviations of the results were found in the weld bead and its vicinity.
  • The numerical simulation residual stress results showed that the circumferential and radial residual stresses within the circular disk are primarily tensile.
  • The circumferential residual stresses turn from tensile to compressive outside the disk. The radial residual stresses disappear towards the ends of the plate.
  • The residual stress symmetries also show a steady state tendency following the path of the electrode, except in the welding start/end area.
Finally, it can be concluded that the presented numerical model is an acceptable solution for the analysis of temperature fields and residual stresses in the case of thick plate repair welding. Future research should focus on investigating the parameters of fracture mechanics and fatigue caused by buried-arc welding.

Author Contributions

Conceptualization, M.P.; writing—original draft preparation, M.P.; formal analysis, M.P.; proof reading, M.P.; experimental investigations, M.P., S.N., I.G., I.H. and I.B.; supervision, M.P., S.N. and Z.T. All authors have read and agreed to the published version of the manuscript.

Funding

This work has been fully supported by the Croatian Ministry of Science and Education under the project named Improvement of high-efficiency welding technology.

Conflicts of Interest

The authors declare no conflict of interest.

References

  1. Ryu, H.-S.; Kang, S.; Lee, K. Numerical Analysis and Experiments of Butt Welding Deformations for Panel Block Assembly. Appl. Sci. 2020, 10, 1669. [Google Scholar] [CrossRef] [Green Version]
  2. Lorza, R.L.; García, R.E.; Martinez, R.F.; Martinez Calvo, M.Á. Using Genetic Algorithms with Multi-Objective Optimization to Adjust Finite Element Models of Welded Joints. Metals 2018, 8, 230. [Google Scholar] [CrossRef] [Green Version]
  3. Perić, M.; Garašić, I.; Nižetić, S.; Dedić-Jandrek, H. Numerical Analysis of Longitudinal Residual Stresses and Deflections in a T-joint Welded Structure Using a Local Preheating Technique. Energies 2018, 11, 3487. [Google Scholar] [CrossRef] [Green Version]
  4. Chen, X.; Xu, H.; Xu, G.; Singh, A.R.; Jayalakshmi, S.; Konovalov, S.; Gupta, M. Stress and Temperature Distribution Simulation for Arc Weld-based Rapid Prototyping of Titanium Alloy Tc4. Mater. Express 2019, 9, 99–111. [Google Scholar] [CrossRef]
  5. Kik, T. Heat Source Models in Numerical Simulations of Laser Welding. Materials 2020, 13, 2653. [Google Scholar] [CrossRef] [PubMed]
  6. Gao, H.; Wu, S.; Wu, Q.; Li, B.; Gao, Z.; Zhang, Y.; Mo, S. Experimental and Simulation Investigation on Thermal-Vibratory Stress Relief Process for 7075 Aluminium Alloy. Mater. Des. 2020, 195, 108954. [Google Scholar] [CrossRef]
  7. Gao, H.; Zhang, Y.; Wu, Q.; Song, J.; Wen, K. Fatigue Life of 7075-t651 Aluminium Alloy Treated with Vibratory Stress Relief. Int. J. Fatigue 2018, 108, 62–67. [Google Scholar] [CrossRef]
  8. Chen, Y.; Sun, S.; Zhang, T.; Zhou, X.; Li, S. Effects of Post-Weld Heat Treatment on the Microstructure and Mechanical Properties of Laser-Welded NiTi/304SS Joint with Ni Filler. Mater. Sci. Eng. A 2020, 771, 138545. [Google Scholar] [CrossRef]
  9. Dong, P.; Song, S.; Zhang, J. Analysis of Residual Stress Relief Mechanisms in Post-Weld Heat Treatment. Int. J. Press. Vessel. Pip. 2014, 122, 6–14. [Google Scholar] [CrossRef]
  10. Karalis, D. Increasing the Efficiency of Computational Welding Mechanics by Combining Solid and Shell Elements. Mater. Today Commun. 2020, 22, 100836. [Google Scholar] [CrossRef]
  11. Lorza, R.L.; Bobadilla, M.C.; Calvo, M.; Ángeles, M.; Roldán, P.M.V. Residual Stresses with Time-Independent Cyclic Plasticity in Finite Element Analysis of Welded Joints. Metals 2017, 7, 136. [Google Scholar] [CrossRef] [Green Version]
  12. Seleš, K.; Perić, M.; Tonković, Z. Numerical Simulation of a Welding Process Using a Prescribed Temperature Approach. J. Constr. Steel Res. 2018, 145, 49–57. [Google Scholar] [CrossRef]
  13. Walker, T.; Bennett, C.J. An Automated Inverse Method to Calibrate Thermal Finite Element Models for Numerical Welding Applications. J. Manuf. Process. 2019, 47, 263–283. [Google Scholar] [CrossRef]
  14. Xiong, Y.; Li, C.; Chen, Z.; He, J.; Xin, H. The Evolution of Residual Stress in Rib-Diaphragm Joints of Orthotropic Steel Decks Subjected to Thermal Cutting and Welding. Materials 2020, 13, 3804. [Google Scholar] [CrossRef] [PubMed]
  15. Chandrasekaran, R.R.; Benoit, M.J.; Barrett, J.M.; Gerlich, A.P. Multi-Variable Statistical Models for Predicting Bead Geometry in Gas Metal Arc Welding. Int. J. Adv. Manuf. Technol. 2019, 105, 1573–1584. [Google Scholar] [CrossRef]
  16. Tian, L.; Luo, Y. The Effect of Process Parameters and Plate Thickness on in-Plane Inherent Deformations in T-Joint Fillet Weld. Eng. Comput. 2020. [Google Scholar] [CrossRef]
  17. Adamczuk, P.C.; Machado, I.G.; Mazzaferro, J.A.E. Methodology for Predicting the Angular Distortion in Multi-Pass Butt-Joint Welding. J. Mater. Process. Technol. 2017, 240, 305–313. [Google Scholar] [CrossRef]
  18. Costa, E.S.; Assunção, P.D.C.; Dos Santos, E.B.F.; Feio, L.G.; Bittencourt, M.S.Q.; Braga, E.M. Residual Stresses in Cold-Wire Gas Metal Arc Welding. Sci. Technol. Weld. Join. 2017, 22, 706–713. [Google Scholar] [CrossRef]
  19. Heinze, C.; Schwenk, C.; Rethmeier, M. Effect of Heat Source Configuration on the Result Quality of Numerical Calculation of Welding-Induced Distortion. Simul. Model. Pract. Theory 2012, 20, 112–123. [Google Scholar] [CrossRef]
  20. Kung, C.-L.; Hung, C.-K.; Hsu, C.-M.; Chen, C.-Y. Residual Stress and Deformation Analysis in Butt Welding on 6 mm SUS304 Steel with Jig Constraints Using Gas Metal Arc Welding. Appl. Sci. 2017, 7, 982. [Google Scholar] [CrossRef]
  21. Deng, D.; Zhou, Y.; Bi, T.; Liu, X. Experimental and Numerical Investigations of Welding Distortion Induced by CO2 Gas Arc Welding in Thin-Plate Bead-on Joints. Mater. Des. 2013, 52, 720–729. [Google Scholar] [CrossRef]
  22. Deng, D.; Liang, W.; Murakawa, H. Determination of Welding Deformation in Fillet-Welded Joint by Means of Numerical Simulation and Comparison with Experimental Measurements. J. Mater. Process. Technol. 2007, 183, 219–225. [Google Scholar] [CrossRef]
  23. Perić, M.; Tonković, Z.; Rodić, A.; Surjak, M.; Garašić, I.; Boras, I.; Švaić, S. Numerical Analysis and Experimental Investigation of Welding Residual Stresses and Distortions in a T-Joint Fillet Weld. Mater. Des. 2014, 53, 1052–1063. [Google Scholar] [CrossRef]
  24. Perić, M.; Tonković, Z.; Karsaj, I.; Stamenković, D. A Simplified Engineering Method for a T-Joint Welding Simulation. Therm. Sci. 2018, 22, 20. [Google Scholar] [CrossRef] [Green Version]
  25. Prajadhiana, K.P.; Manurung, Y.; Sulaiman, M.S.; Adenan, M.S. Investigation on Welded T-Joint Distortion Using Virtual Manufacturing Tools with Simplified Procedure. J. Korean Soc. Precis. Eng. 2020, 37, 91–97. [Google Scholar] [CrossRef]
  26. Deng, D.; Murakawa, H.; Liang, W. Prediction of Welding Distortion in a Curved Plate Structure by Means of Elastic Finite Element Method. J. Mater. Process. Technol. 2008, 203, 252–266. [Google Scholar] [CrossRef]
  27. Azad, N.; Iranmanesh, M.; Darvazi, A.R. A Study on the Effect of Welding Sequence on Welding Distortion in Ship Deck Structure. Ships Offshore Struct. 2019, 15, 355–367. [Google Scholar] [CrossRef]
  28. Zhang, Y.; Wang, Y. The Influence of Welding Mechanical Boundary Condition on the Residual Stress and Distortion of a Stiffened-Panel. Mar. Struct. 2019, 65, 259–270. [Google Scholar] [CrossRef]
  29. Podder, D.; Gupta, O.P.; Das, S.; Mandal, N.R. Experimental and Numerical Investigation of Effect of Welding Sequence on Distortion of Stiffened Panels. Weld. World 2019, 63, 1275–1289. [Google Scholar] [CrossRef]
  30. Perić, M.; Seleš, K.; Tonković, Z.; Lovrenić-Jugović, M. Numerical Simulation of Welding Distortions in Large Structures with a Simplified Engineering Approach. Open Phys. 2019, 17, 719–730. [Google Scholar] [CrossRef]
  31. Wu, C.; Lee, C.; Kim, J.-W. Numerical Simulation of Bending Deformation Induced by Multi-Seam Welding of a Steel-Pipe Structure. J. Mech. Sci. Technol. 2020, 34, 2121–2131. [Google Scholar] [CrossRef]
  32. Zhao, M.; Wei, F.; Huang, W.Q.; Lei, Y. Experimental and Numerical Investigation on Combined Girth Welding of API X80 Pipeline Steel. Sci. Technol. Weld. Join. 2015, 20, 622–630. [Google Scholar] [CrossRef]
  33. Lin, J.; Ma, N.; Lei, Y.; Murakawa, H. Measurement of Residual Stress in Arc Welded Lap Joints by Cosα X-Ray Diffraction Method. J. Mater. Process. Technol. 2017, 243, 387–394. [Google Scholar] [CrossRef]
  34. Baba, H.; Era, T.; Ueyama, T.; Tanaka, M. Single Pass Full Penetration Joining for Heavy Plate Steel Using High Current GMA Process. Weld. World 2017, 61, 963–969. [Google Scholar] [CrossRef]
  35. Perić, M.; Garašić, I.; Tonković, Z.; Vuherer, T.; Nižetić, S.; Dedić-Jandrek, H. Numerical Prediction and Experimental Validation of Temperature and Residual Stress Distributions in Buried-Arc Welded Thick Plates. Int. J. Energy Res. 2019, 43, 3590–3600. [Google Scholar] [CrossRef]
  36. Perić, M.; Nižetić, S.; Garašić, I.; Gubeljak, N.; Vuherer, T.; Tonković, Z. Numerical Calculation and Experimental Measurement of Temperatures and Welding Residual Stresses in a Thick-Walled T-Joint Structure. J. Therm. Anal. Calorim. 2020, 141, 313–322. [Google Scholar] [CrossRef]
  37. Charkhi, M.; Akbari, D. Experimental and Numerical Investigation of the Effects of the Pre-Heating in the Modification of Residual Stresses in the Repair Welding Process. Int. J. Press. Vessel. Pip. 2019, 171, 79–91. [Google Scholar] [CrossRef]
  38. Salerno, G.; Bennett, C.J.; Sun, W.; Becker, A.A. Residual Stress Analysis and Finite Element Modelling of Repair-Welded Titanium Sheets. Weld. World 2017, 61, 1211–1223. [Google Scholar] [CrossRef] [Green Version]
  39. Jiang, W.; Liu, Z.; Gong, J.; Tu, S. Numerical Simulation to Study the Effect of Repair Width on Residual Stresses of a Stainless Steel Clad Plate. Int. J. Press. Vessel. Pip. 2010, 87, 457–463. [Google Scholar] [CrossRef]
  40. Pilipenko, A. Computer Simulation of Residual Stress and Distortion of Thick Plates in Multi-Electrode Submerged Arc Welding: Their Mitigation Techniques. Ph.D. Thesis, Norwegian University of Science and Technology, Trondheim, Norway, 2001. [Google Scholar]
  41. Nasouri, R.; Nguyen, K.; Montoya, A.; Matamoros, A.; Bennett, C.; Li, J. Simulating the Hot Dip Galvanizing Process of High Mast Illumination Poles. Part I: Finite Element Model Development. J. Constr. Steel Res. 2019, 162, 105705. [Google Scholar] [CrossRef]
  42. Nguyen, K.; Nasouri, R.; Bennett, C.R.; Matamoros, A.; Li, J.; Montoya, A.H. Thermomechanical Modeling of Welding and Galvanizing a Steel Beam Connection Detail to Examine Susceptibility to Cracking. Mater. Perform. Charact. 2018, 7, 165–190. [Google Scholar] [CrossRef] [Green Version]
  43. Deng, D. FEM Prediction of Welding Residual Stress and Distortion in Carbon Steel Considering Phase Transformation Effects. Mater. Des. 2009, 30, 359–366. [Google Scholar] [CrossRef]
  44. Perić, M.; Tonković, Z.; Maksimović, K.S.; Stamenković, D. Numerical Analysis of Residual Stresses in a T-Joint Fillet Weld Using a Submodeling Technique. FME Trans. 2019, 47, 183–189. [Google Scholar] [CrossRef]
  45. Perić, M.; Tonković, Z.; Garašić, I.; Vuherer, T. An Engineering Approach for a T-Joint Fillet Welding Simulation Using Simplified Material Properties. Ocean Eng. 2016, 128, 13–21. [Google Scholar] [CrossRef]
  46. Deng, D.; Kiyoshima, S. FEM Prediction of Welding Residual Stresses in a SUS304 Girth-Welded Pipe with Emphasis on Stress Distribution Near Weld Start/End Location. Comput. Mater. Sci. 2010, 50, 612–621. [Google Scholar] [CrossRef]
Figure 1. Buried-arc-welded circular disk: (a) Geometry and dimensions; (b) Experimental setup.
Energies 13 05423 g001
Figure 2. S355J2+N steel, thermal properties [40].
Energies 13 05423 g002
Figure 3. S355J2+N steel, mechanical properties [40].
Energies 13 05423 g003
Figure 4. Finite element mesh of welded model.
Energies 13 05423 g004
Figure 5. Thermal measurement results at nodes TC-101 and TC-102: (a) Temperature history curves; (b) Cooling process curves (Figure 1a, line A-B, ϕ = 90°).
Energies 13 05423 g005
Figure 6. Full field temperature distribution on upper surface of welded model 127 s after beginning of welding process: (a) Numerical simulation; (b) Thermographic measurement.
Energies 13 05423 g006
Figure 7. Residual stress field on upper model surface along line C-D (Figure 1a): (a) Circumferential stress; (b) Radial stress.
Energies 13 05423 g007
Figure 8. Full field residual stress distribution on upper model surface: (a) Circumferential stress; (b) radial stress.
Energies 13 05423 g008
Table 1. S355J2+N steel, elemental composition (mass %) [35,36].
CSiMnPSNCuCrNiMoAlVTiNb
0.170.241.250.0160.0060.0080.230.060.10.110.00320.0050.0250.033
Table 2. Welding parameters.
Welding Current IWelding Voltage UHeat Input Efficiency η Welding Speed Wire Diameter Wire Feed SpeedShielding Gas CompositionShielding Gas Flow
540 A41 V0.85304 mm/min 1.6 mm10.4 m/min100% CO225 L/min
Publisher’s Note: MDPI stays neutral with regard to jurisdictional claims in published maps and institutional affiliations.

