Grand Challenges in Central Europe: The Relationship of Food Security, Climate Change, and Energy Use


Abstract
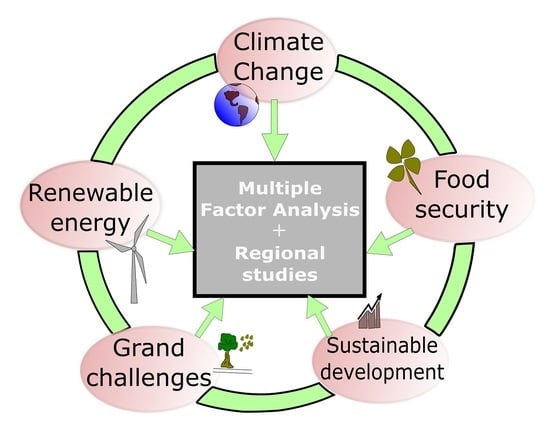
1. Introduction
2. Materials and Method
2.1. Data and Variables
2.2. Statistical Analysis
3. Results
3.1. Validation of Results
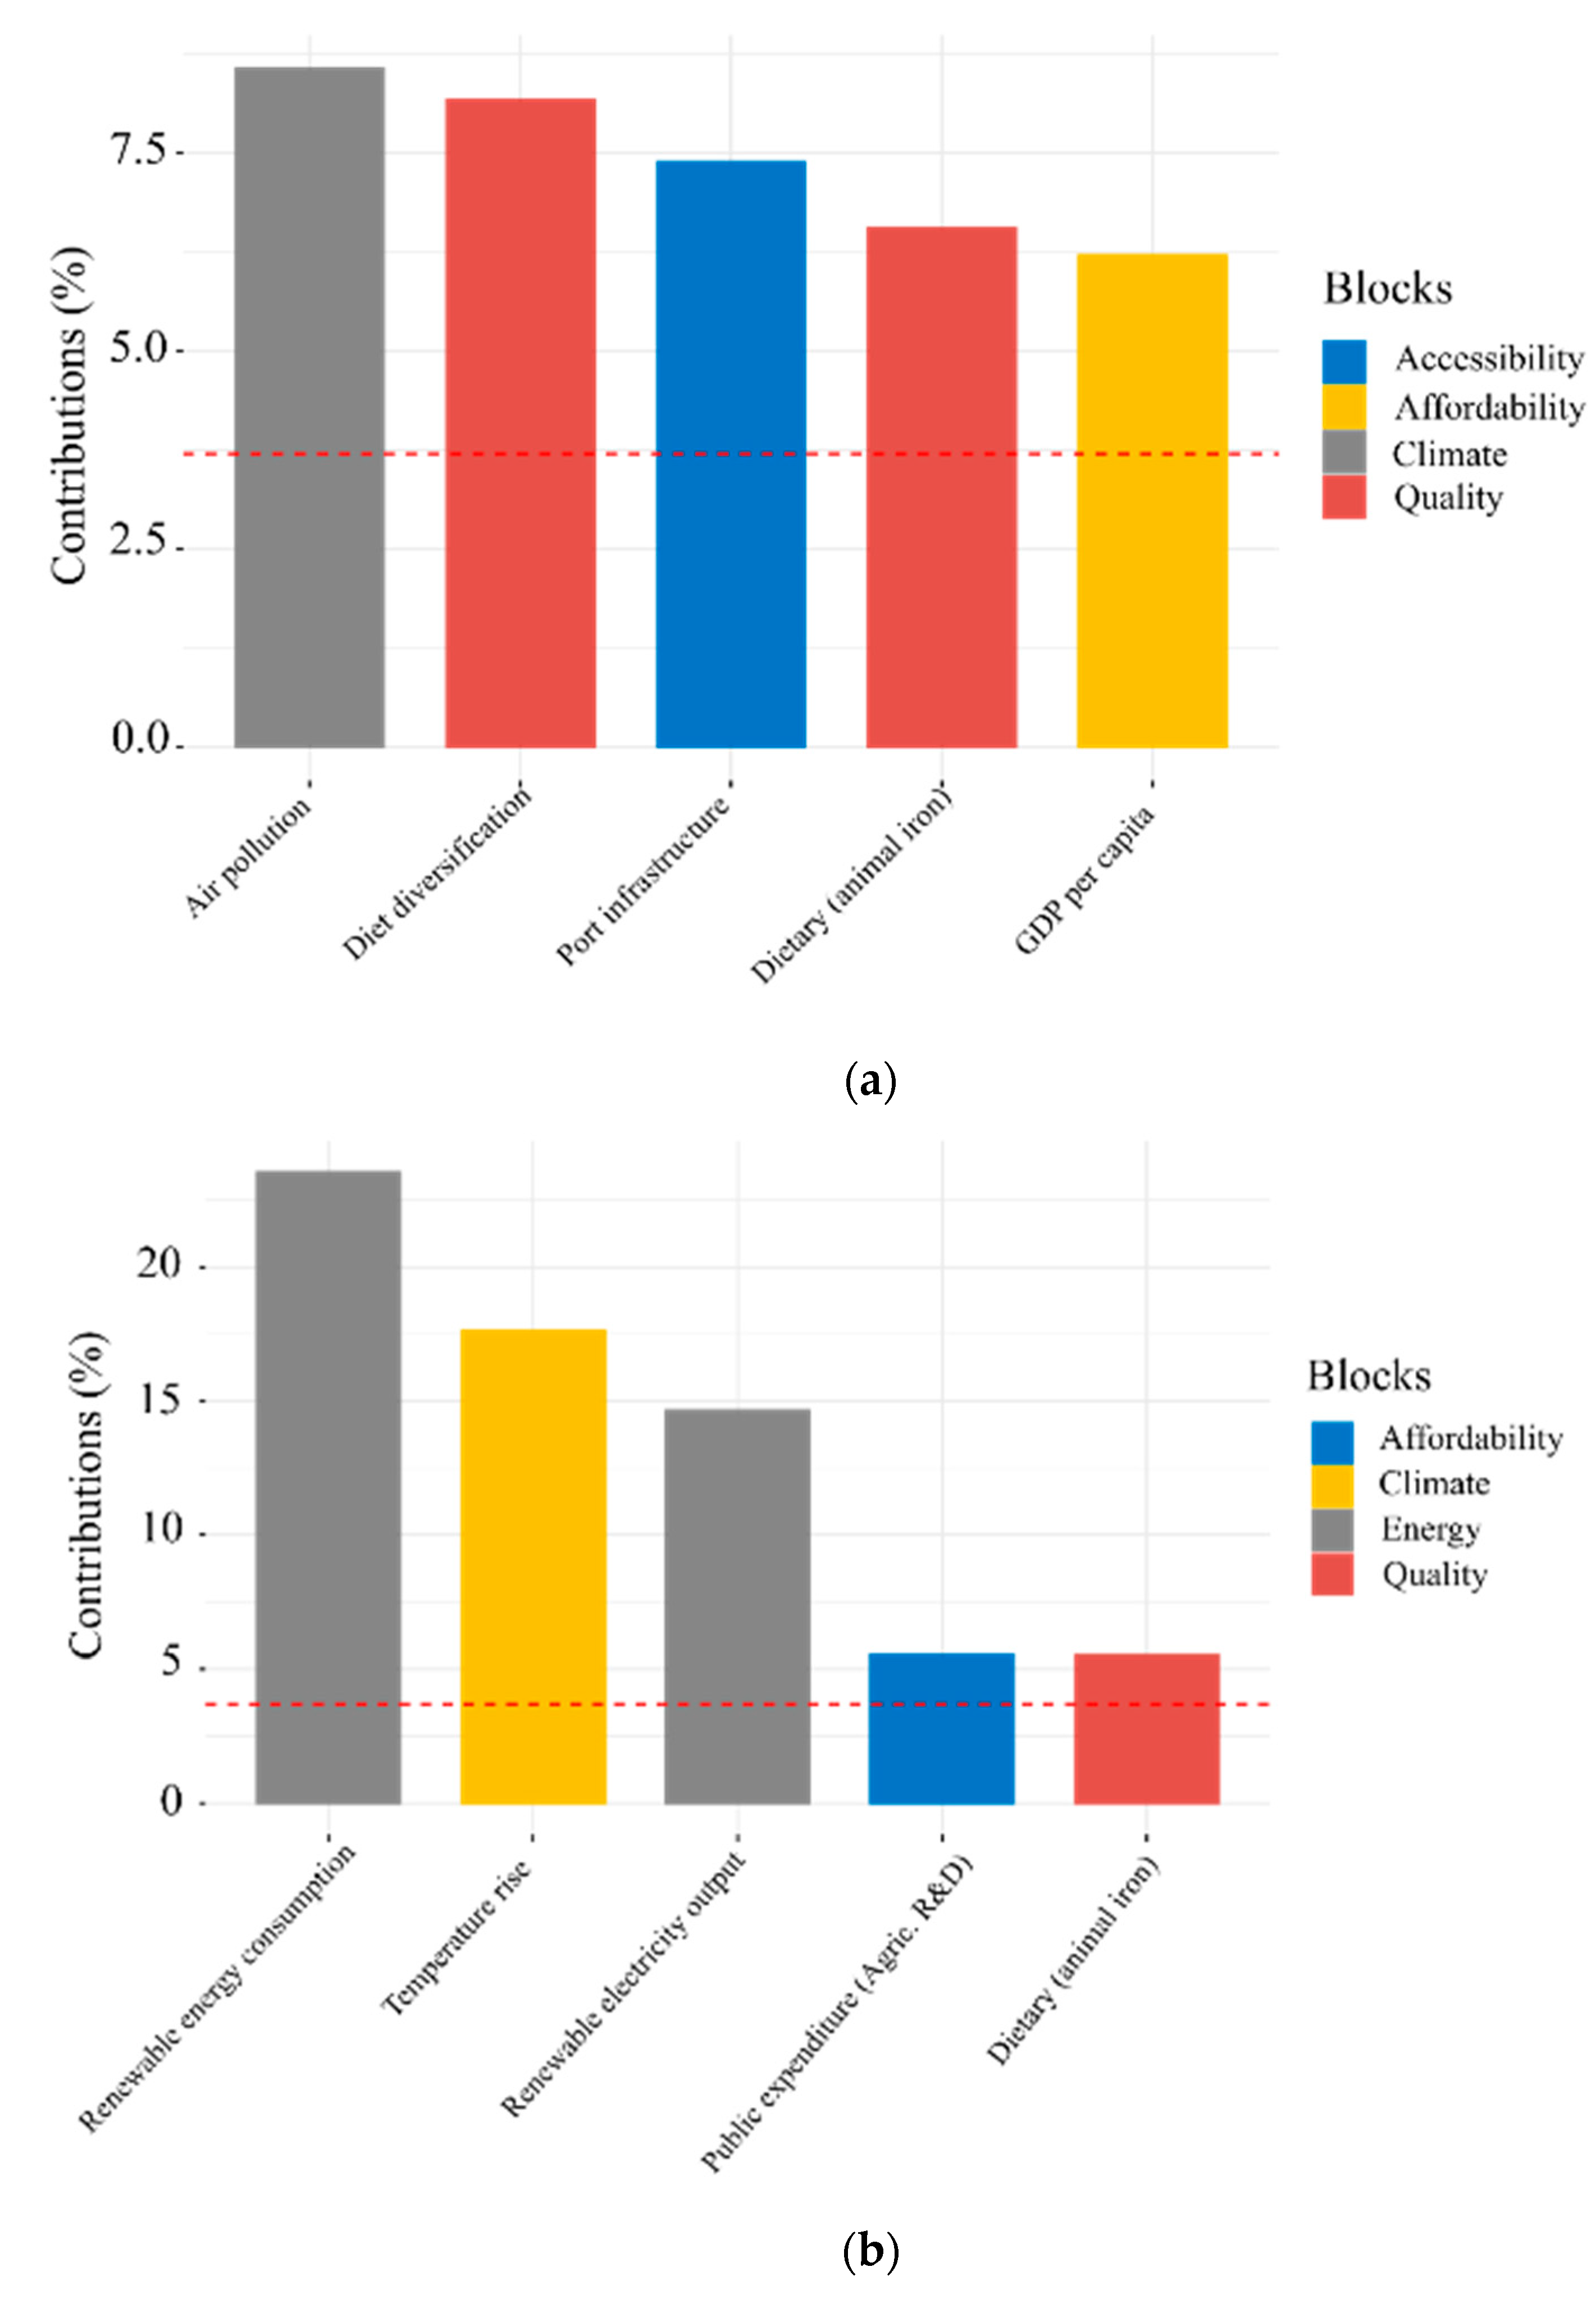
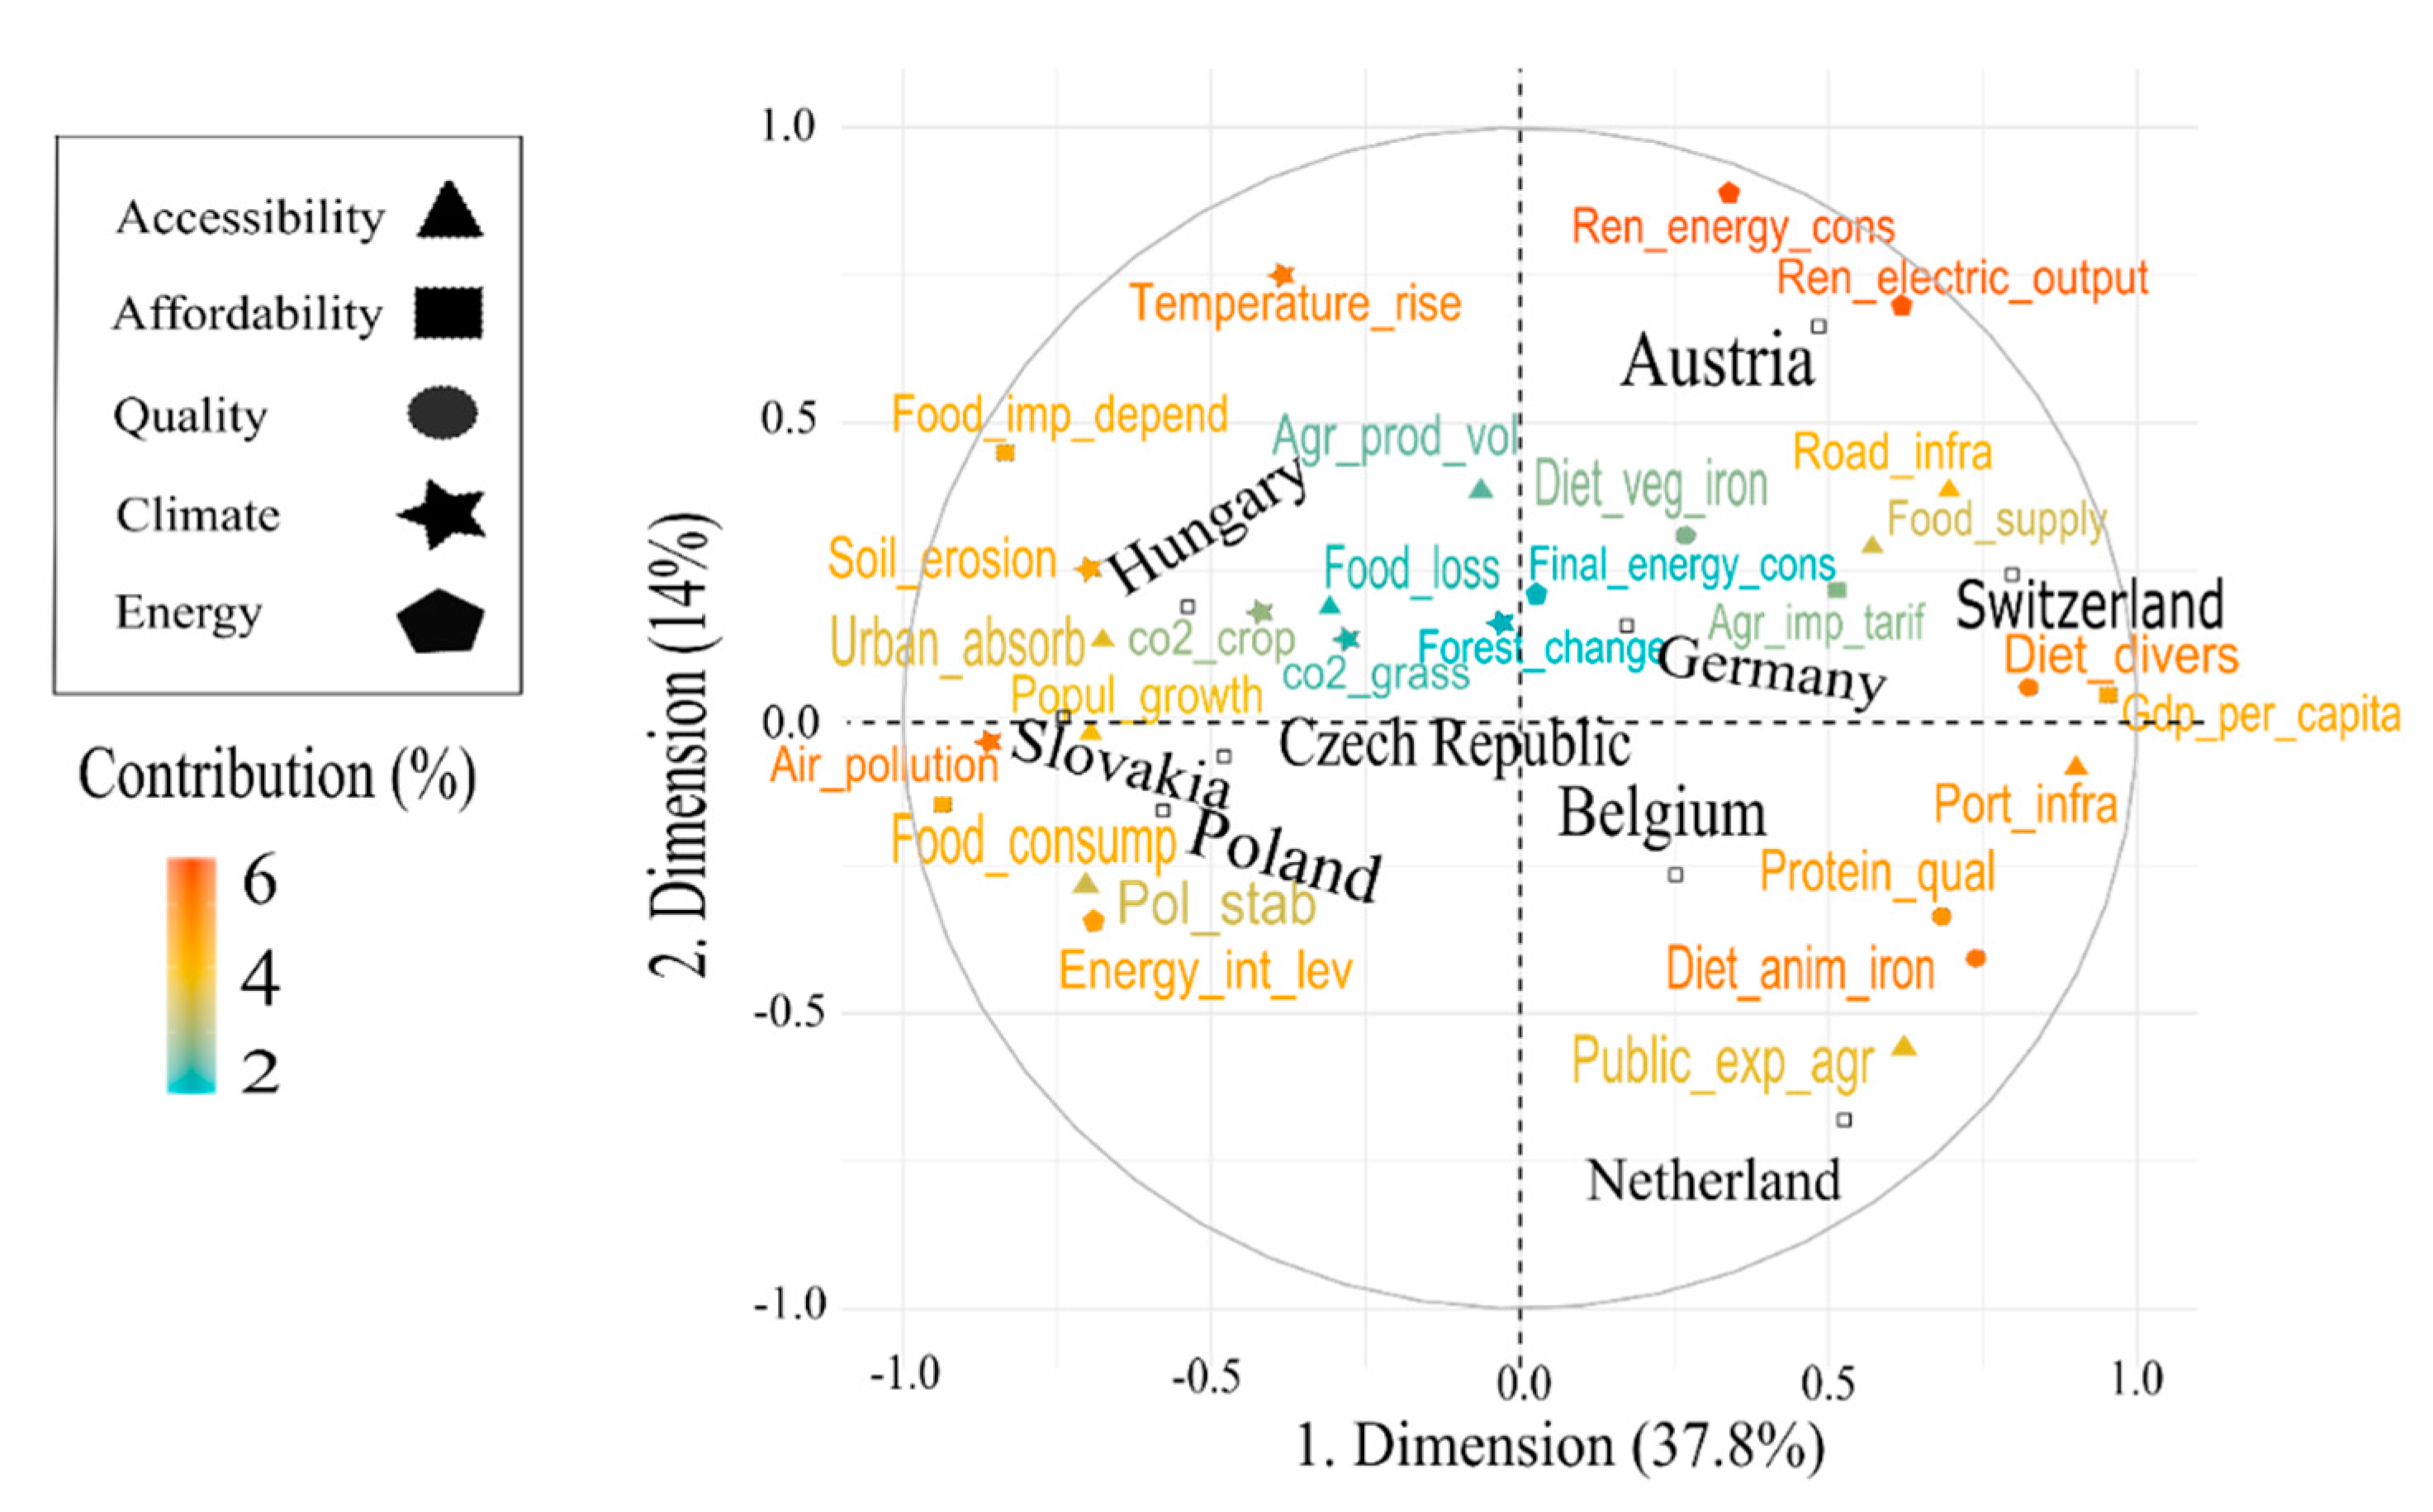
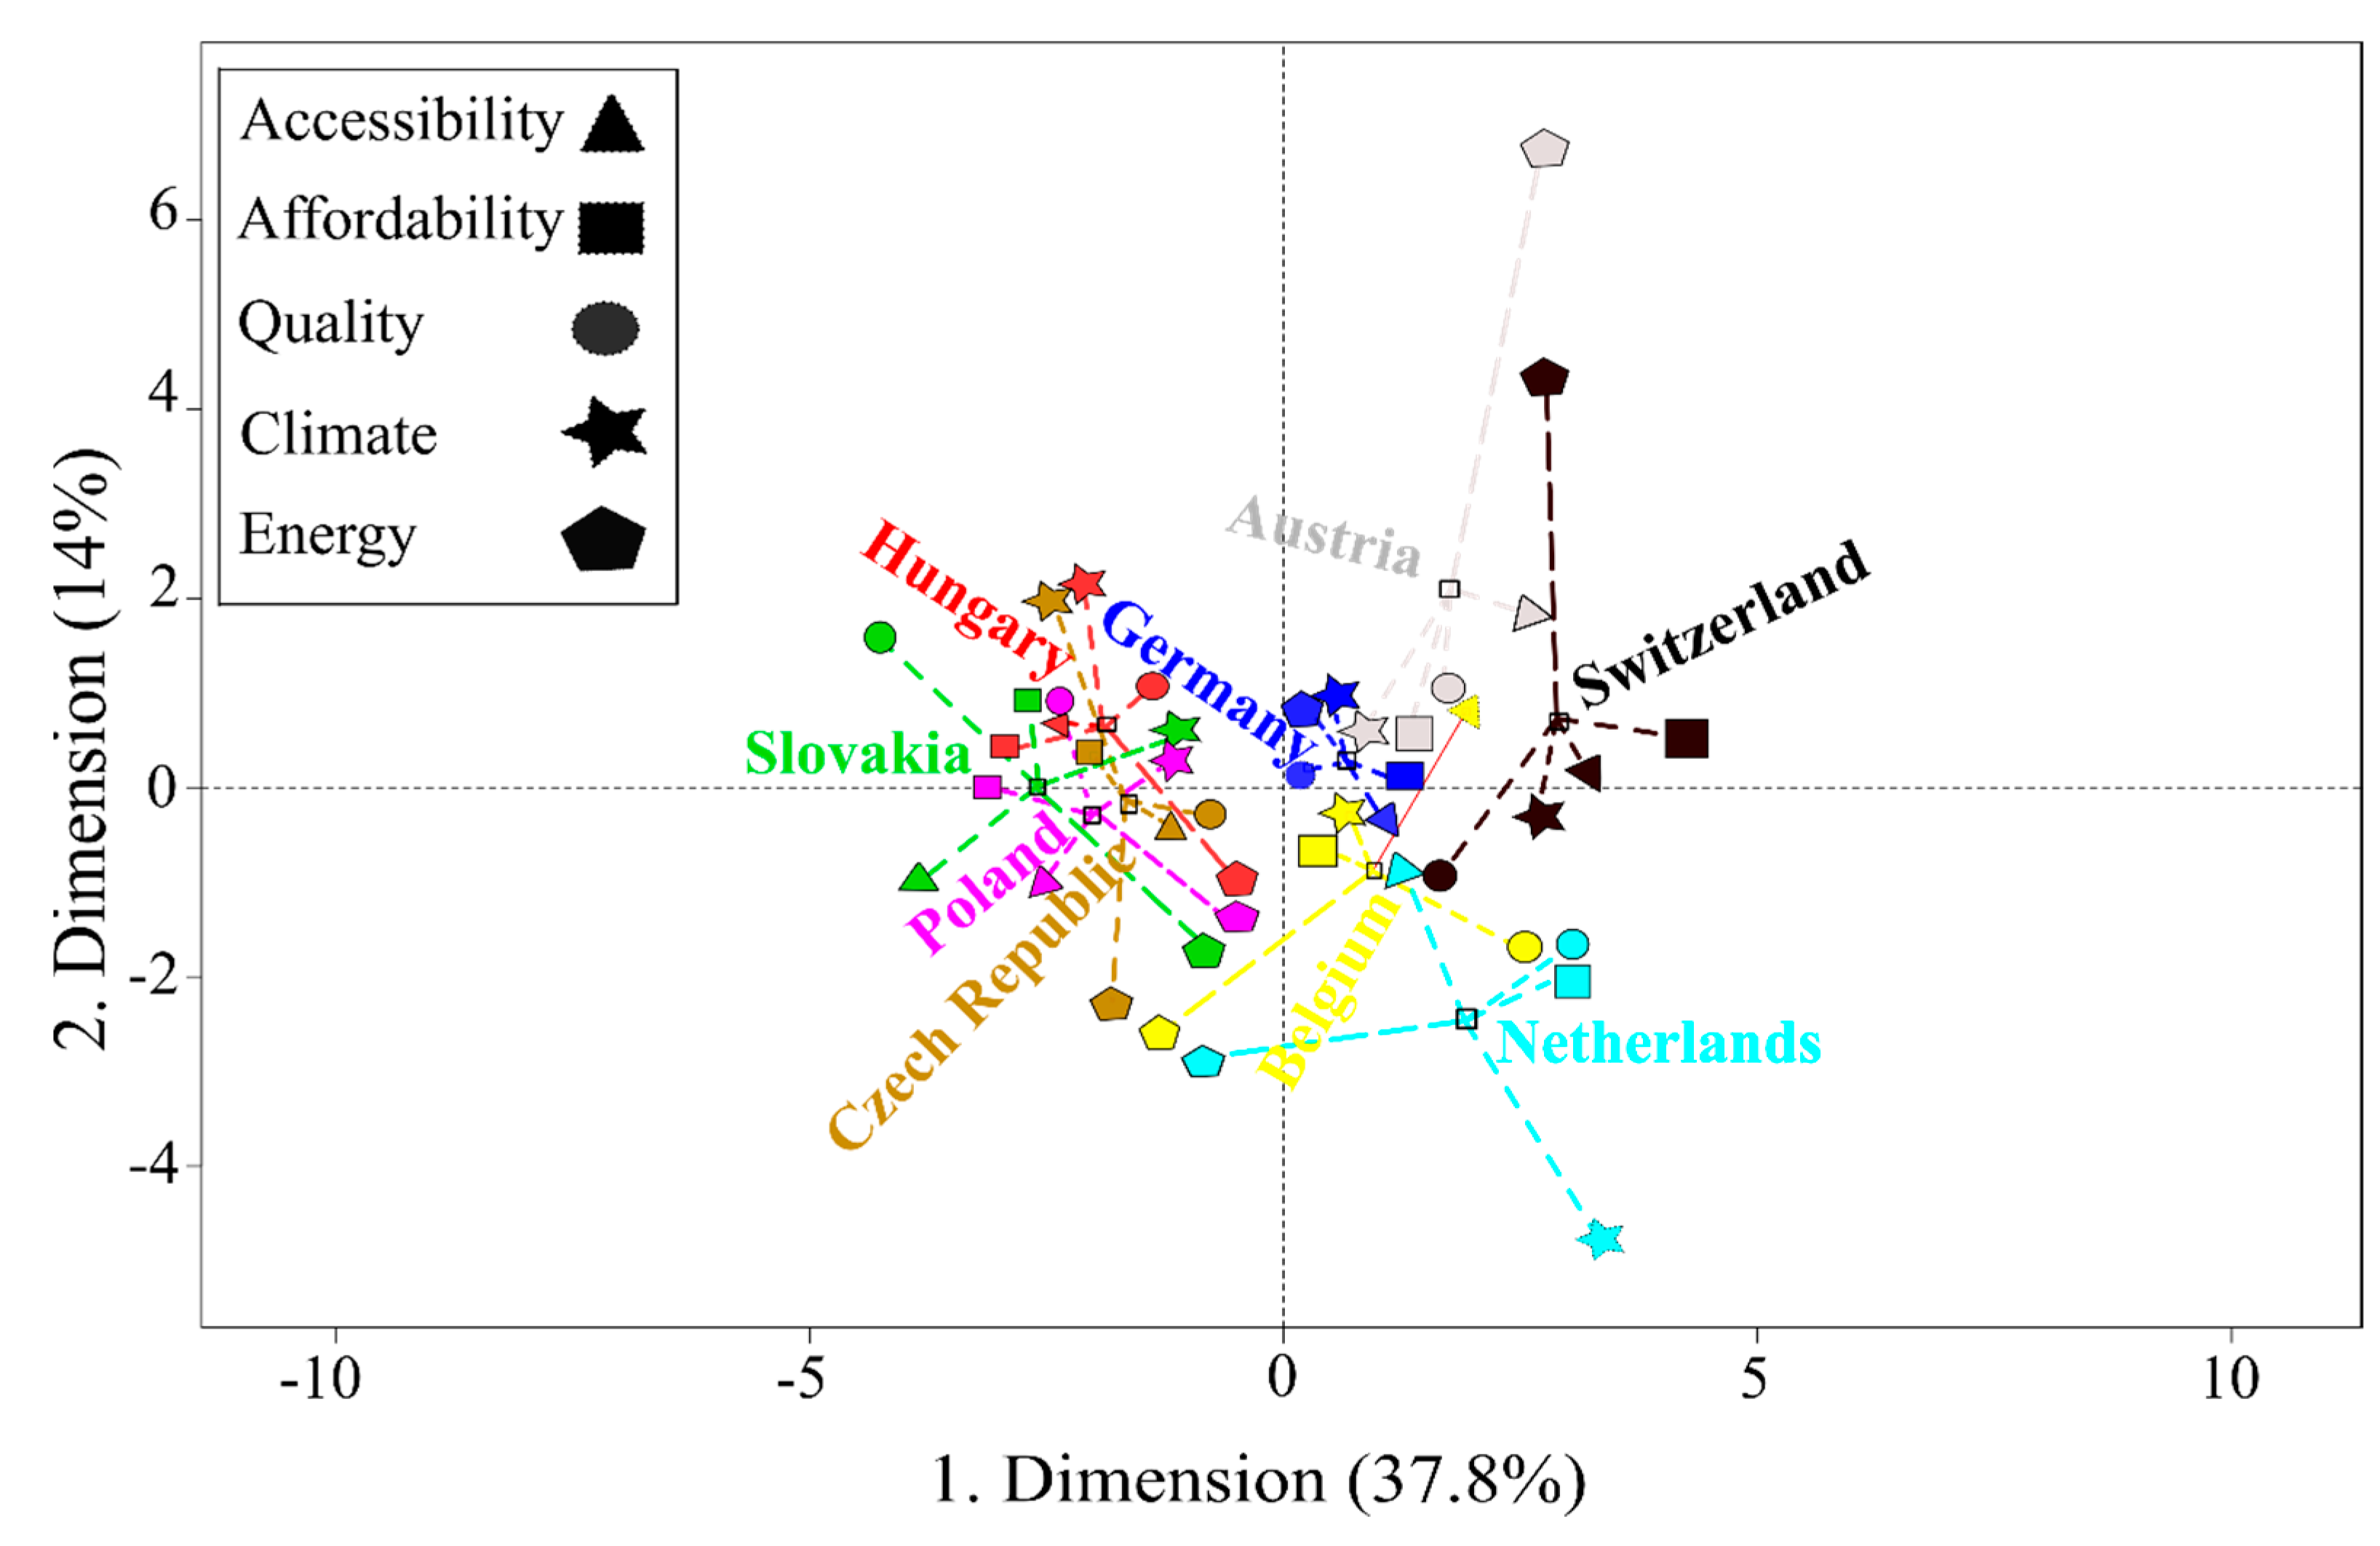
3.2. Global Space and Partial Analysis
4. Discussion
5. Conclusions
Author Contributions
Funding
Acknowledgments
Conflicts of Interest
References
- NASEM. Environmental Engineering for the 21st Century: Addressing Grand Challenges; The National Academies Press: Washington, DC, USA, 2019; ISBN 978-0-309-47652-2. [Google Scholar]
- Nakicenovic, N.; Alcamo, J.; Grubler, A.; Riahi, K.; Roehrl, R.; Rogner, H.; Victor, N. Special Report on Emissions Scenarios; Cambridge University Press: Cambridge, UK, 2000; ISBN 0 521 80081 1. [Google Scholar]
- Moss, R.H.; Edmonds, J.A.; Hibbard, K.A.; Manning, M.R.; Rose, S.K.; Van Vuuren, D.P.; Carter, T.R.; Emori, S.; Kainuma, M.; Kram, T.; et al. The next generation of scenarios for climate change research and assessment. Nature 2010, 463, 747–756. [Google Scholar] [CrossRef] [PubMed]
- van Vuuren, D.P.; Riahi, K.; Moss, R.; Edmonds, J.; Thomson, A.; Nakicenovic, N.; Kram, T.; Berkhout, F.; Swart, R.; Janetos, A.; et al. A proposal for a new scenario framework to support research and assessment in different climate research communities. Glob. Environ. Chang. 2012, 22, 21–35. [Google Scholar] [CrossRef]
- Ebi, K.L.; Hallegatte, S.; Kram, T.; Arnell, N.W.; Carter, T.R.; Edmonds, J.; Kriegler, E.; Mathur, R.; O’Neill, B.C.; Riahi, K.; et al. A new scenario framework for climate change research: Background, process and future directions. Clim. Chang. 2014, 122, 363–372. [Google Scholar] [CrossRef]
- Kriegler, E.; Edmonds, J.; Hallegatte, S.; Ebi, K.L.; Kram, T.; Riahi, K.; Winkler, H.; van Vuuren, D.P. A new scenario framework for climate change research: The concept of shared climate policy assumptions. Clim. Chang. 2014, 122, 401–414. [Google Scholar] [CrossRef]
- Paris Agreement. United Nations Treaty Collection; Paris Agreement: Paris, France, 8 July 2016. [Google Scholar]
- Riahi, K.; van Vuuren, D.P.; Kriegler, E.; Edmonds, J.; O’Neill, B.C.; Fujimori, S.; Bauer, N.; Calvin, K.; Dellink, R.; Fricko, O.; et al. The shared socioeconomic pathways and their energy, land use, and greenhouse gas emissions implications: An overview. Glob. Environ. Chang. 2017, 42, 153–168. [Google Scholar] [CrossRef]
- van Vuuren, D.P.; Stehfest, E.; Gernaat, D.E.H.J.; Doelman, J.C.; van den Berg, M.; Harmsen, M.; de Boer, H.S.; Bouwman, L.F.; Daioglou, V.; Edelenbosch, O.Y.; et al. Energy, land-use and greenhouse gas emissions trajectories under a green growth paradigm. Glob. Environ. Chang. 2017, 42, 237–250. [Google Scholar] [CrossRef]
- Dearing, J.A.; Wang, R.; Zhang, K.; Dyke, J.G.; Haberl, H.; Hossain, M.S.; Langdon, P.G.; Lenton, T.M.; Raworth, K.; Brown, S.; et al. Safe and just operating spaces for regional social-ecological systems. Glob. Environ. Chang. 2014, 28, 227–238. [Google Scholar] [CrossRef]
- Fujimori, S.; Hasegawa, T.; Masui, T.; Takahashi, K.; Herran, D.S.; Dai, H.; Hijioka, Y.; Kainuma, M. SSP3: AIM implementation of shared socioeconomic pathways. Glob. Environ. Chang. 2017, 42, 268–283. [Google Scholar] [CrossRef]
- The United Nations. The Secretary-General’s Advisory Group on the Energy and Climate Change (AGECC) Energy for a Sustainable Future. Report and Recommendations; United Nations: New York, NY, USA, 2010. [Google Scholar]
- Popp, J.; Oláh, J.; Fekete, M.F.; Lakner, Z.; Máté, D. The relationship between prices of various metals, oil and scarcity. Energies 2018, 11, 2392. [Google Scholar] [CrossRef]
- 14. Food and Agriculture Organization of the United Nations. In World Food Summit-Final Report; FAO: Rome, Italy, 13–17 November 1996. [Google Scholar]
- Calvin, K.; Bond-Lamberty, B.; Clarke, L.; Edmonds, J.; Eom, J.; Hartin, C.; Kim, S.; Kyle, P.; Link, R.; Moss, R.; et al. The SSP4: A world of deepening inequality. Glob. Environ. Chang. 2017, 42, 284–296. [Google Scholar] [CrossRef]
- Alcamo, J.; Dronin, N.; Endejan, M.; Golubev, G.; Kirilenko, A. A new assessment of climate change impacts on food production shortfalls and water availability in Russia. Glob. Environ. Chang. 2007, 17, 429–444. [Google Scholar] [CrossRef]
- Fricko, O.; Havlik, P.; Rogelj, J.; Klimont, Z.; Gusti, M.; Johnson, N.; Kolp, P.; Strubegger, M.; Valin, H.; Amann, M.; et al. The marker quantification of the Shared Socioeconomic Pathway 2: A middle-of-the-road scenario for the 21st century. Glob. Environ. Chang. 2017, 42, 251–267. [Google Scholar] [CrossRef]
- Kriegler, E.; Bauer, N.; Popp, A.; Humpenöder, F.; Leimbach, M.; Strefler, J.; Baumstark, L.; Bodirsky, B.L.; Hilaire, J.; Klein, D.; et al. Fossil-fueled development (SSP5): An energy and resource intensive scenario for the 21st century. Glob. Environ. Chang. 2017, 42, 297–315. [Google Scholar] [CrossRef]
- Vișinescu, I.; Bularda, M. Hard changes of Danube hydrological regime and its impact on agriculture in dammed territories. An. Inst. Natl. Cercet. Agric. Fundulea 2008, 76, 101–112. [Google Scholar]
- Herzon, I.; Helenius, J. Agricultural drainage ditches, their biological importance and functioning. Biol. Conserv. 2008, 141, 1171–1183. [Google Scholar] [CrossRef]
- Hasegawa, T.; Fujimori, S.; Havlík, P.; Valin, H.; Bodirsky, B.L.; Doelman, J.C.; Fellmann, T.; Kyle, P.; Koopman, J.F.L.; Lotze-Campen, H.; et al. Risk of increased food insecurity under stringent global climate change mitigation policy. Nat. Clim. Chang. 2018, 8, 699–703. [Google Scholar] [CrossRef]
- Benites-Lazaro, L.L.; Giatti, L.; Giarolla, A. Topic modeling method for analyzing social actor discourses on climate change, energy and food security. Energy Res. Soc. Sci. 2018, 45, 318–330. [Google Scholar] [CrossRef]
- García Kerdan, I.; Giarola, S.; Hawkes, A. A novel energy systems model to explore the role of land use and reforestation in achieving carbon mitigation targets: A Brazil case study. J. Clean. Prod. 2019, 232, 796–821. [Google Scholar] [CrossRef]
- Bhat, R.; Jõudu, I. Emerging issues and challenges in agri-food supply chain. In Sustainable Food Supply Chains; Elsevier: Philadelphia, PS, USA, 2019; pp. 23–37. ISBN 9780128134115. [Google Scholar]
- Tötösy, S. Comparative Central European Culture; Tötösy de Zepetnek, S., Ed.; Purdue University Press: West Lafayette, IN, USA, 2002; ISBN 1557532885. [Google Scholar]
- Kłoczowski, J. Actualité des grandes traditions de la cohabitation et du dialogue des cultures en Europe du Centre-Est. In L’heritage Historique de la Res Publica de Plusieurs Nations; KUL: Lublin, Poland, 2004; pp. 29–30. ISBN 83-85854-82-7. [Google Scholar]
- The World Bank. World Development Indicators | DataBank. Available online: https://databank.worldbank.org/data/source/world-development-indicators (accessed on 11 May 2020).
- Food and Agriculture Organization of the United Nations. Harmonized World Soil Database v 1.2. Available online: http://www.fao.org/soils-portal/soil-survey/soil-maps-and-databases/harmonized-world-soil-database-v12/en/ (accessed on 11 May 2020).
- European Intelligence Units Global Food Security Index (GFSI). Available online: https://foodsecurityindex.eiu.com/Country (accessed on 11 May 2020).
- Eurostat Energy Database. Available online: https://ec.europa.eu/eurostat/web/energy/data/database (accessed on 11 May 2020).
- FAOSTAT. Available online: http://www.fao.org/faostat/en/#data/GC (accessed on 5 March 2020).
- Clay, E. Food security: Concepts and measurement. In Trade Reforms and Food Security; Food and Agriculture Organization of the United Nations, Ed.; FAO: Rome, Italy, 2003. [Google Scholar]
- The World Bank, Global Consumption Database. Available online: http://datatopics.worldbank.org/consumption/ (accessed on 11 May 2020).
- WTO Tariff Download Facility: WTO Tariff Database. Available online: http://tariffdata.wto.org/Default.aspx?culture=en-US (accessed on 11 May 2020).
- United Nations Development Group (UNDG). Mainstreaming the 2030 Agenda for Sustainable Development Reference Guide to UN Country Teams; United Nations Development Group (UNDG): New York, NY, USA, March 2017. [Google Scholar]
- Love, P. Debate the Issues: New Approaches to Economic Challenges; OECD Insights, OECD Publishing: Paris, France, 2016; ISBN 9789264262119. [Google Scholar]
- Thurstone, L.L. Multiple factor analysis. Psychol. Rev. 1931, 38, 406–427. [Google Scholar] [CrossRef]
- Escofier, B.; Pages, J. Multiple factor analysis (AFMULT package). Comput. Stat. Data Anal. 1994, 18, 121–140. [Google Scholar] [CrossRef]
- Abdi, H.; Williams, L.J.; Valentin, D. Multiple factor analysis: Principal component analysis for multitable and multiblock data sets. Wiley Interdiscip. Rev. Comput. Stat. 2013, 5, 149–179. [Google Scholar] [CrossRef]
- Pagés, J.; Husson, F. Multiple factor analysis with confidence ellipses: A methodology to study the relationships between sensory and instrumental data. J. Chemom. 2005, 19, 138–144. [Google Scholar] [CrossRef]
- Pagès, J. Multiple factor analysis. In Multiple Factor Analysis by Example Using R.; Chapman and Hall, CRC Press: London, UK, 2014; ISBN 9781482205473. [Google Scholar]
- European Environmental Agency R Core Team (2020). Available online: http://www.eea.europa.eu/data-and-maps/indicators/oxygen-consuming-substances-in-rivers/r-development-core-team-2006 (accessed on 26 September 2020).
- Husson, F.; Josse, J.; Lê, S. FactoMineR: An R package for multivariate analysis. J. Stat. Softw. 2008, 25. [Google Scholar] [CrossRef]
- Stone, M. An asymptotic equivalence of choice of model by cross-validation and Akaike’s criterion. J. R. Stat. Soc. Ser. B. 1977, 39, 44–47. [Google Scholar] [CrossRef]
- Kohavi, R. A study of cross-validation and bootstrap for accuracy estimation and model selection. Proc. Fourteenth Int. Jt. Conf. Artif. Intell. 1995, 2, 1137–1143. [Google Scholar]
- Allen, D.M. The relationship between variable selection and data augmentation and a method for prediction. Technometrics 1974, 16, 125–127. [Google Scholar] [CrossRef]
- Wilcoxon, F. Individual comparisons by ranking methods. Biom. Bull. 1945, 1, 80–83. [Google Scholar] [CrossRef]
- Solorio, I. Bridging the gap between environmental policy integration and the EU’s energy policy: Mapping out the “Green Europeanisation” of energy governance. J. Contemp. Eur. Res. 2011, 7, 396–416. [Google Scholar]
- Birdsall, N.; Ross, D.; Sabot, R. Inequality and growth reconsidered: Lessons from East Asia. World Bank Econ. Rev. 1995, 9, 477–508. [Google Scholar] [CrossRef]
- Ramey, G.; Ramey, V.A. Cross-Country evidence on the link between volatility and growth. Am. Econ. Rev. 1995, 85, 1138–1151. [Google Scholar]
- Timmer, C.P. The macro dimensions of food security: Economic growth, equitable distribution, and food price stability. Food Policy 2000, 25, 283–295. [Google Scholar] [CrossRef]
- Timmer, C.P. Food security and economic growth: An Asian perspective. Asia. Pac. Econ. Lit. 2005, 19, 1–17. [Google Scholar] [CrossRef]
- Strauss, J. The Impact of Improved Nutrition on Labor Productivity and Human Resource Development: An. Economic Perspective; Yale University, Economic Growth Center: New Haven, CT, USA, 1985. [Google Scholar]
- Deolalikar, A.B. Nutrition and labor productivity in agriculture: Estimates for rural South India. Rev. Econ. Stat. 1988, 70, 406–413. [Google Scholar] [CrossRef]
- Miyamoto, K.; Kawase, F.; Imai, T.; Sezaki, A.; Shimokata, H. Dietary diversity and healthy life expectancy—An international comparative study. Eur. J. Clin. Nutr. 2019, 73, 395–400. [Google Scholar] [CrossRef]
- Haseeb, M.; Kot, S.; Hussain, H.I.; Jermsittiparsert, K. Impact of economic growth, environmental pollution, and energy consumption on health expenditure and R&D expenditure of ASEAN countries. Energies 2019, 12, 3598. [Google Scholar] [CrossRef]
- Walls, H.L.; Backholer, K.; Proietto, J.; McNeil, J.J. Obesity and trends in life expectancy. J. Obes. 2012, 2012, 107989. [Google Scholar] [CrossRef][Green Version]
- Kang, Y.; Khan, S.; Ma, X. Climate change impacts on crop yield, crop water productivity and food security—A review. Prog. Nat. Sci. 2009, 19, 1665–1674. [Google Scholar] [CrossRef]
- Khan, S.; Hanjra, M.; Mu, J. Water management and crop production for food security in China: A review. Agric. Water Manag. 2009, 96, 349–360. [Google Scholar] [CrossRef]
- Hepperly, P. Environmental, energetic and economic comparisons of organic and conventional farming systems. Bioscience 2009, 55, 573–582. [Google Scholar] [CrossRef]
- Przybylak, R.; Oliński, P.; Koprowski, M.; Filipiak, J.; Pospieszyńska, A.; Chorążyczewski, W.; Puchałka, R.; Dąbrowski, H.P. Droughts in the area of Poland in recent centuries in the light of multi-proxy data. Clim. Past 2020, 16, 627–661. [Google Scholar] [CrossRef]
- Van De Geijn, S.C.; Dijkstra, P. Physiological Effects of Changes. In Atmospheric Carbon Dioxide Concentration and Temperature on Growth and Water Relations of Crop Plants; Springer: Dordrecht, The Netherlands, 1995; pp. 89–99. [Google Scholar]
- Misi, D.; Puchałka, R.; Pearson, C.; Robertson, I.; Koprowski, M. Differences in the climate-growth relationship of scots pine: A case study from Poland and Hungary. Forests 2019, 10, 243. [Google Scholar] [CrossRef]
- Bauweraerts, I.; Wertin, T.M.; Ameye, M.; Mcguire, M.A.; Teskey, R.O.; Steppe, K. The effect of heat waves, elevated [CO2] and low soil water availability on northern red oak (Quercus rubra L.) seedlings. Glob. Chang. Biol. 2013, 19, 517–528. [Google Scholar] [CrossRef] [PubMed]
- Puchałka, R.; Koprowski, M.; Przybylak, J.; Przybylak, R.; Dąbrowski, H.P. Did the late spring frost in 2007 and 2011 affect tree-ring width and earlywood vessel size in Pedunculate oak (Quercus robur) in northern Poland? Int. J. Biometeorol. 2016, 60, 1143–1150. [Google Scholar] [CrossRef]
- Leolini, L.; Moriondo, M.; Fila, G.; Costafreda-Aumedes, S.; Ferrise, R.; Bindi, M. Late spring frost impacts on future grapevine distribution in Europe. F. Crop. Res. 2018, 222, 197–208. [Google Scholar] [CrossRef]
- Pulatov, B.; Linderson, M.L.; Hall, K.; Jönsson, A.M. Modeling climate change impact on potato crop phenology, and risk of frost damage and heat stress in northern Europe. Agric. For. Meteorol. 2015, 214–215, 281–292. [Google Scholar] [CrossRef]
- Boulanger, P.-M. Sustainable development indicators: A scientific challenge, a democratic issue. Surv. Perspect. Integr. Environ. Soc. 2008, 1, 59–73. [Google Scholar] [CrossRef]
- Allen, C.; Metternicht, G.; Wiedmann, T. National pathways to the Sustainable Development Goals (SDGs): A comparative review of scenario modelling tools. Environ. Sci. Policy 2016, 66, 199–207. [Google Scholar] [CrossRef]
- Shah, I.H.; Dong, L.; Park, H.S. Tracking urban sustainability transition: An eco-efficiency analysis on eco-industrial development in Ulsan, Korea. J. Clean. Prod. 2020, 262, 121286. [Google Scholar] [CrossRef]
- Mouratiadou, I.; Biewald, A.; Pehl, M.; Bonsch, M.; Baumstark, L.; Klein, D.; Popp, A.; Luderer, G.; Kriegler, E. The impact of climate change mitigation on water demand for energy and food: An integrated analysis based on the Shared Socioeconomic Pathways. Environ. Sci. Policy 2016, 64, 48–58. [Google Scholar] [CrossRef]
- Gielen, D.; Boshell, F.; Saygin, D.; Bazilian, M.D.; Wagner, N.; Gorini, R. The role of renewable energy in the global energy transformation. Energy Strateg. Rev. 2019, 24, 38–50. [Google Scholar] [CrossRef]
- Lechtenböhmer, S.; Nilsson, L.J.; Åhman, M.; Schneider, C. Decarbonising the energy intensive basic materials industry through electrification–Implications for future EU electricity demand. Energy 2016, 115, 1623–1631. [Google Scholar] [CrossRef]
- Ramachandran Nair, P.K.; Nair, V.D.; Mohan Kumar, B.; Showalter, J.M. Carbon Sequestration in Agroforestry Systems; Elsevier: Philadelphia, PS, USA, 2010; Volume 108, ISBN 978-94-007-1630-8. [Google Scholar]
- Saygin, D.; Gielen, D.J.; Draeck, M.; Worrell, E.; Patel, M.K. Assessment of the technical and economic potentials of biomass use for the production of steam, chemicals and polymers. Renew. Sustain. Energy Rev. 2014, 40, 1153–1167. [Google Scholar] [CrossRef]
- Liu, W.; Xu, J.; Xie, X.; Yan, Y.; Zhou, X.; Peng, C. A new integrated framework to estimate the climate change impacts of biomass utilization for biofuel in life cycle assessment. J. Clean. Prod. 2020, 267, 122061. [Google Scholar] [CrossRef]
- Sun, F.; Dai, Y.; Yu, X. Air pollution, food production and food security: A review from the perspective of food system. J. Integr. Agric. 2017, 16, 2945–2962. [Google Scholar] [CrossRef]
- Wang, H.; Zhang, X.; Ma, Y.; Hou, Y. Mitigation potential for carbon and nitrogen emissions in pig production systems: Lessons from the North China Plain. Sci. Total Environ. 2020, 725, 138482. [Google Scholar] [CrossRef]
- Masiol, M.; Harrison, R.M. Aircraft engine exhaust emissions and other airport-related contributions to ambient air pollution: A review. Atmos. Environ. 2014, 95, 409–455. [Google Scholar] [CrossRef]
- Ul Haque, A.; Yamoah, F.A.; Sroka, W. Willingness to reduce food choice in favour of sustainable alternatives: The role of government and consumer behaviour. Contrib. Manag. Sci. 2020, 31–51. [Google Scholar] [CrossRef]
- Palacios-Argüello, L.; Gondran, N.; Nouira, I.; Girard, M.A.; Gonzalez-Feliu, J. Which is the relationship between the product’s environmental criteria and the product demand? Evidence from the French food sector. J. Clean. Prod. 2020, 244, 118588. [Google Scholar] [CrossRef]
- Gençer, E.; Miskin, C.; Sun, X.; Khan, M.; Bermel, P.; Alam, M.; Agrawal, R. Directing solar photons to sustainably meet food, energy, and water needs. Sci. Rep. 2017, 7, 3133. [Google Scholar] [CrossRef]
- Weidner, T.; Yang, A.; Hamm, M.W. Consolidating the current knowledge on urban agriculture in productive urban food systems: Learnings, gaps and outlook. J. Clean. Prod. 2019, 209, 1637–1655. [Google Scholar] [CrossRef]
- Nishimura, S.; Sawamoto, T.; Akiyama, H.; Sudo, S.; Yagi, K. Methane and nitrous oxide emissions from a paddy field with Japanese conventional water management and fertilizer application. Glob. Biogeochem. Cycles 2004, 18. [Google Scholar] [CrossRef]
- Sheriff, G. Efficient waste? Why farmers over-apply nutrients and the implications for policy design. Rev. Agric. Econ. 2005, 27, 542–557. [Google Scholar] [CrossRef]
- Dorward, L.J. Where are the best opportunities for reducing greenhouse gas emissions in the food system (including the food chain)? A comment. Food Policy 2012, 37, 463–466. [Google Scholar] [CrossRef]
- Tuomisto, H.L.; Hodge, I.D.; Riordan, P.; Macdonald, D.W. Does organic farming reduce environmental impacts?—A meta-analysis of European research. J. Environ. Manage. 2012, 112, 309–320. [Google Scholar] [CrossRef] [PubMed]
- Friel, S.; Dangour, A.D.; Garnett, T.; Lock, K.; Chalabi, Z.; Roberts, I.; Butler, A.; Butler, C.D.; Waage, J.; McMichael, A.J.; et al. Public health benefits of strategies to reduce greenhouse-gas emissions: Food and agriculture. Lancet 2009, 374, 2016–2025. [Google Scholar] [CrossRef]
- Burton, R.J.F. The potential impact of synthetic animal protein on livestock production: The new “war against agriculture”? J. Rural Stud. 2019, 68, 33–45. [Google Scholar] [CrossRef]
- Popp, J.; Lakner, Z.; Harangi-Rákos, M.; Fári, M. The effect of bioenergy expansion: Food, energy, and environment. Renew. Sustain. Energy Rev. 2014, 32, 559–578. [Google Scholar] [CrossRef]
- Leisner, C.P. Review: Climate change impacts on food security-focus on perennial cropping systems and nutritional value. Plant. Sci. 2020, 293, 110412. [Google Scholar] [CrossRef]
- Hotelling, H. Relations between two sets of variates. Biometrika 1936, 28, 321–377. [Google Scholar] [CrossRef]
- Barnes, D.; Wilkerson, T.; Stephan, M. Contributing to the development of grand challenges in maths education. In Proceedings of the 13th International Congress on Mathematical Education, Hamburg, Germany, 24–31 July 2016; Kaiser, G., Ed.; Springer International Publishing: Cham, Switzerland, 2017; pp. 703–704. [Google Scholar]


| Pillar | Period | Indicator | Source * | Abbreviation | Measurement |
|---|---|---|---|---|---|
| Climate Change | 2012–2017 | Air pollution | W.B. | air_pollution | Micrograms per cubic meter |
| 2012–2018 | CO2 emission (Cropland) | W.B., FAO | co2_crop | Gigagrams | |
| 2012–2018 | CO2 emission (Grassland) | W.B., FAO | co2_grass | Gigagrams | |
| 2017–2018 | Soil erosion | HWSD | soil_erosion | Score (1–4) 1 = best | |
| 2017–2018 | Forest area | W.B. | forest_change | % of the total land | |
| 2012–2018 | Temperature rise | EIU | temperature_rise | Score 0 = least vulnerable | |
| Energy Use | 2012–2015 | Energy intensity level | W.B. | energy_int_level | Megajoule at PPP ** GDP |
| 2012–2018 | Renewable electricity output | EUROSTAT | ren_electric_output | % of total output | |
| 2012–2018 | Renewable energy consumption | EUROSTAT | ren_energy_cons | % of the final energy | |
| 2012–2018 | Final energy consumption from biomass and renewable waste | EUROSTAT | final_energy_cons | Thousand tons of oil equivalent | |
| Food Affordability (FAF) | 2012–2018 | Food consumption as a share of household expenditure | W.B. | food_consump | % of total household expenditure |
| 2012–2018 | Gross Domestic Product (GDP) per capita | EIU | gdp_per_capita | USD at PPP ** per capita | |
| 2012–2018 | Agricultural import tariffs | WTO | agr_imp_tarif | % (Percent) | |
| 2012–2018 | Food import dependency | FAO | food_imp_depend | % (Percent) | |
| Food Accessibility (FAC) | 2012–2018 | Average food supply | FAO | food_supply | Kcal/person/day |
| 2012–2018 | Volatility of agricultural production | EIU | agr_prod_vol | Standard Deviation (0–1) | |
| 2012–2018 | Urban absorption capacity | EIU | urban_absorb | GDP (% of real change)-period of urban growth | |
| 2012–2018 | Population growth | W.B., EIU | population_growth | % (Percent) | |
| 2012–2018 | Road infrastructure | EIU | road_infra | Score (0–4) 4 = best | |
| 2012–2018 | Port infrastructure | EIU | port_infra | Score (0–4) 4 = best | |
| 2012–2018 | Political stability | EIU | pol_stab | Score (0–100) 100 = best | |
| 2012–2018 | Public expenditure on agricultural R&D | EIU | pub_exp_agrrd | Score (1–9) 9 = highest | |
| 2012–2018 | Food loss | FAO | food_loss | Waste/supply (ton) | |
| Food Quality (FQ) | 2012–2018 | Diet diversification | FAO, EIU | diet_divers | % (Percent) |
| 2012–2018 | Dietary availability of vegetal iron | FAO | diet_veg_iron | Mg/person/day | |
| 2012–2018 | Dietary availability of animal iron | FAO | diet_anim_iron | Mg/person/day | |
| 2012–2018 | Protein quality | EIU | protein_qual | Score (0–100) 100 = best |
| Component | Explained Variance (%) | Bootstrap Simulation * (p-value) | Permutation Test Within Each Block * (p-value) | Split-Half Test * (p-value) | LOO ** Validation (% of Variation) |
|---|---|---|---|---|---|
| 1 | 37.8% | 0.794 | <0.001 | 0.320 | 6.9 |
| 2 | 14.0% | 0.132 | 0.056 | 0.802 | 14.7 |
| 3 | 13.5% | 0.502 | <0.001 | 0.173 | 8.3 |
Publisher’s Note: MDPI stays neutral with regard to jurisdictional claims in published maps and institutional affiliations. |
© 2020 by the authors. Licensee MDPI, Basel, Switzerland. This article is an open access article distributed under the terms and conditions of the Creative Commons Attribution (CC BY) license (http://creativecommons.org/licenses/by/4.0/).
Share and Cite
Máté, D.; Rabbi, M.F.; Novotny, A.; Kovács, S. Grand Challenges in Central Europe: The Relationship of Food Security, Climate Change, and Energy Use. Energies 2020, 13, 5422. https://doi.org/10.3390/en13205422
Máté D, Rabbi MF, Novotny A, Kovács S. Grand Challenges in Central Europe: The Relationship of Food Security, Climate Change, and Energy Use. Energies. 2020; 13(20):5422. https://doi.org/10.3390/en13205422
Chicago/Turabian StyleMáté, Domicián, Mohammad Fazle Rabbi, Adam Novotny, and Sándor Kovács. 2020. "Grand Challenges in Central Europe: The Relationship of Food Security, Climate Change, and Energy Use" Energies 13, no. 20: 5422. https://doi.org/10.3390/en13205422
APA StyleMáté, D., Rabbi, M. F., Novotny, A., & Kovács, S. (2020). Grand Challenges in Central Europe: The Relationship of Food Security, Climate Change, and Energy Use. Energies, 13(20), 5422. https://doi.org/10.3390/en13205422