Article

Optimization of Year-End Water Level of Multi-Year Regulating Reservoir in Cascade Hydropower System Considering the Inflow Frequency Difference

1
Hydro-Intelligence Institute, Huazhong University of Science and Technology, Wuhan 430074, China
2
College of Civil Engineering and Architecture, Zhejiang University, Hangzhou 310058, China
3
School of Electrical and Electronic Engineering, Hubei University of Technology, Wuhan 430068, China
*
Authors to whom correspondence should be addressed.
Energies 2020, 13(20), 5345; https://doi.org/10.3390/en13205345
Submission received: 11 September 2020 / Revised: 10 October 2020 / Accepted: 12 October 2020 / Published: 14 October 2020
(This article belongs to the Section A: Sustainable Energy)

Abstract

:
In order to analyze the year-end water level of multi-year regulating reservoir of the cascade hydropower system, this paper studied the joint operation optimization model of cascade reservoirs and its solving method based on multi-dimensional dynamic programming, and analyzed the power generation impact factors of cascade system that contains multi-year regulating reservoir. In particular, taking the seven reservoirs in the middle and lower reaches of Yalong River as an example, the optimal year-end water levels of multi-year regulating reservoir under the multi-year average situation and different inflow frequencies situation were studied. Based on the optimal calculation results of multi-dimensional dynamic programming, the inflow frequency difference considered operation rule of year-end water level of Lianghekou reservoir was extracted using the least square principle. The simulation results showed that, compared with the fixed year-end water level in multi-year, the extracted rule can improve the cascade power generation by more than 400 million kWh in an average year, representing an increase of 0.4%. This result means that the extracted rule can give full play to the regulation performance of multi-year regulating reservoir and improve the conversion efficiency of hydropower resources in cascade system. This is of great significance to the practical operation of cascade reservoirs system that contains multi-year regulating reservoir.

Graphical Abstract

1. Introduction

Hydropower energy is a kind of high-quality and efficient energy which is developing rapidly all over the world. It has the characteristics of being clean and pollution-free, renewable, low operation cost, fast start-up and shutdown speed, rapid output response, etc. [1,2]. In particular, the fast response to power load makes hydropower energy often be used as peak load and frequency modulation power supply, system load standby power supply, etc. [3]. It plays an extremely important role in the safe and stable operation of power system [4].
At present, the development and utilization of hydropower energy is mainly through building dams and reservoirs in the river, centralizing and raising the water head of the scattered water energy resources, and then converting the water energy into electric energy efficiently through the hydro generator unit in hydropower station. For the type of reservoir, according to its regulation performance, it can be divided into daily regulating reservoir, seasonal regulating reservoir, annual regulating reservoir, and multi-year regulating reservoir [5], etc. The regulating reservoir here means the reservoir that has a certain storage capacity which can be used to regulate the inflow process. The regulating performance corresponds to the available storage capacity.
In general, the flow water of the river has the characteristics of dry–wet change law within the year, and the different water quantity between years. Considering the periodicity of hydrological year, the actual reservoir operation generally takes a hydrological year as the operation period. At this time, the annual regulating reservoir can well regulate the water inequality within the year [6]. However, in the actual hydrological process, there is also some difference between the annual water volumes (i.e., different water quantity between years), so it is necessary to carry out water distribution and regulation between years. Only by making full use of the regulation capacity of the regulating reservoirs and carrying out reasonable water distribution between years, can the abandoned water of the reservoir be reduced as much as possible, and the multi-year power generation of cascade reservoir system can be maximized. The multi-year regulating reservoir can achieve the water distribution between years at this time [7]. Therefore, for the multi-year regulating reservoir, how to determine its operation mode in a regulation cycle has a great impact on the final power generation benefit.
At present, the research on the operation mode of multi-year regulating reservoir mainly focuses on how to determine the reasonable year-end water level. The year-end water level here means the water level of multi-year regulating reservoir at the end of a hydrological year in regulation cycle. For example, Zhang et al. [8] presented a new method of deriving an operational model (rules) for the year-end water level of multi-year regulating reservoir, which considered all of the operational information using decision trees. Guo et al. [9] researched the year-end water level problem of multi-year regulating reservoir for timed power tariff. Aiming at the optimization problem of year-end water level of long period storage reservoir, Wang and Yuan [10] established the optimal model based time-of-use pricing by considering long-term optimal generation scheduling characteristics. Based on the analysis of the determining methods of year-end water level for the multi-year regulating reservoir, Liu et al. [11] studied the year-end water level problem by using two prediction methods which were multi-objective decision model and statistical regression predictive function. Wang et al. [12] developed an operational model that used for determining the optimal year-end water level of multi-year regulating reservoir, and was validated using the case of Longyangxia reservoir in the upper reaches of Yellow River, China. Considering the power market environments and long-term scheduling of power generation, Yuan and Wang [13] developed an optimal model to simulate the year-end water level of a multi-year regulating reservoir.
However, it can be seen that most of the previous studies have focused on the separate operation of multi-year regulating reservoir. With the construction and operation of various types of reservoirs, the cascade reservoirs system with the water quantity and water head connection of upstream and downstream has gradually formed [14]. After the formation of cascade reservoirs, the traditional single reservoir operation method has not been able to meet the needs of the joint operation of cascade system [15,16]. Therefore, at this time, it is necessary to study the operation mode of multi-year regulating reservoir in the cascade reservoirs system [17]; that is, to determine the optimal year-end water level of the multi-year regulating reservoir in cascade system. In addition, the current researches on the operation mode of multi-year regulating reservoir only considered the year-end water level from the perspective of multi-year average, and ignored the impact of inflow frequency difference in different years [18]. So, there are still some deficiencies to be improved. The inflow frequency here is the empirical frequency corresponding to each year, obtained after frequency calculation of inflow water for many years. For specific calculation method, please refer to the literature by Liu et al. [17].
In view of this, in order to extract the practical determination rules of year-end water level under different inflow frequencies, this paper takes the multi-year regulating reservoir in the cascade system as the research object, and studies the optimal year-end water level of multi-year regulating reservoir after the formation of cascade reservoirs system. The research results are of great significance to the practical operation of cascade reservoirs system that includes the multi-year regulating reservoir. The following parts of this paper are organized as follows. Section 2 is the Methodology, including the joint operation optimization model of cascade reservoirs, the model solving method based on multi-dimensional dynamic programming, the power generation analysis and the year-end water level optimization of multi-year regulating reservoir. Section 3 presents the case study by taking the seven reservoirs in the middle and lower reaches of Yalong River as an example, the optimal year-end water level of Lianghekou reservoir under multi-year average situation and different inflow frequencies situation are studied, and the results will be presented and analyzed in this section. Finally, the conclusions of this study will be provided in Section 4.

2. Methodology

2.1. Cascade Reservoirs Operation Optimization Model

A significant benefit derived from a cascade reservoirs system is the clean and renewable hydropower energy. By developing an optimal plan over the entire planning horizon, the cascade reservoirs operation optimization model aims at maximizing the power generation while satisfying some constraints, including water volume balance constraints, reservoir volume limits constraints, outflow limits constraints, power generation limits constraints, boundary conditions limits constraints, etc. Generally, the objective function of this optimization model can be represented as follows [19].
E = max i = 1 n t = 1 T N t i Δ t = max i = 1 n t = 1 T K i q t i H t i Δ t
where E is the total power generation over the whole operation period, unit: kWh; T is the number of stages over the whole operation period; Nti is the output of the ith hydropower station in the tth stage, unit: kW, and the reservoir indexes from upstream to downstream are 1, 2, …, n; Ki is the efficiency coefficient of the ith hydropower station; qti is the outflow through the turbines of the ith reservoir in the tth stage, unit: m3/s; Hti is the average water head of the ith hydropower station in the tth stage, unit: m; Δt is the duration of a stage, unit: h; and the specific value of Δt here can be determined according to the actual data.
The following equality and inequality constraints are considered in the model.
(1)
Water volume balance constraints,
q t i = ( V t 1 i V t i ) / 3600 Δ t + I t i + Q t i 1 W t i E p t i
where Vit is the storage volume of the ith reservoir in the tth stage, unit: m3; I t i is the inflow water of the ith reservoir in the tth stage, unit: m3/s; Qit is the total outflow water of the ith reservoir in the tth stage, unit: m3/s; Wti is the abandoned outflow water through the flood outflow gate of the ith reservoir in the tth stage, unit: m3/s; and Epti is the evaporation capacity of the ith reservoir in the tth stage, unit: m3/s.
(2)
Reservoir volume limits constraints
V t , min i V t i V t , max i
where Vit,min is the lower limit of Vit; Vit,max is the upper limit of Vit.
(3)
Outflow limits constraints
Q t , min i Q t i Q t , max i
where Qit,min the lower limit of Qit; Qit,max is the upper limit of Qit.
(4)
Power generation limits constraints
N t , min i N t i N t , max i
where Nit,min is the lower limit of Nit; Nit,max is the upper limit of Nit; Nit,min is usually determined by the allowed minimum output; and Nit,max is usually determined by the installed capacity and expected output of hydropower station.
(5)
Boundary conditions limits constraints
V 0 i = V b i V T i = V e i
where V0i is the storage volume of the ith reservoir at the beginning of the first stage; Vbi is the storage volume of the ith reservoir at the beginning of the whole operation period; VTi is the storage volume of the ith reservoir at the end of the Tth stage; and Vei is the storage volume of the ith reservoir at the end of the whole operation period.

2.2. Model Solving Based on Multidimensional Dynamic Programming

Dynamic programming is a branch of operations research and a mathematical method to solve the optimization problem of decision-making process. In the early 1950s, Bellman et al. (1951) put forward this method when studying the optimization problem of multi-stage decision-making process. This method transforms the multi-stage process into a series of single-stage problems and solves them progressively using the relationship between each stage [20]. Dynamic programming has the advantages of global convergence, no requirement for initial solution, and good at solving the multi-stage and nonlinear problems. Based on this, dynamic programming is often used to solve the reservoir operation optimization problems, in particular, the single reservoir operation optimization problems [21].
Dynamic programming can be used to solve the multi-stage decision-making problems recursively, and the reservoir operation optimization problem can be regarded as a multi-stage decision-making problem by dividing the whole operation period of reservoir into a series of short stages (time intervals). In the application of dynamic programming in solving the reservoir operation optimization problem, there is a recursive procedure which can be expressed by the following recursive equation for the tth stage [22].
f t * ( V t 1 ) = max D t { N t ( V t 1 , Q t ) + f t + 1 * ( V t ) } f T + 1 * ( V T ) = 0 }
where ft*(V) is the optimal cumulative output; Vt is the state variable at the beginning of the tth stage; Nt() is the output of the tth stage determined by Vt−1 and Qt; Qt is the decision variable which is determined by Vt−1 and Vt; and Dt is a set of feasible decisions that satisfy the constraints of reservoir. The cumulative output means the sum of the output of each stage in the candidate process from present stage t to last stage T, and the optimal cumulative output means the sum of the output in the optimal candidate process. In the reverse recursion procedure, starting from the last stage, the output can be calculated up to the first stage, and the optimal operation processes can be obtained at last by a chronological order recursion calculation.
The number of reservoirs is two or more in cascade reservoirs operation optimization problem, and many variables and constraints are involved in solving this optimization problem. For example, if there is a cascade system that contains n reservoirs, then Mn combinations of discrete points of storage volume can be obtained if the discrete accuracy of storage volume for each reservoir is M. According to the reverse recursion calculation of dynamic programming in reservoir operation optimization problem, each combination can be taken as a state. Then, the reverse recursion calculation can be carried out by the exhaustive enumeration over all storage volume combinations of each stage. The optimal storage volume combination of each stage can be got by the chronological order recursion calculation at last, and the maximal total power generation over the entire planning horizon can be obtained too. In solving the cascade reservoirs operation optimization problem, the recursive equation of multidimensional dynamic programming can be formulated as follows,
F t * ( V t 1 ) = max D t { N t ( V t 1 , Q i ) + F t + 1 * ( V t ) } F T + 1 * ( V T ) = 0 }
where Vt−1 = (Vt−11, Vt−12, …, Vt−1n)’ is the state variable vector; Qt = (Qt1, Qt2, …, Qtn)’ is the decision variable vector; and Vt1, Vt2, and Vt3 are respectively discretized to M discrete points, i.e., (Vt1,1, Vt1,2, …, Vt1,M), (Vt2,1, Vt2,2, …, Vt2,M), and (Vtn,1, Vtn,2, …, Vtn,M).
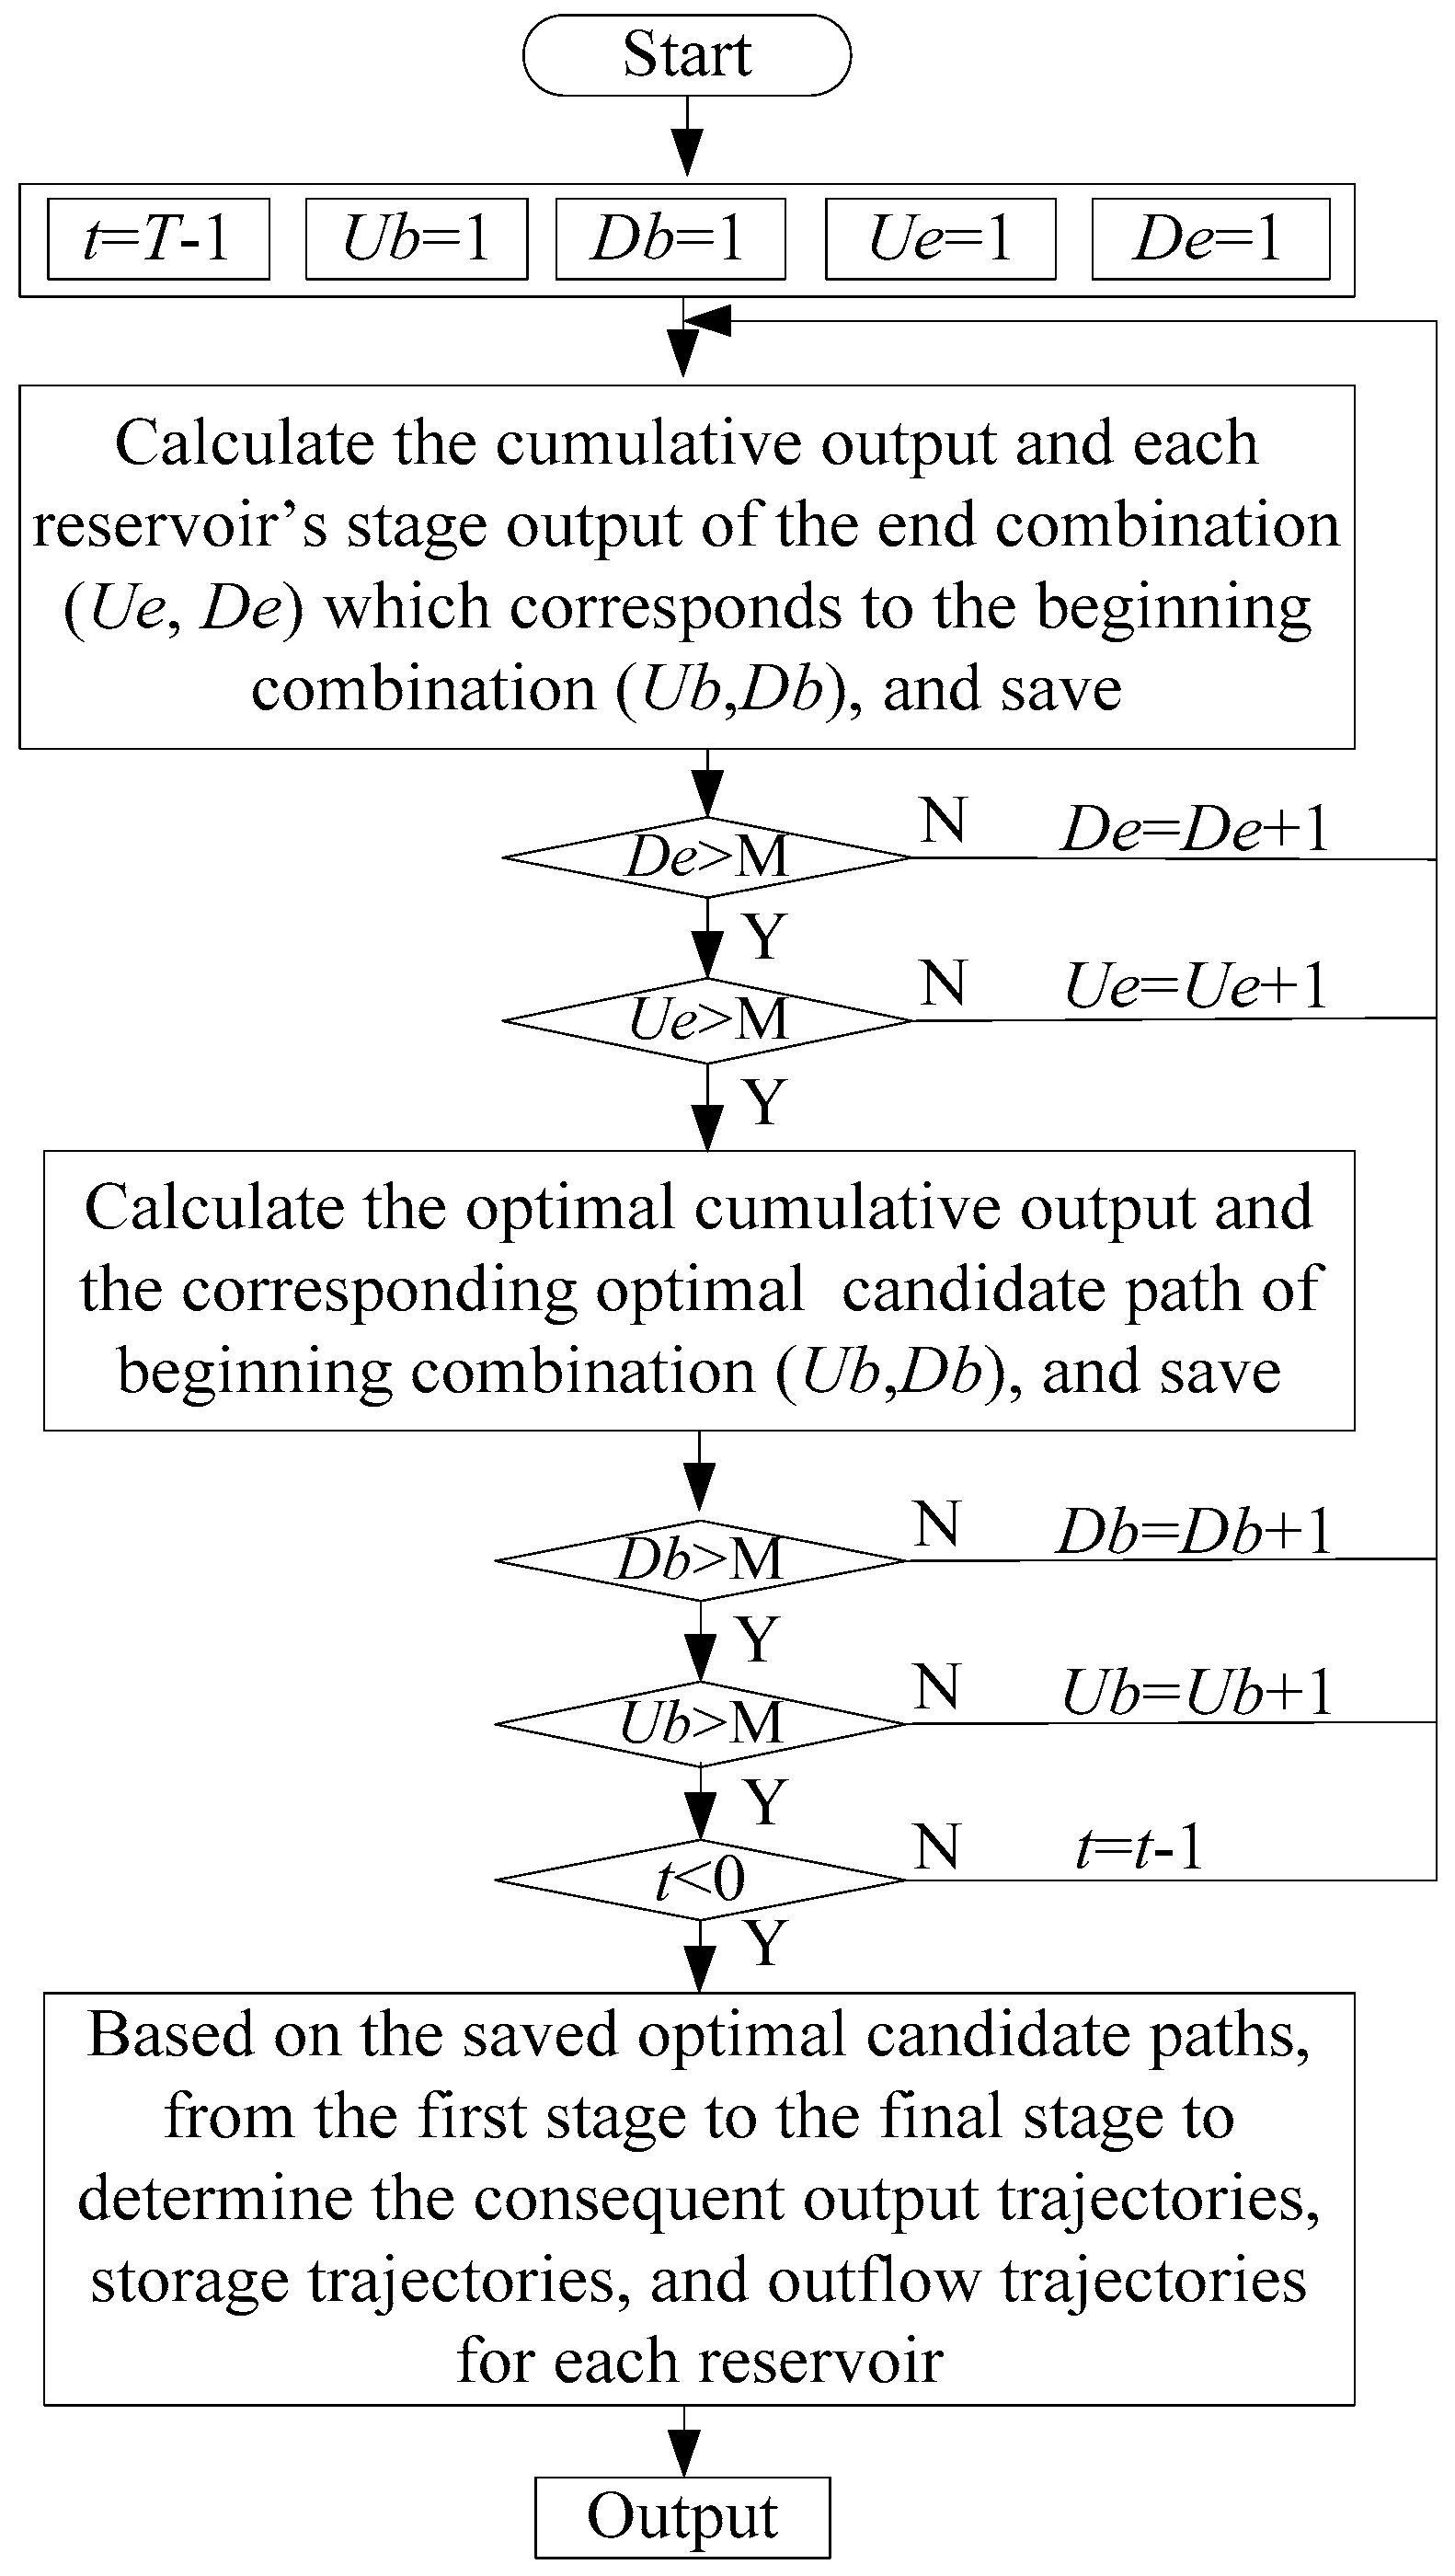
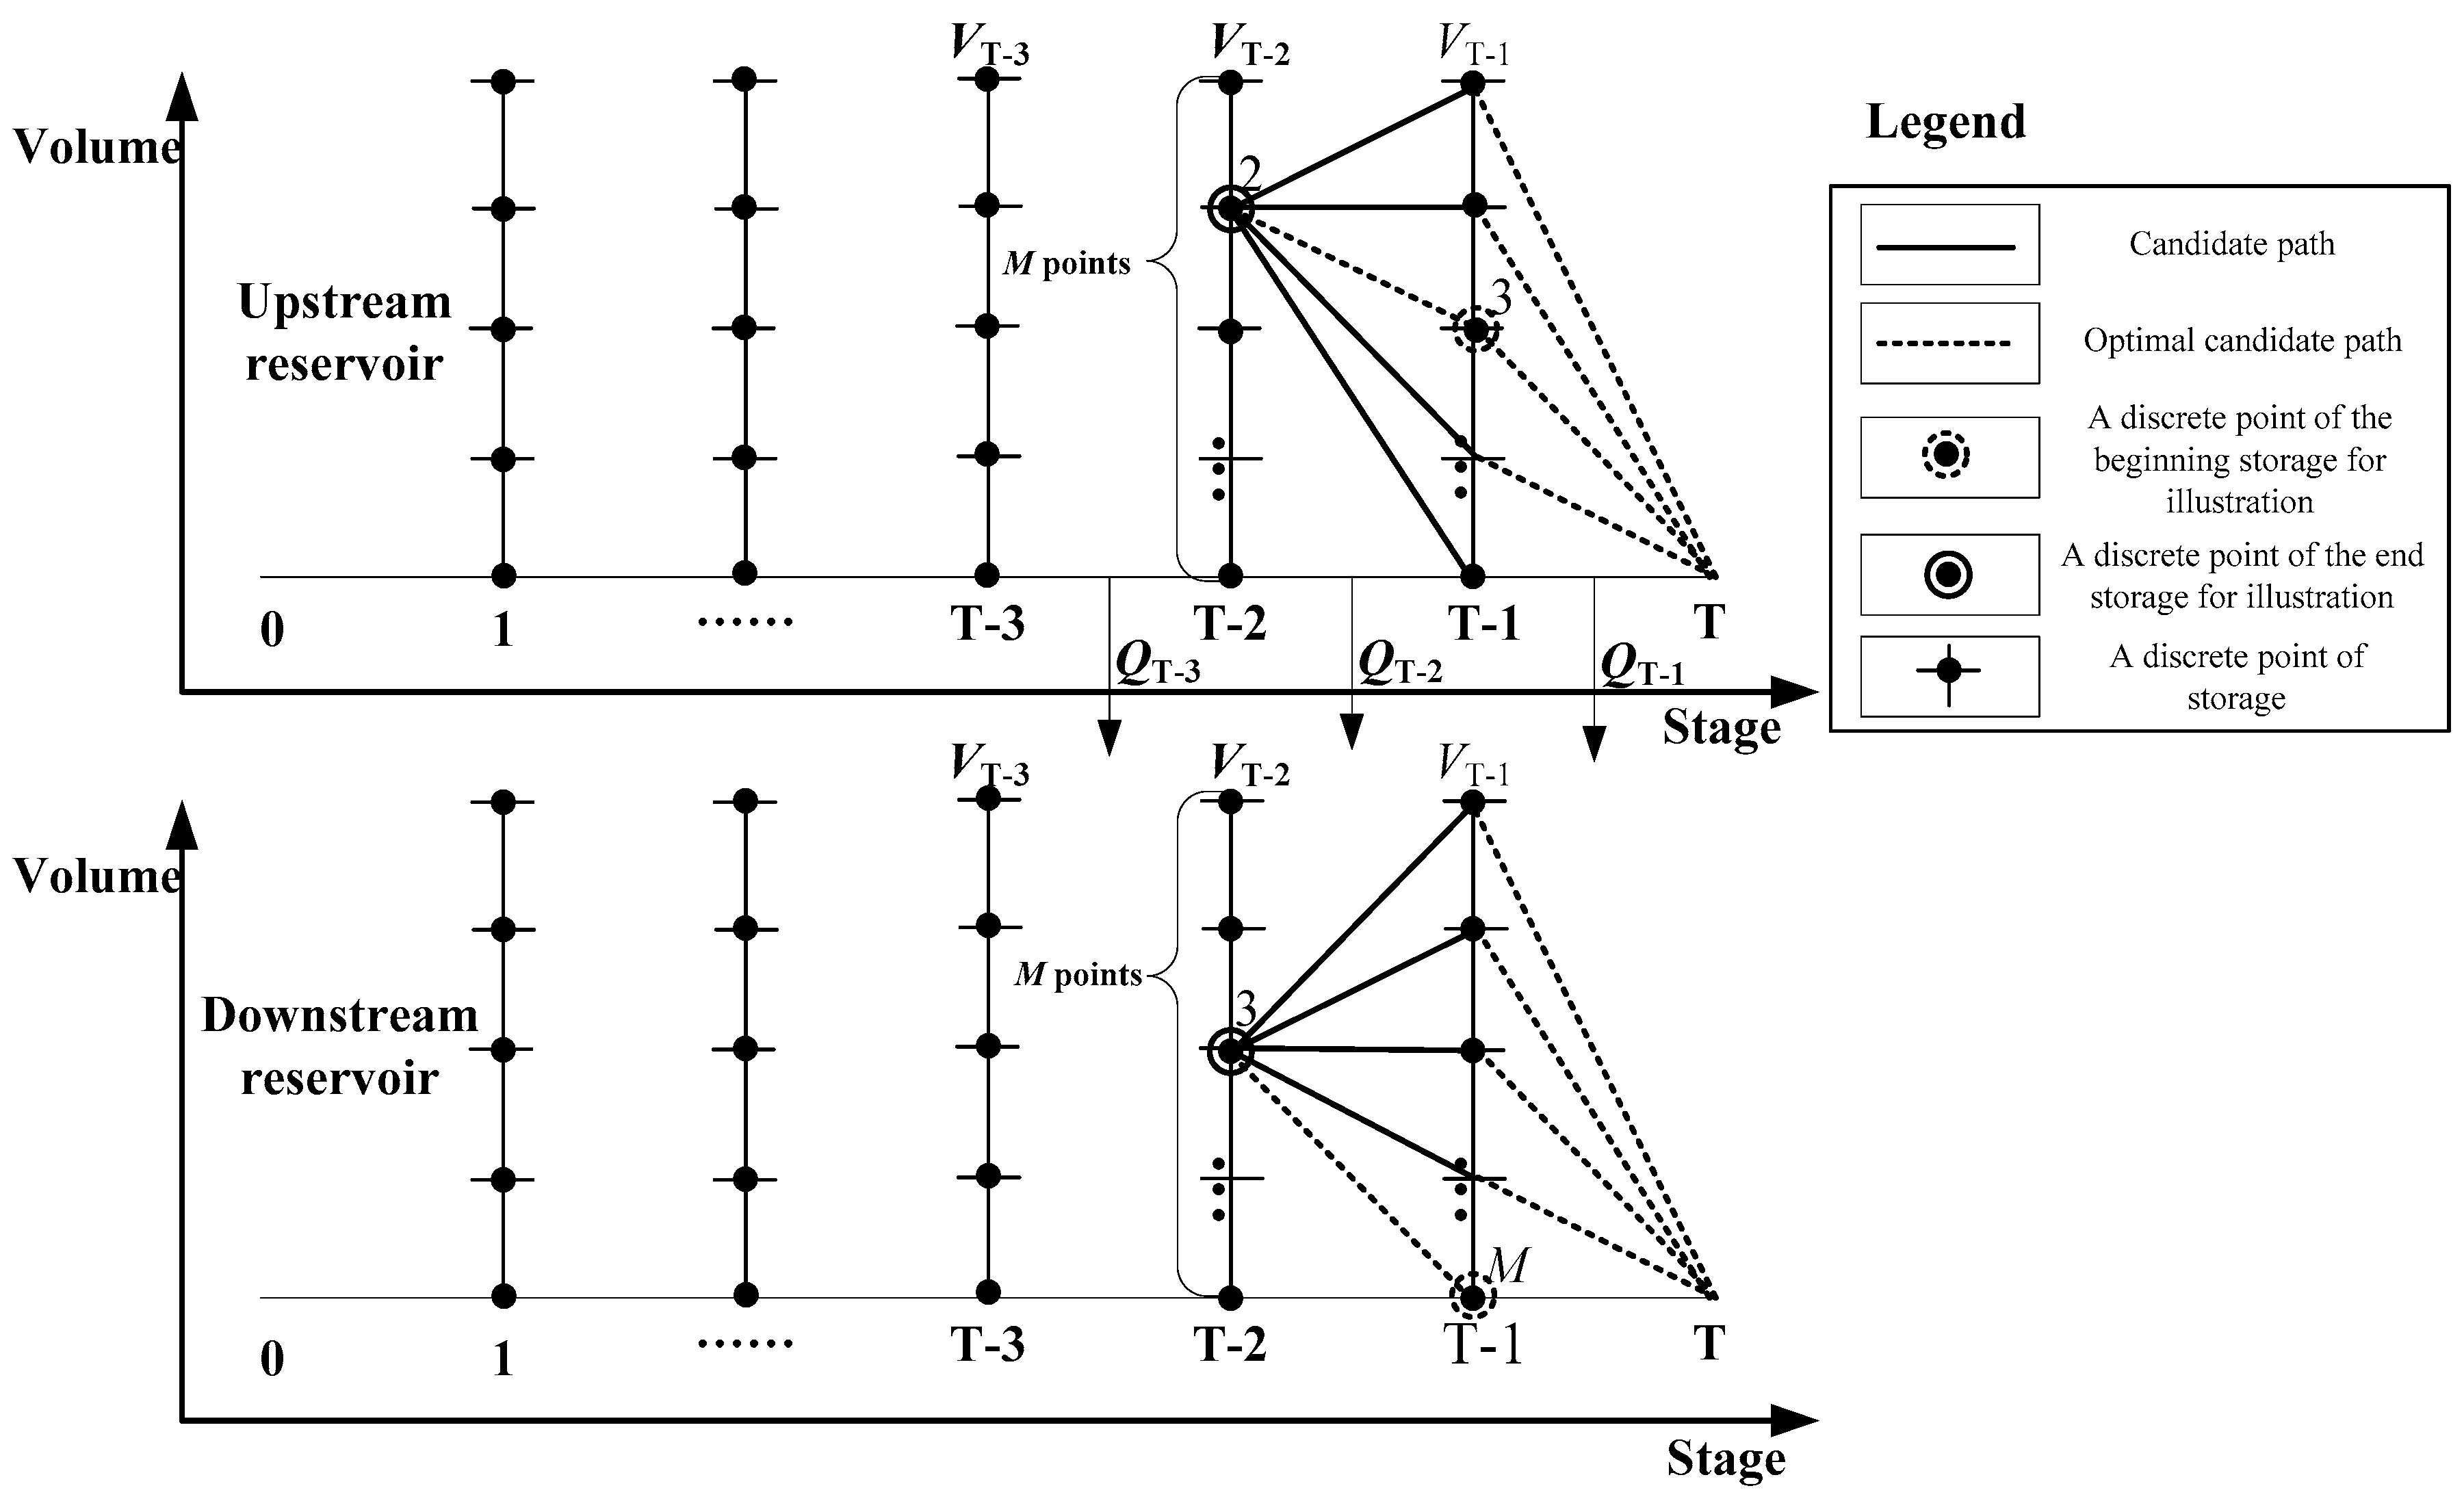
Taking a hydropower station system which has two reservoirs as an example, the whole flowchart of multi-dimensional dynamic programming in solving the cascade reservoirs operation optimization problem can be illustrated by Figure 1, and its reverse recursion calculation procedure can be expressed with Figure 2. In Figure 1, Ub and Db represent the index of beginning state variable of upstream and downstream reservoirs, respectively. Ue and De represent the index of end state variable of upstream and downstream reservoirs, respectively. M is the number of discrete points of storage volume for each reservoir. Each beginning combination (Ub and Db) and end combination (Ue and De) constitute a candidate paths of a stage, so there are M2 end combinations corresponding to one beginning combination in calculating the optimal candidate paths of a stage.
The reverse recursion procedure can be described as follows.
Step 1: In the last stage T, there are M discretized points for the storage volume of each reservoir at the beginning of this stage, and M2 combinations of these discretized points can be obtained. Because the storage volumes are fixed at the end of this stage, the optimal candidate path of each combination is unique at this moment.
Step 2: In stage T − 1, the storage volumes of each reservoir are not fixed at the end of this stage, so there are also M discretized points for the storage volume of each reservoir and M2 combinations for these discretized points. For any combination at the beginning of this stage, we can find out its optimal candidate path by traversing all M2 combinations of the storage volume at the end of this stage. Then, save the optimal candidate path and the cumulative output of this combination for the usage of next stage.
Step 3: Repeats step 2, then the calculation of stage T − 1 can be finished by implementing the same work for the other M2 − 1 combinations of the storage volume at the beginning of this stage.
Step 4: Repeats steps 2 and 3, then the whole calculation of all stages over the entire planning horizon can be finished by this reverse recursion procedure, and the optimal candidate path of each combination and its optimal cumulative output can be obtained after the calculation.
Step 5: Obtains the route and other details of the optimal operation by chronological recursion process.

2.3. Power Generation Analysis and Year-End Water Level Optimization of Multi-Year Regulating Reservoir

The difference between separate operation and cascade combined operation of multi-year regulating reservoir is that, only the water head of its own reservoir is considered in the separate operation, while in the combined operation, if the multi-year regulating reservoir is located at the upstream, the water head of power generation is the sum of the water heads of all the downstream reservoirs. When the multi-year regulating reservoir operates alone, a high year-end water level is generally determined, the main purpose of this is to make use of the water head benefit. That is to say, the benefit of storing partial water to raise the water head is higher than that of using this partial water volume to generate electricity. In the combined operation, the available water head of each cubic meter of water for multi-year regulating reservoir is the sum of the water heads of downstream reservoirs. At this time, if the year-end water level is raised, it is at the expense of the water efficiency of whole cascade reservoirs to obtain the high water head of current reservoir. Whether this is economic needs further proof.
If the multi-year regulating reservoir operates alone, and assuming that there are different year-end water levels Z1, Z2, and Z3, and Z1 < Z2 < Z3. As shown in Figure 3, then there are
(1)
Water head of power generation: H1 < H 2 < H3;
(2)
Available water for power generation: V1 > V2 > V3, i.e., Q1 > Q2 > Q3.
At this time, if assuming that the output efficiency coefficients of different hydropower stations are the same, then the power generation benefit of each year-end water level can be simplified as
E1=K·Q1·H1T
E2=K·Q2·H2·T
E3=K·Q3·H3·T
At this time, the value of E1, E2, and E3 is affected by Q and H together, which is difficult to judge their size relationship.
However, when the cascade reservoirs formed by multiple reservoirs, especially when the multi-year regulating reservoir is the leading reservoir and followed by several non-regulating reservoirs, not only the water volume of the multi-year regulating reservoir can generate electricity in its own hydropower station, but also in the downstream hydropower stations, as shown in Figure 4.
At this time, if assuming that there are different year-end water levels Z11, Z12 and Z13 in the multi-year regulating reservoir, and Z11 < Z12 < Z13, then there are
(1)
Available water for power generation: V11 > V12 >V13, i.e., Q11 > Q12 > Q13;
(2)
For the water head of power generation, it is no longer a simple H11<H12<H13 at this time. When the downstream water level is fixed, it is (H11 + H2 + H3 + H4 + …) < (H12 + H2 + H3 + H4 + …) < (H13 + H2 + H3 + H4 + …).
At this time, the total power generation benefit under the three year-end water levels can be simplified as
E1=K·Q11·(H11 + H2 + H3 + H4 + …) ·T
E2=K·Q12·(H12 + H2 + H3 + H4 + …) ·T
E3=K·Q13·(H13 + H2 + H3 + H4 + …) ·T
i.e., E = K·Q1·(H1 + H2 + H3 + H4 + …) ·T. At this time, the value of E1, E2, and E3 is affected by Q and (H1 + H2 + H3 + H4 + …), which is also difficult to judge their size relationship directly. However, in general, when the sum of the water head of downstream hydropower stations is quite large, it is more advantageous to “release water to use the downstream water head for power generation” than “store water to raise its own water head”.
It should be noted that the above description is under the simplified situation that the inflow water of reservoir does not take into account. In fact, the inflow water must have an impact on the power generation in the actual operation process. Moreover, we also know that the power generation of the reservoir or cascade reservoirs system is not only related to the water head, but also the natural inflow. Therefore, in the process of analysis, it is necessary to further consider the influence of different inflow on the optimization of the year-end water level.
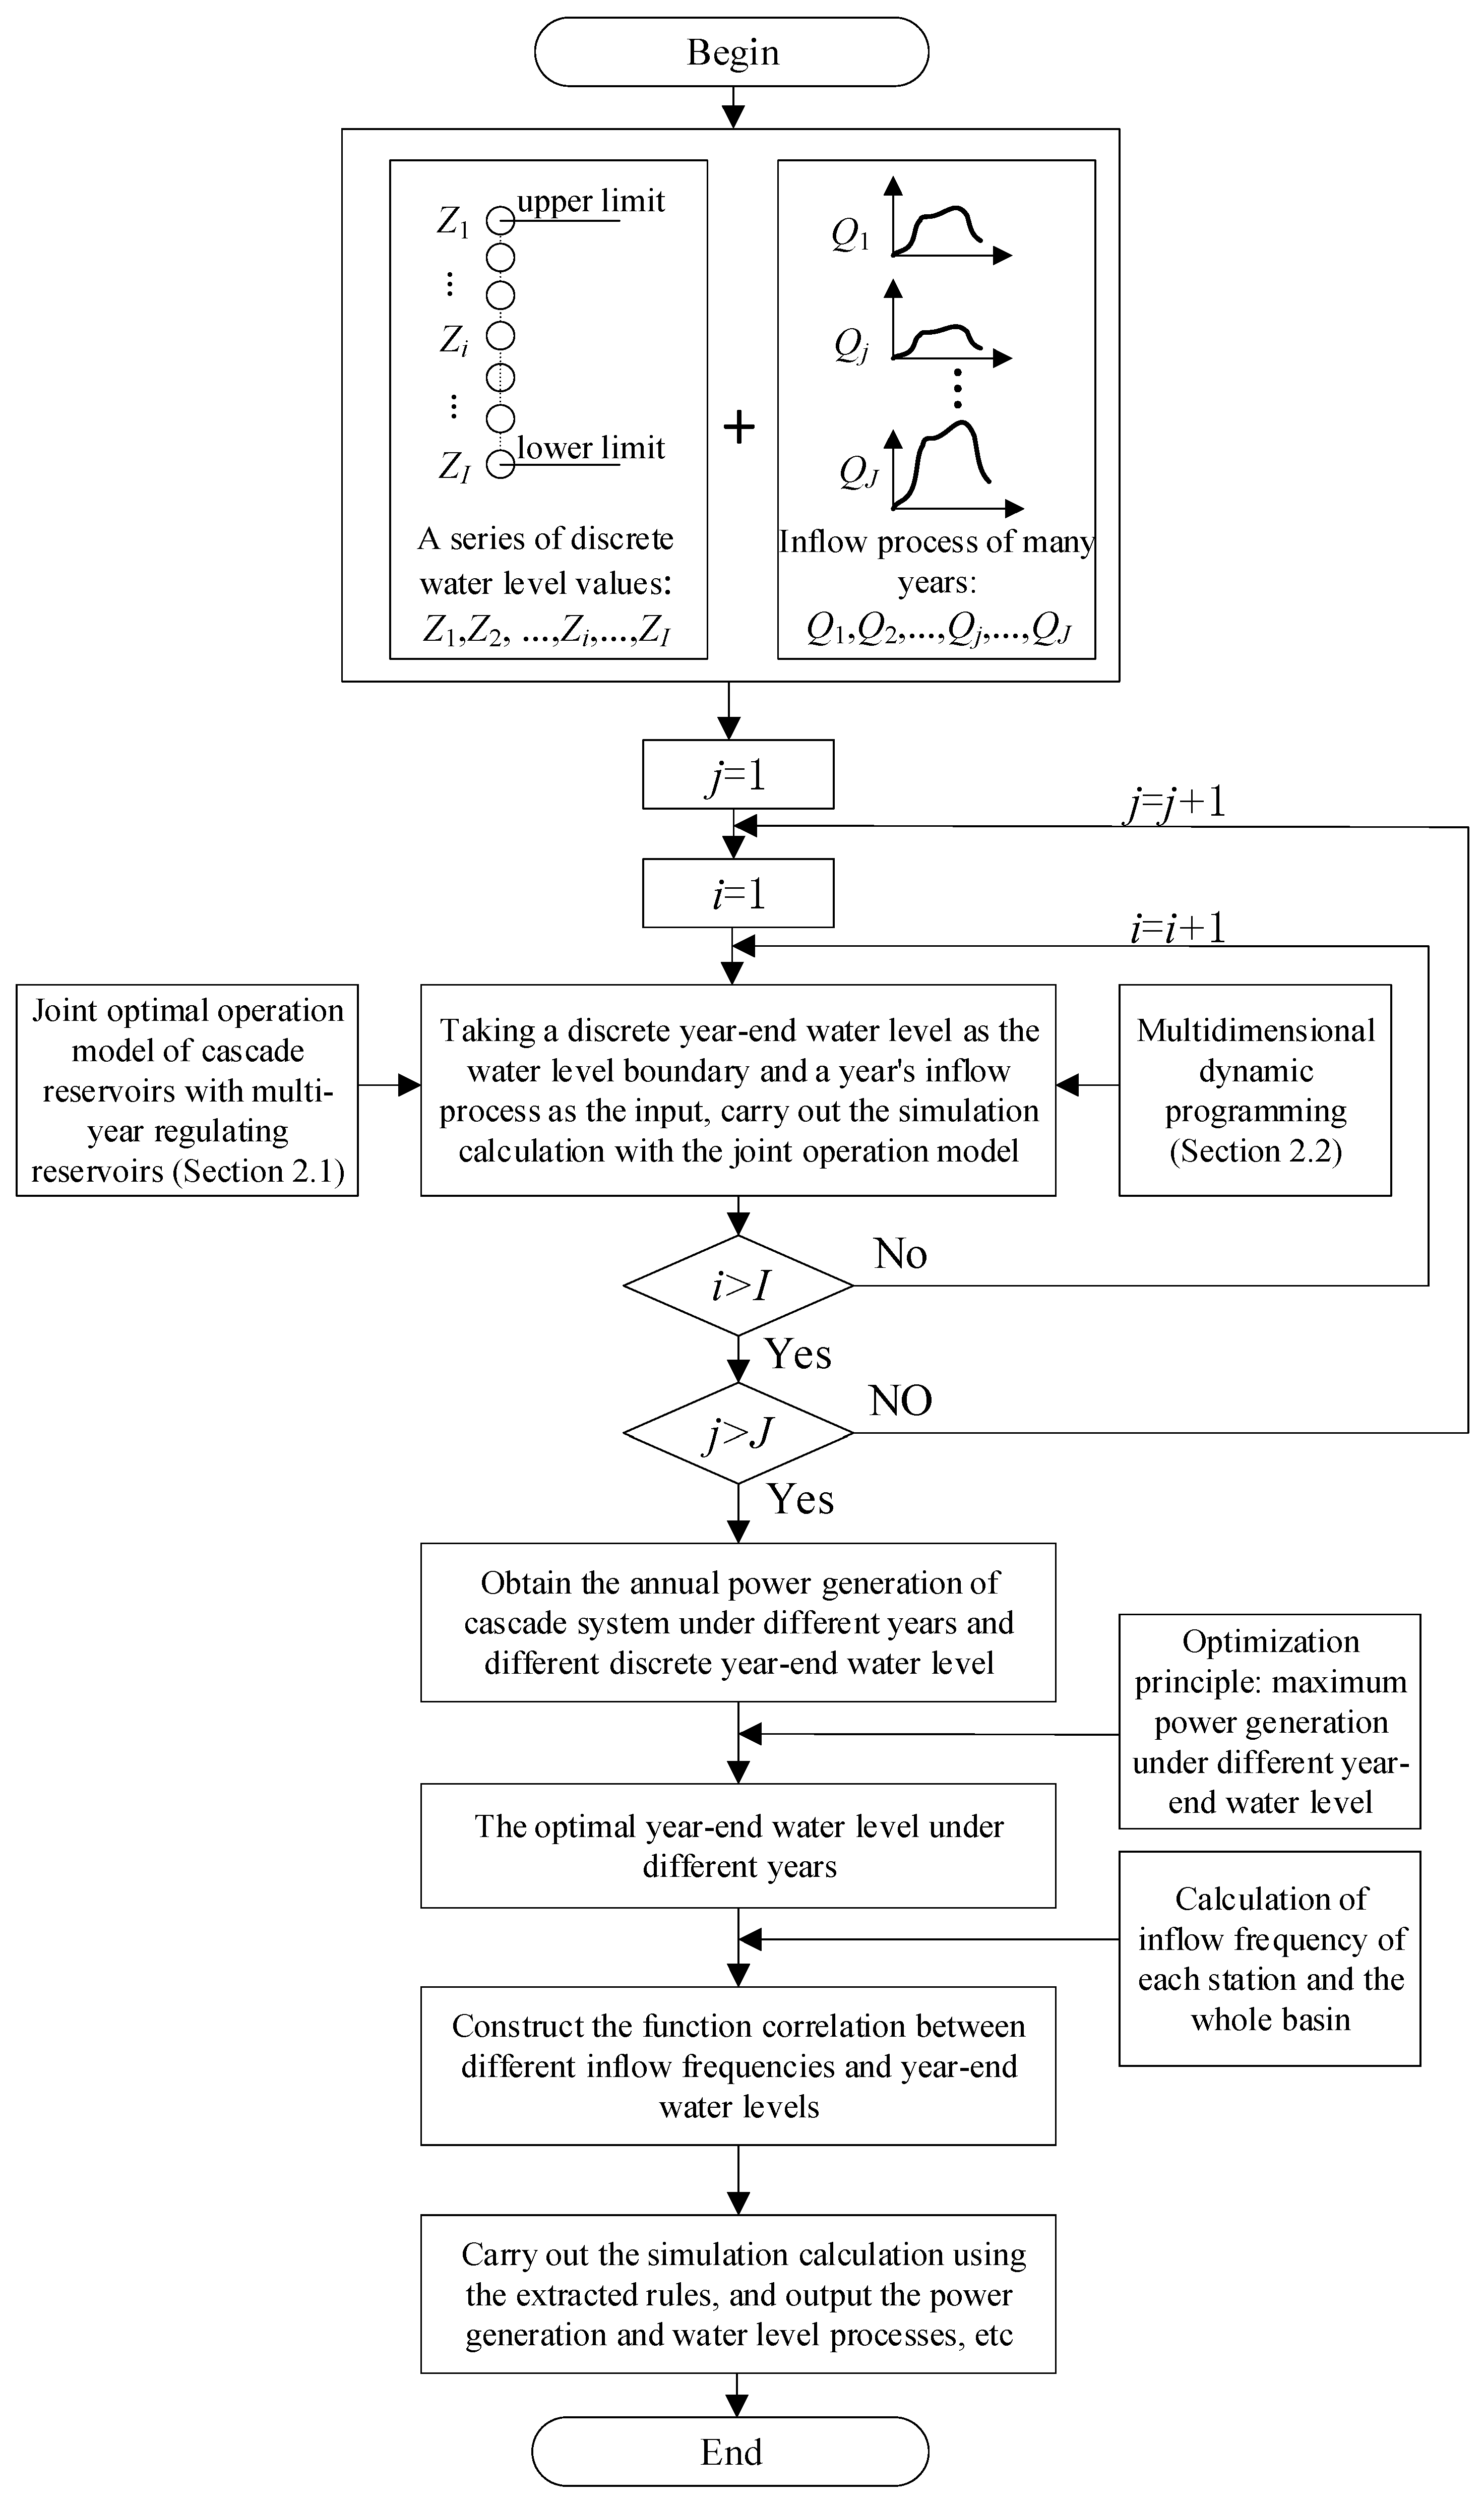
In order to obtain the optimal year-end water level of multi-year regulating reservoir considering the inflow uncertainty, according to the above-mentioned joint operation model and multi-dimensional dynamic programming algorithm, one way is to establish the functional relationship between the inflow frequency and the optimal year-end water level. The steps of this method include:
Step 1:
Within the feasible water level range, discretize the year-end water level to obtain a series of discrete water level values. Carry out the following calculation by setting different discrete water levels as the water level boundary in the joint operation model, which is the water level constraint corresponding to Equation (3).
Step 2:
According to the inflow and joint operation model, the optimal year-end water level of each year can be determined from the series of discrete water level values by taking the maximum power generation as the optimization goal.
Step 3:
Based on the optimal operation results of many years, draw the scatter chart between the inflow frequency and the optimal year-end water level, and find out the corresponding functional relationship between them, and extract the control rules of year-end water level.
Step 4:
Carry out simulation calculation based on the obtained control rules of year-end water level, and analyze its rationality.
The overall flowchart of this method can be shown in Figure 5.

3. Case Study

3.1. Basic Data

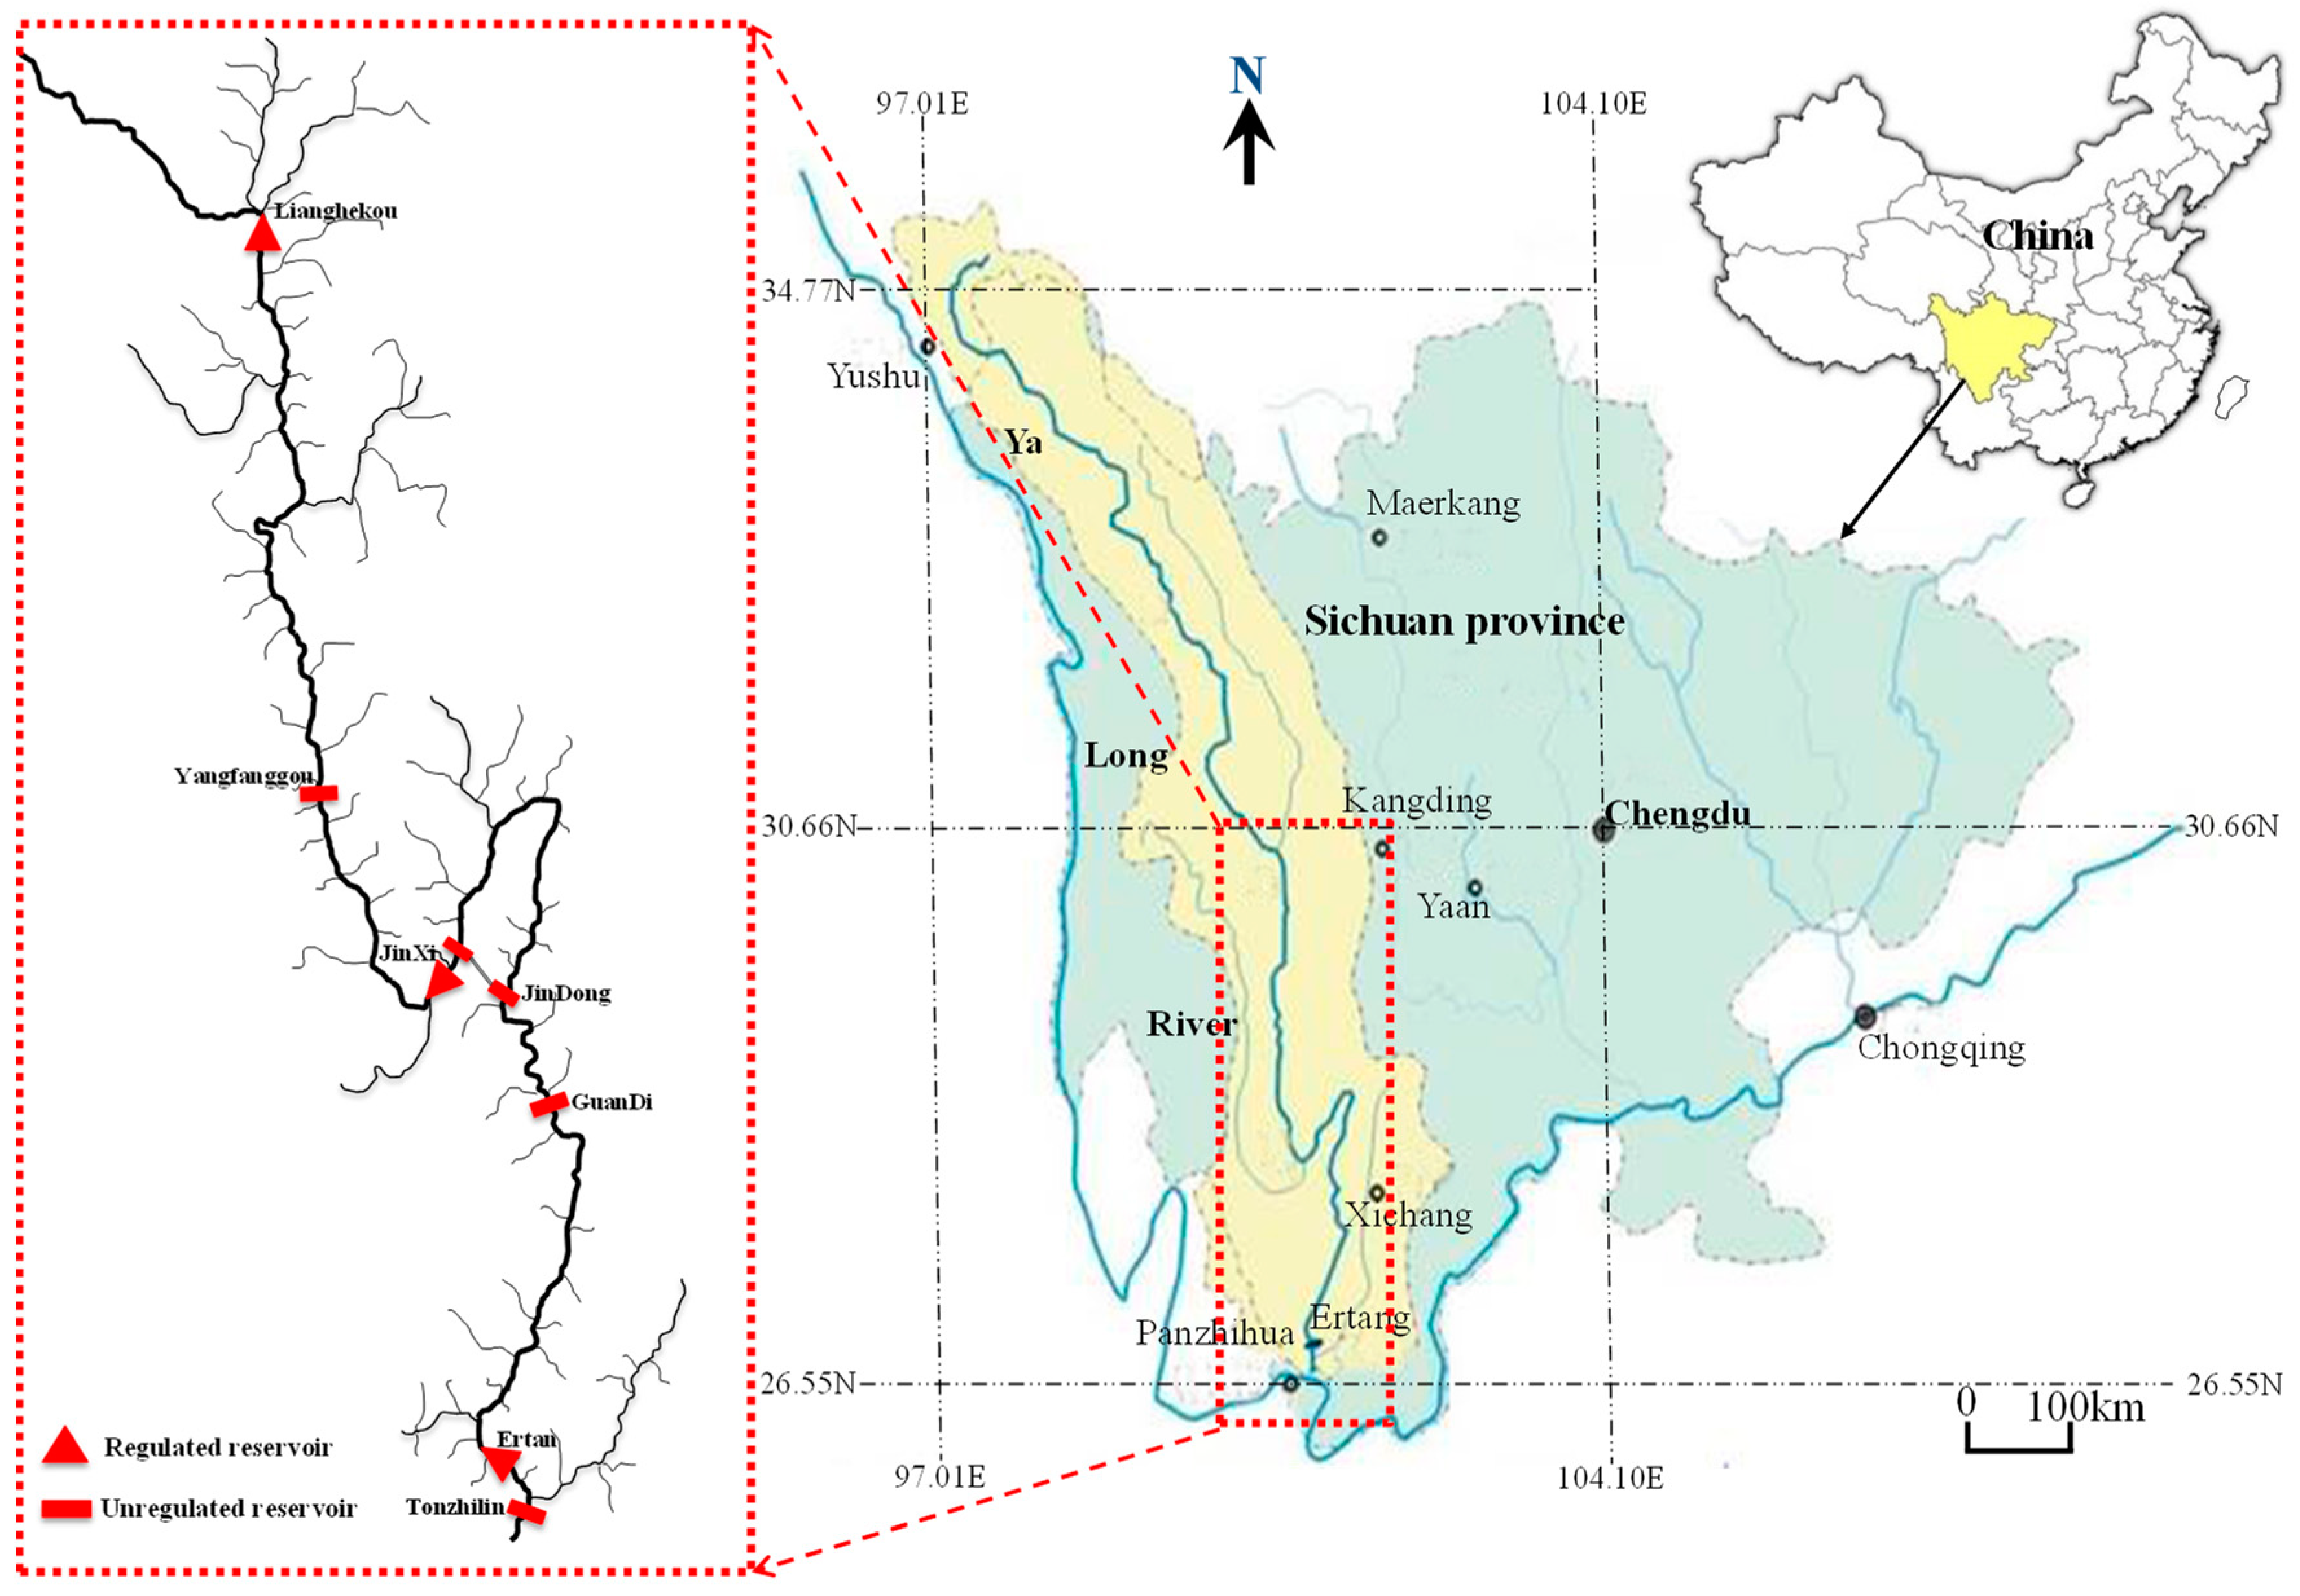
Yalong River is the largest tributary of Jinsha River in China, which originates from the south foot of Bayan Kala Mountain in Yushu County, Qinghai Province. The main stream has a total length of 1571 km, a drainage area of about 136,000 km2 and a natural drop of about 3830 m. The average annual flow of the estuary is 1910 m3/s, and the annual runoff is nearly 60 billion m3, accounting for 13.3% of the total water in the upper reaches of Yangtze River. The Yalong River is rich in hydropower resources. A total of 22 hydropower stations have been planned in the main stream, with a total installed capacity of about 30 million kilowatts and an annual generating capacity of about 150 billion kilowatt hours. The middle and lower reaches of the Yalong River are the key reaches of hydropower development at present. There are seven hydropower stations, namely Lianghekou, Yangfanggou, Jinxi, Jindong, Guandi, Ertan, and Tongzilin. Among them, Lianghekou, Jinxi, and Ertan reservoirs all have regulation performance, among which Lianghekou reservoir has a multi-year regulating performance, Jinxi reservoir has an annual regulating performance, and Ertan reservoir has a seasonal regulating performance [23].
In particular, Lianghekou reservoir is the control reservoir for the cascade hydropower stations in the middle and lower reaches of the Yalong River, which has a great impact on the whole cascade power stations development of Yalong River. After putting into operation, it can realize the multi-year regulation of the cascade reservoirs in the middle and lower reaches of Yalong River. At the same time, it will have a positive impact on the development of the lower reaches of the Jinsha river, it can improve the power generation quality of the Three Gorges and Gezhouba hydropower station and reduce the flood control burden of the middle and lower reaches of the Yangtze River.
The geographical location of the seven reservoirs in Yalong River basin is shown in Figure 6, and the key parameters of each reservoir are shown in Table 1.
In this case study, there are ten-day runoff data of the river basin from June 1957 to May 2019, a total of 62 years, so the Δt is ten-day (i.e., 240 h) in Equations (1) and (2). In the joint optimal operation model, the initial and final water level of each reservoir with regulating performance are set as dead water level, and the other reservoirs without regulating performance operate according to the water level in Table 1. In the output calculation of the model, the output coefficient difference of each power station in different operation stages is also considered. In addition, it should be noted that the purpose of this paper is to extract the operation rules of multi-year regulating reservoir through simulation calculation, so the data used in this paper are all historical data.

3.2. Results and Discussion

In order to analyze the variation of power generation of cascade system under different year-end water levels of Lianghekou reservoir, we take 5 m as the discrete interval, (2785 m–2845 m) as the discrete range, and get different discrete year-end level values, i.e., 2785 m, 2790 m, 2795 m, 2800 m, 2805 m, 2810 m, 2815 m, 2820 m, 2825 m, 2830 m, 2835 m, 2840 m, and 2845 m. Then, these year-end levels are respectively taken as the lower limit constraint of water level in the cascade reservoirs operation optimization model described in Section 2.1, and the model is solved with the method described in Section 2.2. Under the multi-year average situation, the total power generations of the cascade system under different discrete year-end water levels of Lianghekou reservoir are shown in Table 2.
From Table 2, it can be seen that with the increase of the year-end water level, the annual average power generation of cascade system gradually decreases. When the year-end water level is 2785 m, the annual average power generation of cascade system is the largest. That is to say, under the multi-year average situation, the 2785 m is the best year-end water level, i.e., if the Lianghekou reservoir is operated as an annual regulating reservoir under this situation, the total power generation of the cascade system is the largest.
The annual average power generations in Table 2 only consider the different year-end water levels, in fact, the power generation is affected not only by the water level, but also by the inflow; that is, the inflow frequency. For a specific year, the maximum annual power generation is the comprehensive result of reservoir water level and inflow process. Therefore, in order to analyze the power generation variations of the cascade system under different inflow conditions and different year-end levels, and discuss the coupling relationship between the year-end water level and inflow frequency on the cascade power generation, we firstly analyzed and compared the results of three kinds of typical years, i.e., wet year, normal year and dry year.
Based on the inflow data of Lianghekou, Jinxi and Ertan stations, we selected five typical years for the analysis from the overall perspective of the basin, as shown in Table 3. Considering the complexity of dry years, we chose three typical dry years. For the three kind of typical years, the difference is mainly the difference of inflow, which also reflects the difference of rainfall level to a certain extent. For the wet year, the rainfall is rich, so the inflow of the reservoir is large. For the dry year, the rainfall is poor, so the inflow of the reservoir is small. For the normal year, the inflow and rainfall are relatively moderate.
According to the model described in Section 2.1 and the model solution method described in Section 2.2, the calculation is carried out based on the runoff data of the wet year, and the results are shown in Table 4.
From the calculation results of the wet year, it can be seen that with the increase of the year-end water level of Lianghekou reservoir, the total power generation of the cascade system gradually decreases, the power generation of Lianghekou reservoir increases first and then decreases, and the total power generation of the downstream reservoirs gradually decreases.
The power generation of Lianghekou reservoir increases first and then decreases with the increase of year-end water level. The reason is that when the year-end water level H is low, it can be seen that the contribution of H to N is small according to the output calculation formula N = KQH in Equation (1), so the water head benefit of the reservoir is very low. When the year-end water level is high, the water head benefit is large; however, because a large amount of water is used to raise the water head, the discharge flow Q used for power generation is small. So, the contribution of Q to N is small, i.e., the water quantity benefit is small. So, only in a middle position (such as 2805 m), the water quantity benefit and head benefit are both better, and the sum of them reaches the maximum. The water head benefit mentioned above actually refers to the contribution of water head H to the output N, and the water quantity benefit actually refers to the contribution of the discharge flow Q used for power generation to the output N.
The total power generation of the downstream cascade decreases gradually with the increase of the year-end water level. The reason is that the downstream reservoirs can only use the water volume of Lianghekou reservoir and cannot use its water head. Therefore, the lower the year-end water level of Lianghekou reservoir, the greater the amount of water discharged, and the better the power generation of the downstream reservoirs.
The total cascade power generation is the sum of the power generation of Lianghekou reservoir and the power generation of the downstream reservoirs. With the increase of the year-end water level of Lianghekou reservoir, the total power generation of the cascade system gradually decreases. The reason is that in the wet season, the water head of the downstream reservoirs is high, and the sum of the water head is a very large value. At this time, for every cubic meter of water discharged by the Lianghekou reservoir, the downstream reservoirs will get great power generation benefits. Before 2805 m, although the power generation of Lianghekou reservoir increased with the increase of the year-end water level, the water head effect of the downstream reservoirs is remarkable at this time. The increase of the year-end water level means the decrease of the discharge, which will greatly reduce the power generation of the downstream reservoirs, and finally make the overall cascade system presents a decreasing trend. After 2805 m, the power generation of Lianghekou reservoir and the downstream reservoirs both decreases with the increase of the year-end water level, so the total power generation of the cascade system decrease gradually.
In general, in the wet year, when the year-end water level is the dead level, the overall benefit of the cascade system is the best.
According to the model described in Section 2.1 and the model solution method described in Section 2.2, the calculation is carried out based on the runoff data of the normal year, and the results are shown in Table 5.
From the calculation results of the normal year, it can be seen that the variation law of power generation is exactly the same as that of the wet year, except that the year-end water level of Lianghekou reservoir at the turning point of power generation is 2825 m, not the 2805 m of the wet year. In general, the overall benefit of the cascade system is the best when the year-end water level is the dead level in the normal year.
According to the model described in Section 2.1 and the model solution method described in Section 2.2, the calculation is carried out based on the runoff data of the three dry years, and the results are shown in Table 6, Table 7 and Table 8.
From the results of the dry year, it can be seen that with the increase of the year-end water level of Lianghekou reservoir, the power generation of Lianghekou reservoir itself increases first and then decreases, which is consistent with the variation law of the wet year and the normal year. However, for the cascade total power generation, its value does not strictly decrease with the increase of the year-end water level, but shows the trend of increasing first and then decreasing. For the power generation of downstream reservoirs, the variation has no regularity compared with the wet year and normal year.
The total power generation of the cascade system increases first and then decreases. The reason is that in the dry year, the water head of the downstream reservoirs is not high enough, and the sum of the water head of the downstream reservoirs is also smaller than that in the wet and normal year, which means that for each cubic meter of water discharged by the Lianghekou reservoir, the downstream reservoirs is not necessarily able to obtain large power generation. At this time, it is more advantageous for the water to be stored in the Lianghekou reservoir to raise its own water head; for example, when the year-end water level is before 2830 m in the second dry year, and when the year-end water level is before 2825 m in the third dry year. However, the Lianghekou reservoir cannot just store water without releasing it (for example, the year-end water level is 2845 m), otherwise the power generation benefit of the downstream reservoirs will be very small. Therefore, there is a compromise year-end water level which makes the sum of the power generation of Lianghekou reservoir and downstream reservoirs reaches the maximum; that is, the total generation benefit of cascade system reaches the maximum.
From the above results analysis, it can be concluded that the results of wet year and normal year have a strong regularity (the dead water level is the best), but the results of dry years are more complex and the regularity is weak, which needs further in-depth analysis. In view of this, in order to analyze the optimal year-end water level of Lianghekou reservoir under different inflow frequencies, and to extract the general rules to guide the actual operation, we calculated all the years based on the 62 years runoff data, and arranged their results by the inflow frequencies with ascending order, as shown in Table 9. The average multi-year power generation of cascade system is 101.02 billion kWh at this time.
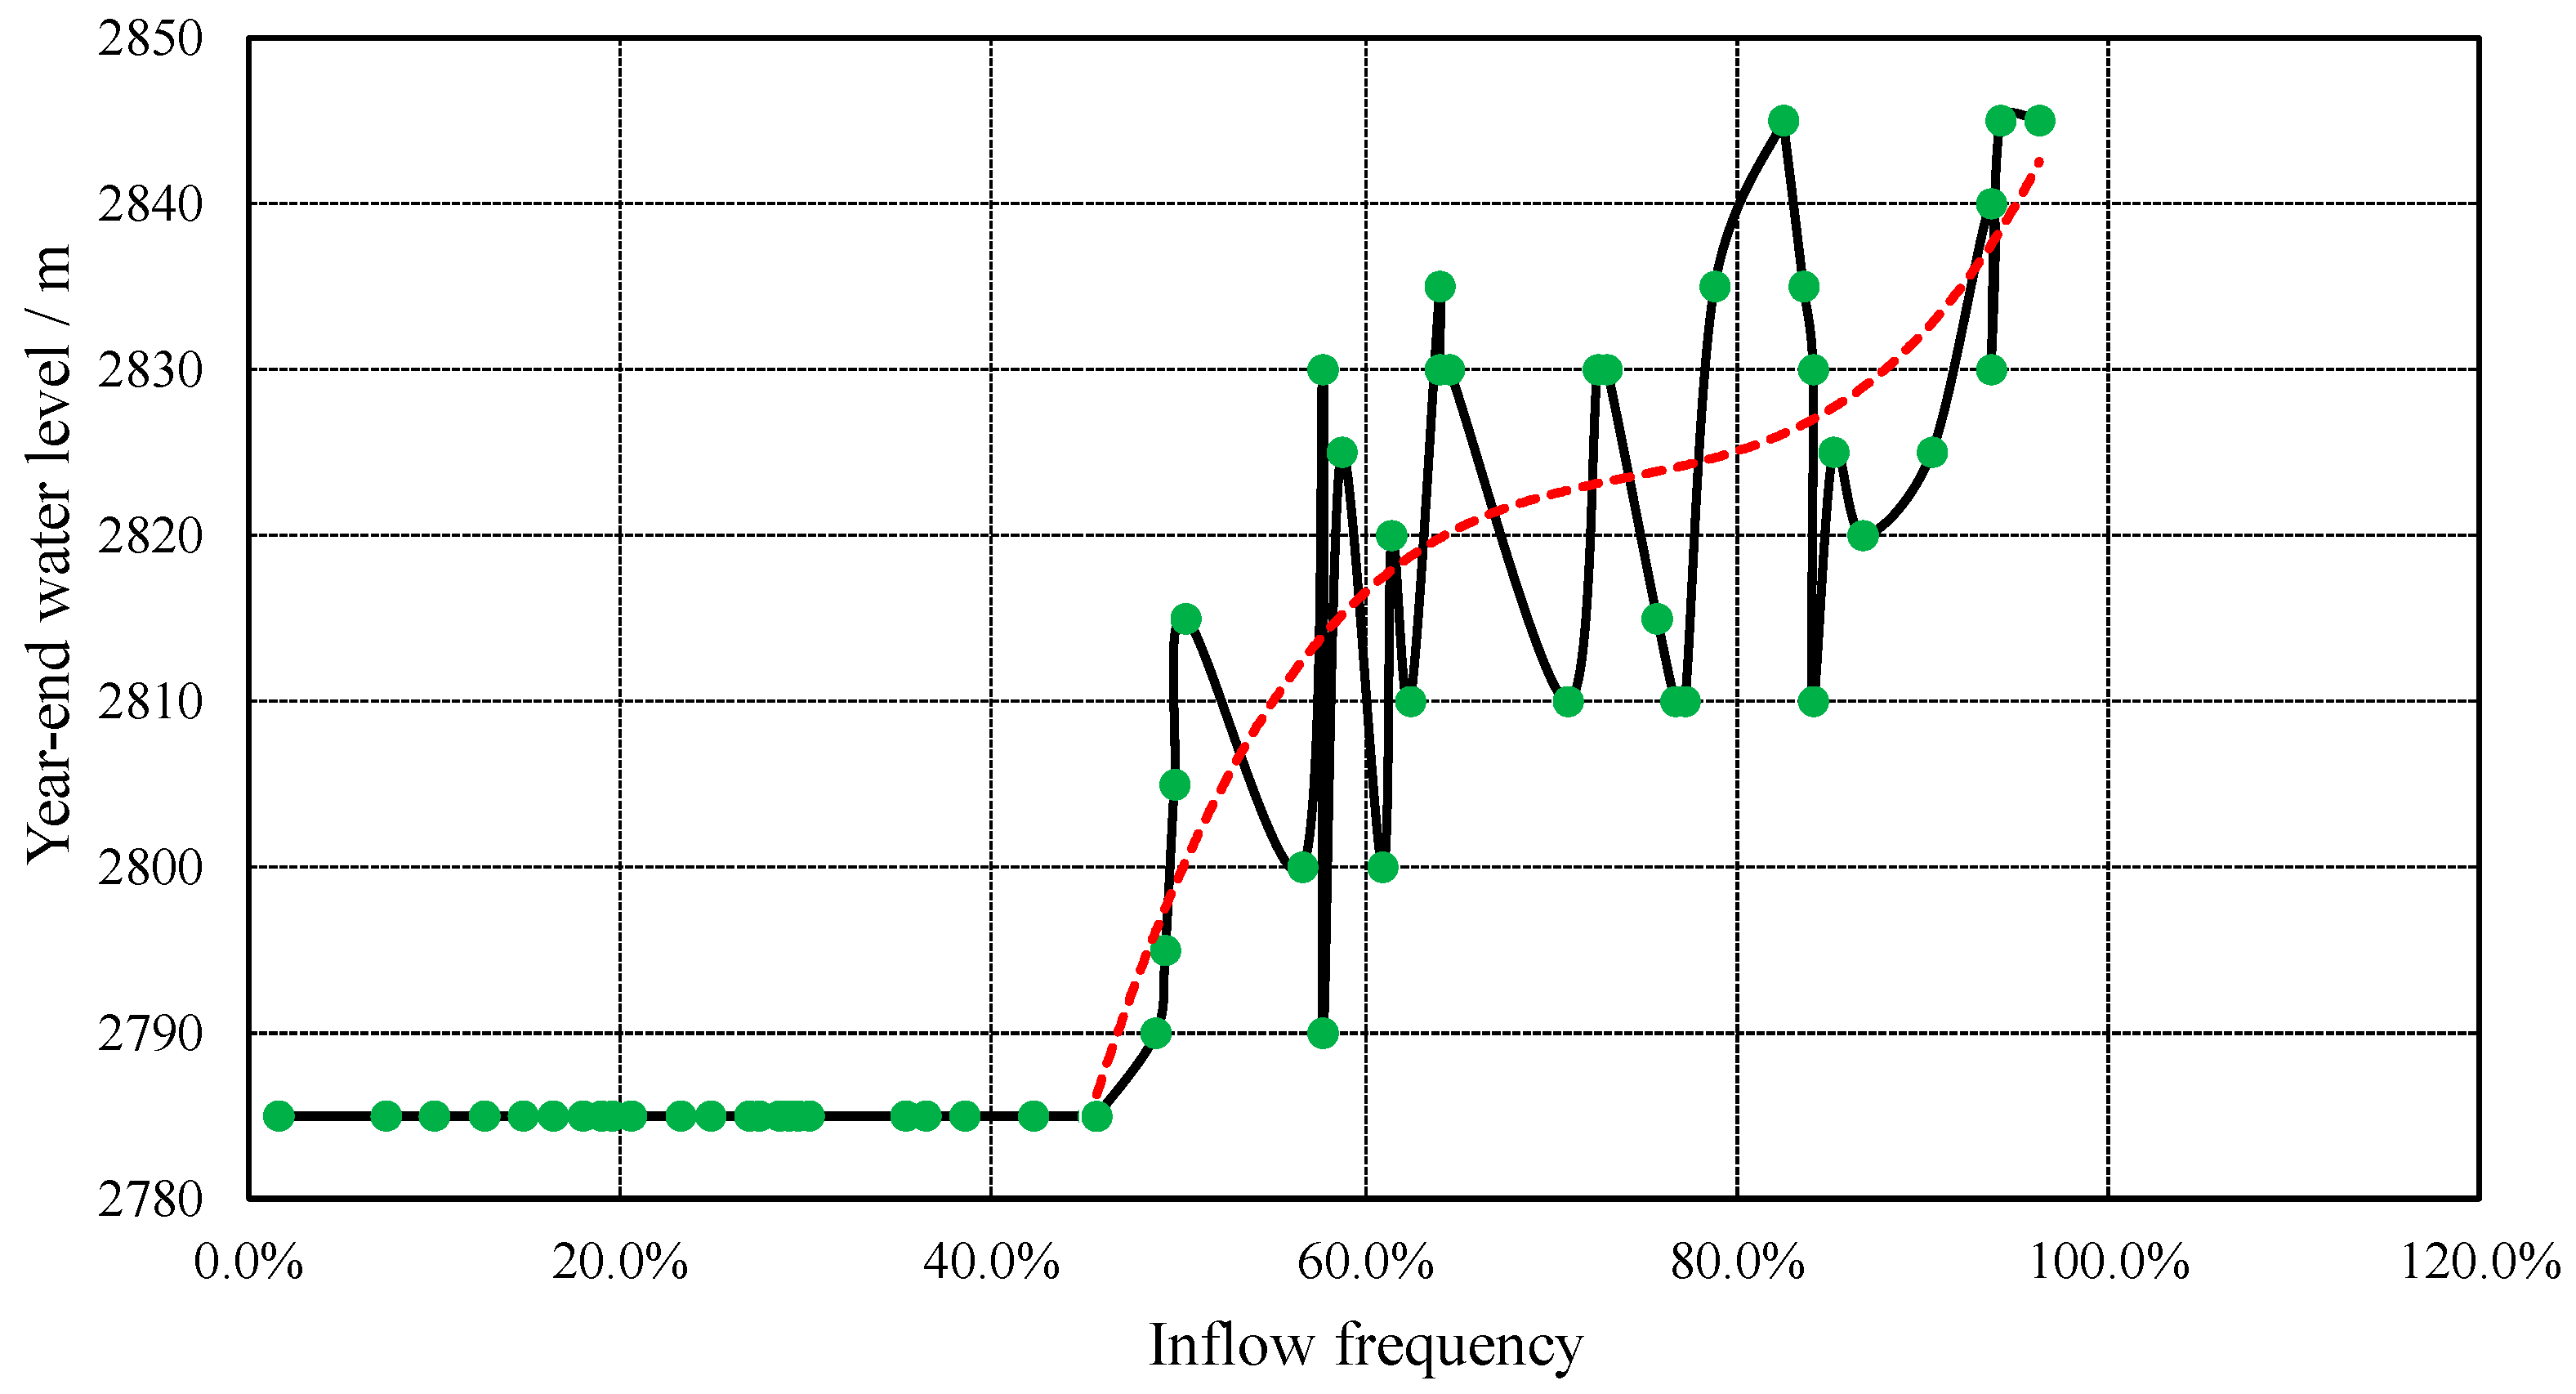
According to the results in Table 9, the scatter diagram with the inflow frequency as the abscissa and the year-end water level as the ordinate can be obtained, as shown in Figure 7.
From Figure 7, it can be seen that in the wet years (inflow frequency below 48.7%), the optimal year-end water level is 2875 m (dead water level). While in the dry years, the optimal year-end water level fluctuates greatly in different years, and the regularity is not strong, but the overall trend is rising. That is to say, in the years with low inflow, the optimal year-end water level basically increases with the increase of inflow frequency.
Considering the practicability of the calculation results, it is necessary to extract the overall regularity of the year-end water level in dry years to guide the actual reservoir operation. For this reason, based on the results data where the inflow frequency greater than 48.7%, we have drawn a scatter diagram and fitted the best trend line based on the least square principle [24,25], as shown in Figure 7.
According to the results in Figure 7, the best function relationship between the inflow frequency and the year-end water level in the dry years is as follows.
Y = 1301.3 I 3 2896.7 I 2 + 2171.9 I + 2275.2
where Y is the year-end water level and I is the inflow frequency. The correlation index R2 corresponding to the above Equation (9) is 0.73.
Therefore, it can be concluded that under different inflow frequencies, the determination rules of the year-end water level of Lianghekou reservoir are as follows.
Y   =   { 1301.3 I 3   2896.7 I 2 +   2171.9 I   +   2275.2 if   I 48.7 % 2785 if   I > 48.7 %
At this time, according to the Equation (10), the year-end water level under different inflow frequencies can be determined, and then the simulation calculation can be carried out, and the annual power generation can be obtained, as shown in Table 10 (sorted by inflow frequency with ascending order). The annual average power generation of cascade system is 100.984 billion kWh at this time. It should be noted that since the historical runoff data is used in this paper, the inflow frequency of each year is known at this time. In practical application, the inflow frequency forecasting [26,27] should be used to obtain the inflow frequency of future years.
Compared with the results in Table 9 and Table 10, the average annual power generation in Table 9 is 101.02 billion kWh, and that in Table 10 is 100.984 billion kWh. Although the power generation obtained by simulation operation according to the year-end water level determined by the extracted rules is reduced, the absolute value is 36 million kWh, and the relative reduction is only 0.036%. In addition, it is easy and feasible to operate the reservoir according to the extracted rules.
Compared with the results of multi-year fixed year-end water level in Table 2, the average annual power generation (100.984 billion kWh) in Table 10 is higher than the maximum value (100.58 billion kWh) in Table 2. The difference is 0.404 billion kWh (100.984 billion kWh minus 100.58 billion kWh), representing an increase of 0.4%. Although it seems that the increase of 0.4% is very small; in fact, the base number of annual generation of the cascade system is very large, and this is the annual increment. In the long run, the economic benefit is very significant, which also shows the effectiveness of the method in this paper.
So, it can be seen that the extracted rules of year-end water level under different inflow frequencies not only has strong operability, but also can well coordinate the coupling relationship between the inflow frequency (water volume) and the year-end water level (water head) of Lianghekou reservoir. They can give full play to the overall benefits of the cascade reservoirs system, so that the total power generation of the cascade system by rules is very close to that by the optimal calculation. After obtaining the above extracted rules, the actual reservoir operation can be guided by these rules. Firstly, the annual inflow frequency of the current year can be obtained according to the inflow frequency prediction model, and then the optimal year-end water level of multi-year regulating reservoir can be obtained according to the predicted inflow frequency and Equation (10), and finally, the actual operation can be carried out based on this year-end water level.
4. Summary and Conclusions

Based on the joint optimal operation model of cascade reservoirs and the model solution method based on multi-dimensional dynamic programming, this paper studies the year-end water level optimization of multi-year regulating reservoirs in the cascade reservoir system. By taking the cascade system of seven reservoirs of Yalong river as an example, the following conclusions are obtained.
(1) Under the multi-year average situation, with the increase of the year-end water level of Lianghekou reservoir, the annual average power generation of the cascade system gradually decreases. When the year-end water level of the Lianghekou reservoir is 2785 m, the annual average power generation of the cascade system is the largest. That is to say, under the multi-year average situation, it is better to operate the multi-year regulating reservoir as the annual regulating reservoir.
(2) Under the three typical inflow conditions, the results of wet year and normal year have strong regularity (the dead water level is the best), but the regularity of dry years is weak.
(3) Considering the difference of different inflow frequencies, the annual average power generation of the cascade system can reach up to 101.02 billion kWh by getting the optimal year-end water level of Lianghekou reservoirs in each year. In the years with abundant inflow, the optimal year-end water level is 2875 m. In the years with low inflow, although the optimal year-end water level fluctuates greatly in different years and the regularity is not strong, the overall trend is upward.
(4) In order to improve the practicability of the results, based on the optimal results of multi-dimensional dynamic programming, the rules of determining the year-end water level of Lianghekou reservoir considering the inflow frequency difference are extracted by using the least square principle. The simulation results show that compared with the fixed year-end water level method, the extracted rules can increase the cascade power generation by more than 400 million kWh, representing an increase of 0.4%.

Author Contributions

Conceptualization, Z.J. and X.L.; methodology, Z.J.; software, P.S.; formal analysis, P.S.; investigation, P.S.; writing—original draft preparation, Z.J.; writing—review and editing, Z.J.; funding acquisition, Z.J. and X.L. All authors have read and agreed to the published version of the manuscript.

Funding

This research was funded by Natural Science Foundation of China, grant number 51809098 and 51809097, and National Key R&D Program of China, grant number 2017YFC0405900, and Fundamental Research Funds for the Central Universities, grant number HUST: 2017KFYXJJ 198.

Acknowledgments

The authors are grateful to the anonymous reviewers for their comments and valuable suggestions.

Conflicts of Interest

The authors declare no conflict of interest.

References

  1. Asfaw, T.D.; Yusof, K.W.; Hashim, A.M. Sensitivity Analysis of Hydroelectric Power Generation from Cascading Reservoirs. Adv. Mater. Res. 2012, 622, 1152–1156. [Google Scholar] [CrossRef]
  2. Siddiqui, O.; Dincer, I. Comparative assessment of the environmental impacts of nuclear, wind and hydro-electric power plants in Ontario: A life cycle assessment. J. Clean. Prod. 2017, 164, 848–860. [Google Scholar] [CrossRef]
  3. Jurasz, J.; Mikulik, J.; Krzywda, M.; Ciapała, B.; Janowski, M. Integrating a wind- and solar-powered hybrid to the power system by coupling it with a hydroelectric power station with pumping installation. Energy 2018, 144, 549–563. [Google Scholar] [CrossRef]
  4. Lu, S.; Shang, Y.; Li, W.; Peng, Y.; Wu, X. Economic benefit analysis of joint operation of cascaded reservoirs. J. Clean. Prod. 2018, 179, 731–737. [Google Scholar] [CrossRef]
  5. Bertone, E.; O’Halloran, K.; Stewart, R.A.; De Oliveira, G.F. Medium-term storage volume prediction for optimum reservoir management: A hybrid data-driven approach. J. Clean. Prod. 2017, 154, 353–365. [Google Scholar] [CrossRef] [Green Version]
  6. Allawi, M.F.; Jaafar, O.; Hamzah, F.M.; El-Shafie, A. Novel reservoir system simulation procedure for gap minimization between water supply and demand. J. Clean. Prod. 2019, 206, 928–943. [Google Scholar] [CrossRef]
  7. Arena, C.; Cannarozzo, M.; Mazzola, M.R. Exploring the Potential and the Boundaries of the Rolling Horizon Technique for the Management of Reservoir Systems with over-Year Behaviour. Water Res. Manag. 2016, 31, 867–884. [Google Scholar] [CrossRef]
  8. Zhang, Z.; Zhang, S.; Geng, S.; Jiang, Y.; Li, H.; Zhang, D. Application of decision trees to the determination of the year-end level of a carryover storage reservoir based on the iterative dichotomizer 3. Int. J. Electr. Power Energy Syst. 2015, 64, 375–383. [Google Scholar] [CrossRef]
  9. Guo, X.; Chen, J.; Ma, G. Research on year-end level of multi-year regulating storage reservoir for timed power Tariff. J. Hydroelectr. Eng. 2004, 23, 27. [Google Scholar]
  10. Wang, X.; Yuan, W. Study of Year-end Water Level of Long Period Storage Reservoir Based on Time-of-use Pricing. Water Res. Power 2011, 29, 25–28. [Google Scholar]
  11. Liu, J.; Huang, C.H.; Zeng, G.Z. Comparative analysis of year-end water level determining methods for cascade carryover storage reservoirs. IOP Conf. Ser. Earth Environ. Sci. 2017, 82, 12060. [Google Scholar] [CrossRef] [Green Version]
  12. Wang, J.; Huang, W.; Ma, G.; Wang, Y. Determining the optimal year-end water level of a multi-year regulating storage reservoir: A case study. Water Supply 2015, 16, 284–294. [Google Scholar] [CrossRef]
  13. Yuan, W.; Wang, F. Study on year-end water level of multi-year regulating storage reservoir in power market. J. Hydroelectr. Eng. 2012, 31, 94–98. [Google Scholar]
  14. Ehteram, M.; Karami, H.; Mousavi, S.-F.; Farzin, S.; Kisi, O. Optimization of energy management and conversion in the multi-reservoir systems based on evolutionary algorithms. J. Clean. Prod. 2017, 168, 1132–1142. [Google Scholar] [CrossRef]
  15. Jiang, Z.; Liu, P.; Ji, C.; Zhang, H.; Chen, Y. Ecological flow considered multi-objective storage energy operation chart optimization of large-scale mixed reservoirs. J. Hydrol. 2019, 577. [Google Scholar] [CrossRef]
  16. Li, R.; Jiang, Z.; Li, A.; Yu, S.; Ji, C. An improved shuffled frog leaping algorithm and its application in the optimization of cascade reservoir operation. Hydrol. Sci. J. 2018, 63, 2020–2034. [Google Scholar] [CrossRef]
  17. Liu, G.; Jiang, Z.; Feng, Z.-K.; Chen, Y.; Zhang, H.; Chen, P. Optimization of Energy Storage Operation Chart of Cascade Reservoirs with Multi-Year Regulating Reservoir. Energies 2019, 12, 3814. [Google Scholar] [CrossRef] [Green Version]
  18. Fang, W.; Huang, S.; Ren, K.; Huang, Q.; Huang, G.; Fu, H.; Li, K. Examining the applicability of different sampling techniques in the development of decomposition-based streamflow forecasting models. J. Hydrol. 2019, 568, 534–550. [Google Scholar] [CrossRef]
  19. Jiang, Z.; Qin, H.; Ji, C.; Feng, Z.-K.; Zhou, J. Two Dimension Reduction Methods for Multi-Dimensional Dynamic Programming and Its Application in Cascade Reservoirs Operation Optimization. Water 2017, 9, 634. [Google Scholar] [CrossRef] [Green Version]
  20. Goulter, I.C.; Tai, F.-K. Practical Implications in the Use of Stochastic Dynamic Programming for Reservoir Operation. JAWRA J. Am. Water Res. Assoc. 1985, 21, 65–74. [Google Scholar] [CrossRef]
  21. Jiang, Z.; Ji, C.; Qin, H.; Feng, Z. Multi-stage progressive optimality algorithm and its application in energy storage operation chart optimization of cascade reservoirs. Energy 2018, 148, 309–323. [Google Scholar] [CrossRef]
  22. Zhang, Y.; Jiang, Z.; Ji, C.; Sun, P. Contrastive analysis of three parallel modes in multi-dimensional dynamic programming and its application in cascade reservoirs operation. J. Hydrol. 2015, 529, 22–34. [Google Scholar] [CrossRef]
  23. Jiang, Z.; Tang, Z.; Liu, Y.; Chen, Y.; Feng, Z.; Xu, Y.; Zhang, H. Area Moment and Error Based Forecasting Difficulty and its Application in Inflow Forecasting Level Evaluation. Water Res. Manag. 2019, 33, 4553–4568. [Google Scholar] [CrossRef]
  24. Pinthong, P.; Das Gupta, A.; Babel, M.S.; Weesakul, S. Improved Reservoir Operation Using Hybrid Genetic Algorithm and Neurofuzzy Computing. Water Res. Manag. 2008, 23, 697–720. [Google Scholar] [CrossRef]
  25. Yuan, X.; Tan, Q.; Lei, X.; Yuan, Y.; Wu, X. Wind power prediction using hybrid autoregressive fractionally integrated moving average and least square support vector machine. Energy 2017, 129, 122–137. [Google Scholar] [CrossRef]
  26. Coulibaly, P.; Rasmussen, P. A recurrent neural networks approach using indices of low-frequency climatic variability to forecast regional annual runoff. Hydrol. Process. 2000, 14, 2755–2777. [Google Scholar] [CrossRef]
  27. Muluye, G.Y.; Coulibaly, P. Seasonal reservoir inflow forecasting with low-frequency climatic indices: A comparison of data-driven methods. Hydrol. Sci. J. 2007, 52, 508–522. [Google Scholar] [CrossRef]
Figure 1. The flowchart of multidimensional dynamic programming in solving the cascade reservoirs operation optimization problem.
Energies 13 05345 g001
Figure 2. Reverse recursion procedure of multidimensional dynamic programming in solving the cascade reservoirs operation optimization problem.
Energies 13 05345 g002
Figure 3. Schematic diagram of different year-end water levels when multi-year regulating reservoir operates alone.
Energies 13 05345 g003
Figure 4. Schematic diagram of different year-end water levels of multi-year regulating reservoir in joint operation.
Energies 13 05345 g004
Figure 5. Year-end water level optimization of multi-year regulating reservoir.
Energies 13 05345 g005
Figure 6. Geographical location of the 7 reservoirs in Yalong River basin.
Energies 13 05345 g006
Figure 7. Optimal year-end water levels under different inflow frequencies.
Energies 13 05345 g007
Table 1. The key parameters of the 7 reservoirs.
ItemUnitLianghekouYangfanggouJinxiJindongGuandiErtanTongzilin
Normal levelm2865.02088.01880.01646.01330.01200.01015.0
Dead levelm2785.02094.01800.01640.01321.01155.01010.0
Flood control levelm2845.9none1859.0nonenone1190.0none
Regulation performance Multi-yearDailyAnnualDailyDailySeasonalDaily
Installed capacityMW3000.01500.03600.04800.02400.03300.0600.0
Guaranteed outputMW1130.0253.01086.01443.0709.81028.0227.0
Range of operating water levelm(2845.9–2865.0) or (2785.0–2865.0)2092.0(1859.0–1880.0) or (1800.0–1880.0)1644.01328.0(1155.0–1200.0) or (1190.0–1200.0)1013.5
Table 2. Power generations of cascade system under different year-end water levels of Lianghekou reservoir.
Year-End Level/mTotal Power Generation/Billion kWh
2785100.58
2790100.55
2795100.49
2800100.43
2805100.30
2810100.16
281599.95
282099.72
282599.43
283099.08
283598.64
284098.10
284597.37
Table 3. Selected five typical years and their inflow frequency.
Type of Typical Year Hydrological YearInflow Frequency
Wet year2012–20137.4%
Normal year2009–201042.3%
Dry year 11972–197382.5%
Dry year 22011–201284.1%
Dry year 31959–196090.5%
Table 4. Calculation results of wet year under different year-end water levels of Lianghekou reservoir.
Year-End Water LevelTotal Power Generation
of cAscade System/Billion kWh
Power Generation
of Lianghekou Reservoir/Billion kWh
Power Generation
of Downstream Reservoirs/Billion kWh
2785123.3815.48107.90
2790122.8815.61107.27
2795122.2915.69106.60
2800121.7115.79105.92
2805121.0115.84105.17
2810120.2315.79104.44
2815119.4015.71103.69
2820118.4915.63102.86
2825117.5015.56101.94
2830116.4615.48100.97
2835115.3315.3899.96
2840114.1615.2798.89
2845112.9115.1197.80
Table 5. Calculation results of normal year under different year-end water levels of Lianghekou reservoir.
Year-End Water LevelTotal Power Generation of Cascade System/Billion kWhPower Generation of Lianghekou Reservoir/Billion kWhPower Generation of Downstream Reservoirs/Billion kWh
2785105.6712.4693.20
2790105.6412.5793.07
2795105.5812.7092.88
2800105.4712.8192.66
2805105.2912.9192.38
2810105.0513.0492.02
2815104.7113.1891.53
2820104.2913.2891.02
2825103.6913.3190.38
2830102.8813.2489.64
2835101.9113.0988.82
2840100.8112.9487.87
284599.6112.8086.81
Table 6. Calculation results of the first dry year under different year-end water levels of Lianghekou reservoir.
Year-End Water LevelTotal Power Generation of Cascade System/Billion kWhPower Generation of Lianghekou Reservoir/Billion kWhPower Generation of Downstream Reservoirs/Billion kWh
278583.139.2073.93
279083.189.3473.84
279583.339.4673.87
280083.619.6773.94
280583.679.8773.80
281083.779.9273.86
281583.849.9273.92
282083.9210.0573.87
282584.0110.1473.87
283084.0710.2073.87
283584.1210.2773.85
284084.1410.3173.83
284584.1410.4073.74
Table 7. Calculation results of the second dry year under different year-end water levels of Lianghekou reservoir.
Year-End Water LevelTotal Power Generation of Cascade System/Billion kWhPower Generation of Lianghekou Reservoir/Billion kWhPower Generation of Downstream Reservoirs/Billion kWh
278581.099.3271.76
279081.329.7171.62
279581.339.5871.75
280081.549.9171.63
280581.719.9571.76
281081.7710.0471.74
281581.8610.1171.75
282081.9010.1771.73
282581.9410.2571.69
283081.9510.3271.63
283581.8610.4271.44
284081.6110.4271.19
284581.1810.2670.91
Table 8. Calculation results of the third dry year under different year-end water levels of Lianghekou reservoir.
Year-End Water LevelTotal Power Generation of Cascade System/Billion kWhPower Generation of Lianghekou Reservoir/Billion kWhPower Generation of Downstream Reservoirs/Billion kWh
278580.057.4872.58
279080.687.7072.98
279581.098.1572.94
280081.198.2372.97
280581.288.3072.97
281081.358.3173.04
281581.318.4072.91
282081.428.4972.94
282581.478.5372.94
283081.468.5972.87
283581.468.6372.83
284081.338.6772.66
284580.948.4772.47
Table 9. Optimal year-end water levels and corresponding power generation under different inflow frequencies.
Hydrological YearInflow FrequencyYear-End Water LevelPower Generation/Billion kWhHydrological YearInflow FrequencyYear-End Water LevelPower Generation/Billion kWh
1965–19661.6%2785125.12015–201649.7%2805101.68
1993–19947.4%2785118.462017–201850.3%2815102.66
2012–20137.4%2785123.381979–198056.6%280096.53
1998–199910.0%2785117.061981–198257.7%279096.81
2003–200412.7%2785118.132016–201757.7%283099
2018–201912.7%2785122.481976–197758.7%282596.54
1999–200014.8%2785118.011995–199660.9%280096.67
1957–195816.4%2785118.151988–198961.4%282094.99
2005–200616.4%2785118.651978–197962.4%281095.23
1974–197518.0%2785115.311977–197864.0%283094.74
2000–200119.0%2785117.042013–201464.0%283595.16
1989–199019.6%2785117.432010–201164.5%283095.26
1962–196320.6%2785112.071958–195970.9%281090.54
1960–196123.3%2785116.051975–197672.5%283089.78
1990–199124.9%2785116.711997–199873.0%283090.32
1980–198127.0%2785111.281969–197075.7%281586.78
1966–196727.5%2785111.441992–199376.7%281087.1
1987–198828.6%2785110.031961–196277.2%281087.13
1991–199229.1%2785112.531971–197278.8%283585.78
2014–201529.1%2785111.121967–196882.5%284583.99
1963–196429.6%2785112.751972–197382.5%284584.14
2004–200530.2%2785115.152007–200883.6%283585.6
1985–198635.4%2785107.812002–200384.1%281087.09
2001–200236.5%2785110.532011–201284.1%283081.95
1964–196538.6%2785108.031984–198585.2%282583.14
1982–198342.3%2785105.041986–198786.8%282081.43
2009–201042.3%2785105.671959–196090.5%282581.47
1968–196945.5%2785103.781983–198493.7%284075.22
2008–200945.5%2785107.172006–200793.7%283077.46
1996–199748.7%2790103.261994–199594.2%284573.92
1970–197149.2%2795102.161973–197496.3%284573.22
Table 10. Year-end water level of each year determined by the extracted rule and its corresponding power generation.
Hydrological YearInflow FrequencyYear-End Water LevelPower Generation/Billion kWhHydrological YearInflow FrequencyYear-End Water LevelPower Generation/Billion kWh
1965–19661.6%2785125.12015–201649.7%2799101.65
1993–19947.4%2785118.462017–201850.3%2800102.56
2012–20137.4%2785123.381979–198056.6%281296.49
1998–199910.0%2785117.061981–198257.7%281496.6
2003–200412.7%2785118.132016–201757.7%281498.98
2018–201912.7%2785122.481976–197758.7%281596.48
1999–200014.8%2785118.011995–199660.9%281796.64
1957–195816.4%2785118.151988–198961.4%281894.99
2005–200616.4%2785118.651978–197962.4%281995.15
1974–197518.0%2785115.311977–197864.0%282094.68
2000–200119.0%2785117.042013–201464.0%282095.09
1989–199019.6%2785117.432010–201164.5%282095.24
1962–196320.6%2785112.071958–195970.9%282390.4
1960–196123.3%2785116.051975–197672.5%282389.76
1990–199124.9%2785116.711997–199873.0%282390.12
1980–198127.0%2785111.281969–197075.7%282486.78
1966–196727.5%2785111.441992–199376.7%282486.99
1987–198828.6%2785110.031961–196277.2%282487.11
1991–199229.1%2785112.531971–197278.8%282585.74
2014–201529.1%2785111.121967–196882.5%282683.66
1963–196429.6%2785112.751972–197382.5%282684.01
2004–200530.2%2785115.152007–200883.6%282785.51
1985–198635.4%2785107.812002–200384.1%282786.97
2001–200236.5%2785110.532011–201284.1%282781.94
1964–196538.6%2785108.031984–198585.2%282883.13
1982–198342.3%2785105.041986–198786.8%282981.41
2009–201042.3%2785105.671959–196090.5%283381.46
1968–196945.5%2785103.791983–198493.7%283875.22
2008–200945.5%2785107.172006–200793.7%283877.33
1996–199748.7%2796103.251994–199594.2%283873.91
1970–197149.2%2798102.151973–197496.3%284373.23
Publisher’s Note: MDPI stays neutral with regard to jurisdictional claims in published maps and institutional affiliations.