Abstract
This study assesses the bioenergy generation potential of crop residues in Ukraine for the year 2030. Projections of agricultural development are made based on the Global Biosphere Management Model (GLOBIOM) and verified against available Agricultural Member State Modeling (AGMEMOD) results in regard to the six main crops cultivated in Ukraine (wheat, barley, corn, sunflower, rape and soya). Two agricultural development scenarios are assessed (traditional and innovative), facilitating the projection of future crop production volumes and yields for the selected crops. To improve precision in defining agro-environmental limitations (the share of crop residues necessary to be kept on the fields to maintain soil fertility for the continuous cultivation of crops), yield-dependent residue-to-product ratios (RPRs) were applied and the levels of available soil nutrients for regions of Ukraine (in regard to nitrogen, phosphorus, potassium and humus) were estimated. The results reveal the economically feasible future bioenergy generation potential of crop residues in Ukraine, equaling 3.6 Mtoe in the traditional agricultural development scenario and 10.7 Mtoe in the innovative development scenario. The projections show that, within the latter scenario, wheat, corn and barley combined are expected to provide up to 81.3% of the bioenergy generation potential of crop residues.
1. Introduction
According to the national strategic documents from 2017 [1], renewable energy is expected to play a growing role in Ukraine, reaching 15.5 Mtoe or 17% of total energy supply by 2030, while the energy generated from biomass, biofuels and waste is projected to reach 8.8% or 8 Mtoe. This is deemed crucial for the diversification of energy sources and for increasing Ukraine’s independence from foreign energy suppliers, while having a favorable impact on climate change and the environment.
Currently (2018 being the latest available data), renewable sources in Ukraine generate 4.3 Mtoe or 4.6% of the total energy supply, while biomass, biofuels and waste combined generate 3.2 Mtoe or a 3.4% share [2]. To reach the goals set, an intense structural transformation of the energy sector is needed, shifting it toward renewable energy generation. Private investors (as the key actors in this transformation) must follow the indicative development path and implement the available production technologies.
As one of the leading domestic entities in the energy sector, the Bioenergy Association of Ukraine [3] states that the majority of bioenergy generation potential in Ukraine is based on the crop residues of mainly cereals and oleaginous plants (both from field and processing) and energy crops (corn, rape, energy trees, and shrubs), which—combined—provide up to 83% of the country’s total biomass potential (Figure 1).
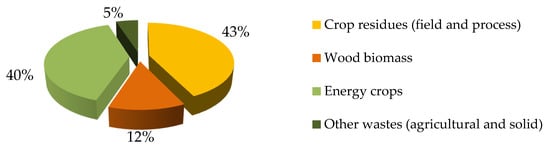
Figure 1.
Economic potential of energy generation from biomass in Ukraine by inputs (based on 2017 data). Source: own aggregation based on Bioenergy Association of Ukraine estimations [4].
The current high energy generation potential of biomass in Ukraine has also been confirmed by other studies. In particular, [5] provides an assessment of the so-called technical sustainable potential of crop residues based on five key crops (wheat, barley, corn, sunflower and rape) equaling ca. 6.1 Mtoe (estimations based on 2013 data). In the study, the technical sustainable potential (i.e., one that ensures the required return of nutrients to the soil) is derived from the theoretical potential, and takes into account limitations for yield increases in residues due to technical constraints. In addition, sustainability constraints are considered, although the study stresses that sustainability is limited to environmental factors and that socioeconomic factors are not covered. Another study [6] by the Food and Agriculture Organization (FAO) provides an overview of different assessments of the economic potential of primary agricultural residues based on data from the first half of the 2010s, with the annual results varying within the 9.9–12.8 Mtoe range.
Energy generation based on biomass is becoming increasingly important as a low-carbon, widely available, renewable component of national energy matrices [7], with land-intensive bioenergy already constituting a significant part of the global energy mix [8]. In the past two decades, studies have made efforts to substantiate bioenergy development directions and functions [9,10,11,12,13] focusing on the diverse uses of biomass, and have thereby also tried to define the existing and future energy potential of biomass globally [14,15,16,17,18] or for particular countries [19,20,21]. As more and more of the peculiarities and limitations of biomass utilization become visible, increasing numbers of studies [8,22,23,24] are also seeking to go beyond simple assessments of bioenergy potential, additionally defining if and how its utilization will be feasible and relevant in the long run.
The generation potential of agricultural crop residues is among the most frequently discussed topics [5,25,26,27]. The utilization of this potential is especially beneficial to countries focusing on crop production and boasting vast agricultural areas. Ukraine is one example, boasting 41.5 million ha [28] of agricultural land and intensifying its crop specialization in its constantly growing agricultural production. This explains the considerable interest in researching crop residues’ potential in Ukraine [4,6,29,30,31,32,33,34,35,36]. Nevertheless, the variety of approaches implemented in the cited studies exemplify the complexity of the issue and the existence of different methods to estimate both crop residues’ availability and the bioenergy generation potential of the withdrawn biomass. Most agree that there is a continuous need to improve the methods and approaches utilized, taking into account more factors and assessing existing uncertainties.
Among the research uncertainties are future agricultural development trends; thus, many studies prefer to assess the present potential of crop residues based on the available statistical data. Diversified crop yields and their expected values in the future represent other uncertainties, as climate change, extreme weather events and the limited availability of organic and mineral fertilization have substantial influence, yet are difficult to predict. Regional disparities exist in terms of soil fertility and nutrient deficits. Overall, approaches to estimating crop residues’ volumes differ depending on the research’s purpose. As [37] states, agricultural crop residue estimations are often limited to multiplying crop yields by a harvest index (the ratio of non-grain plant material to grain material), yet estimates can be refined by accounting for factors that might limit their quantities.
Crucially, the removal of crop residues from fields must be managed in a balanced manner in order to satisfy the sustainability of agricultural production and development. Residues play a number of critical roles within an agronomic system, and have direct and indirect impacts on physical, chemical, and biological processes in the soil. Excessive residue removal can degrade the long-term productive capacity of soil resources [27].
Thus, bioenergy generation potential must be realized while maintaining sustainable crop production through ensuring adequate levels of soil nutrients and aiming at the optimization of mineral fertilization according to agronomic and environmental norms, as well as economic viability. This means that the key criterion for crop residue removal is the optimal withdrawal level, ensuring the balanced satisfaction of both continuous crop production and bioenergy needs. Therefore, the objective of this research is to define the future bioenergy generation potential of crop residues in Ukraine while satisfying these agro-environmental limitations.
This article is divided into five sections. Following the introduction, Section 2 explains the methods used to model Ukrainian agricultural development (serving as the basis for the estimation of selected crop production volumes), the methods used to calculate the environmental limitations for the removal of crop residues, and the methods used to estimate the energy potential of crop residues, supplemented by a description of the data sources. Section 3 presents the research results as follows: (a) a brief description of Ukrainian agriculture; (b) projections for the development of selected crops’ cultivation; (c) an assessment of the availability of crop residues based on agro-environmental limitations; and (d) estimations of bioenergy generation. Subsequently, Section 4 is devoted to a discussion and comparison of the results obtained with similar studies. Finally, Section 5 presents the conclusions, implications and limitations of the work.
2. Methods and Materials
Typical agricultural crop residues in Ukraine can be divided into two main groups: (1) field residues, comprising straw, stalks, stubble, leaves, seedpods, etc.; and (2) process residues, comprising husks, seeds, roots, and bagasse. The substantiations presented in this article strictly deal with the former (also referred to as crop residues).
2.1. Modeling Ukraine’s Agricultural Development
Given that the research approach has been designed to estimate the future bioenergy generation potential of crop residues, 2030 is set as the target year. Thus, it is crucial to identify the current and projected trends in the development of Ukraine’s agricultural sector that will determine the potential future availability of bioenergy resources. These estimations serve as the basis for understanding the economic potential of the crop residues available for energy generation. Trends in the agricultural production of selected crops are modeled using the Global Biosphere Management Model (GLOBIOM), including elements such as crop yields, gross harvest, and regional distribution. GLOBIOM is a partial equilibrium model of the global agriculture and forestry sectors, providing data for crop and livestock production at the level of simulation units. There are two sets of variables: endogenous (e.g., process, production, land uses) and exogenous (e.g., population, GDP growth, technological changes). Prices are determined at the regional level to establish market equilibrium to reconcile demand, domestic supply, and international trade. The average yield for each crop in each major region or country is taken from the Food and Agriculture Organization Corporate Statistical Database (FAOSTAT). Potential and average yields as well as yield variability dependent on climatic and weather conditions are provided in simulated units, generated based on suitability studies by the Environmental Policy Integrated Climate (EPIC) model. Land and other resources are allocated to different production and processing activities to maximize a social welfare function, which consists of the sum of the producer and consumer surplus, based on cost structure and input use in terms of simulated units. The model simulates four different crop management systems—irrigation, high-input/rainfed, low-input/rainfed, and subsistence farming—with different levels and structures of production cost and profitability. It is based on the following key determinants: on the one side, demand, and, on the other, the profitability of the various land-based production activities. Thus, the model allows the land use change between crops and management systems to maximize the social welfare level [38].
While the estimations for this research are conducted solely with the use of the GLOBIOM, the results are also compared to the Agricultural Member State Modeling (AGMEMOD) results available in the literature [39].
Two modeling scenarios have been developed for the purpose of this research with the use of the GLOBIOM model: business-as-usual (BAU) and innovative (INNO). The BAU scenario is based on the assumption that the current development trends in Ukrainian agriculture (covering 2000–2015) will be preserved. The INNO scenario assumes the increasing implementation of agricultural production technologies through intensifying investment (based on the possible increase in the availability of financial resources), as well as scientific development, the modernization of existing agricultural machinery, the application of more advanced agricultural technologies, the use of high-quality seeds, and improvements in infrastructure. Technological changes (exogenous variables in the model) depend on GDP growth, via the elasticity function. These changes determine the level of crops’ yields, the production costs, and the profitability of the different land-based production activities. In general, the INNO scenario provides a better realization of crops’ potential yields (at least 80% of potential yield for a high-input system) and the widespread implementation of the high-input management system.
2.2. Methods for Evaluating the Environmental Limitations to Removal of Crop Residues
In order to conduct agricultural activities ensuring sustainable development, it is important to satisfy the agrochemical Law of Return, which requires that the soil be compensated for the nutrients removed by crops. In addition, soil nutrient losses due to general agricultural activities need to be taken into account. Typically, the control is conducted by determining the balance of (a) humus, and (b) nutrients. The main sources of humus are the humification of crop residues and organic fertilizers, while its losses occur due to its mineralization and erosion. Nutrient uptake is usually measured on the basis of experimental reference values that take into account their content in organic and mineral fertilizers and crop residues, as well as their replenishment due to biological nitrogen fixation and precipitation. Soil nutrient losses are estimated through their removal by crops during harvest and due to soil erosion (via the processes of leaching and weathering).
In the following, the estimates for humus and nutrient balances within the cultivation of selected crops in Ukraine are calculated based on the methodology developed by the National Academy of Agrarian Sciences of Ukraine (NAASU) [40], which takes into account the aforementioned characteristics. It includes evaluations of the balances of the essential nutrients (N, P2O5, K2O) and humus. The nutrient balance is calculated as the difference between nutrient supplies and losses. Nutrients are supplied through the application of mineral and organic fertilizers, with precipitation, seeds, and symbiotic and non-symbiotic nitrogen fixation. Nutrient losses occur due to crop harvest, weeds, erosion, denitrification, and irrigation (although only for irrigated land). Similarly, the balance of humus is calculated by taking into account all sources of its accumulation (humification of crop residues, humification of organic fertilizers) and losses (humus mineralization, losses due to erosion).
2.3. Energy Potential of Crop Residues
Although numerous investigations have sought to estimate the energy potential of crop residues (many of which are referred to in this study), most [5,6,34,36,41] use similar methods based on the assessment of theoretical potential, while the next estimation steps are referred to differently by the authors (e.g., technical potential, technical sustainable potential, economic potential). Nevertheless, the key features they share are derived from the method [30] provided by the National Academy of Sciences of Ukraine (NASU). The [33] provides further development of this method, outlining three types (levels) of potential: theoretical, technical, and economic.
Theoretical potential: the overall maximum amount of terrestrial biomass that can be considered theoretically available for bioenergy generation within fundamental biophysical limits. The theoretical potential for field residues is calculated based on the maximum crop yields within the particular climate limits.
Technical potential: the fraction of the theoretical potential achievable for energy generation under the specific techno-structural conditions with the current technological possibilities (such as harvesting and processing techniques) available. It can be limited by various factors, in particular spatial allocation, competition between land users, and ecological limits. The technical potential is calculated by multiplying the theoretical potential and the coefficient of technical availability.
Economic potential: the share of the technical potential suitable for energy generation under current market and economic conditions.
The abovementioned elements are calculated as:
- (a)
- theoretical potential:
- (b)
- technical potential:
- (c)
- economic potential:
Thus, crop residues’ economic potential depends on a number of the abovementioned coefficients used for the assessment. What is important to note is that there is still uncertainty within scientific publications as to their proper levels. The first uncertainty exists in the case of the residue-to-product ratio (RPR). The recommendations used nationwide, developed by the NASU, offer fixed RPRs [30]. However, both theoretical and applied studies indicate an inverse correlation between the yields of primary and secondary crops in conditions of the increasing productivity of most primary crops [5,32,34,41]; thus, yield-dependent RPR values seem to be more suitable. In addition, the influence of crop varieties and hybrids needs to be taken into account (in particular, cover crops), the cultivation of which is becoming especially important due to climate change’s impacts (lower water availability, extreme weather conditions [39]). Therefore, RPRs for both approaches are presented in Table 1 for selected crops. In the second approach, the unknown x in the equation for the crop residue evaluation is the yield, while the variable y is the crop residue yield depending on the main crop yield, both in decitons.

Table 1.
RPRs (fixed and yield-dependent) for selected crops.
In general, the RPRs estimated within the second approach based on empirical Ukrainian data for the period 2000–2015 are higher than the RPRs estimated based on the European Union’s data [32] (pp. 12–13). These differences can be explained by the higher crop yields and different technologies, crop varieties and hybrids used in the EU. They could be used to understand possible future development trends in Ukraine in case of the implementation of similar production approaches.
Additional uncertainties in regard to RPRs persist due to existing or periodically arising challenges, such as seasonal and regional weather uncertainties, the availability of nitrogen, and the application of herbicides [5] (pp. 73–79).
Some uncertainties also occur when evaluating the coefficient of the technical availability of crop residues (). Although it is generally characterized by a lower level of uncertainty, some variability is still present due to differences in the technologies used for harvesting (i.e., requirements for the height of the cut stem, and availability of equipment on a farm allowing the residues to be harvested). At the same time, the value of the technical potential of crop residues could be reduced by the negative effects of weather events (hail, squalls, droughts). In the aforementioned NASU recommendations [30], the value of the coefficient of technical availability is defined at the level of 0.8. Notably, the use of slightly lower values has been substantiated in some studies by Ukrainian scientists. In particular, for the Khersonska region, the coefficient of technical availability of the main grain crops based on data from 2012–2013 was estimated at 0.5, and for corn and major industrial crops at 0.7 [34] (p. 113). Another study dealing with the Sumska region defined a coefficient of technical availability of 0.5–0.7 for grains [42] (p. 113).
Concerning the coefficient for crop residues’ utilization for energy purposes , uncertainties depend on market and technical factors, including market competition and the economic efficiency of different uses of crop residues (for animal feed, as a fertilizer), the availability of infrastructure for transportation, and the availability and capacity of biomass processing for other purposes. Traditionally, the use of cereals’ straw is directed at the needs of livestock (as roughage and bedding). However, the role of straw in animal nutrition (as a source of fiber) in the transition to intensive technology is minimized, retaining its functional purpose only as bedding for animals. With market changes in Ukraine, the profile of agricultural producers has changed significantly due to intensifying production specialization and a general reduction in livestock numbers. There are fewer and fewer agricultural enterprises with diversified crop and animal production. Currently, there are regional zones of different agricultural specializations in Ukraine, most notably a few livestock production zones around key urban agglomerations [43] (pp. 131–133). Thus, several conclusions can be drawn that are important from the point of view of competition over access to agricultural residues for livestock production purposes:
- a general declining trend in demand for straw for livestock production purposes;
- distribution inequalities in the regional concentration of specialized livestock enterprises;
- improvement of livestock production technologies, leading to the reduced use of biomass as bedding.
Decreasing competition from the livestock sector may be partially offset by increasing demand for the use of crop residues for agro-environmental purposes within land use, aimed at restoring soil fertility. Limiting the possibility of applying organic fertilizers (natural manure) increases the role of crop residues for the restoration of the organic component of the soil: 1 ton of straw equals 2.5–2.8 tons of bedding manure in equivalent humus [35] (p. 6). However, the use of straw as a fertilizer leads to additional costs, which is mainly due to increased fuel consumption to mechanically prepare the straw for further use, and the higher application rates of nitrogen fertilizers to accelerate the mineralization of straw (10–12 kg of N per 1 ton of straw) [35].
In the last decade, demand for crop residues has been increasing due to climate change’s impacts (higher temperatures and water evaporation, lower rain frequency) through the implementation of adaptation measures in crop production. Under new climate conditions, the efficiency of traditional agricultural practices (primarily based on deep tillage) has been decreasing, especially in the southern and eastern regions of Ukraine. Accordingly, the issue of the selection and implementation of alternative technologies and practices aimed at minimizing the negative impacts of weather factors has gained in importance. Such technologies include strip-, mini, or no-till practices. The use of these technologies limits the possibility of using crop residues for purposes other than as a cover material [44].
However, it should be noted that currently increasing crop yields provide higher residue outputs, creating some difficulties for those producers who apply no-till technologies. Therefore, in these cases, a certain proportion of the crop residues still needs to be removed despite the conditions of highly productive agriculture. These practices have already spread beyond the country’s arid and wet regions, being actively implemented on the farms of western, central, and northern Ukraine [45]. The efficiency of no-till technologies has been confirmed by the experiences of South American countries (in particular Argentina, with 80% of its main cropland being cultivated with the use of no-till technology [46]), yet they also have certain disadvantages that reduce their attractiveness for widespread implementation. The key disadvantages are [44]:
- increased costs of weed (15–100%) and pest (by two to three times) control;
- lower seed germination, requiring increased seeding rates (by 15–25%);
- higher price of equipment for direct seeding;
- higher fire hazard due to the presence of crop residues on the soil surface;
- need to control the application of additional doses of mineral fertilizers (phosphorus, nitrogen) under certain conditions.
Given the established practice of agricultural technologies in Ukraine, as well as the objective shortcomings of minimal tillage systems, a significant shift in the structure of the technologies applied by agricultural producers should not be expected in the near future. Therefore, a surplus of crop residues is expected to be available in Ukraine overall; however, due to uneven spatial distribution (regional, district, local), more comprehensive and regionally targeted approaches are required to assess the economic potential of biomass for energy generation purposes.
As for the coefficient for crop residues’ utilization for energy purposes, according to the NASU recommendations, a fixed value of 0.25 is applied to all crops [30]. This value is based on the demand of livestock production and levels to maintain balanced organic matter in the soil. Under visible conditions of increasing crop productivity, it is possible to expect the achievement of a higher level of coefficient (0.3 for cereals, 0.4 for industrial crops and corn) without harming sustainable land use, but with the application of the recommended rates of mineral and organic fertilizers [29] (p. 17). The use of the average value of the coefficient is understandable in strategic documents at the national level, but in in-depth calculations, its values should be detailed, taking into account regional factors: spatial features of production allocation and local demand from livestock production; technologies used for crop production; types of crops; and available options to maintain the soil’s fertility by biomass application (e.g., the digestate from biogas generation, the ash and sludge from biomass combustion process [47]).
2.4. Data Sources
Data on key agricultural trends (yields, area, production, nutrient supply with mineral and organic fertilizer, etc.) are provided by the State Statistics Service of Ukraine. Data on the production costs of different agricultural products are calculated based on the annual database “Main economic indicators of farm activity” are available for 2000–2015 (based on a survey with approximately 8000 farms carried out annually), which form the basis for the Ukrainian input data used by the GLOBIOM used within this study. National and regional data on soil types and their nutrient and humus contents are provided by the State Statistics Service of Ukraine. The spatial allocation of soil types is gathered from the State Service of Ukraine for Geodesy, Cartography and Cadastre [48].
3. Research Results
3.1. Background: Ukrainian Agriculture and Its Transformation
Since 1991, major transformations in Ukrainian agriculture have taken place. Overall, livestock production has gradually and substantially declined (the cattle population decreasing eightfold and pig production by 3.4 times). Consequently, there are fewer opportunities available for the application of organic fertilizers in the form of manure, as was widely used in Ukraine’s pre-independence era (6208 kg/ha of agricultural land in 1990 vs. 281 kg/ha in 2018 [49]). In parallel, through the 1990s there was an initially sharp reduction in the application of mineral fertilizers in crop production due to agricultural transformation processes and overall economic instability. Thus, the average application of NPK mineral fertilizers (consisting of nitrogen, phosphorus and potassium components) dropped from 105 kg/ha of agricultural land in 1990 to its lowest record of 6.7 kg/ha in 2000, and only partially regaining in intensity in the following years, reaching 56.5 kg/ha in 2018 [49]. However, crop production after the beginning of the 2000s due to the acceleration of investments (including the inflow of foreign capital) began its steady increase. Even though (since 2010) the rate of mineral fertilization has been growing, it still does not usually satisfy agronomic requirements to maintain the proper level of soil nutrients [40] (p. 97). Farming approaches and abilities vary greatly depending on a farm’s type, size, and market focus. Currently, a wide range of medium and large agricultural enterprises follow an export-oriented production strategy based on cultivating a limited number of crops: wheat, barley, corn, rape, sunflower, and soya. Due to their limited access to capital, some (mostly small and medium-sized) farms do not have the capacity to maintain the necessary equipment for cultivating a diversified number of crops. Therefore, they usually grow no more than two or three crops. Such limited crop rotation leads to soil depletion. Indeed, according to previous Ukrainian soil quality studies [50], humus content decreased by 15% between 1991 and 2005.
Both 2004 and 2005 saw new intense growth in agricultural activity after 13 years of economic instability and production decline. This growth was accompanied by corporatization and the introduction of state support for agricultural producers, seeing the area used for arable land increase by 95,000 ha (0.3% of the total, albeit excluding the area of the currently occupied Autonomous Republic of Crimea) to a total of 29.9 million ha in 2017. This is still 7% less compared to 1990, yet provides evidence of growing pressure upon agricultural land resources, including those left unattended during the 1990s and the beginning of the 2000s. The area represented by pastures diminished by over 100,000 ha from 2004 to 2017. Key changes in the sown area structure since 2004 include the increase in areas (and their share in total) being used for industrial crops, structural changes in cereals (replacement of rye and barley by wheat and corn in northern regions). These key changes are summarized in Table 2.
Table 2.
Changes in agricultural land use in Ukraine from 2004 to 2017.
Crop production currently prevails in the total agricultural output (72% in 2017), having grown by 93% from 2000 to 2017, while the growth of livestock production equals just 20%. Cereals, leguminous and industrial crops make up over two thirds of the gross crop production. Aside from having relatively high shares in Ukrainian exports, these subsectors are also providing most inputs for the production of fodder necessary for the domestic livestock sector. The aforementioned crop groups cover approximately 87% of total sown areas or 68% of total agricultural land in the country, with the six main crops (wheat, barley, corn, sunflower, rape, and soya) covering 80% and 63%, respectively [51] (Figure 2).
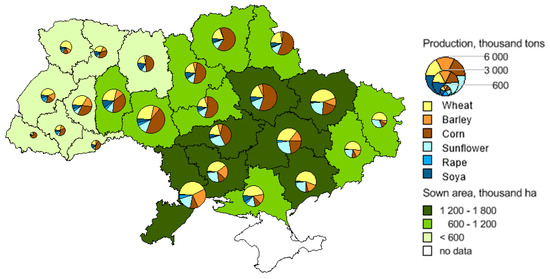
Figure 2.
Sown areas and production volumes of main crops in Ukraine (based on 2017 data). Source: own compilation based on [51].
3.2. Projection for the Development of Selected Crops’ Cultivation by 2030
Ukraine is among the world’s leading countries with the largest unrealized agricultural potential [52,53,54]. According to the Global Yield Gap Atlas (GYGA), the current level of crop yields in Ukraine equal 30–45% of the estimated potential [54]. Therefore, current relatively lower yield levels could mean bigger opportunities compared to other countries concerning the possible increase in productivity in the future, even in the case the development is realized within the BAU development scenario. In addition, in the next decade the positive impact of climate change will still mostly prevail in the case of yields of major crops (excluding in south-eastern regions of the country), increasing average crop productivity relative to the baseline period.
The increasing yield forecasts derived within the GLOBIOM simulation are also confirmed by other modeling results. This is the case of the report [39] published in 2017, revealing the modeling results for Ukrainian agricultural development up to 2030, based on the AGMEMOD model. Thus, Figure 3 represents the results for the selected main crops (which combined cover approximately 90% of the total sown area in Ukraine), comprising both the data for two developed scenarios within this research (BAU and INNO) and the aforementioned AGMEMOD traditional development scenario results.
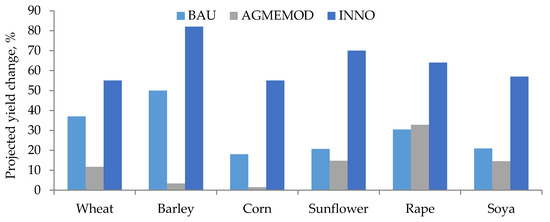
Figure 3.
Projection of changes in yields for selected crops in Ukraine by 2030 (compared to average yields in 2008–2014). Source: Agricultural Member State Modeling (AGMEMOD) modeling results [39] and own calculations (business-as-usual (BAU), innovative (INNO)) based on the Global Biosphere Management Model (GLOBIOM).
The modeling results show the following yield growths by 2030: 10–20% for oil crops, and 18–50% for cereals in the BAU scenario. The AGMEMOD modeling confirms these projections, although, for the cereals, the expected growth is slightly lower. However, the forecasts for the AGMEMOD model tend to underestimate the available potential of cereals (Figure 4) when compared to the latest available statistical data. This provides additional reassurance concerning the credibility of the forecasts, including the innovative scenario results (INNO). The probability of the innovative scenario’s realization is confirmed by the visible acceleration of yield levels from 2015 to 2019, which was possible due to the actual introduction of new crop varieties and plant protection systems minimizing the negative effects (temperature variations, precipitation reduction) while maximizing the positive impacts (higher temperatures) of climate change, thereby facilitating the increased adaptation abilities of domestic agricultural producers [55,56].
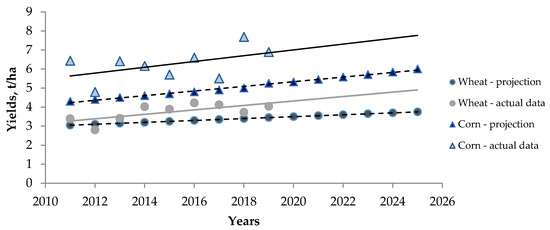
Figure 4.
Wheat and corn crop yields: comparison of available statistical data and projections obtained with the AGMEMOD model. Source: own compilation based on [51], verified against [39].
The projections of crops’ production volumes obtained via the GLOBIOM approach are compared with the AGMEMOD results (Figure 5). The general trend of increasing production volumes according to the results of the GLOBIOM is consistent with the conclusions obtained within the AGMEMOD modeling, with the exceptions of barley and, to some extent, sunflower. This result can be a guide for domestic producers to make efforts to improve the economic efficiency of barley production, as its permanent growth in global demand and available production potential provides barley with a competitive advantage compared to the key cereal crop in Ukraine: winter wheat.
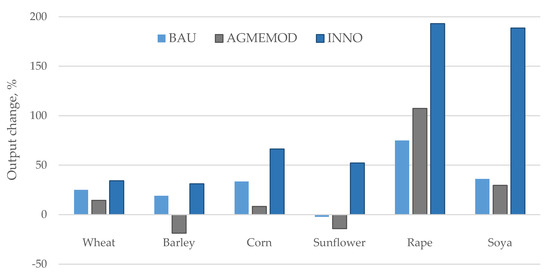
Figure 5.
Projection of production (output) change for selected crops by 2030 (compared to 2008–2014 average volumes). Source: own calculations.
3.3. Assessment of Crop Residues’ Availability Based on Agro-Environmental Limitations
Based on the crop production projections, the theoretical potential of crop residues for the investigated crops (Table 3) is assessed. For this purpose, both of the abovementioned approaches to the assessment of RPRs () are used: , provided in Table 1, and , estimated with the use of the EU’s RPR data [41].
Table 3.
Assessment of the theoretical potential of crop residues for the selected crops in 2030, ktoe.
The assumptions of improving Ukrainian farmers’ access to technologies and financing support the expectations for the growing technical availability of crop residues. However, there is a high risk of adverse weather events that may reduce the technical availability of crop residues in certain regions and particular years covered by the projection. Given these uncertainties, the coefficient of the technical availability of crop residues at the level of 0.8 (provided by the NASU [30]) is used within the estimations.
Currently, the main share of the technical potential of crop residues is being utilized for the purposes of livestock production and stabilization of soil fertility, leaving only the remainder to be potentially used for renewable energy generation purposes. To determine future development trends within the economic potential of crop residues for energy production, some general assumptions are used for the years to come:
- declining share of roughage in livestock feed;
- a reduction in the use of straw for bedding due to the increasing use of alternative materials (e.g., rubber, sawdust).
According to both forecasts obtained based on the GLOBIOM for the period up to 2030, a further reduction in cattle numbers is expected, with a slight (1–7%) increase in pigs and the further growth (25–40%) of poultry (depending on the scenario). At the same time, the share of all livestock kept in farm households will continue to decline according to the ongoing trends. Given these forecasts, the use of straw for livestock production purposes is expected to equal the baseline values or even decrease due to the expected gradual implementation of agricultural innovations in corporate livestock production. Accordingly, this will determine the trends in the amounts of manure available for various purposes, mainly for application to the soil as organic fertilizers. This, in turn, will engender certain risks for sustainable land use—specifically compliance with the agrochemical Law of Return. Under such conditions, the need for crop residues to maintain agro-environmental functions will increase, limiting the possibilities of its use for bioenergy generation purposes.
The need to return a proportion of agricultural residues to the fields in Ukraine owes to the low use of organic fertilizers, a consequence of the decline and disproportionate development of the livestock sector, this being the main source of organic matter for the soil due to manure humification. A deficit-free balance of humus manure application should be at least at the level of 8 t/ha in the southeastern regions, and up to 14 t/ha in the northwest when the average level in Ukraine is below 1 t/ha [50] (p. 49). Farmers try to ensure the return of nutrients by more intense mineral fertilization and by leaving 100% of crop residues in the fields. However, mineral fertilization is often either conducted in violation of agro-ecological norms of required nutrient balance, or the amount of mineral fertilization is insufficient for an adequate process of humification of crop residues.
The conducted assessment of the production processes of the main crops in Ukraine confirms the existence of issues preventing the satisfaction of deficit-free requirements. Thus, wheat production with a 100% return of crop residues ensures a positive balance of humus (H) and nitrogen (N) in most regions of Ukraine, but does not ensure the return of phosphorus (P) and potassium (K). The worst condition with the return of nutrients is observed with respect to the cultivation of barley and corn (Table 4).
Table 4.
Soil nutrient balance for the production of cereals in Ukraine by region (calculated for 2017).
The production of industrial crops also shows unbalanced soil content and an inability to balance the removed nutrients and humus, although due to the application of sufficient amounts of nitrogen-based mineral fertilizers, a positive balance for N can be achieved in the cultivation of sunflower and nitrogen-fixing soybean. Nevertheless, there is still a shortage of humus and potassium in the cases of the aforementioned crops. The cultivation of rape shows a slightly different picture: there is an acute deficit of nutrients, but, for humus, the balance of return is sufficient. This can be explained by the high output of crop root residues of rape, which, during its humification, provide the return of sufficient organic matter to the soil (Table 5).
Table 5.
Soil nutrient balance for the production of industrial crops in Ukraine by region (calculated for 2017).
Thus, it can be concluded that, in most regions of Ukraine, the currently applied technologies for the production of the main crops do not satisfy agro-ecological requirements, and limit the opportunity to remove crop residues for other purposes, including bioenergy generation.
Soils with low humus content are especially vulnerable to various climatic factors, which negatively affect soil composition, structure and quality. In Ukraine, 1.7 million ha (4.1% of the country’s agricultural land) is subjected to wind erosion, 13.3 million ha (32%) to water erosion, and over 2 million ha (4.8%) to both of these types of erosion. In addition, 10.7 million ha (25.8% of agricultural land) is classified as acidic, 1.7 million ha (4.1%) as saline, and 1.9 million ha as waterlogged soils. Over 20% of the territory of Ukraine is contaminated with various toxic compounds. Some areas are contaminated with radioactive compounds. Negative geological phenomena are common in over 50% of the country [57] (pp. 7–8).
Within the developed scenarios, the rate of mineral fertilizer application will increase gradually by 2030. The BAU and INNO scenarios are based on the gradual growth of mineral fertilizer application until 2030, at least by 50% and 85% of the base level (2017) for the farms ranking in the top 10% for intensive production technologies for these scenarios, respectively. Organic fertilization is expected to increase as well, but—on average—not more than 2–5 t/ha in the BAU and 3–7 t/ha in the INNO scenario, depending on crops.
Thus, the main sources of nutrient return are expected to be mineral fertilizers (up to two thirds of the return amount of nutrients depending on the crop) and crop residues (15–35% accordingly) for all crops except soya (due to nitrogen fixation, the returns are up to 50–60% of used nitrogen). The organic matter of the soil (humus) in conditions of limited application of organic fertilizers can be maintained only by returning the crop residues to the soil. Given that maintaining a positive balance of humus is a decisive factor for farmers, the possibility of removing part of the crop residues for energy purposes is therefore further limited. To understand these limitations, Table 6 presents the humus balance for the investigated crops within the two developed scenarios.
Table 6.
Humus balance under conditions of residues’ return to the soil, t/ha.
The positive balance of humus indicates the possibility of removing part of the crop residues in compliance with agro-environmental requirements. In the cases of soybean and sunflower, even within the INNO scenario, assuming the almost maximum allowable approximation of the yield to the potential level (and therefore an increase in the yield of the crop and its residues), there is a deficit of organic matter recovery in the soil. This is due to the relatively lower amount of crop root residues of soybean, and—for sunflower—a relatively lower coefficient of humification of crop stalks (0.2–0.25 for cereals and legumes, and 0.14 for sunflower). Thus, the average amount of straw that can be removed for bioenergy generation purposes varies depending on the crop, the region, and assumptions according to the developed scenarios. For example, according to the BAU scenario, the amount of crop residues available for bioenergy generation purposes varies from 0 to 3 t/ha, with a national average of 0.8 t/ha. Under the INNO scenario, the average and maximum values increase to 2 and 3.8 t/ha, respectively (Figure 6).
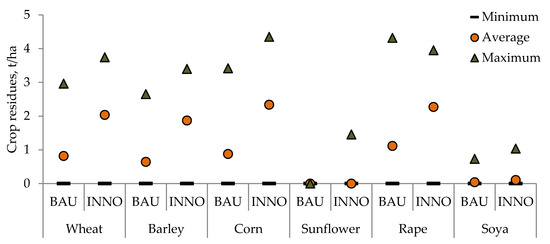
Figure 6.
Amount of crop residues available for bioenergy generation purposes while satisfying agro-environmental requirements. Source: own calculations.
In addition to satisfying the agro-environmental requirements of land use, a proportion of cereals’ residues (primarily wheat and barley straw) is used for livestock production purposes: the estimated demand for these purposes equals 3.6 and 2.7 million tons for the BAU and INNO scenarios, respectively. The lower demand for crop residues from livestock production corresponds with the current level in EU countries specializing in livestock. In particular, the maximum amount of straw used for livestock production purposes does not exceed 3.9 million tons in Poland, 3.8 million tons in France, and 2.9 million tons in Denmark [25].
3.4. Bioenergy Generation Potential (National and Regional)
Both developed scenarios (BAU and INNO) confirm the output growth of the investigated crops, meaning a higher potential loss of humus and nutrients (in particular due to crop harvest). Thus, taking into account the requirement to satisfy a positive balance of humus and nutrients in the soil, the total bioenergy generation potential of the analyzed crop residues in 2030 has been assessed. It is expected to equal 3643 ktoe within the BAU scenario, while, in the case of the INNO scenario, it is forecast to reach 10,723 ktoe (Table 7).
Table 7.
Economic potential of bioenergy generation from the main crop residues in Ukraine in 2030.
The estimated total economic potential of crop residues available for bioenergy generation purposes is unevenly distributed throughout Ukraine. Within the BAU scenario, the largest amounts of crop residues for bioenergy generation purposes would be available in the regions of Kyivska, Cherkaska, Poltavska, Vinnytska, and Ternopilska (200–350 ktoe each). Following the assumptions of the INNO scenario, the regional distribution of future potential does not vary significantly, but the increase in the amounts of biomass available for renewable energy purposes makes it more promising in most regions of Ukraine (Figure 7).
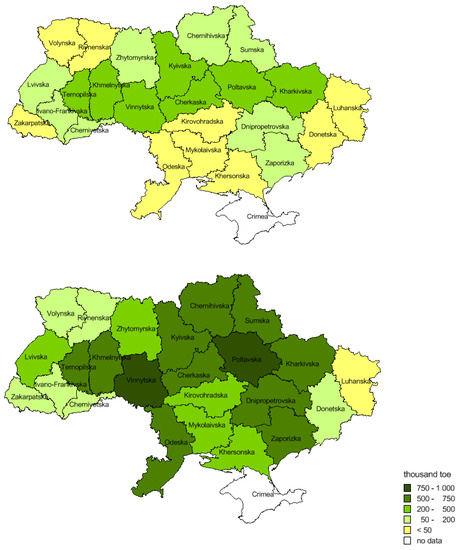
Figure 7.
Assessment of economic potential for bioenergy generation purposes from the main crop residues within the BAU (upper map) and INNO (bottom map) scenarios. Note: no data available for the Autonomous Republic of Crimea. Source: own calculations.
There is an understanding that these results reveal a slightly lower (compared to real availability) level of economic potential due to a number of aforementioned constraints applied within the estimations, as the calculations are based on average regional values of parameters and coefficients, as well as assumptions about the utilized technologies. If the same calculations were to be conducted using local data, the estimates of economic bioenergy generation potential would be higher, as they would involve less generalized constraints and reveal specific local situations.
Additionally, the availability of local data concerning actual crop rotations would facilitate greater precision with the estimation of the accumulation of nutrients and humus in the soil, including residues from predecessor crops, in turn increasing the possibility of extracting crop residues for the next crop rotation (e.g., sunflower, which is less demanding in regard to the Law of Return). Such an absence of nutrient flows and humus changes within the crop rotation, despite being a limitation, would have minimal impact on the results obtained. Another limitation of the research concerns the absence of actual data and assumptions regarding the regional land management systems (e.g., conventional, mini- or no-till), which affect the level of nutrients and humus changes, albeit not significantly.
4. Discussion
The Ukrainian expert community has formed an opinion about the possibility of extracting a significant proportion of agricultural residues for energy generation purposes [4,31,32]. Typically, such conclusions for Ukraine are based on the application of a scientifically established 0.25 coefficient for crop residues’ utilization for energy purposes [30]. In addition, along with increasing yield levels, this ratio can grow to up to 0.3–0.4 depending on the specific crop. It has been noted [29] that the value of the coefficient is based on compliance with the principles of meeting the crop residue demand of livestock production (for feed, bedding) and the return to the soil of some of the organic matter withdrawn with the harvest. In our understanding, the use of a more flexible coefficient would be more precise. Thus, in this study, the coefficient varies by region and crop type, and primarily depends on requirements to satisfy the nutrient and humus balance in the soil. However, in order to achieve greater precision, data on future trends in land erosion, soil quality, the spatial supply of manure and other agronomical aspects would be beneficial.
This study’s results correspond to a large extent with other similar studies for Ukraine, yet differ in terms of several key elements pertaining to the methods used for estimation. For example, the value of assessed economic potential under the developed INNO scenario corresponds with the future trajectory of energy potential from crop residues developed by the Bioenergy Association of Ukraine. In particular, the latter’s assessment of residue energy generation potential for 2050 equals 10.8 Mtoe [29]. This amount includes the residue potential of all grain and oilseed crops, with the share of the six selected crops investigated in our study slightly exceeding 95%. More modest forecasts of the potential of crop residues are included in the Energy Strategy of Ukraine [1], totaling 5.3 Mtoe in 2030.
The results obtained regarding the economic potential of crop residues are also close to those of the International Renewable Energy Agency (IRENA) [58] analysis, which confirmed the possible availability of 11.0–18.3 Mtoe of agricultural residues, including 6.0–9.6 Mtoe of field residues in 2030 depending on the scenario: reference or REmap (Renewable Energy Roadmap). Nevertheless, the implementation of the REmap scenario assumes the several measures: the development of collection systems for agricultural residues, establishing the practice of long-term biomass supply contracts between producers and consumers, and the compulsory inclusion of a biogas plant in major new projects by agro-food companies. Implementation of these measures would currently be highly limited due to the difficult economic situation in Ukraine.
Another study [36] evaluating straw and stubble availability alone has shown that, within Europe, based on 2012 data, Ukraine has the second largest potential for energy generation from agricultural residues, and the largest potential based on a projection for 2030. It is important to note that Ukraine is seeing growth in the volumes of crop residues, while a general declining trend for straw and stubble supply for energy production was also outlined in this study.
In contrast to most of the abovementioned studies, the present investigation suggests going beyond typical projections based on current fixed yields (and therefore fixed RPRs) and, instead of assuming a general national coefficient for crop residues that need to be left on the fields, to take into account regional agro-environmental limitations based on the available soil nutrients. Thus, it becomes possible to understand which regions have the most bioenergy generation potential from crop residues, and to use it for future substantiations of regional economic and energy development strategies. Such estimations could be taken further, achieving greater precision at the regional level if specific soil fertility data could be obtained and used for calculations.
Discussions have recently taken place as to the future of bioenergy, as the limitations of its development are becoming more visible based on the experiences of economically developed countries. One study [8] (p. 274) argues that “land intensive bioenergy makes the most sense as a transitional element of the global energy mix, playing an important role over the next few decades and then fading, probably after mid-century”. We can agree with this statement, although, in our opinion, differences should also be expected depending on the particular region and the level of economic development of the country being analyzed. While the aforementioned study has presented a general global perspective, locally each country would still tend toward the most feasible option to ensure energy security and utilize the available potential. High differentiation would be present depending on economic development, technological advancement, and technical efficiency.
In this light, Ukraine can still be considered in an early development stage in regard to bioenergy generation, with a total 4.6% share (or 4.3 Mtoe) of renewable sources in the total energy supply (including 3.2 Mtoe from biofuels and waste energy combined) as of 2018 [2]. The country’s dependency on foreign energy supply also remains critical (considering its unstable relations with its main long-time energy supplier, the Russian Federation [59]) as, in the same year, 36.5% of Ukraine’s total energy supply was imported [60]. Decarbonization, being another key goal of the global renewable energy development goes in line with the growth of biomass utilization, yet presents itself as a complex issue [61] that needs to be considered and resolved wisely. Therefore, for Ukraine, the utilization of bioenergy generation potential is among the key perspective development directions available, and only under conditions of the efficient transformation of energy structure and the appearance of more beneficial (both economically and environmentally) energy generation technologies compared to biomass-based ones will further changes be possible.
Furthermore, the high probability of the projected intensification of crop production (within the six main types outlined in the research) can be identified for Ukraine based on the growing influence of large agriholdings in the past decade and their specialization. Focusing, in most cases, on crop production, these agriholdings are gradually accumulating agricultural land, and working to increase yields and therefore output volumes. Aiming primarily at exports, they managed to increase the exports of the crops investigated in this study over three-fold between 2005 and 2017: grains by 3.4 times (from 12.7 million tons in 2005 to 42.5 million tons in 2017), and oil crops by 6.7 times (from 0.9 to 6.0 million tons) [62]. Therefore, the existing evidence supports the projected growing capacities for the production of crop residues.
Another issue that needs to be highlighted here concerns the differences between the results of the BAU scenario developed within the GLOBIOM and the results derived from the AGMEMOD model, which was used for reference (Figure 3 and Figure 5). The differences can be explained by the contrasting approaches taken concerning the projections of crops’ yields and spatial allocation. In particular, AGMEMOD is based on the econometric function of yield, depending on the logarithm trend of yield (2008 = 0) and the expected income from crops in the regions (more details on AGMEMOD in [39]. The GLOBIOM uses the simulated crop yields from the EPIC model, which depend on biophysical yield potential and technological progress (calculated on the elasticities between yield and GDP growth).
5. Conclusions
Growth in the production of the main agricultural crops in Ukraine has been intensifying since the beginning of the 2000s, and is expected to continue in the next decade. This will be accompanied by increasing amounts of available crop residues, which could potentially result in the intense development of energy generation from agricultural biomass. These assumptions demanded in-depth analysis, utilizing several assessment approaches modified by the authors to increase the precision of the analysis and to show which elements in the existing methods could be improved.
The study has projected cultivation trends for six selected crops (wheat, barley, corn, sunflower, rape, and soya), these being the key specializations of the Ukrainian agricultural sector in the past two decades. Estimations based on the GLOBIOM (verified against the openly available AGMEMOD results) for the year 2030 included two agricultural development scenarios (traditional BAU and innovative INNO), allowing us to project the future crop production volumes and yields for the selected crops. The target year results have revealed a growth in crop output volumes, with higher rates in the INNO scenario (assuming the implementation of intensive production technologies). The data obtained within the developed scenarios have enabled us to carry out projections regarding the expected volumes of the applicable crop residues.
The previous literature regarding crop residues has shown that despite the generally accepted guidelines for assessing the energy potential of biomass, there are many uncertainties that significantly affect estimations of the feasible level of field biomass removal, referred to in this article as the economic potential of crop residues for bioenergy generation. The main uncertainties are caused by the nonlinearity of RPR, the uncertainty of the harvesting technologies used, weather, and climatic risks. Therefore, to estimate projected crop residue volumes, yield-dependent RPRs drawn from the literature have been used, allowing for improved precision of assessment as well as taking into account national crop cultivation specificities.
The key agro-environmental limitation of the utilization of crop residues as biomass for energy generation in Ukraine is the need to preserve soil productivity through the restoration of its fertility. Under the limited availability of traditional organic fertilizers, crop residues currently represent the main source for humus recovery and the return of the nutrients withdrawn from the soil during the cultivation process. The traditional approach to assessing the bioenergy potential of crop residues is based on the assumption of an up to 25% technical availability of biomass for energy generation purposes; however, taking into account the agro-environmental requirements (primarily the Law of Return), this level varies greatly depending on the region and the crop type.
Therefore, this study has gone further to improve the assessment method for the potential withdrawal of crop residues, and has aimed to calculate the projected availability of soil nutrients (nitrogen, phosphorus, potassium and humus) for all regions of Ukraine. This then served as the basis for the estimation of the sustainable removal limits of crop residues for bioenergy generation. The conclusions based on this analysis demonstrate the need to improve the applied methodological approach to biomass potential assessment that is being used as the basis for national strategic documents in the energy policy of Ukraine.
Regarding the results, the assessment of the level of economically feasible bioenergy generation potential from crop residues for the year 2030 has indicated the possibility of extracting biomass in the equivalent of 3.6–10.7 Mtoe, depending on the scenario of agricultural development (traditional vs. innovative). This does not exceed 24% (varying between 8–24%) of the theoretical potential (total crop residue amount). The projections have also shown that, within the INNO scenario, wheat, corn and barley combined are expected to provide up to 81.3% of the bioenergy generation potential from crop residues. Although these results are comparable to several other studies, the approach utilized here offers less generalized assumptions and the possibility to take into account national crop cultivation peculiarities, as well as regional soil quality conditions.
As for the practical use of the results obtained, it needs to be stated that an expansion in bioenergy generation potential from crop residues in Ukraine while complying with agro-environmental limitations requires the intense implementation of organizational and technical innovations. In particular, it is crucial to ensure the circulation of biomass between agriculture and bioenergy generation, which is still poorly developed, thereby influencing the low output of the bioenergy generation sector and its slow development, as is apparent in terms of its share in total energy output. The specificity of such exchange determines the necessity and feasibility for development of local and regional bioenergy systems. These results demonstrate the need for the implementation of policy measures for the use of local renewable sources of energy, as planned by the Energy Strategy of Ukraine until 2035 [1]. At the same time, this study warns against the excessive removal of crop residues in Ukraine, necessitating the monitoring and maintenance of soil fertility, a function that could be overseen by the State Service of Ukraine for Geodesy, Cartography and Cadastre.
Author Contributions
Conceptualization, S.K., O.B. and V.K.; methodology, S.K. and O.B.; formal analysis, S.K., V.K.; investigation, S.K., V.K., O.B. and A.W.; data curation, S.K.; writing—original draft preparation, S.K., V.K., O.B.; writing—review and editing, S.K., V.K., O.B., A.W.; visualization, S.K. and V.K. All authors have read and agreed to the published version of the manuscript.
Funding
This research received no external funding.
Conflicts of Interest
The authors declare no conflict of interest.
References
- The Energy Strategy of Ukraine until 2035 “Safety, Energy Efficiency, Competitiveness”; Cabinet of Ministers of Ukraine: Kyiv, Ukraine, 2017. Available online: https://zakon.rada.gov.ua/laws/show/605-2017-%D1%80 (accessed on 20 August 2020).
- Energy Supply Based on Renewable Sources; State Statistics Service of Ukraine: Kyiv, Ukraine, 2019. Available online: http://www.ukrstat.gov.ua/operativ/operativ2016/sg/ekolog/ukr/esp_vg_u.htm (accessed on 2 August 2020).
- Bioenergy Association of Ukraine. Available online: https://uabio.org/en (accessed on 7 September 2020).
- Geletuha, G.G.; Zheliezna, T.A.; Dragniev, S.V. Analysis of Barriers in Production of Energy from Agrobiomass in Ukraine: Analytical Report; BAU: Kyiv, Ukraine, 2019; Volume 21, Available online: https://saf.org.ua/library/198 (accessed on 22 July 2020).
- Iqbal, Y.; Lewandowski, I.; Weinreich, A.; Wippel, B.; Pforte, B.; Hadai, O.; Tryboi, O.; Spöttle, M.; Peters, D. Maximising the Yield of Biomass from Residues of Agricultural Crops and Biomass from Forestry; Ecofys: Berlin, Germany, 2016; Available online: https://ec.europa.eu/energy/sites/ener/files/documents/Ecofys%20-%20Final_%20report_%20EC_max%20yield%20biomass%20residues%2020151214.pdf (accessed on 22 July 2020).
- Puri, M.; Rincon, L. Egypt, Turkey and Ukraine: Sustainable Bioenergy Options from Crop and Livestock Residues; FAO: Rome, Italy; EBRD Crop.: London, UK, 2017; Available online: http://www.fao.org/3/a-i8150e.pdf (accessed on 11 August 2020).
- Bioenergy in the Global Energy Context. GBEP: Global Bioenergy Partnership; FAO: Rome, Italy, 2007; Available online: http://www.fao.org/3/a1348e/a1348e02.pdf (accessed on 22 July 2020).
- Reid, W.V.; Ali, M.K.; Field, C.B. The future of bioenergy. Glob. Chang. Biol. 2019, 26, 274–286. [Google Scholar] [CrossRef] [PubMed]
- Dhanya, B.S.; Mishra, A.; Chandel, A.K.; Verma, M.L. Development of sustainable approaches for converting the organic waste to bioenergy. Sci. Total Environ. 2020, 723. [Google Scholar] [CrossRef] [PubMed]
- Kaltschmitt, M. Biomass as renewable source of energy, possible conversion routes. In Encyclopedia of Sustainability Science and Technology; Meyers, R.A., Ed.; Springer: New York, NY, USA, 2012. [Google Scholar] [CrossRef]
- Maltsoglou, I.; Koizumi, T.; Felix, E. The status of bioenergy development in developing countries. Glob. Food Secur. 2013, 2, 104–109. [Google Scholar] [CrossRef]
- DeCicco, J.M.; Schlesinger, W.H. Opinion: Reconsidering bioenergy given the urgency of climate protection. Proc. Natl. Acad. Sci. USA 2018, 115, 9642–9645. [Google Scholar] [CrossRef] [PubMed]
- How2Guide for Bioenergy; IEA: Paris, France; FAO: Rome, Italy, 2017; Available online: http://www.fao.org/3/a-i6683e.pdf (accessed on 6 August 2020).
- Fischer, G.; Schrattenholzer, L. Global bioenergy potentials through 2050. Biomass Bioenergy 2001, 20, 151–159. [Google Scholar] [CrossRef]
- Van Vuuren, D.P.; van Vliet, J.; Stehfest, E. Future bio-energy potential under various natural constraints. Energy Policy 2009, 37, 4220–4230. [Google Scholar] [CrossRef]
- Ladanai, S.; Vinterbäck, J. Global Potential of Sustainable Biomass for Energy; Sveriges Lantbruksuniversitet (SLU): Uppsala, Sweden, 2009; Available online: https://pub.epsilon.slu.se/4523/1/ladanai_et_al_100211.pdf (accessed on 22 July 2020).
- Kappas, M. Estimation of global bioenergy potentials and their contribution to the world’s future energy demand—A short review. In Sustainable Bioenergy Production—An Integrated Approach; Ruppert, H., Kappas, M., Ibendorf, J., Eds.; Springer: Dordrecht, The Netherlands, 2013. [Google Scholar] [CrossRef]
- Deng, Y.Y.; Koper, M.; Haigh, M.; Dornburg, V. Country-level assessment of long-term global bioenergy potential. Biomass Bioenergy 2015, 74, 253–267. [Google Scholar] [CrossRef]
- Usmani, R.A. Potential for energy and biofuel from biomass in India. Renew. Energy 2020, 155, 921–930. [Google Scholar] [CrossRef]
- Streimikiene, D.; Mikalauskiene, A.; Mikalauskas, I. Comparative assessment of sustainable energy development in the Czech Republic, Lithuania and Slovakia. J. Compet. 2016, 8, 31–41. [Google Scholar] [CrossRef]
- Gradziuk, P.; Gradziuk, B.; Trocewicz, A.; Jendrzejewski, B. Potential of straw for energy purposes in Poland—Forecasts based on trend and causal models. Energies 2020, 13, 5054. [Google Scholar] [CrossRef]
- Poppa, J.; Lakner, Z.; Harangi-Rákos, M.; Fári, M. The effect of bioenergy expansion: Food, energy, and environment. Renew. Sustain. Energy Rev. 2014, 32, 559–578. [Google Scholar] [CrossRef]
- Erb, K.H.; Haberl, H.; Plutzar, C. Dependency of global primary bioenergy crop potentials in 2050 on food systems, yields, biodiversity conservation and political stability. Energy Policy 2012, 47, 260–269. [Google Scholar] [CrossRef] [PubMed]
- Sarkodie, S.A.; Strezov, V.; Weldekidan, H.; Asamoah, E.F.; Owusu, P.A.; Doyi, I.N.Y. Environmental sustainability assessment using dynamic autoregressive-distributed lag simulations—Nexus between greenhouse gas emissions, biomass energy, food and economic growth. Sci. Total Environ. 2019, 668, 318–332. [Google Scholar] [CrossRef] [PubMed]
- Scarlat, N.; Martinov, M.; Dallemandet, J.-F. Assessment of the availability of agricultural crop residues in the European Union: Potential and limitations for bioenergy use. Waste Manag. 2010, 10, 1889–1897. [Google Scholar] [CrossRef]
- Rocha-Meneses, L.; Bergamo, T.F.; Kikas, T. Potential of cereal-based agricultural residues available for bioenergy production. Data Brief 2019, 23, 103829. [Google Scholar] [CrossRef]
- Muth, D.J., Jr.; Bryden, K.M.; Nelson, F.G. Sustainable agricultural residue removal for bioenergy: A spatially comprehensive US national assessment. Appl. Energy 2013, 102, 403–417. [Google Scholar] [CrossRef]
- Statistical Yearbook of Ukraine 2018; State Statistics Service of Ukraine: Kyiv, Ukraine, 2019. Available online: http://www.ukrstat.gov.ua/druk/publicat/kat_u/2019/zb/11/zb_yearbook_2018.pdf (accessed on 3 September 2020).
- Liashchenko, V.; Geletuha, G.; Dragniev, S.; Kucheruk, P.; Matvieyev, Y. Use of Biomass as A Fuel in the Municipal Sector of Ukraine: A Practical Guidebook; UNDP: Kyiv, Ukraine. Available online: http://bioenergy.in.ua/media/filer_public/f5/9c/f59c3f7f-8eca-4b6d-94cd-ffda1150f3ae/biofin.pdf (accessed on 15 August 2020).
- Dubrovin, V.O.; Golub, G.A.; Dragniev, S.V.; Geletuha, I.T.; Zhelieznaya, T.A.; Kucheruk, P.P.; Matveyev, Y.B.; Kudria, S.O.; Zabarnyi, G.M.; Masliukova, Z.V. Method of general evaluation of technically achievable biomass energy potential. Viol Print 2013, 25. [Google Scholar]
- Jiang, Y.; Havrysh, V.; Klymchuk, O.; Nitsenko, V.; Balezentis, T.; Streimikiene, D. Utilization of crop residue for power generation: The case of Ukraine. Sustainability 2019, 11, 7004. [Google Scholar] [CrossRef]
- Halchynska, Y.M. Development of biomass potential of by-products of agricultural crops in the agrarian sector of economy. Ekon. APK 2019, 5, 15–26. [Google Scholar] [CrossRef]
- Report on Energy Potential of Myrhorod Rayon and Assessment of Currently Available Calculation Methodologies. Institute of Local Development in Cooperation with USAID (Agreement AID-121-A-13-00002). 2013. Available online: http://myrgorod.pl.ua/files/images/Madem/2.pdf (accessed on 2 August 2020).
- Morozov, R.V.; Fedorchuk, Y.M. Assessment of bioenergy potential of crop residues and energy crops in agriculture of Khersonska oblast. Sci. J. Kherson State Univ. 2015, 10, 111–117. [Google Scholar]
- Bezuglyi, M.D.; Bulgakov, V.M.; Grynyk, I.V. Scientific-practical approaches to use of straw and crop residues. Her. Agrar. Sci. 2010, 3, 5–8. Available online: http://nbuv.gov.ua/j-pdf/vaan_2010_3_3.pdf (accessed on 5 August 2020).
- Dees, M.; Elbersen, B.; Fitzgerald, J.; Vis, M.; Anttila, P.; Forsell, N.; Ramirez-Almeyda, J.; Garcia, D.; Monti, A.; Glavonjic, B.; et al. Atlas with Regional Cost Supply Biomass Potentials for EU 28, Western Balkan Countries, Moldavia, Turkey and Ukraine; Project Report. S2BIOM—A Project Funded under the European Union 7th Framework Programme for Research. Grant Agreement No608622; Chair of Remote Sensing and Landscape Information Systems, Institute of Forest Sciences, University of Freiburg: Breisgau, Germany, 2017; Available online: http://s2biom.alterra.wur.nl/doc/S2Biom_D1_8_v1_1_FINAL_19_04_2017_CP.pdf (accessed on 4 September 2020).
- Walsh, M.E. Biomass Resource Assessment. In Reference Module in Earth Systems and Environmental Sciences; University of Tennessee: Knoxville, TN, USA, 2014. [Google Scholar] [CrossRef]
- Havlík, P.; Schneider, U.; Schmid, E.; Bőttcher, H.; Fritz, S.; Skalsky, R.; Aoki, K.; De Cara, S.; Kindermann, G.; Kraxner, F.; et al. Global land-use implications of first and second generation biofuel targets. Energy Policy 2011, 39, 5690–5702. [Google Scholar] [CrossRef]
- Bogonos, M.; Stepaniuk, O. Agrarian Perspectives of Ukraine 2017–2030; German-Ukrainian Agropolicy Dialogue, 2017. Available online: https://apd-ukraine.de/images/APD_APR_06-2017_AGMEMOD_Baseline_ukr.pdf (accessed on 4 August 2020).
- Grekov, V.O.; Datsko, L.V.; Zhylkin, V.A.; Maystrenko, M.I.; Datsko, M.O.; Melnyk, A.I.; Zinchuk, M.I.; Makarova, G.A.; Fandaliuk, A.V.; Kolodiy, N.M.; et al. Methodic recommendations on soil protection. State Sci. Technol. Cent. Soil Fertil. Prot. 2011, 107. [Google Scholar]
- Camia, A.; Robert, N.; Jonsson, R.; Pilli, R.; Garcia-Condado, S.; Lopez-Lozano, R.; vander Velde, M.; Ronzon, T.; Gurria, P.; M’Barek, R.; et al. Biomass Production, Supply, Uses and Flows in the European Union. First Results from an Integrated Assessment; Publications Office of the European Union: Luxembourg, 2018; Available online: https://publications.jrc.ec.europa.eu/repository/handle/JRC109869 (accessed on 5 August 2020).
- USAID. Evaluation of Current Energy Potential of Clean Energy Sources of Sumska Region. 2016. Available online: https://merp.org.ua/images/Docs/USAID_MERP_Sumy_Oblast_ASEpotential.pdf (accessed on 11 August 2020).
- Bezhenar, I.M. The state of specialization in agricultural business structures. Glob. Natl. Probl. Econ. 2016, 10, 128–133. Available online: http://global-national.in.ua/archive/10-2016/28.pdf (accessed on 2 September 2020).
- Tsyliuryk, O. Minimal Soil Cultivation and No-Till System. Agro Bus. Today. 2019. Available online: http://agro-business.com.ua/agro/ahronomiia-sohodni/item/12869-minimalnyi-obrobitok-hruntu-ta-systema-notill.html (accessed on 5 August 2020).
- Kravtsov, D. System of Zero Soil Tillage or “No-Till” Technology. Available online: https://uhbdp.org/ua/eco-technologies/articles/1865-systema-nulovoi-obrobky-gruntu-abo-no-till-tekhnolohiia (accessed on 29 July 2020).
- Peiretti, R.A.; Dumanski, J. The transformation of agriculture in Argentina through soil conservation. Int. Soil Water Conserv. Res. 2014, 2, 14–20. [Google Scholar] [CrossRef]
- Shao, Y.; Wang, J.; Preto, F.; Zhu, J.; Xu, C. Ash deposition in biomass combustion or co-firing for power/heat generation. Energies 2012, 5, 5171–5189. [Google Scholar] [CrossRef]
- State Service of Ukraine for Geodesy, Cartography and Cadastre. Available online: https://land.gov.ua (accessed on 1 September 2020).
- Use of Inorganic and Organic Fertilizers in 1990–2019. State Statistics Service of Ukraine. 2020. Available online: http://www.ukrstat.gov.ua/operativ/operativ2018/sg/vmod/vmod1990-2019_e.xls (accessed on 29 August 2020).
- National Report on the State of Soil Fertility in Ukraine. Ministry of Agrarian Policy of Ukraine. 2010. Available online: http://www.iogu.gov.ua/wp-content/uploads/2013/07/stan_gruntiv.pdf (accessed on 2 September 2020).
- Crop Production in Ukraine. State Statistics Service of Ukraine. 2019. Available online: http://www.ukrstat.gov.ua/druk/publicat/kat_u/2018/zb/04/zb_rosl2017pdf.zip (accessed on 7 September 2020).
- Ryabchenko, O.; Nonhebel, S. Assessing wheat production futures in the Ukraine. Outlook Agric. 2016, 45, 165–172. [Google Scholar] [CrossRef]
- Alexandratos, N.; Bruinsma, J. World Agriculture towards 2030/2050: The 2012 Revision; ESA Working Paper No 12-03; Food and Agriculture Organization (FAO): Rome, Italy, 2012. [Google Scholar]
- Global Yield Gap Atlas. Available online: http://www.yieldgap.org/web/guest/yieldgaps (accessed on 7 September 2020).
- Record Harvest of Cereals in 2018. BusinessViews. 2018. Available online: https://businessviews.com.ua/ru/economy/id/urozhaj-2018-1915 (accessed on 17 August 2020).
- The Harvest of Cereals Reached the Record 66 Million Tons in 2016. UKRINFORM. 2017. Available online: https://www.ukrinform.ua/rubric-economy/2157010-vrozaj-zernovih-u-2016-roci-sagnuv-rekordnih-66-miljoniv-tonn-minagro.html (accessed on 22 July 2020).
- Sobkevych, O.V.; Rusan, V.M.; Yurchenko, A.D.; Kovaliova, O.V.; Zhurakovska, L.A. Resource Potential of Agrarian Sector: Problems and Objectives for Efficient Utilization. National Institute for Strategic Studies, 2013. Available online: http://old2.niss.gov.ua/content/articles/files/Agro_sfera-cf5ec.pdf (accessed on 3 August 2020).
- Gielen, D.; Saygin, D.; Wagner, N. REmap 2030. Analysis for Ukraine. IRENA. 2015. Available online: http://banisaenergy.com/sites/default/files/remap-2030-analysis-for-ukraine-120315.pdf (accessed on 5 August 2020).
- Van de Graaf, T.; Colgan, J.D. Russian gas games or well-oiled conflict? Energy security and the 2014 Ukraine crisis. Energy Res. Soc. Sci. 2017, 24, 59–64. [Google Scholar] [CrossRef]
- Energy balance of Ukraine 2007–2018. State Statistics Service of Ukraine, 2019. Available online: http://www.ukrstat.gov.ua/operativ/operativ2012/energ/en_bal/arh_2012.htm (accessed on 29 July 2020).
- Sadik-Zada, E.R.; Loewenstein, W. Drivers of the CO2-Emissions in the fossil-fuel abundant settings: (pooled) mean group and nonparametric panel analyses. Energies 2020, 13, 3956. [Google Scholar] [CrossRef]
- Agriculture of Ukraine in 2018: Statistical Yearbook. State Statistics Service of Ukraine. 2019. Available online: http://www.ukrstat.gov.ua/druk/publicat/kat_u/2018/zb/09/zb_sg2017_pdf.pdf (accessed on 7 September 2020).
Publisher’s Note: MDPI stays neutral with regard to jurisdictional claims in published maps and institutional affiliations. |


© 2020 by the authors. Licensee MDPI, Basel, Switzerland. This article is an open access article distributed under the terms and conditions of the Creative Commons Attribution (CC BY) license (http://creativecommons.org/licenses/by/4.0/).