1. Introduction
A battery electric vehicle (BEV) powertrain typically consists of power subsystems, based on power electronics switches (e.g., insulated gate bipolar transistors (IGBT) and field effect transistors (FET) components). Furthermore, DC–DC and DC–AC bi-directional converters are integrated within the powertrain, which operate at high switching frequencies, in the order of tens of kHz [
1,
2,
3,
4]. The commonplace is that operating currents within these power converters contain harmonics. However, within the academic literature, little is reported about the impact of the current harmonics on battery lifetime.
Uno et al. [
5] investigated the qualitative impact of high-frequency cycling on the lifetime performance of lithium-ion (Li-ion) cells. The authors found that the capacity of cells cycled at frequencies below 10 Hz significantly deteriorated by circa 1.26% after 50 days of experimentation, whereas the capacity decay of cells cycled at higher frequencies were identical to the corresponding calendar degradation [
5].
In [
6], Bala et al. performed a short-term current ripple test, applied on lithium iron phosphate (LFP) batteries; based on the results, the superposition of a low frequency (120 Hz) ripple on the current creates only a slight difference in the cell temperatures. This is because of an increase in heat generation caused within the cells due to the additional current ripple magnitude.
Breucker et al. [
7] investigated the effect of the current ripple on the ageing performance of Li-ion batteries. Based on the test results, the current ripple does not appear to have a measurable long-term impact on the battery resistance and power [
7].
Prasad et al. [
8] studied an accelerated cycle life test of PHEV Li-ion battery cells for low frequency (120 Hz) ripple current superimposed on DC current. After 800 cycles, the sine charged battery capacity was reduced by 3.9%, while the DC charged battery capacity reduced by 4.2%. The sine charging was also shown to have 0.2% lower round-trip efficiency due to the higher RMS of the sine charging current [
8].
A recent study by Uddin et al. [
9] stands out as one of a few to observe the detrimental effect of a high-frequency current ripple on the aging of Li-ion cells. The authors found that higher frequencies caused accelerated capacity and power fade, and additionally that the spread in performance degradation was greater at higher frequencies.
Recently, Juang et al. [
10] performed an experiment with 0.8 Ah cells with LiCoO
2 cathodes and graphite anodes. Seven cells were cycled for 300 cycles each, using two separate experiments. The root mean square (RMS) value of the discharge current was found to have a statistically significant effect on the degradation rate of Li-ion cells. The results show that the internal resistance of the cells increased with the RMS current ripple magnitude. However, the frequency of the ripple did not have any effect; even the value of the DC magnitude was found not to be significant.
Soares et al. [
11] investigated the effect of real-world scenario current harmonics in a parallel hybrid vehicle commercial powertrain. It was also found that the magnitude of the most prominent harmonic could be approximated using a fitted, simple analytical expression which potentially could enable prediction of the resulting harmonic content for different driving cycles.
Another recent study by Brand et al. [
12] found at frequencies above 400Hz, no accelerated aging was evident, but below 55 Hz, observed after 50 cycles an accelerated aging by 1–2%.
A new research paper published recently by Bessman et al. [
13] studied the effect of different frequencies on aging in 28 Ah commercial nickel manganese cobalt oxide (NMC)/graphite prismatic Li-ion battery cells. The tested frequencies were 1 Hz, 100 Hz, and 1 kHz, all with a peak amplitude of 21 A. After completion of the test (circa 2000 cycles), about 80% of the initial capacity remained and no increase in resistance was observed. No capacity or power fade was observed in this study.
While some of the abovementioned studies indicated that AC ripple current has a negative impact to some degree on aging behavior of Li-ion cells, others have found the opposite. However, all of them have considered distinct frequencies, based on different sine signals, independently. This does not reflect the real-world scenario. In addition, limited attention was provided while selecting the amplitude of the superimposed AC signal, which represents a real-world scenario, as in a real-world situation the Li-ion battery of a BEV powertrain can be exposed to the single signal AC+DC waveform, which includes all unwanted frequencies. Thus, this paper investigates the impact of the real-world AC ripple waveform, which contain all unwanted harmonics in one ripple signal, on the Li-ion battery ageing performance.
This paper is structured as follows: The real-world situation current data measurements on the battery link of a battery electric vehicle are presented in
Section 2. The test platform and experimental set-up design details are explained in
Section 3. Within
Section 4, the ageing cycling test procedure that includes the characterisation method is presented. The experimental results, discussion and conclusions are presented in
Section 5,
Section 6 and
Section 7 respectively.
2. Real-World Situation Data Measurement
A powertrain architecture of a BEV is considered in this study; in BEV architecture, the battery system is electrically connected with the electrical machine through power electronics for the EV propulsion.
Figure 1 shows a simplified architecture of a BEV powertrain configuration (i.e., power electronics, battery and electric motor systems). For adapting the battery voltage to the DC bus voltage (in general high voltage), a bidirectional DC–DC converter is employed. For the torque and speed control of the electrical machine, a bidirectional DC–AC converter is employed, and the power is controlled for electric machine current regulation. The following research papers explain the operating principle of each subsystems in detail [
1,
2,
3,
4].
Its known that three phase AC electric machines (e.g., induction machine, permanent magnet synchronous motor) are the most commonly used for a BEV powertrain. The electrical machine is powered from a bidirectional converter, producing an AC current waveform at the output to supply the electric machine, using power switches (MOSFET or IGBT). It is well known that power electronics converters generate unwanted harmonics over a wide frequency range (i.e., high and low frequency), depending on the system topology and the control strategy of the converter. Within the BEV powertrain, a low-pass filter is commonly used to eliminate these harmonics. Unfortunately, it is almost impossible to eliminate them, only attenuate them. Within a BEV powertrain, the power electronics devices (i.e., IGBT) are modulated using a high switching frequency—within the range of 10–50 kHz. AC electrical machines used for BEV propulsion are also known to produce low-frequency harmonics, and these harmonics are present on the DC bus conducting through the power electronics devices. The machines generate both odd and even harmonics, but the predominance is odd harmonics.
For this research study, a real-world scenario battery current dataset was measured, for circa 100 s, based on both the steady and transient load profile, in order to analyse the battery current harmonics content (
Figure 2a,b).
For the purpose of data analysis and dataset bandwidth, the measured dataset was sampled at 10 kHz for the required resolution. To analyse the power spectrum of the current waveform for each frequency, and by using Welch’s algorithm [
14], the measured dataset was converted into the frequency domain. This will be a benefit for power electronics and power filter improvement, with future EV powertrains.
From power spectrum density analysis, based on Welch’s algorithm, five frequencies were highlighted, i.e., 0.25 mHz, 100 mHz, 1.95 kHz, 2.013 kHz and 4.025 kHz, related to noise power density ratio of 70, −2.3, −1.086, 14, and 11.73 dB/Hz, respectively (
Figure 2c). Fourier analysis highlights five frequencies, i.e., 59.94 Hz, 1.948 kHz, 2.008 kHz, 3.956 kHz and 4.026 kHz, with amplitudes of 0.7%, 1.9%, 0.5%, 1.2% and 0.5%, respectively, based on a nominal current value of 250 A (
Figure 2d).
3. Test Platform and Experimental Set-Up Design
3.1. Li-ion Test Cells Description
In the ageing study presented in this paper, six commercial 21,700 Li-ion cells were used. The capacity of the cells were 5 Ah, where the energy was 18.2 Wh, and the low internal resistance was around 25 mΩ. The charge and discharge cut off voltage were 4.2 and 2.5 V, respectively. The manufacturer recommended maximum continuous charge and discharge current rates were 0.7 and 1.3 Crate, respectively, at 25 °C.
3.2. Test Cycle Description
To undertake the research problem within the real-world condition, a scaled waveform of the AC ripple current, measured in real-world conditions, was used in this work, it includes all measured harmonics into one ripple signal. Two different cases were taken into account in this experimental study, based on two different excitation signals, for cycling the cells under study. These were:
- -
A DC signal () without harmonics to proceed as both the reference case and to emulate the model of Li-ion cell supply within a BEV test study.
- -
A DC signal (
) superposed by an AC ripple signal based on all harmonics frequency (
), as the real-world scenario battery current waveform (
), with the same shape (see
Figure 2b—Equations (1) and (2)), and scaled magnitude (e.g., for
f = 3.9 kHz, the
IAC = 0.012 p.u, see
Section 2).
where
is the magnitude of the DC current (A), is the magnitude of the ith harmonics of the ripple signal (A), is the frequency of the ith harmonics of the ripple signal (Hz), is the time (s), and is the phase of ith harmonics of the ripple signal (rad).
Three cells were tested at the same time for each case to validate the robustness of the obtained results and the test method, and the efficacy of the conclusions made, so six cells in total were tested. The cells were cycled with 90% DOD for both test cases. They were discharged using DC component of 1 C
cycle (where C
cycle is the de-rated battery C-rate defined after each characterisation test, initial value is defined as 5A) from 95% state of charge (SOC)
cycle to 5% SOC
cycle based on the standard constant current (CC)—constant voltage (CV) strategy (CCCV). Following a rest period of 20 min, each cell was then charged using the CCCV strategy. The cells were charged with a DC rate of 0.7 C
cycle from 5% SOC
cycle until 95% SOC
cycle was reached using the Coulomb counting strategy. The test signal is summarised in
Table 1.
It is noteworthy that current magnitudes defined in the
Section 2 are expressed relative to the de-rated capacity of each cell (C
cycle), the value of which was repeatedly measured at ageing characterisation points after 50, 100, 150, 200, 250 and 300 complete charge—discharge cycles. Using C
cycle accounts for the capacity fade during the test and ensures that the safe operating limits expressed by the manufacturer are adhered to. An example illustration of the current profile used to cycle the cells is shown in
Figure 3. The total time to complete one charge–discharge cycle is approximately 171 min.
3.3. Experimental Test Rig Description
Figure 4 shows the experimental test rig configuration. It was based on seven main components:
Power amplifier (with associated monitoring and control system) to generate the AC ripple waveform, it based on AETECHRON (Model 7228),
Maccor cell cycler to generate the DC load profile,
dSPACE MicroAutobox II equipment, to control power amplifier and log current probe measurement,
Current probe, to measure superposed current (i.e., DC+AC),
Cells under test, to perform ageing test,
AC coupling capacitance, to connect the power amplifier output and the cells,
Thermal management rig, to maintain the ambient temperature at it desired value (i.e., 25 °C), it based on LAUDA (Model Proline RP845C).
The specifications/requirements, resolution, accuracy and quantity requirements for the main component of the test-rig are drawn in
Table 2.
The main function of the test-rig is to supply each cell separately, using a defined DC cycle profile and a superposed AC ripple current waveform for each cell. It is mandatory to choose a robust precision very low-noise power amplifier for this study, since the main purpose of this research is to study the impact of the current ripple on the ageing of Li-ion cells. The main characteristics of the test-rig are discussed below:
The battery cycler (both positive and negative terminals) were directly connected to the cells under test, to provide the DC current profile, while the power amplifier was capacitively coupled to the cells under experiment, as illustrated in
Figure 4.
The power amplifier used was a high precision, voltage controlled AC current source, manufactured to ensure a total harmonic distortion of less than 0.1 from DC to 30 kHz—it provided a small signal frequency response gain of +0 to −1.0 dB from DC to the bandwidth frequency of 400 kHz.
The Hall effect current probes were connected to the positive terminal of the cells to measure the DC waveform superposed to the AC ripple component. The AC ripple current was applied during charging and discharging operations and it was turned off during rest time, using the control system within the MicroAutobox II. The current ripple magnitude and frequency supplied to the cells under test when measured at intervals over the period of the test was stable to within the ±1% of the amplitude and 10−6% of the frequency.
The cycling (charge–discharge process) profile to supply the cells under experiment used a DC waveform at a desired Crate and was ensured through the cycler control software. The cycler unit provided data logging (current and voltage) at a sample rate of 10 Hz with a 16-bit measurement resolution of current and voltage (1.5 mA and 76 µV respectively).
A cooling system based on a LAUDA (Proline RP845C) unit was used for radial surface cell temperature control during the test, by embedding the cells into a dielectric oil (Kyr 51). The oil-cooled temperature into box was stable at 25 ± 0.5 °C.
4. Ageing Cycling Test Procedure
The cells (six in total) are referenced by an ID number 1 to 6. Cells 1–3 were cycled using a DC power signal, by using only the cycler. Cells 4–6 were cycled using DC superposed by an AC current ripple (see
Figure 3). The result from cells 1–3 are used as reference to quantify the impact of the AC ripple on the cell degradation (cells 4–6). To track the degradation, a characterization test was performed on the cells at the beginning of the experiment. Then cycling using DC and DC+AC signal was started. After every 50 cycles, the characterization test was repeated. Before the 300 cycles were completed (
Figure 5). The characterization test procedure is explained below:
Characterisation Procedure
The characterization test is a collection of three key tests, i.e., capacity test, hybrid pulse power test (HPPT) and electrochemical impedance spectroscopy (EIS) test. The test conditions are explained below:
- (1)
The retained capacity measurement test was performed under different fully discharged current rates (i.e., 0.1, 1, 2 and 3 Crate), with 1 h rest time. The test was performed at an ambient temperature of 25 °C, and it took circa 2 days to complete the test,
- (2)
A HPPT was then performed. The test was performed under two current pulse Crates, (i.e., 4 and 2 Crate), with 1 h rest time. Two SOC levels (i.e., 80% and 20%) were performed for this test. This test was performed at an ambient temperature of 25 °C, and it took circa half a day of testing,
- (3)
An EIS test was performed under different frequencies (from 0.01 Hz to 10 kHz) at two SOC levels (i.e., 80% and 20%). This test was performed at an ambient temperature of 25 °C; it took circa 1 day of testing.
- (4)
The cycling and characterization tests were performed at an ambient temperature of 25 °C.
5. Experimentation Results
5.1. Capacity Measurement Test Results
Figure 6 present the capacity degradation in % and the energy degradation in % as a function of cycle number and the total energy throughput in Wh. The capacity and energy of each cell were normalized against the initial capacity and energy, respectively, before beginning the experiment, to remove cell-to-cell variation. After circa 150 cycles, all cells lost an average of 20% of their original capacity in Ah, and energy in Wh. From 150 cycle or 4200 Wh energy throughput, cell degradation is accelerated, as can be seen in
Figure 6a. As charge–discharge was performed, using de-rated C-rate, every cycle was done with a smaller amount of energy throughput, which can be seen from
Figure 6b. At 250 cycles, a significant difference in capacity can been seen—an average 38% of difference between cells 2 and 4 (at 22% of retained capacity) and cells 1, 3 and 5 (circa 60% of retained capacity). All cells lost circa 82% of capacity after having been cycled 300 times, which is equivalent to 5576 Wh for cells 2 and 4, 6810 Wh for cells 1, 3 and 5, and 6073 Wh for cell 6.
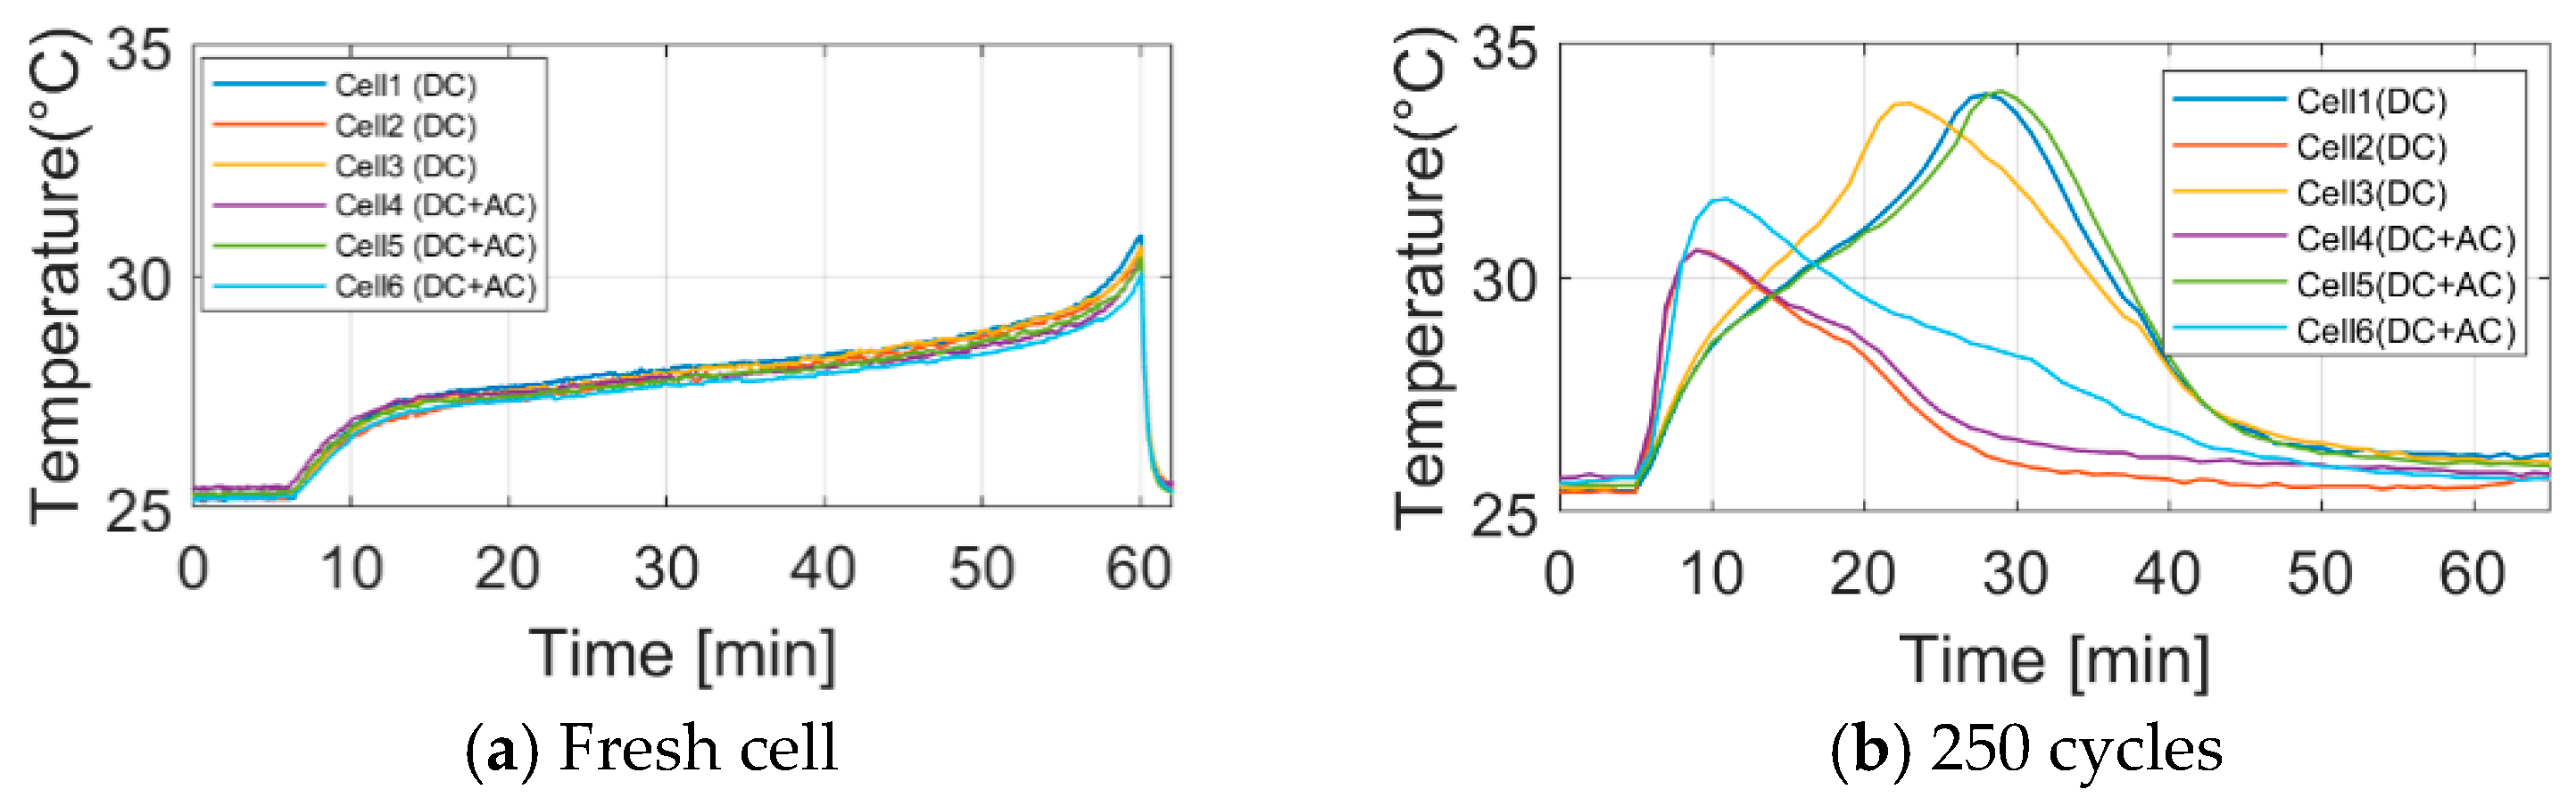
Figure 7 shows the difference in surface temperature, for all cells (i.e., cells 1–3 for DC set group) compared to cells 4–6, which were cycled through AC ripple waveform. Notice, after 250 cycles, the cells could only be discharged for around 35 min. The temperature rise (after 250 cycles) at the end of discharge (35 min) was 34 °C for cells 1, 3 and 5, and circa 31 °C for cells 2 and 4, while cell 6 had a peak of temperature of 32.5 °C. This was much higher compared to fresh cells, for which by the end of the 35 min discharge the temperature was 34 °C, and by end of complete discharge (55 min) it was only 31 °C. This indicates a significant rise in internal resistance, which contributed to the Ohmic heat loss. However, a discrepancy can been seen between the temperature rise pattern of cells 1, 3 and 5 and cells 2,4 and 6 due to the discrepancy in the capacity degradation evolution, whether at the beginning, or after 300 cycles. This observation indicates a similar internal resistance degradation for both cases (i.e., set of cells 1 and 5, and set of cells 2 and 4), and the degradation mechanisms might be the same.
5.2. HPPT Results
Figure 8 depicts the total DC resistance evolution versus the number of cycles and energy throughput. The resistance was measured from the voltage drop at the end of the 10 sec pulse current, performed as part of HPPT. The resistance measurement was carried out at 80% and 20% SOC. Following the similar trend of capacity degradation, a sharp rise in resistance was observed beyond the 150 cycle/4200 Wh energy throughput. The average cell resistances at 80% and 20% SOC were 32.1 mΩ and 34.6 mΩ, respectively, which increased to 94 mΩ and 110 mΩ, respectively, after 300 cycles. A three-fold resistance growth was observed. However, no significant differences between the cells with and without superimposed AC signal were observed. This indicates little impact of the AC ripple current on DC resistance growth.
5.3. EIS Test Results
During the initial characterization test, an EIS measurement test was performed for all fresh cells (six cells).
Figure 9a,d shows the impedance spectrums of every new cell at 80% and 20% SOC, and the comparison between cells 1 and 5 is shown in
Figure 9b,c and
Figure 9e,f at 80% and 20% SOC, respectively. From the primary observation, no significant difference between the cells can be seen. The change in impedance spectrum for cell 1 (DC only) and cell 5 (DC+AC) with ageing after 250 cycles is shown in
Figure 9c,f for both 80% and 20% SOC, respectively. It can be seen that the semicircles shift to the right and the shape changes with degradation. The shift along the
x-axis indicates a change in pure Ohmic resistance, whereas the change in the shape of the semicircle mainly indicate a change in the double layer capacitance, change transfer resistance and solid electrolyte interphase (SEI) layer, further explained in [
15].
An horizontal shift in the EIS plots has been shown between cell 1 and cell 5, of circa 0.9 mΩ and 0.5 mΩ at 80% and 20% SOC, respectively. This small difference is negligible, because the difference in resistance measured falls within the 0.35 standard deviation of the initial values, when the cells were fresh before testing.
As shown in
Figure 10, the Bode representation confirms that there is negligible effect of the AC ripple on the cells. The magnitude and phase angles of both the fresh and aged cells do not show any variation between the frequencies of 10
−2 to 10
4 Hz, except for high frequencies due to the measurement noise.
The Ohmic resistance
R0 is measured when the imaginary part of impedance
Im(Z(f)) equals zero, and the transfer resistance
Rt, is measured where the negative imaginary part has its local minimum. Its value corresponds to the sum of
R0 and
Rct, where
Rct is the charge transfer resistance. The Ohmic resistance
R0, charge-transfer resistance
Rct, and total resistance
Rt (≡
R0 +
Rct) numerical values, obtained from the EIS test, at 80% of SOC, for all cells (six cells), are summarised in
Table 3. Again, the results indicate that, whether or not there is presence of an AC ripple current, there is no apparent difference in the degradation, measured through Ohmic (
R0) and charge-transfer (
Rct) resistances.
Further work is ongoing to ascertain the cause of the cell failure through appropriate post-mortem analysis and X-ray computerized tomography (CT) scan procedures.
6. Discussion
The obtained results from the characterization tests, i.e., retained capacity measurement (
Figure 6), retained power measurement (
Figure 8), and impedance spectrum measurements (
Figure 9 and
Figure 10) suggest that there is little impact of the presence of AC ripple current on degradation. The identification of the key degradation mechanisms cannot be achieved without autopsy and in situ measurements; however, the key degradation mechanisms are likely to be the loss of cycleable lithium.
Previously, it was shown that the high frequency AC ripple current could contribute to the growth of the surface film (i.e., SEI layer) [
16]. However, the same conclusion cannot be made based on the results presented here. This is likely to be related to the amplitude of the AC ripple current. If the AC ripple current led to activating a particular degradation mechanism e.g., SEI growth, then it is likely to accelerate with the increased amplitude. In this study, the AC ripple current amplitude employed was relatively lower than the values used in previous studies, however the values represented the real-world scenario, which was measured as part of this study.
Another aspect of this study focused on if the AC ripple current contributed to degradation; this might have been too small to measure within the measurement accuracy. Otherwise, the degradation by the DC signal was too high, such that that the ratio of the degradation from the DC and AC signal was too high to distinguish the AC contributions. There is a strong possibility of such mechanisms happening. The cell cycle life test done be the manufacturer with 0.33 C charge-discharge, between 100% and 0% SOC, at 25 °C, reported less than 20% capacity degradation. In comparison, in this study, a higher charge (0.7 C) and discharge (1 C) were used. This likely accelerated the ageing mechanisms, therefore the cells without any superimposed AC ripple current lost around 20% capacity after 150 cycles. This fold accelerated degradation of the cells might have suppressed the degradation contribution from the AC ripple current. This hypothesis can only be confirmed through autopsy and in situ measurement of the electrodes, which the authors plan to perform in the future.
7. Conclusions
In this paper, for the first time, the long-term impact of a real-world AC ripple current profile on lithium-ion cell degradation has been studied. In contrast to the previous studies, this research employed a real-world profile and an amplitude of the ripple current representing real-world values. Six cells in total were cycled, three cycled using DC current, and three were cycled using DC + AC ripple current. The results show minimal impact of AC ripple current on degradation, based on both capacity fade and impedance rise. These results contrast with current knowledge regarding the impact of AC current on battery degradation. After 300 full charge–discharge cycles, the average retained capacity of the cells, for both cases, was circa 17%, and the average rise in impedance was circa 300% for both cases. However, at this stage, the underlying causality between AC ripple and the cell degradation performance still cannot be confirmed. Defining this causality is the focus of ongoing research within the university, by extending the experimental study for different cell variants and chemistry (LTO, Mixed oxide, NCM, … etc., for cylindrical and pouch format) using different cells capacities (i.e., 2.2, 3.4, 13, 17.5 and 40 Ah), to identify/clarify the ability to transfer the obtained results to other cell chemistries, and also integrating a real-world driving cycle scenario within the ageing experiment, to try to be close to the real-world application.


