1. Introduction
In recent years, with the development and application of large-scale renewable energy sources, the stability of power system operation has become an active research topic. Renewable energy sources exhibit stochasticity and intermittency, which strongly affect the stable operation of power grids, particularly in terms of frequency fluctuation. Therefore, it is important to develop effective control strategies for power system load frequency to realize the large-scale grid connection of renewable energy sources [
1].
Proportional-Integral (PI) control [
2], adaptive control [
3], and optimal control [
4] are widely used in power systems. All of these are types of single subject control. However, the frequency control of multi-area power systems is a type of coordination control, and there are various electrical connections among areas. Owing to the various electrical relationships between the areas, the areas interact and influence each other during the process of regulation. If interaction and coordination are not considered in the formulation of control strategies, the control performance may not reach the expected value and may even decline. Therefore, dynamic coordination control among multiple subjects in power systems is important for maintaining the stable operation of power grids.
Differential games [
5] theory is a new method of solving the coordinated control problem. It has been applied in the fields of economics, ecology, engineering, etc. [
6]. Differential games theory can be viewed as the combination of game theory and optimal control theory, but it is more versatile than the latter two [
7]. In a dynamic game in which multiple participants participate, differential games theory is used to determine every participant’s optimal control strategy. This control strategy relies on the individual performance indicators of each participant, the intention of cooperation between participants, and the system information that participants can receive. When each participant uses the optimal control strategy, the outcome of the game finally reaches equilibrium. In recent years, differential games theory has been introduced in power system research [
8,
9]. In [
10], a novel framework based on the principles of differential games is proposed to analyze smart grid security. In [
11], differential games are applied in power systems to solve the problem of coordination between primary and secondary frequency control. In [
12], linear quadratic differential games theory is applied in the load frequency control (LFC) of an islanded microgrid system.
However, it is difficult to solve the differential game problem with constraints using the conventional algorithm, and the simulation models established by the existing research are all linear, which is not conducive to practical engineering application. To solve the above problem, a multi-area frequency cooperative control model with a governor dead zone, a control action amplitude limit, and a unit climbing rate constraint is established in this study. The feedback Nash equilibrium problem is solved using a co-evolutionary algorithm based on the improved weighted fruit fly optimization algorithm (IWFOA) to obtain the feedback control strategy of each unit.
To prove the effectiveness, stability, superiority, and fairness of the proposed algorithm, we analyze its performance on Matlab/Simulink. The results show that the control strategy can achieve system control targets, and fully utilize the various characteristics of each generator to balance the interests of different areas. Compared with a co-evolutionary genetic algorithm and a collaborative multi-objective particle swarm optimization algorithm, the co-evolutionary algorithm based on the IWFOA has a better suppression effect on the frequency deviation and tie-line power deviation caused by the disturbance and has a shorter adjustment time.
The remainder of this paper is organized as follows. In
Section 2, we describe the small-disturbance model of a three-area interconnected system with complex constraints and formulate the LFC problem as a linear quadratic differential game. In
Section 3, we propose the IWFOA based on the fruit fly optimization algorithm (FOA). In
Section 4, we propose a co-evolutionary algorithm based on the IWFOA to solve the multi-area frequency cooperative control problem with constraints. Simulation results are provided in
Section 5, and the paper is concluded in
Section 6.
2. System Model
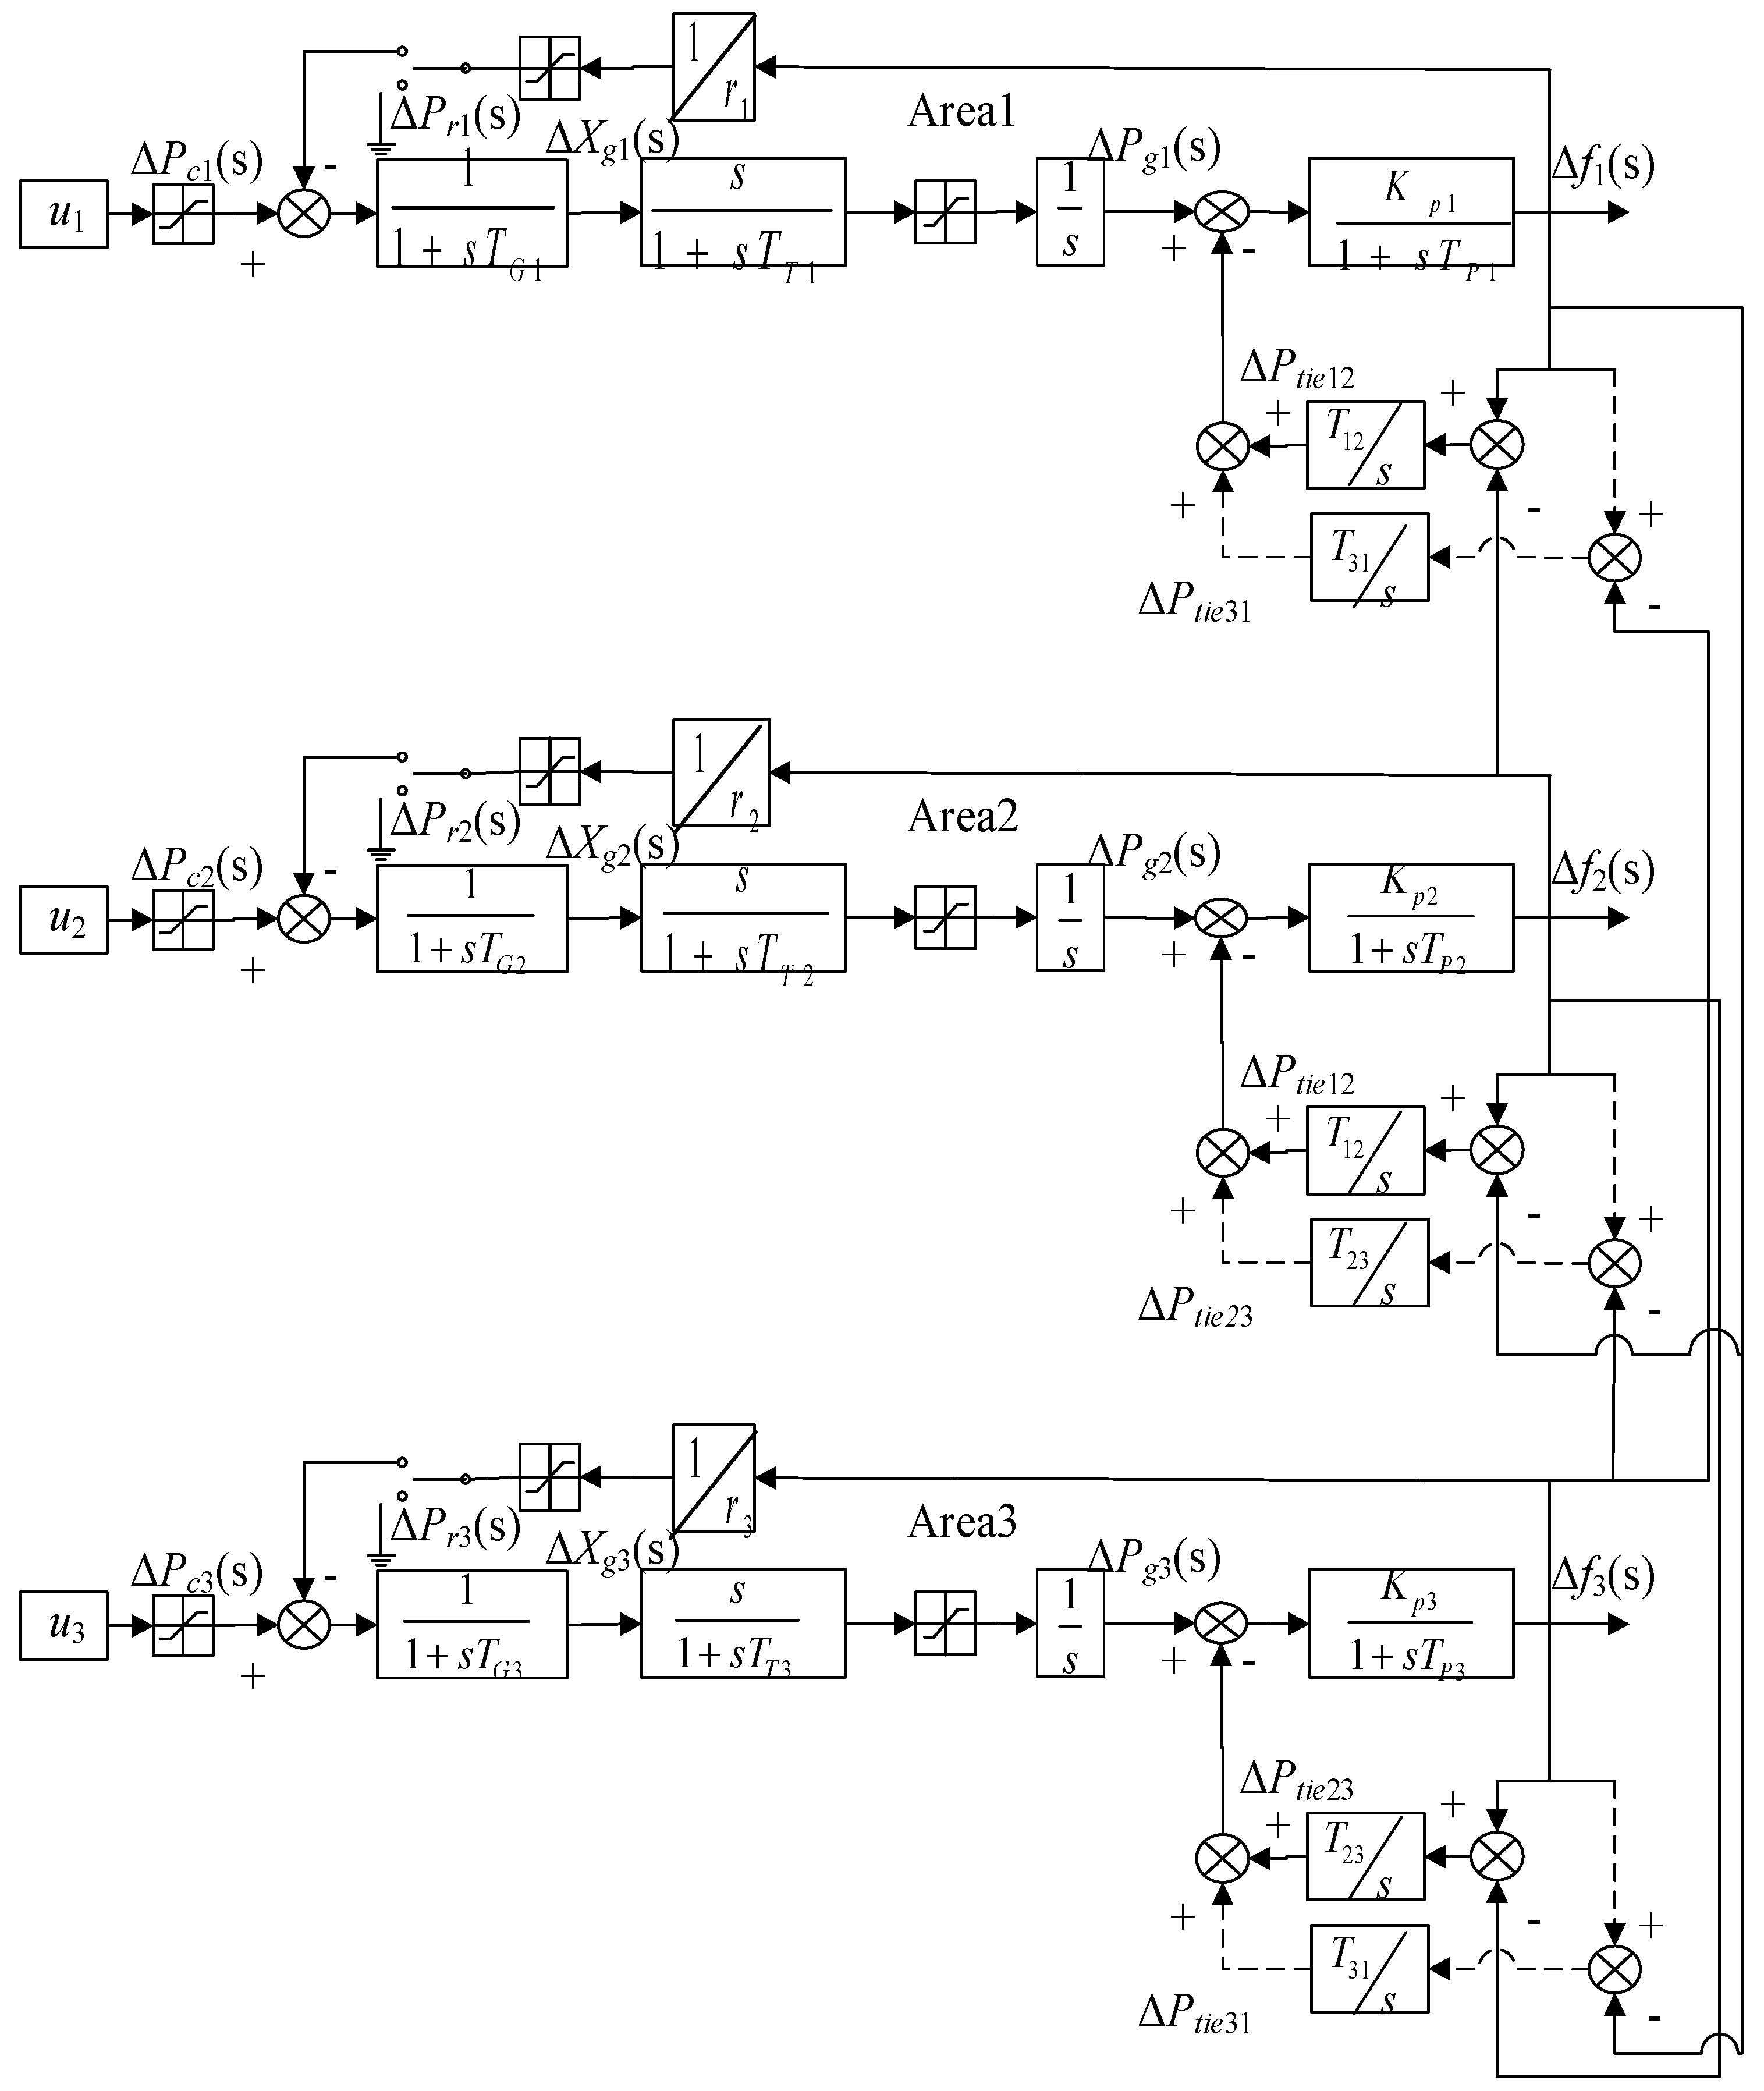
The small-disturbance model of a three-area interconnected system [
13] with complex constraints is shown in
Figure 1. The controller set of each area is regarded as an independent participant in the game, and the frequency modulation index of the area is optimized independently. Let
u1,
u2, and
u3 be the secondary frequency modulation control quantities. The following linear model describes the system dynamics:
A, Bi, and Λ are the system state matrix, input matrix, and interference matrix, respectively. x, ui, and ΔPL are the state variables, control volume, and load disturbance, respectively,
Subscript i represents the ith control area (CA), Δfi, ΔPci, ΔXgi, ΔPgi, ΔPtieij are the deviation of frequency, requested generator output, valve position, generator mechanical output and tie-line power, respectively; TGi, TTi, TPi, KPi, Tij, ri are the time constant of the governor, the time constant of the turbine, the electric system time constant, the electric system gain, the tie-line synchronizing coefficient, and the speed drop, respectively.
Considering the intermittent energy in the system, the power perturbation ΔPLi consists of the perturbations of loads and intermittent energy output. We assume that ΔPLi is a known step perturbation during the control period, and it is obtained using a short-term forecasting technology.
Each participant desires to minimize its own quadratic performance index, i.e., the cost function. In this paper, we adopt the following cost function for simplicity:
where
t0 is the start time of gaming,
tf is the end time of gaming,
Qi is a 12 × 12 positive definite weight matrix that determines the penalty associated with frequency error and tie-line power error, and
Ri is a 1 × 1 positive definite weight matrix that represents control costs. By setting
Qi and
Ri, each CA specifies the manner in which it wants its LFC units to perform.
To eliminate the disturbance term, ΛΔ
PL, we employ the method proposed in [
14] by redefining the state, control, and disturbance vectors using their final steady-state values.
where
xss(t),
uss(t), and Δ
PssL(t) are the steady-state values of
x(t),
u(t), and Δ
PL(t), respectively.
With the same
A,
Bi, Λ,
Qi, and
Ri, the cooperative control for the three-area LFC takes the following form:
The objective of each CA is to minimize its own payoff function in (6) by choosing its appropriate control ui. This game-theoretic model will be referred to as Γ(x(t0),t0).
The feedback Nash equilibrium solution (NES
fb) [
15] is a non-cooperative scheme, where the CAs pursue their respective payoffs without any collaboration. NES
fb is a control strategy
with the property that:
where
ui(
t) is a permissible control for the
ith CA in the strategy space
Ui,
is the payoff of the
ith CA over the period [
τ,∞) under the control input
, and
x(
τ) is any reachable system state.
In other words, NESfb is not only an equilibrium for Γ(x(t0),t0), but also an equilibrium for all truncated games Γ(x(τ),τ) with arbitrary τ and x(τ) and is, therefore, strongly time consistent.
When various complex constraints in the system are not considered, NES
fb can be obtained from the Hamilton–Jacobi equation in (6), as follows:
where
Pi is the non-negative definite symmetric matrix solution of the algebraic Riccati matrix equation, and
Ki is the linear feedback coefficient.
The detailed derivation of the conventional algorithm of differential game problems can be found in [
15].
The above controllers can obtain the optimal control effect close to the operating point of the system. However, for actual systems, the controller frequently cannot reach the expected control target owing to the influence of various non-linear constraints. Common non-linear constraints are as follows [
16]:
The constraint on the control signal rate of secondary frequency modulation can be expressed as:
After considering the dead zone of the governor in primary frequency modulation, the control signal rate is:
The slope climbing rate of a unit is the variation in unit output in unit time. As this paper considers a continuous system, the slope climbing rate of a unit is approximately expressed by the derivative of unit output. The constraint is:
where
i = 1, 2, 3.
The solution of differential games involves the problem of differential equations. The system is non-linear when it considers all kinds of complex constraints, and it is difficult to solve the non-linear differential game model using conventional algorithms. Therefore, this paper proposes a co-evolutionary algorithm based on the IWFOA to solve the non-linear differential game model. This is described in detail in the next chapter.
3. Improved Weighted Fruit Fly Optimization Algorithm
FOA [
17] is a global optimization algorithm that evolved from the sensitive sense of smell and vision of fruit flies. Compared with the conventional optimization algorithms, FOA is simpler, requires fewer adjustment parameters, and shows faster convergence. However, the conventional FOA can fall into a local optimum, which is not conducive to practical engineering application. Therefore, this paper proposes the IWFOA. The IWFOA is as follows:
(1) In real life, a fruit fly looks for food in a three-dimensional space. However, the conventional FOA only considers the motion state of flies on a plane. This reduces the convergence accuracy and convergence speed of the FOA. Therefore, variable
Zaxis is added to create a three-dimensional coordinate system. It is assumed that the maximum number of iterations is
Maxgen and the population size is
Sizepop. Coordinates
Xaxis,
Yaxis, and
Zaxis are randomly assigned in the initial state of the fruit fly population, as defined below.
(2) When each fruit fly in the population uses its sense of smell to search, it is given a random flight direction and distance. Weighted factor
ω is introduced into the formula for updating position to increase the diversity of the population and prevent the FOA from falling into a local optimum. The new position of fruit fly individual
i is given by the following formula:
In the iterative optimization process, a large value of
ω is required in the early stage so that the individual search area range becomes larger and the corresponding global search ability becomes stronger. A smaller value of
ω is required in the later stage of iterations so that the search area range close to the optimal solution becomes smaller and the corresponding local search ability becomes stronger.
where
g is the current iteration number,
Maxgen is the maximum number of iterations,
ωmax is the maximum weighted factor, and
ωmin is the minimum weighted factor.
(3) The location distance,
Di, of each individual in the fruit fly population is calculated as follows:
Si is the judgment value of taste concentration, and it is the inverse of
Di.
As Di > 0, Si > 0; thus, Si can only be approximated to the right of 0. However, in practical problems, Si may be negative.
(4) The flavor concentration,
Smelli, of each individual in the current population is calculated as:
(5) The individual fruit fly with the best taste concentration in the current population is selected, and its taste concentration and corresponding location are recorded.
(6) The best taste concentration value and the corresponding location information of the individual fruit fly are maintained. The other fruit flies in the population fly to this location using vision and use the location as the starting point for the next iteration.
(7) The iterative search is started, and steps (2)–(5) are repeated to determine whether the new taste concentration is better than the historical taste concentration. If it is better, step (6) is repeated; otherwise, the iterations are continued until the number of iterations reaches Maxgen.
4. Controller Design
4.1. Improved Euler Method for Solving Differential Equations
A given time interval, [0,
tf], is divided into
m equal parts. 0 =
t0 <
t1 <
t2…<
tk <…<
tm =
tf is the time node. The length of each cell is set, that is, the step size is
h, and
xk =
x(
tk). The numerical solution of system (6) based on the improved Euler method is [
18]:
4.2. Co-Evolutionary Algorithm Based on the Improved Weighted Fruit Fly Optimization Algorithm (IWFOA)
In practical engineering, state variables and control variables are frequently constrained, and it is difficult to solve differential game problems with constraints using conventional algorithms. In this study, a co-evolutionary algorithm based on the IWFOA is used to solve the feedback Nash equilibrium problem for non-linear systems with constraints. The specific process of the algorithm is described below.
The multi-area interconnected control system shown in
Figure 1 is considered as an example. Each CA is a game participant. Assuming that all game participants can observe the state of the system, it can be seen from Equation (7) that the feedback Nash equilibrium control strategy of differential games is in the form of a linear combination. Each participant considers the linear feedback coefficient,
k, of the state variable as the variable, that is, the strategy of participant
i is
ki (
i = 1, 2,…,
n).
Suppose that each participant evolves under the cooperative mechanism. The system state equation given by Equation (1) is the hub that connects various participants. The payment function, Ji, of participant i expressed in Equation (2) is considered as the evaluation function of individual fitness. Considering participant i as an example, the strategies corresponding to the other participants, -i, are formed into a representative strategy set, k-ibest, which is expressed as follows: k-ibest = {k1best ...ki-1best, ki+1best, knbest}.
Step 1: Initializing parameters and the representative strategy of other participants. It is assumed that the number of iterations is L and the number of participants is n.
Step 2: The IWFOA is used to optimize the state variable feedback coefficient, ki, of participant i. The corresponding strategy, ki, of an individual fruit fly and the representative strategy set, k-ibest(L), of other participants are substituted into Equation (1), which is solved using the improved Euler method (21), and the solution result is judged by constraints (9)–(11). The payment function, Ji, of participant i is set as the fitness of an individual fruit fly. kibest(L), the individual with the highest fitness, is set as the representative strategy of participant i.
Step 3: Steps 2 is repeated until i = n.
Step 4: L = L + 1;
Step 5: If L ≥ 100, the calculation is over and the results are output, otherwise repeat steps 2–4.
The flow chart of co-evolutionary algorithm based on the IWFOA is shown in
Figure 2.
5. Simulation Results and Discussion
Case studies are carried out based on the three-area LFC system shown in
Figure 1. The parameters of the three areas have the same values, which are listed in
Table 1. The tie-line synchronizing coefficients,
T31 and
T23, are considerably smaller than
T12. This indicates that the third CA is weakly connected to the first and second CAs. The forecast of Δ
PLi is given, which indicates that Δ
PL1 and Δ
PL3 remain zero throughout the control period, while a step perturbation, Δ
PL2 = 0.2 pu, occurs in the second CA starting at
t0 = 0.
It is assumed that most perturbations that occur in the second CA are more frequent compared to the other two areas. This implies that the second CA receives power support from the other areas. Hence, the first and third CAs are concerned with the restriction of frequency error and tie-line power error, while the second CA only considers frequency error because it requires tie-line power support. Accordingly, we set Q1 (1,1) = Q1 (10,10) = Q1 (12,12) = Q2 (4,4) = Q3 (7,7) = Q3 (11,11) = Q3 (12,12) = 1, and the other elements of the three metrics are zero. The control cost penalty metrics are set as R1 = 5, R2 = 10, and R3 = 5.
5.1. Differential Game Control without Complex Constraints
For the model shown in
Figure 1, the following two algorithms are adopted to solve the differential game control problem without complex constraints:
Scheme 1: Conventional algorithm [
15]
Scheme 2: Co-evolutionary algorithm based on the IWFOA
The simulation results of schemes 1 and 2 are shown in
Figure 3. Even though there is a small discrepancy between the results, the performance indexes of the schemes are considerably close. The control strategies obtained based on the two schemes have similar control effects. This verifies the effectiveness of scheme 2.
5.2. Differential Game Control with Complex Constraints
The dead zone of the governor, the limit of control action amplitude, and the climbing speed of the unit are considered for the three-area interconnected system. The constraints are shown in
Table 2.
Owing to the complex constraints, it is difficult to find the feedback Nash equilibrium solution of the differential game problem by utilizing conventional algorithms. An artificial intelligence algorithm, especially co-evolutionary algorithm, is a new method for solving non-linear differential game problems. In order to show the superiority of the proposed algorithm, the following three different co-evolutionary algorithms are analyzed in this paper:
Scheme 1: Co-evolutionary genetic algorithm [
16]
Scheme 2: Collaborative multi-objective particle swarm optimization algorithm [
19]
Scheme 3: Co-evolutionary algorithm based on the IWFOA
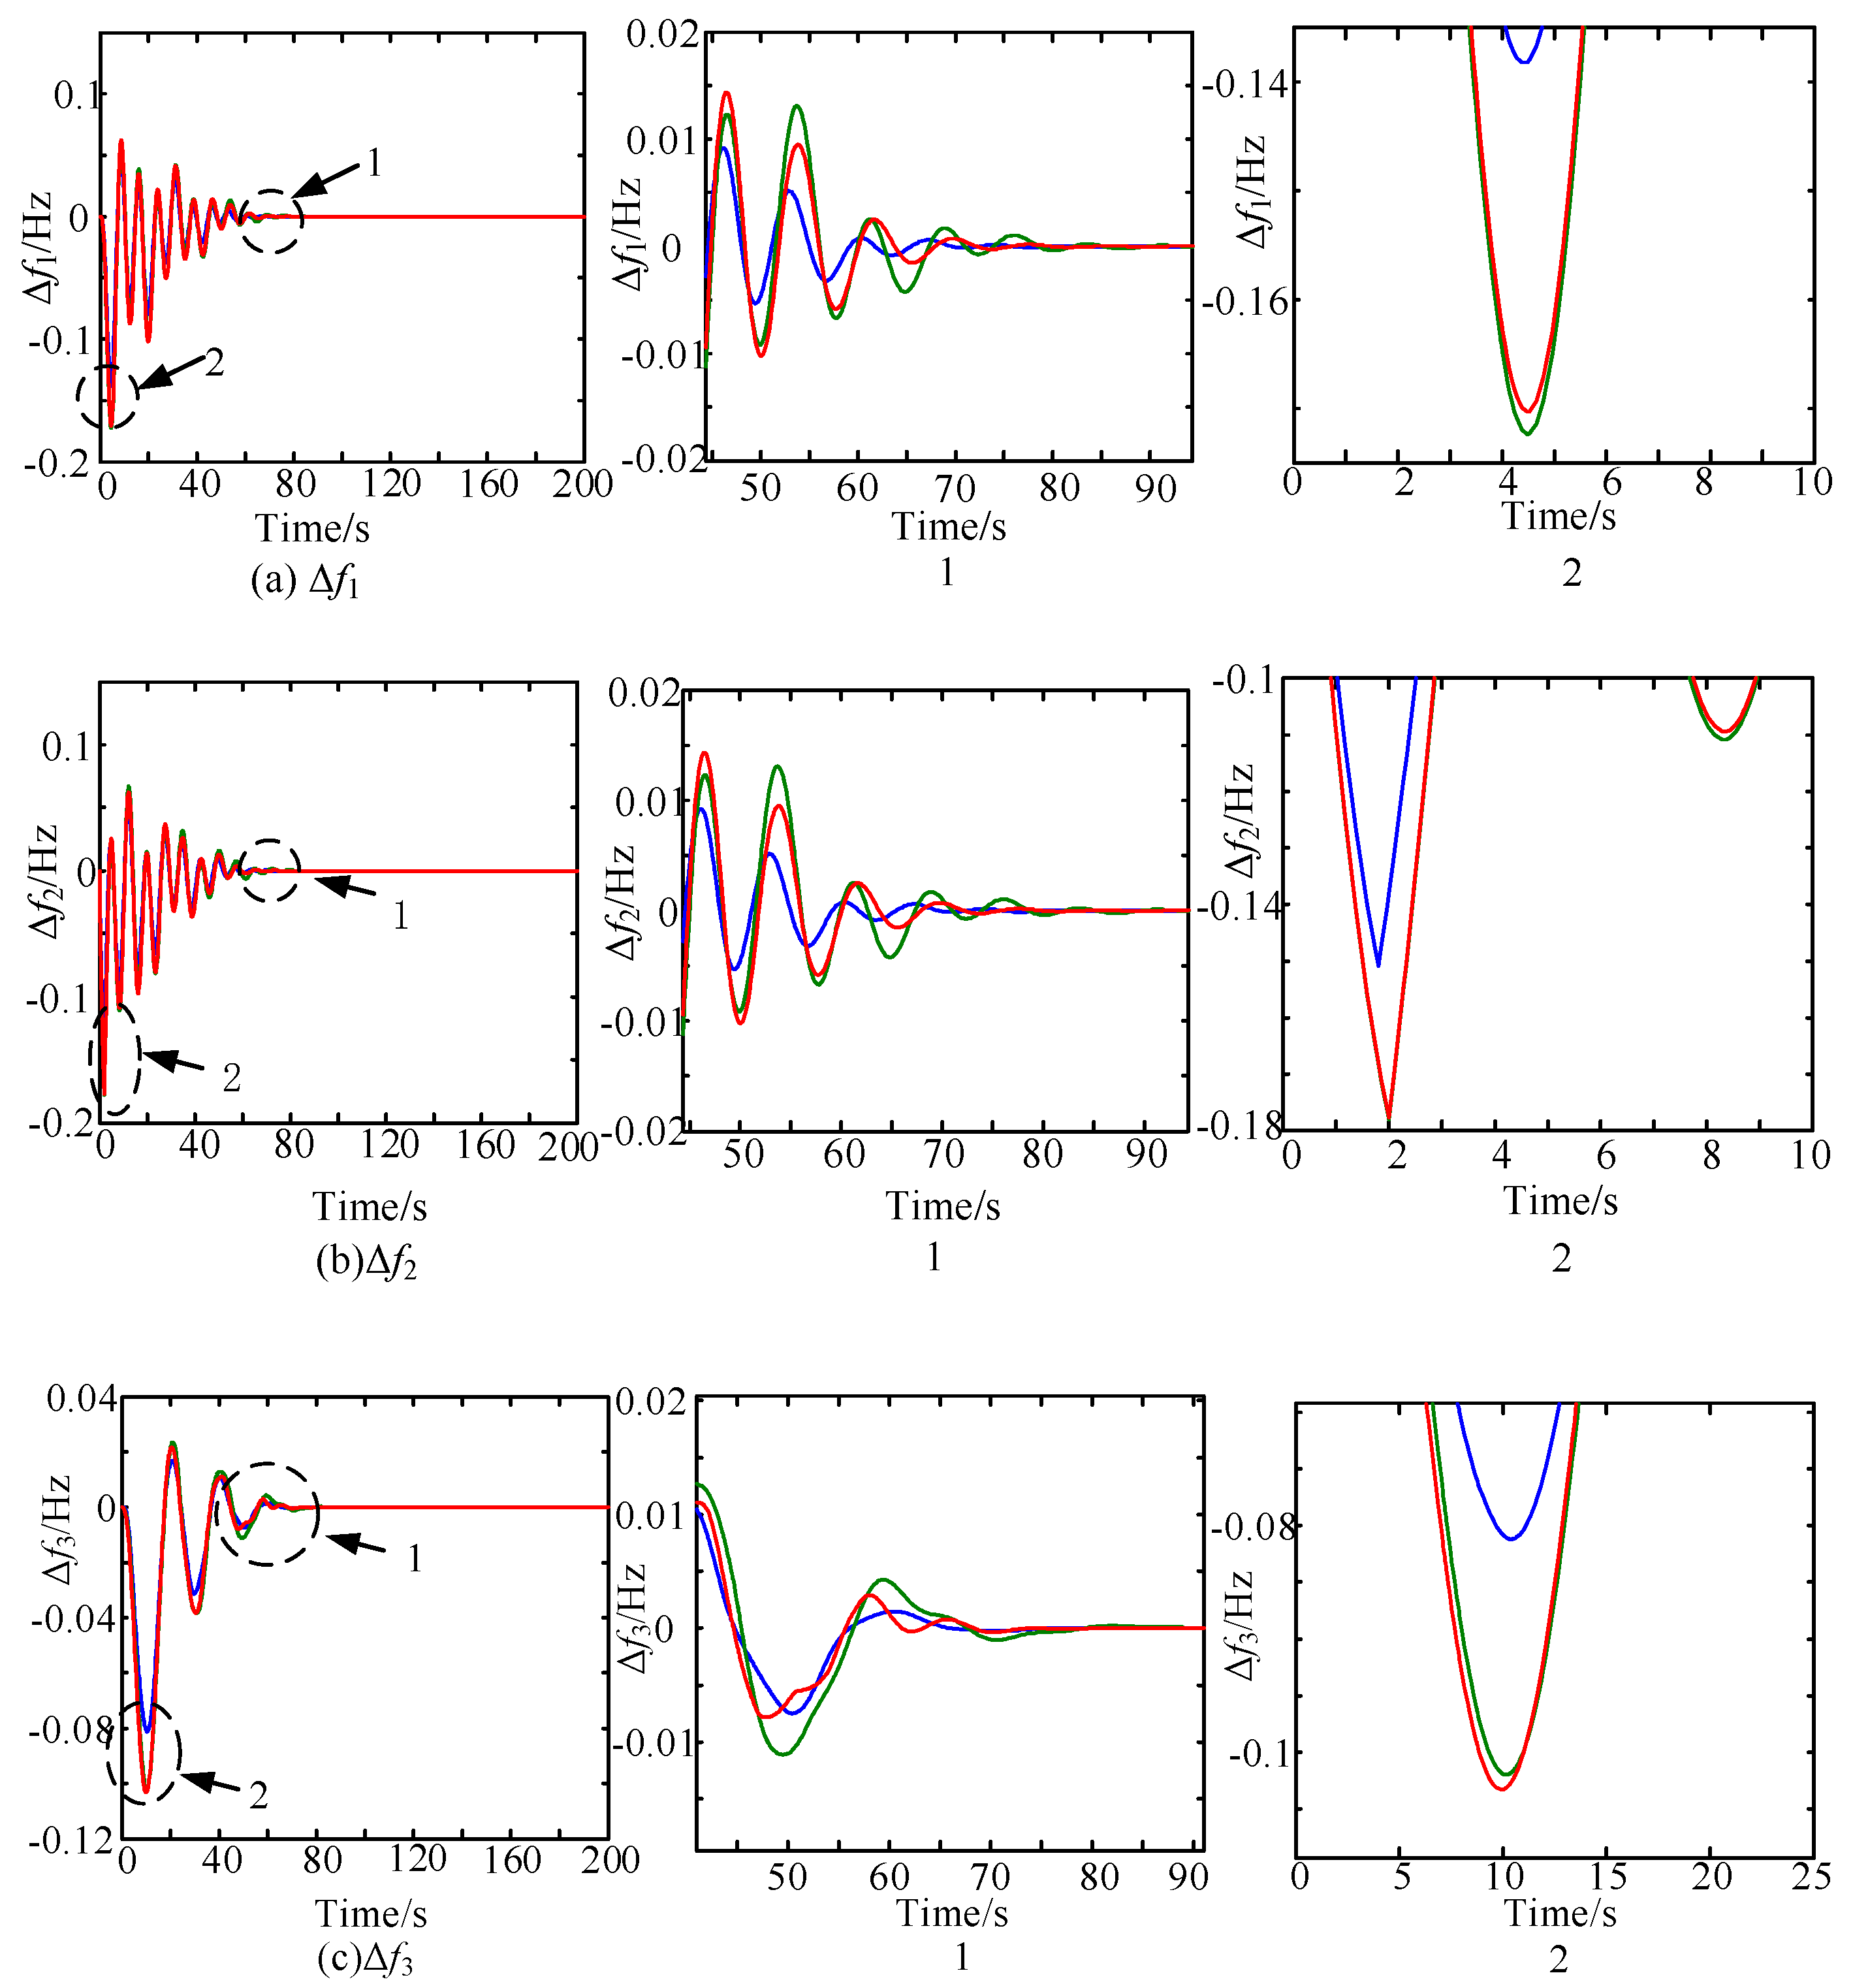
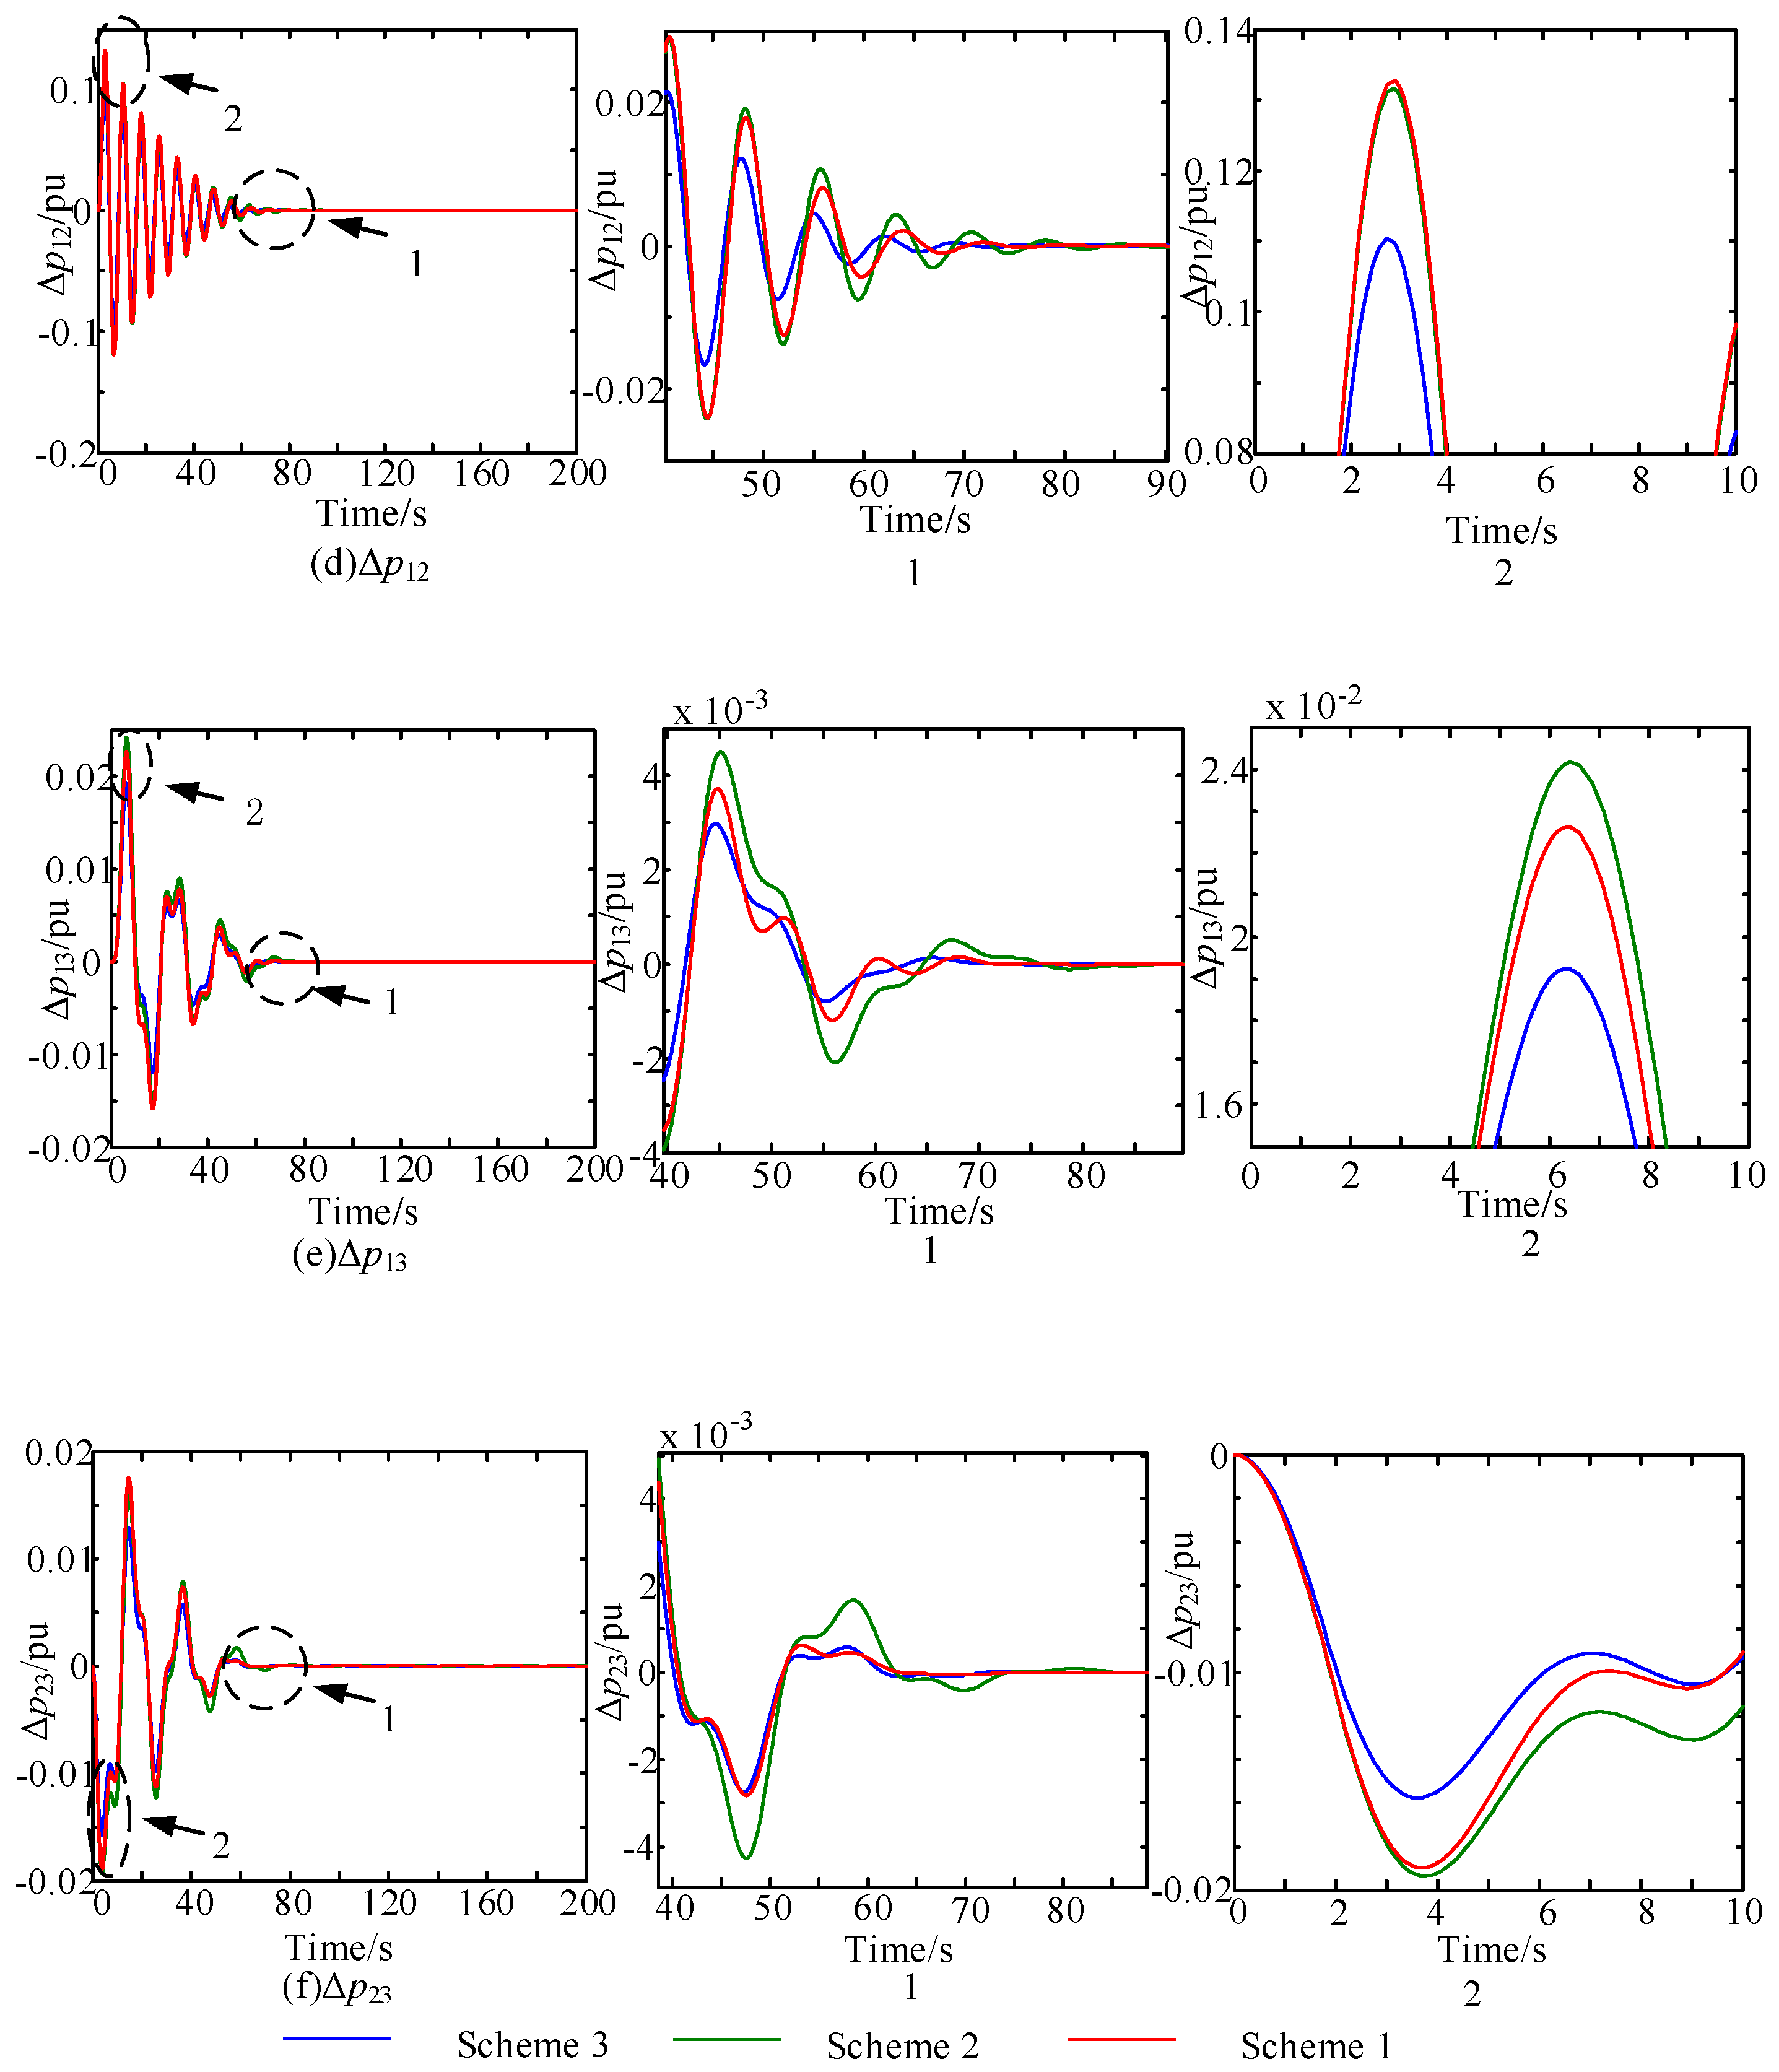
It can be seen from
Figure 4 that the three control methods can eliminate the frequency fluctuation of the system and ensure the stable operation of the system within 200 s simulation time. The collaborative multi-objective particle swarm optimization algorithm has a poor suppression effect on the frequency deviation and tie-line power deviation caused by the disturbance and has a longer adjustment time. The co-evolutionary genetic algorithm and the co-evolutionary algorithm based on the IWFOA have the same adjustment times. However, the co-evolutionary algorithm based on the IWFOA has a better suppression effect on the frequency deviation and tie-line power deviation caused by the disturbance. The parametric description of simulation results is shown in
Table 3.
To sum up, compared with a co-evolutionary genetic algorithm and a collaborative multi-objective particle swarm optimization algorithm, a co-evolutionary algorithm based on the IWFOA exhibits better control efficiency.
5.2.1. Influence of System Parameter Change on Control Effect of Unit Control Strategy
In actual power systems, the variation in the operating conditions of the generator and disturbance may lead to change in system parameters, thus inhibiting the effect of control strategies [
20,
21].
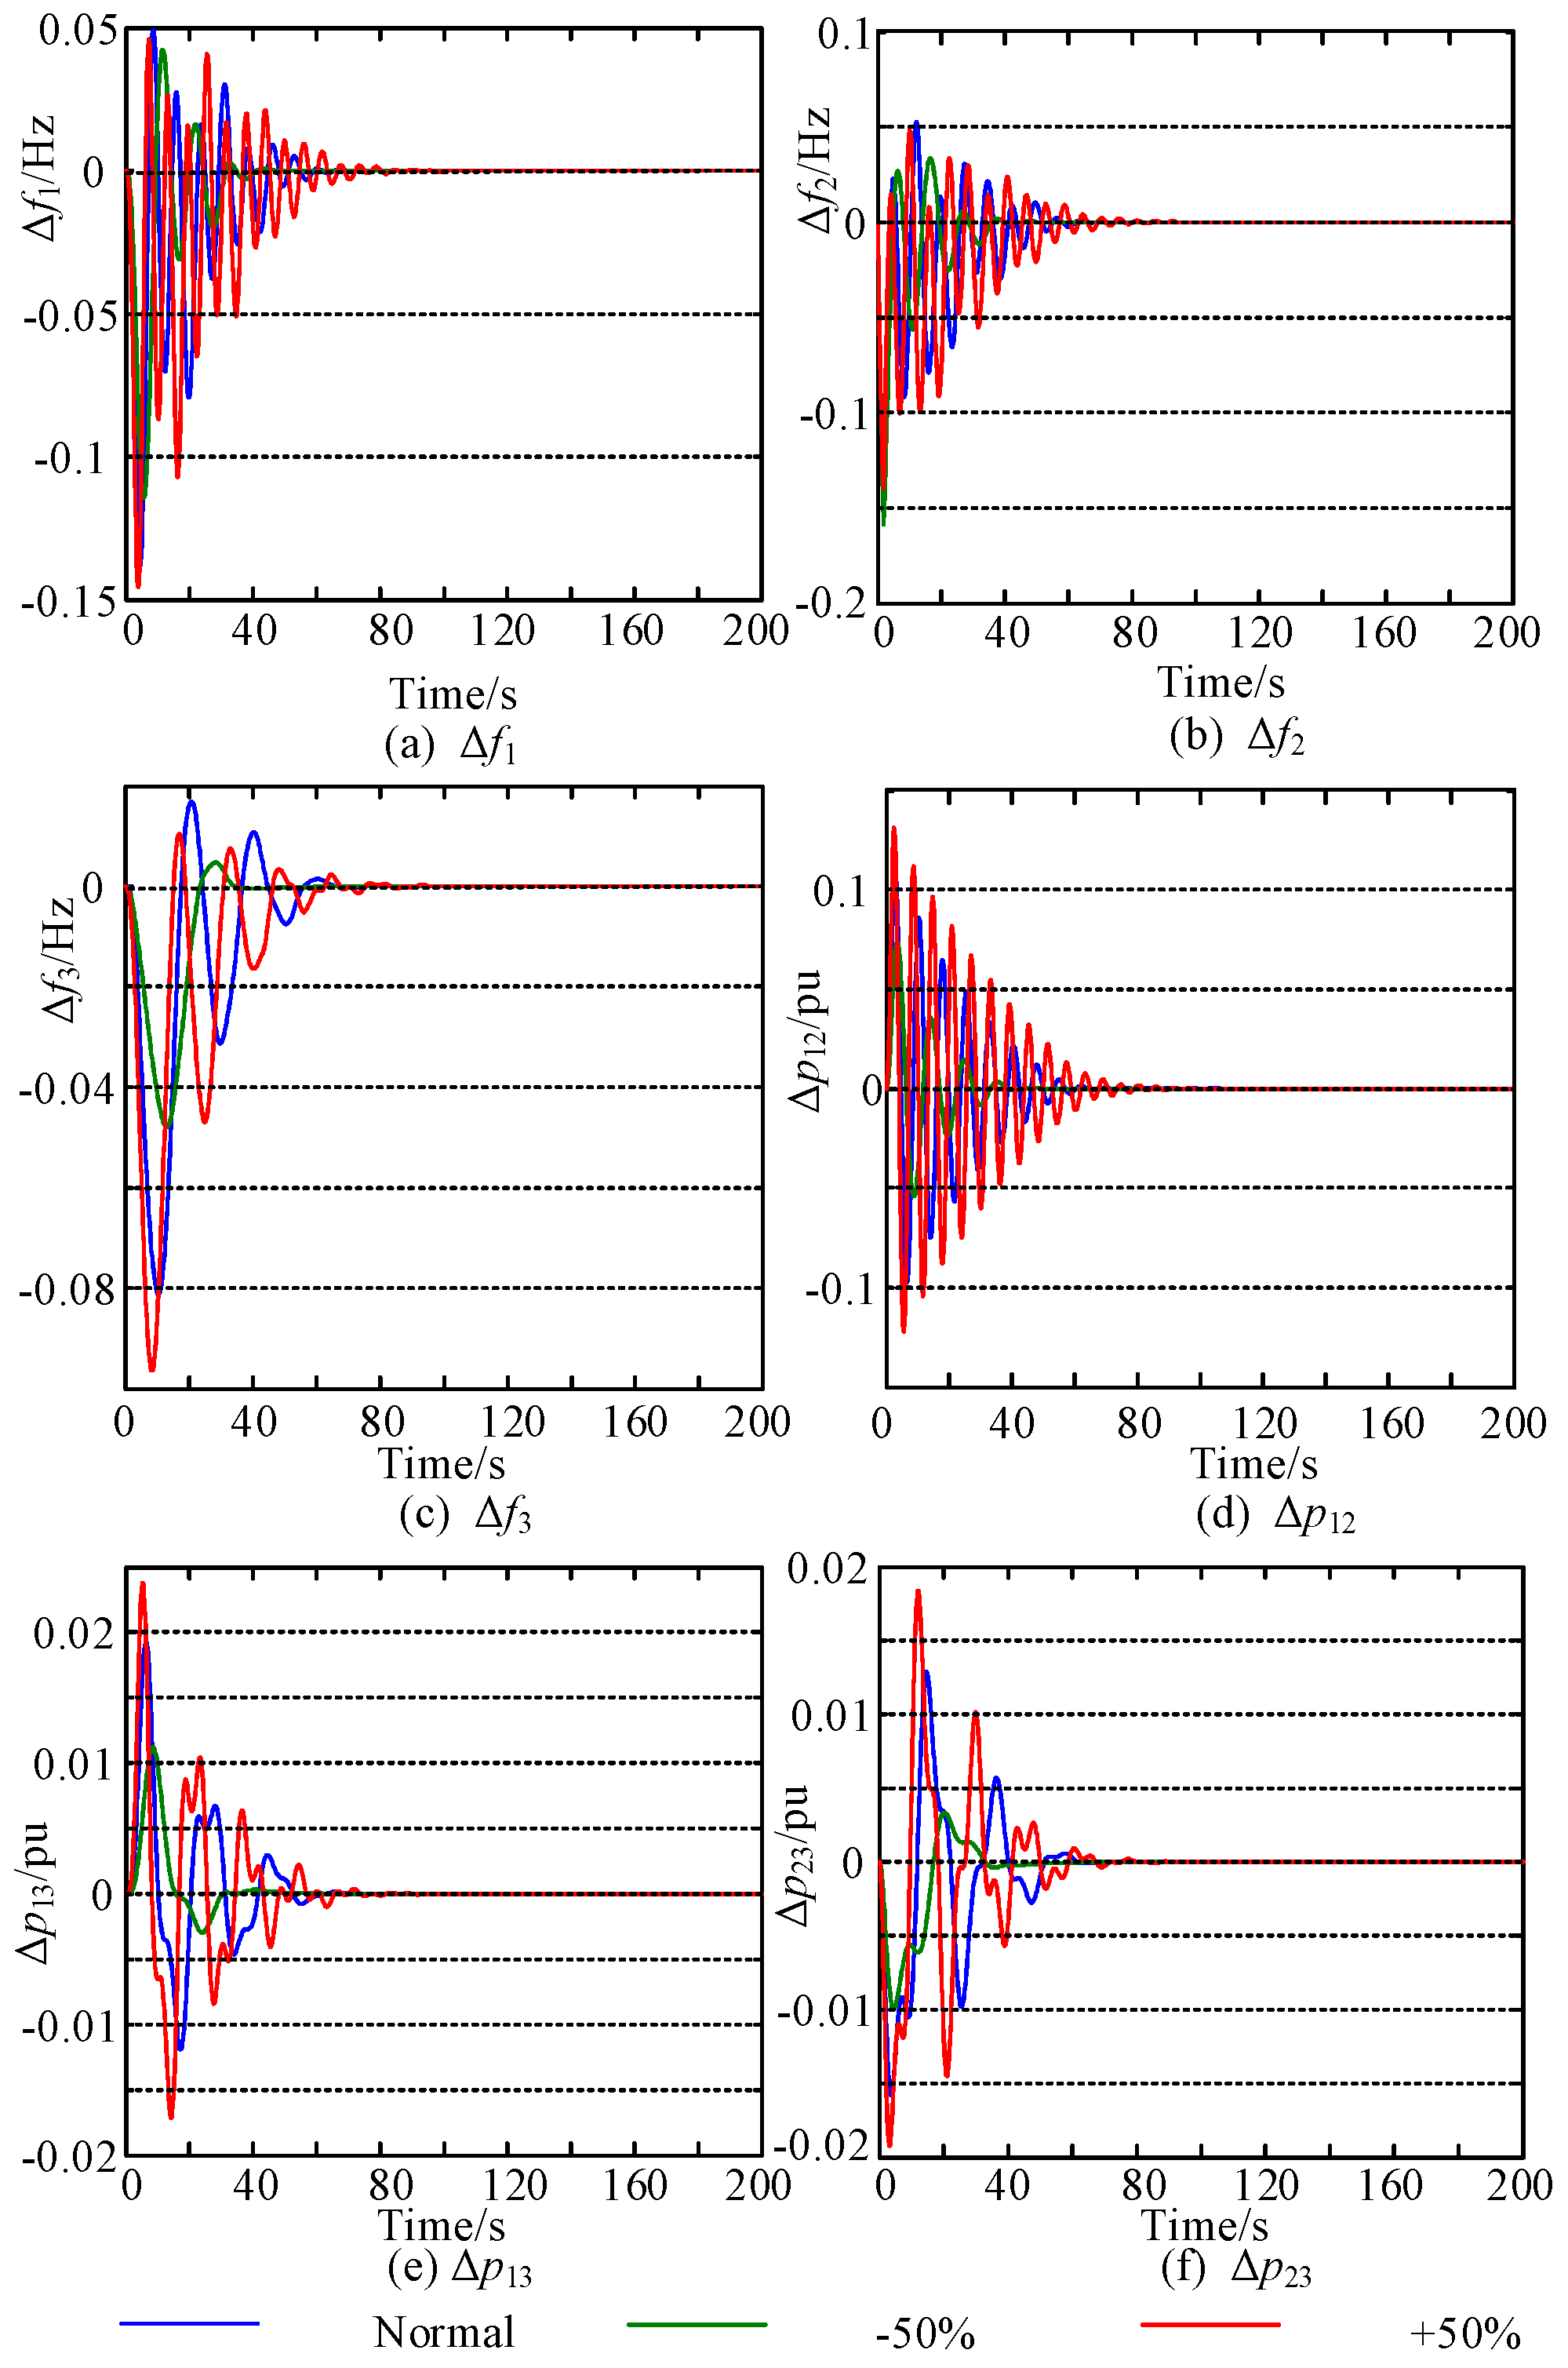
(1) The nominal parameters of all units in areas I, II, and III are reduced by 50% and increased by 50%, and the control strategy of Scheme 3 remains applicable. The simulation results are shown in
Figure 5. As the unit parameters increase, the suppression effect of the control strategy on the frequency deviation and tie-line power deviation caused by disturbance decreases to a certain extent, but the stable operation of the system can still be ensured.
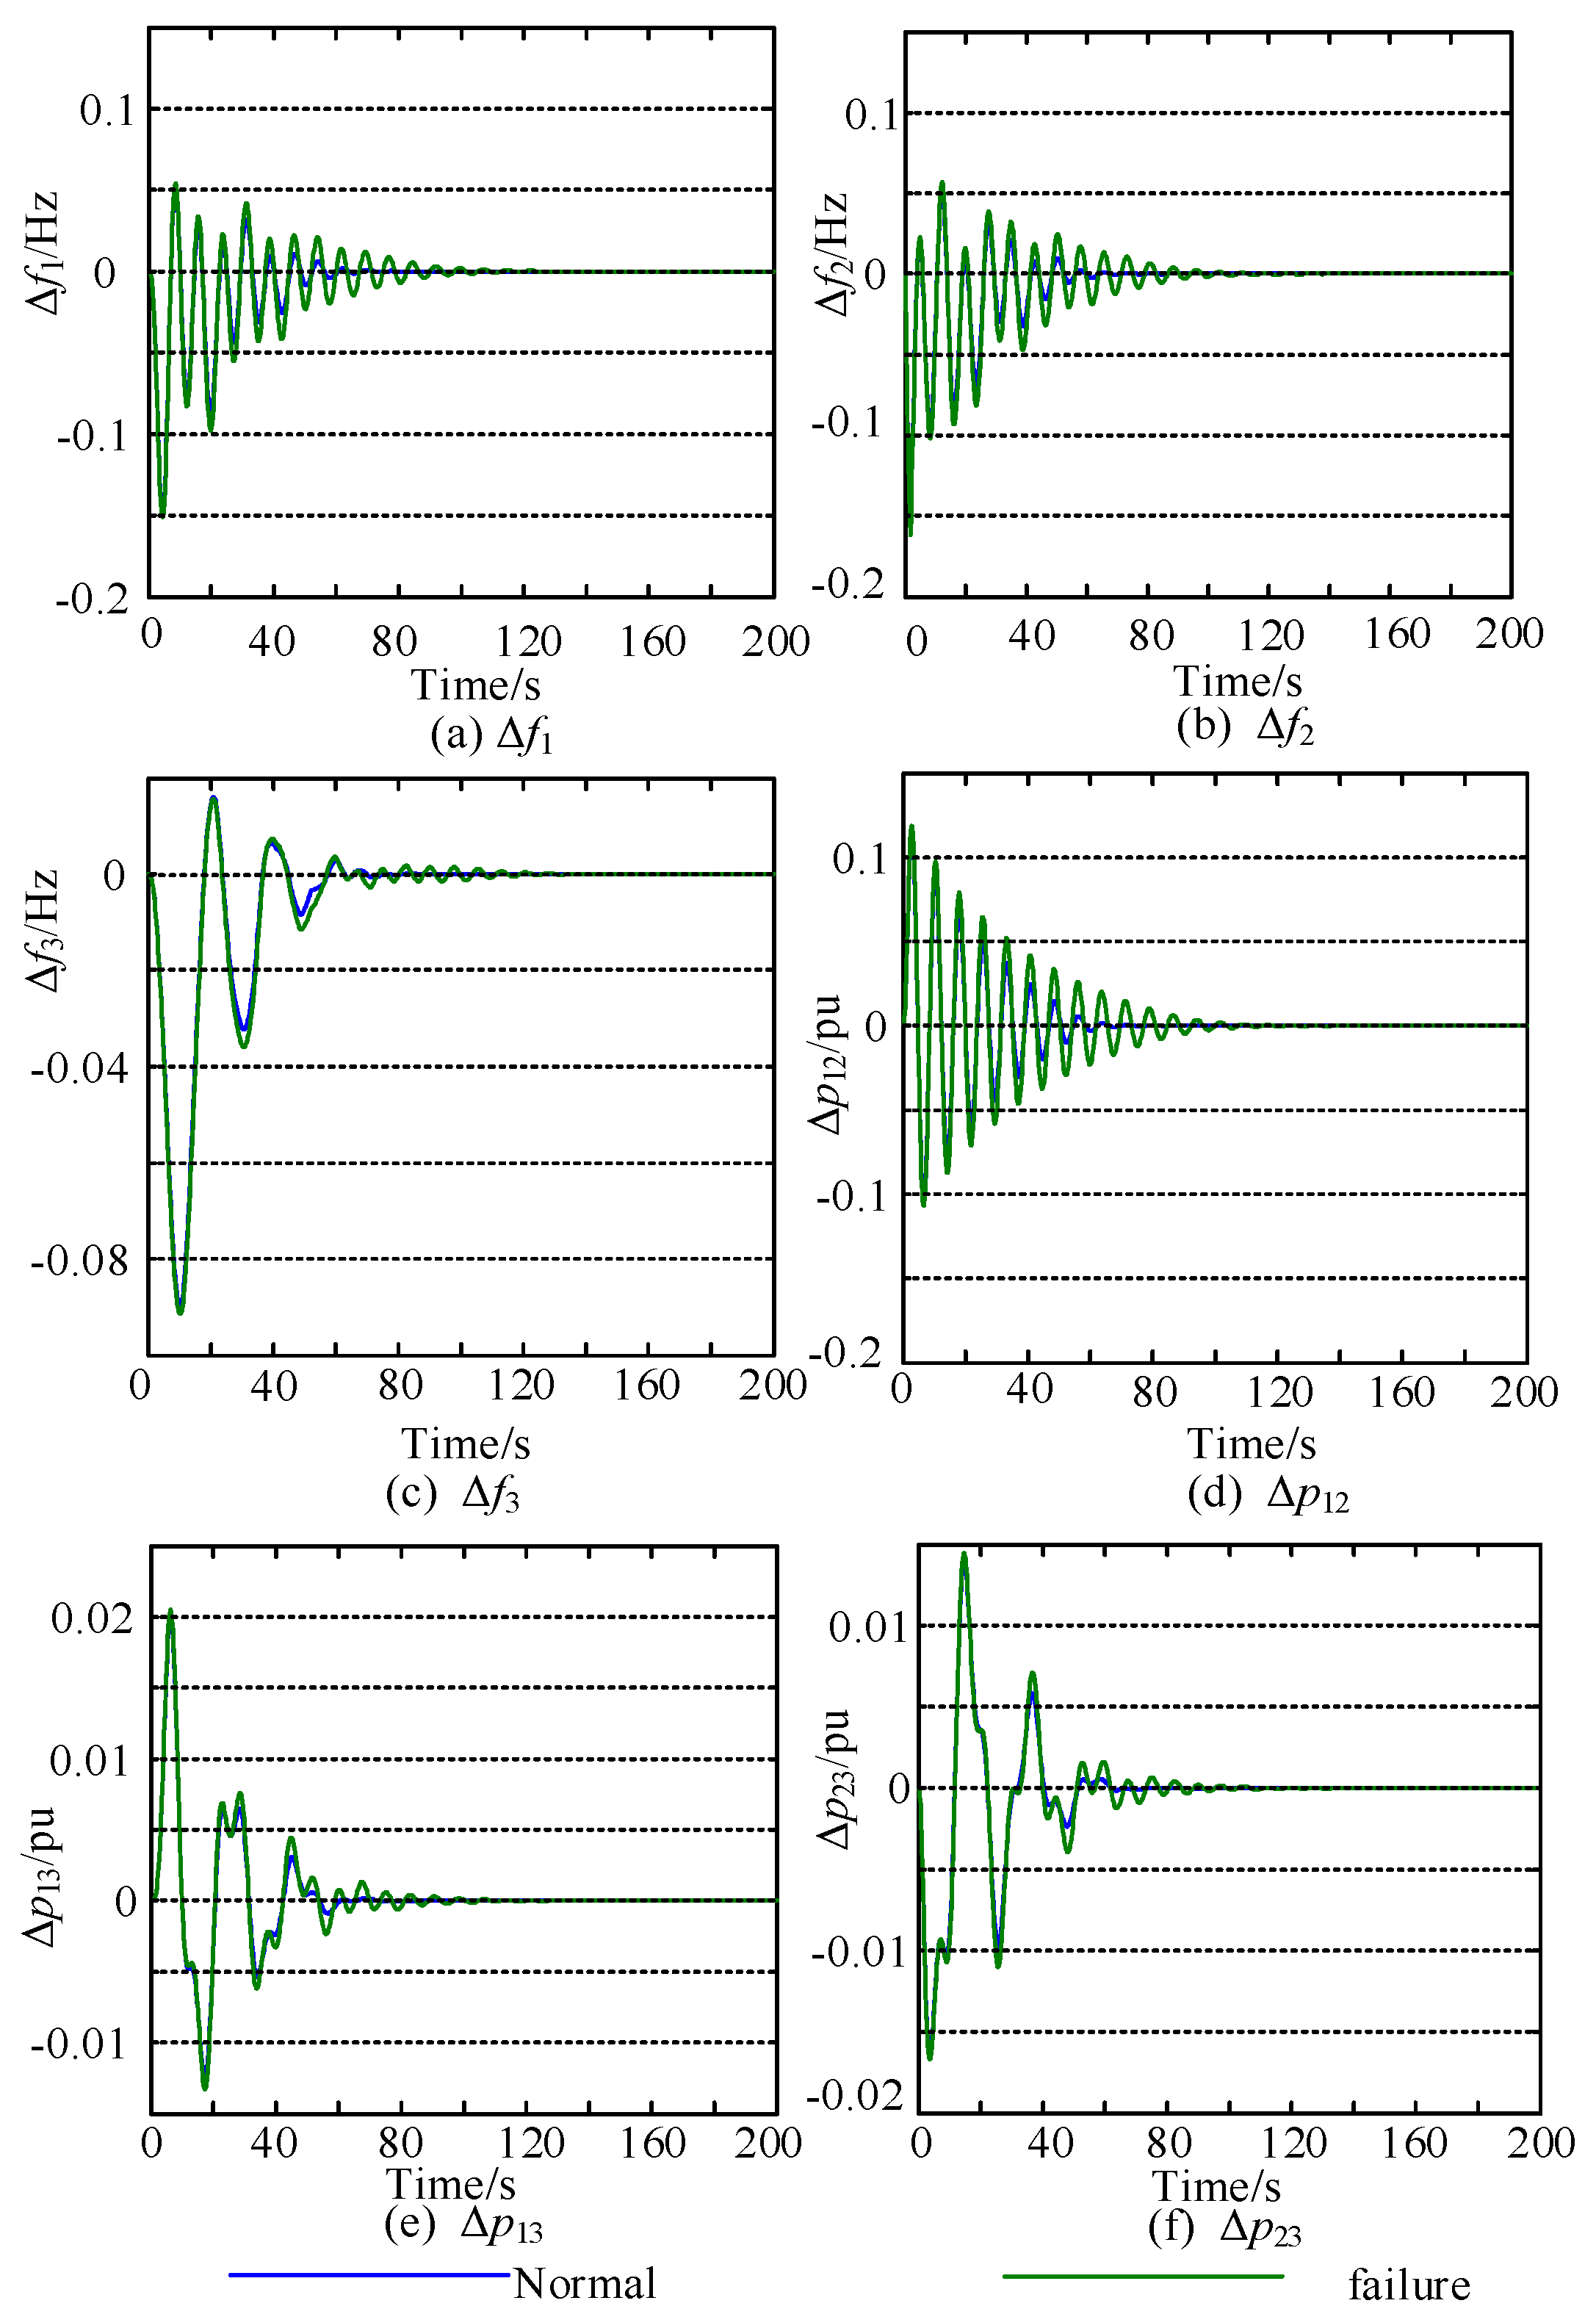
(2) It is assumed that the generator in area II is cut off owing to a fault, and the control strategy of Scheme 3 remains applicable. The simulation results are shown in
Figure 6. Compared with the normal situation, the fluctuation of system frequency deviation and tie-line power deviation is more intense and adjustment time is longer. However, the stability of the system can still be restored. This verifies the stability and robustness of the control strategy.
5.2.2. Fairness and Stability of Differential Game Control Strategy
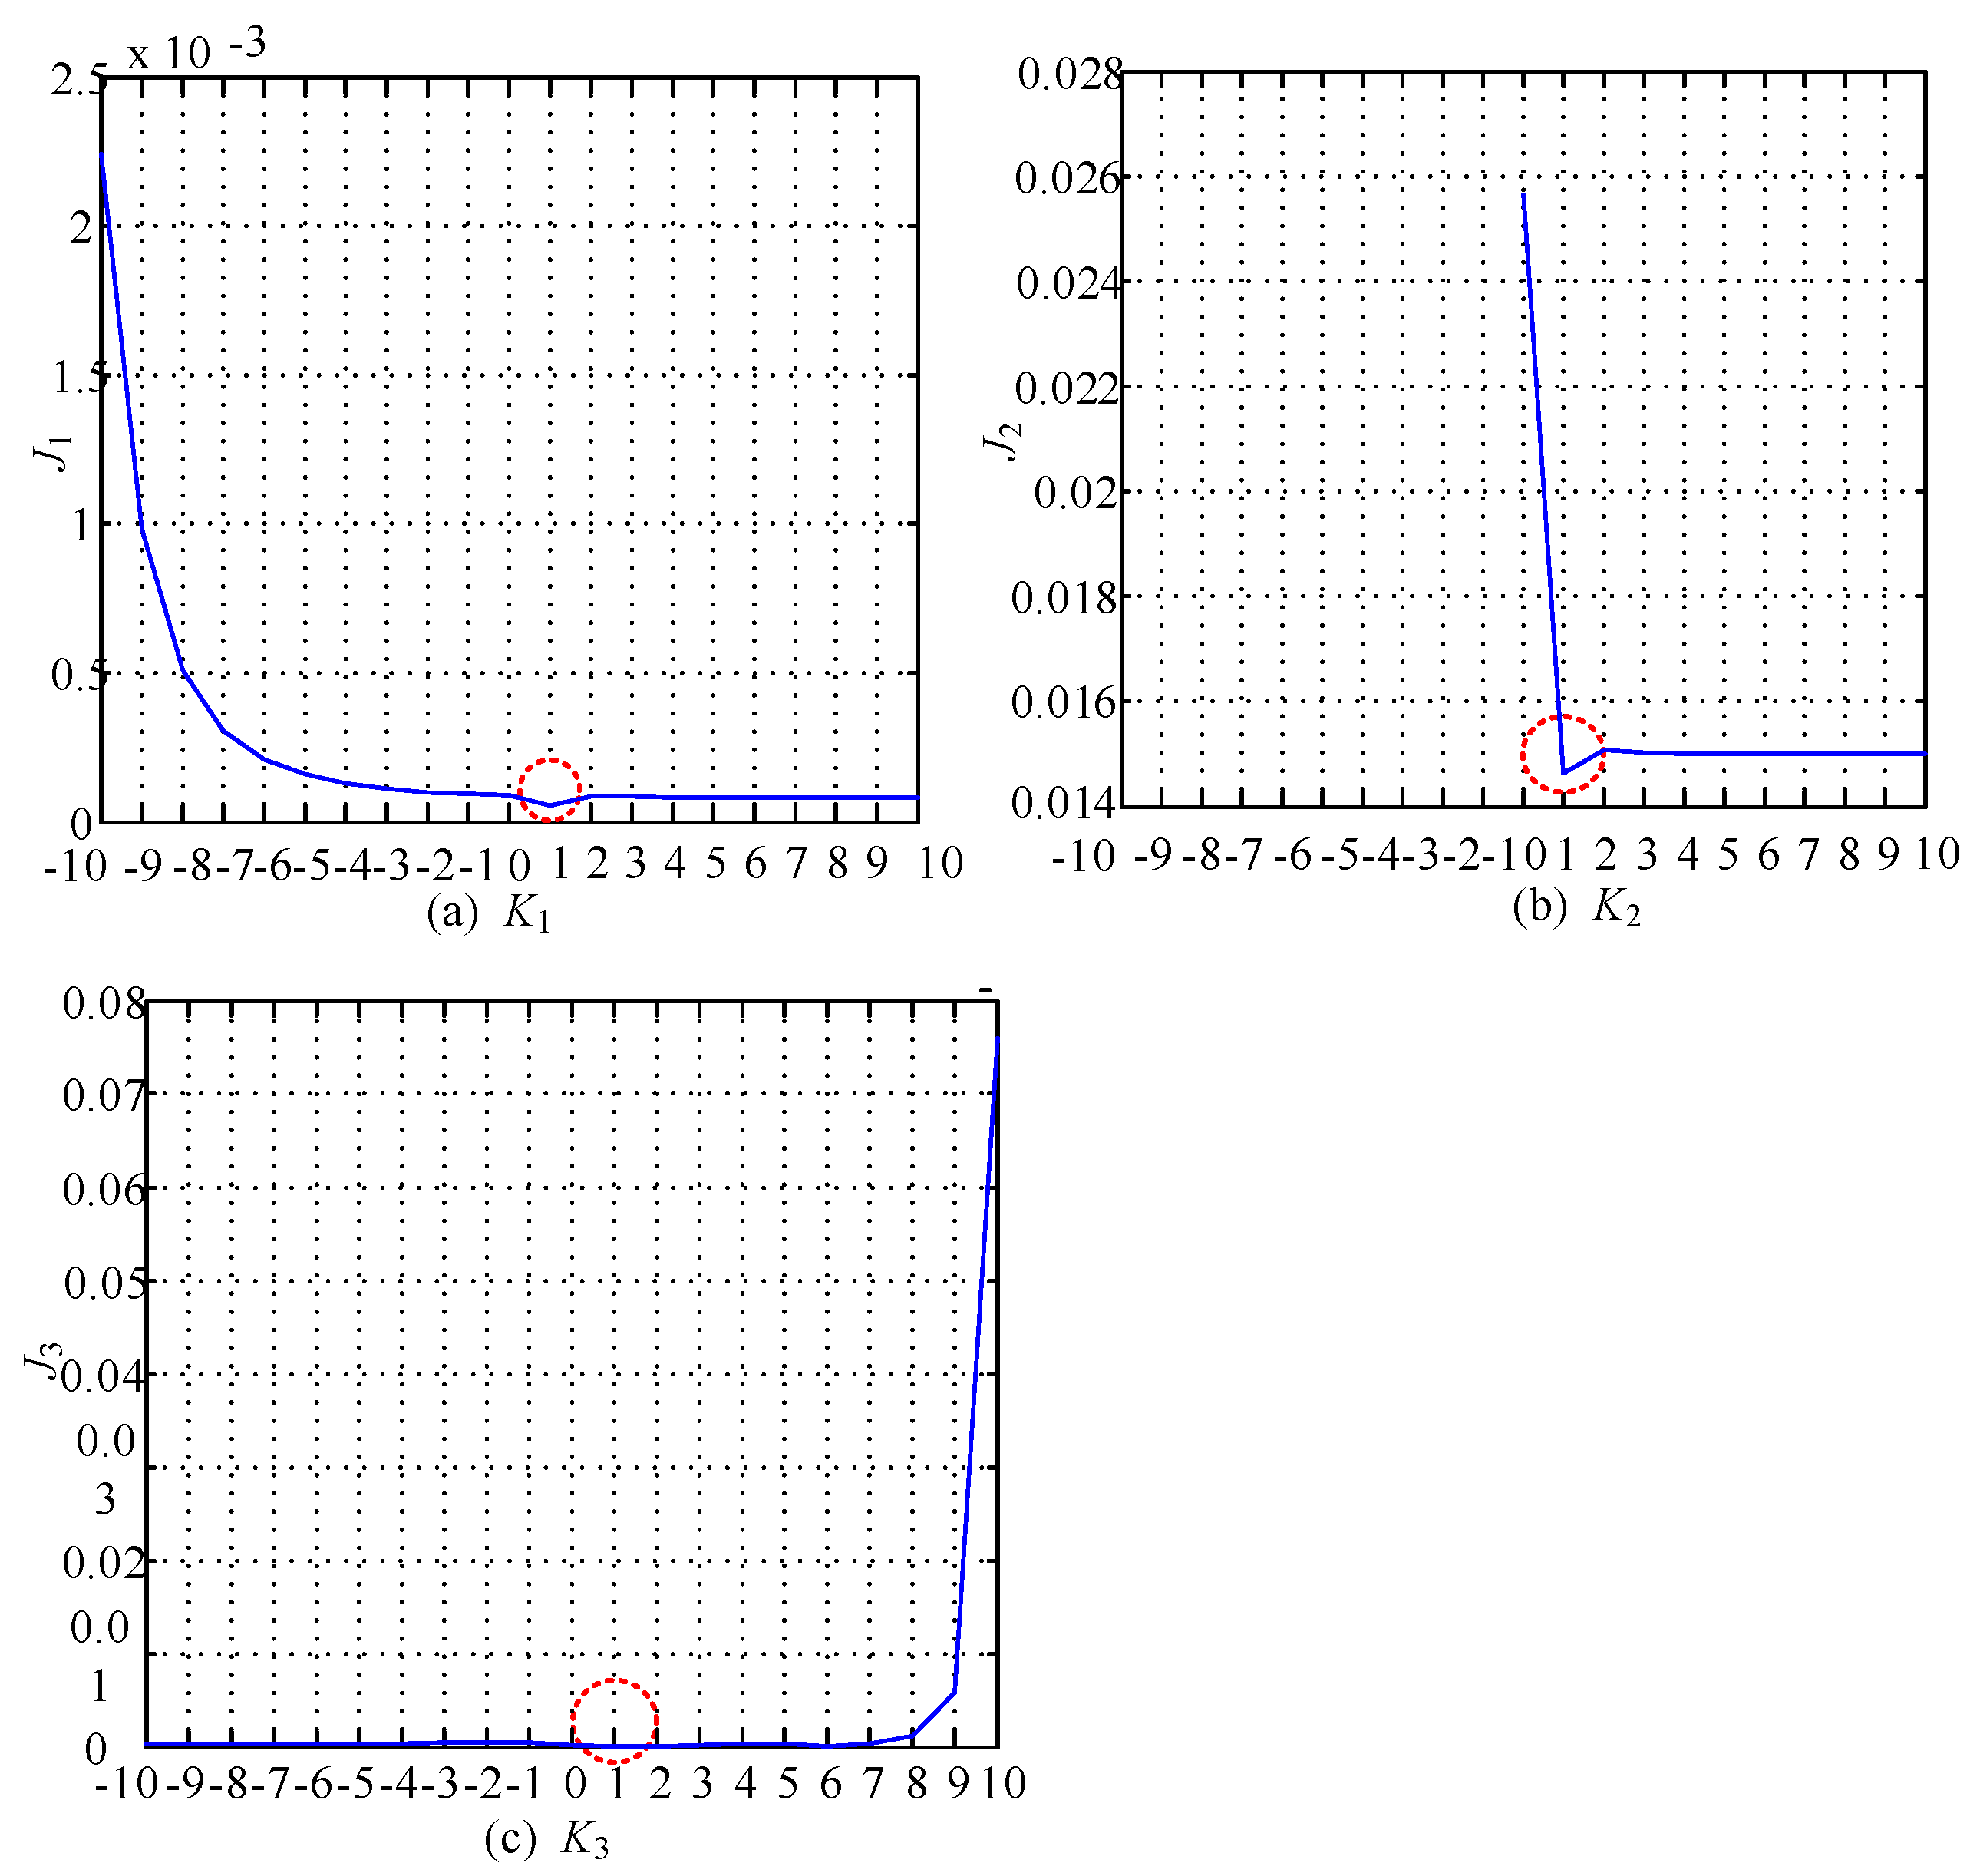
However, the above study cannot reflect the effect of differential game control strategy in coordinating the benefits of the three areas; hence, Scheme 3 is not convincing. If each area voluntarily accepts the specified control strategy, and there is no separate willingness to deviate from the scheme, the scheme can be considered to be persuasively coordinate the benefits of the three areas. To verify the fairness and stability of the differential game control strategy, after the strategies are changed independently, the changes in the income of the three areas are investigated in each scheme to reflect their willingness to deviate from the scheme. It is assumed that
where
K1,
K2, and
K3 are 12-dimensional column vectors. For these vectors, we select 100 values through random sampling for all elements in a range of [−10, 10]. The simulation results are shown in
Figure 7. In every scheme that makes the system stable, the
J1 corresponding to [
u1’,
u2*,
u3*] is always worse than that corresponding to [
u1*,
u2*,
u3*], the
J2 corresponding to [
u1*,
u2’,
u3*] is always worse than that corresponding to [
u1*,
u2*,
u3*], and the
J3 corresponding to [
u1*,
u2*,
u3’] is always worse than that corresponding to [
u1*,
u2*,
u3*]. That is, when the control strategy of area I is
u1*,
u2* is the optimal strategy of area II and
u3* is the optimal strategy of area III, and vice versa. Hence, [
u1*,
u2*,
u3*] has reached Nash equilibrium.
