Article

Characteristic Analysis of Torrefied Pellets: Determining Optimal Torrefaction Conditions for Agri-Byproduct

1
Department of Biosystems Engineering, Kangwon National University, Hyoja 2 Dong 192-1, Chuncheon-si 200-010, Korea
2
Green Materials & Processes R&D Group, Korea Institute of Industrial Technology, 55, Jongga-ro, Jung-gu, Ulsan 44413, Korea
*
Author to whom correspondence should be addressed.
Energies 2020, 13(2), 423; https://doi.org/10.3390/en13020423
Submission received: 20 November 2019 / Revised: 3 January 2020 / Accepted: 6 January 2020 / Published: 15 January 2020
(This article belongs to the Special Issue Biomass Chars: Elaboration, Characterization and Applications III)

Abstract

:
This study considers the possibility of utilizing agri-byproducts as energy sources via pelletization and torrefaction. Pellets were placed in a capsule and torrefied in an electrical furnace. Subsequently, they were cooled for 30 min, and their mass loss was measured. To investigate the resulting changes in fuel characteristics, ultimate and proximate analyses were performed, and calorific values were measured. To estimate the water absorption of the pellets, hygroscopicity evaluations were conducted. Based on the experimental results, the energy yield, lower heating value, and exergy were calculated to determine the optimum conditions for torrefaction. The calculation was performed by utilizing the useful exergy and standards applied to biomass power plants. We determined that torrefaction for agro-pellets should be conducted under low-to-intermediate temperatures (210–250 °C) within a period of 50 min. Under these conditions, 7–55% mass reductions were observed, the higher heating value increased from 4110 to 6880 kcal kg−1, and the lower heating value changed from 3780 to 6520 kcal kg−1 owing to reduced hygroscopicity. So, Agro-byproducts can contribute to the practical application by improving the heating value through torrefaction as an alternative to wood pellets.

1. Introduction

Climate change has led governments worldwide to switch to renewable energy sources. In this regard, the government of the Republic of Korea has recently revised its renewable energy certification (REC). The ratio for biomass/coal co-firing has been eliminated, whereas the weight for biomass-whole firing has been reduced by 50%. Meanwhile, a new weight for unused forestry byproducts has been added and set at 2.0, which translates to increased demand for biomass-based fuels (biofuels). Specifically, the demand for wood pellets, which are typically pulverized and molded with woody biomass for use as biofuel, has been increasing rapidly. However, the current domestic production of wood pellets is not sufficient to address this demand and, consequently, large amounts of wood pellets have to be imported. In this regard, according to the Forest Biomass Energy Association, domestic wood pellet production was estimated to be approximately 67,000 tons while its import amounted to 2,431,000 tons [1] Consequently, there is an urgent need to find suitable replacements for wood pellets. In this context, several studies have examined the possibility of using agro-byproducts as fuel.
In Korea, the domestic potential of agro-byproducts was estimated to be approximately 4018 × 103 ton/year [2]. Here, we note that among various agro-byproducts, chaff and rice straw, which amount to 61%, are used as compost or livestock feed. However, the other byproducts are left mostly unused or are subjected to direct combustion. Further, it is noteworthy that agro-pellets suffer from the disadvantage of a low calorific value relative to coal; consequently, it becomes necessary to increase the calorific value of agro-pellets for better combustion performance. The torrefaction process was introduced as one possible method to solve this problem.
Torrefaction is a thermochemical conversion process wherein biomass fuel is preheated to temperatures of 200–300 °C, over an interval of around 1 h. This process can improve fuel characteristics such as the calorific value and the hydrogen/carbon ratio (H/C ratio) to a level comparable with that of solid fossil fuels. However, excessive torrefaction can lead to energy loss due to excessive mass loss; thus, the determination of the optimum torrefaction conditions becomes important. For this determination, systematic analysis studies are required.
Kanwal et al. [3] demonstrated the physicochemical effects of torrefaction via proximate and ultimate analysis and true density, grindability, and hydrophobicity studies of sugarcane bagasse. Garcia et al. [4] compared the energy properties of torrefied wood and elephant grass pellets in relation to “un-torrefied” pine and elephant grass pellets. Azocar et al. [5] fabricated brown pellets under moderate torrefaction conditions at a temperature of 145 °C. Spirchez et al. [6] developed a mass reduction model of the torrefaction process for beech pellets and validated the model. Peng et al. [7] studied the effects of the wood torrefaction process on the resulting energy density and hardness. Yang et al. [8] developed a synchronized torrefaction and pelleting process at the laboratory scale and compared their results with previous processes such as torrefaction after pelletizing (TAP) or pelletizing after torrefaction (PAT). Oh et al. [9] developed and validated a mass reduction model for agro-byproducts (pepper stem) and determined the optimized torrefaction conditions.
Against this backdrop, in this study, we consider the torrefaction process for effective utilization of unused agro-biomass as a possible fuel. The torrefaction process was conducted with select agro-byproduct pellets, and their mass reduction was measured. Subsequently, ultimate analysis and calorific value measurements were performed, and the properties of the torrefied agro-pellets were evaluated.

2. Materials and Methods

2.1. Samples

In this study, pepper stems (PEP), perilla stems (PRP), chaff (CHP), and coffee spent ground (CFP) were pelletized. Natural dried pepper stems and perilla stems were obtained from Chuncheon-si, Gangwon Province, Korea. Chaff was purchased from a farm in Seosan-si, Chungcheongbuk Province, Korea. Coffee spent ground was obtained from a café in Kangwon National University. To compared with wood pellet (WP), wood pellet (hannamo pellet, National Forestry Cooperative Federation, Korea) was also used. Collected byproducts were pelletized. Each pellets’ properties were summarized as Table 1.

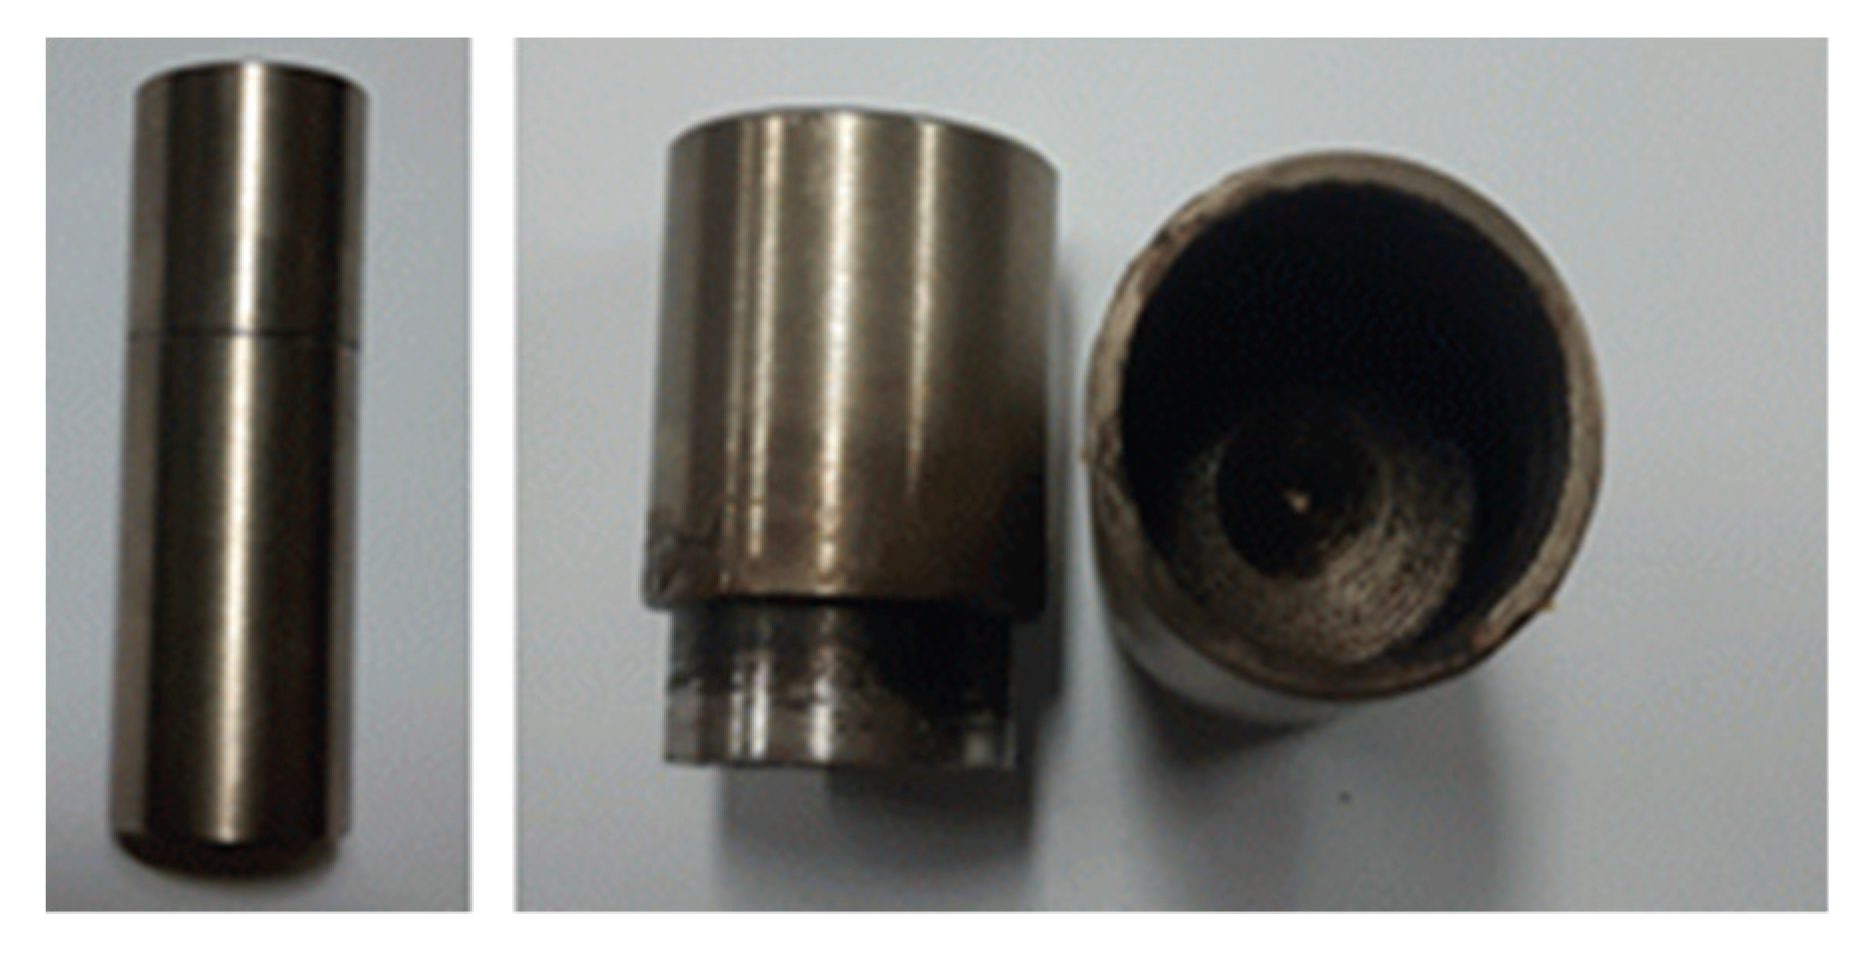
2.2. Torrefaction Experiments

Torrefaction experiments were carried out by placing 6–7 g of the selected agro-byproduct pellets into a prototype capsule (Figure 1) and sealing it with heat-resistant tape to minimize environmental disturbances. The experiments were performed using an electric furnace (N7/H/B410, Nabertherm GmbH, Lilienthal, Germany). The experiment time varied from 20 to 50 min with 10-min increments, and process temperature varied from 210 to 290 °C in 20 °C increments. After the experiments, the samples were cooled for 30 min to prevent radical reaction between the activated samples and oxygen, and the resulting mass reduction was subsequently measured [10]. Based on the mass reduction, the mass yield was calculated using Equation (1).
MY   [ % ] = M torrefied M raw × 100 ,
where, MY is mass yield, and Mtorrefied, Mraw are mass after torrefaction and before the torrefaction process, respectively.

2.3. Fuel Characteristic Evaluation

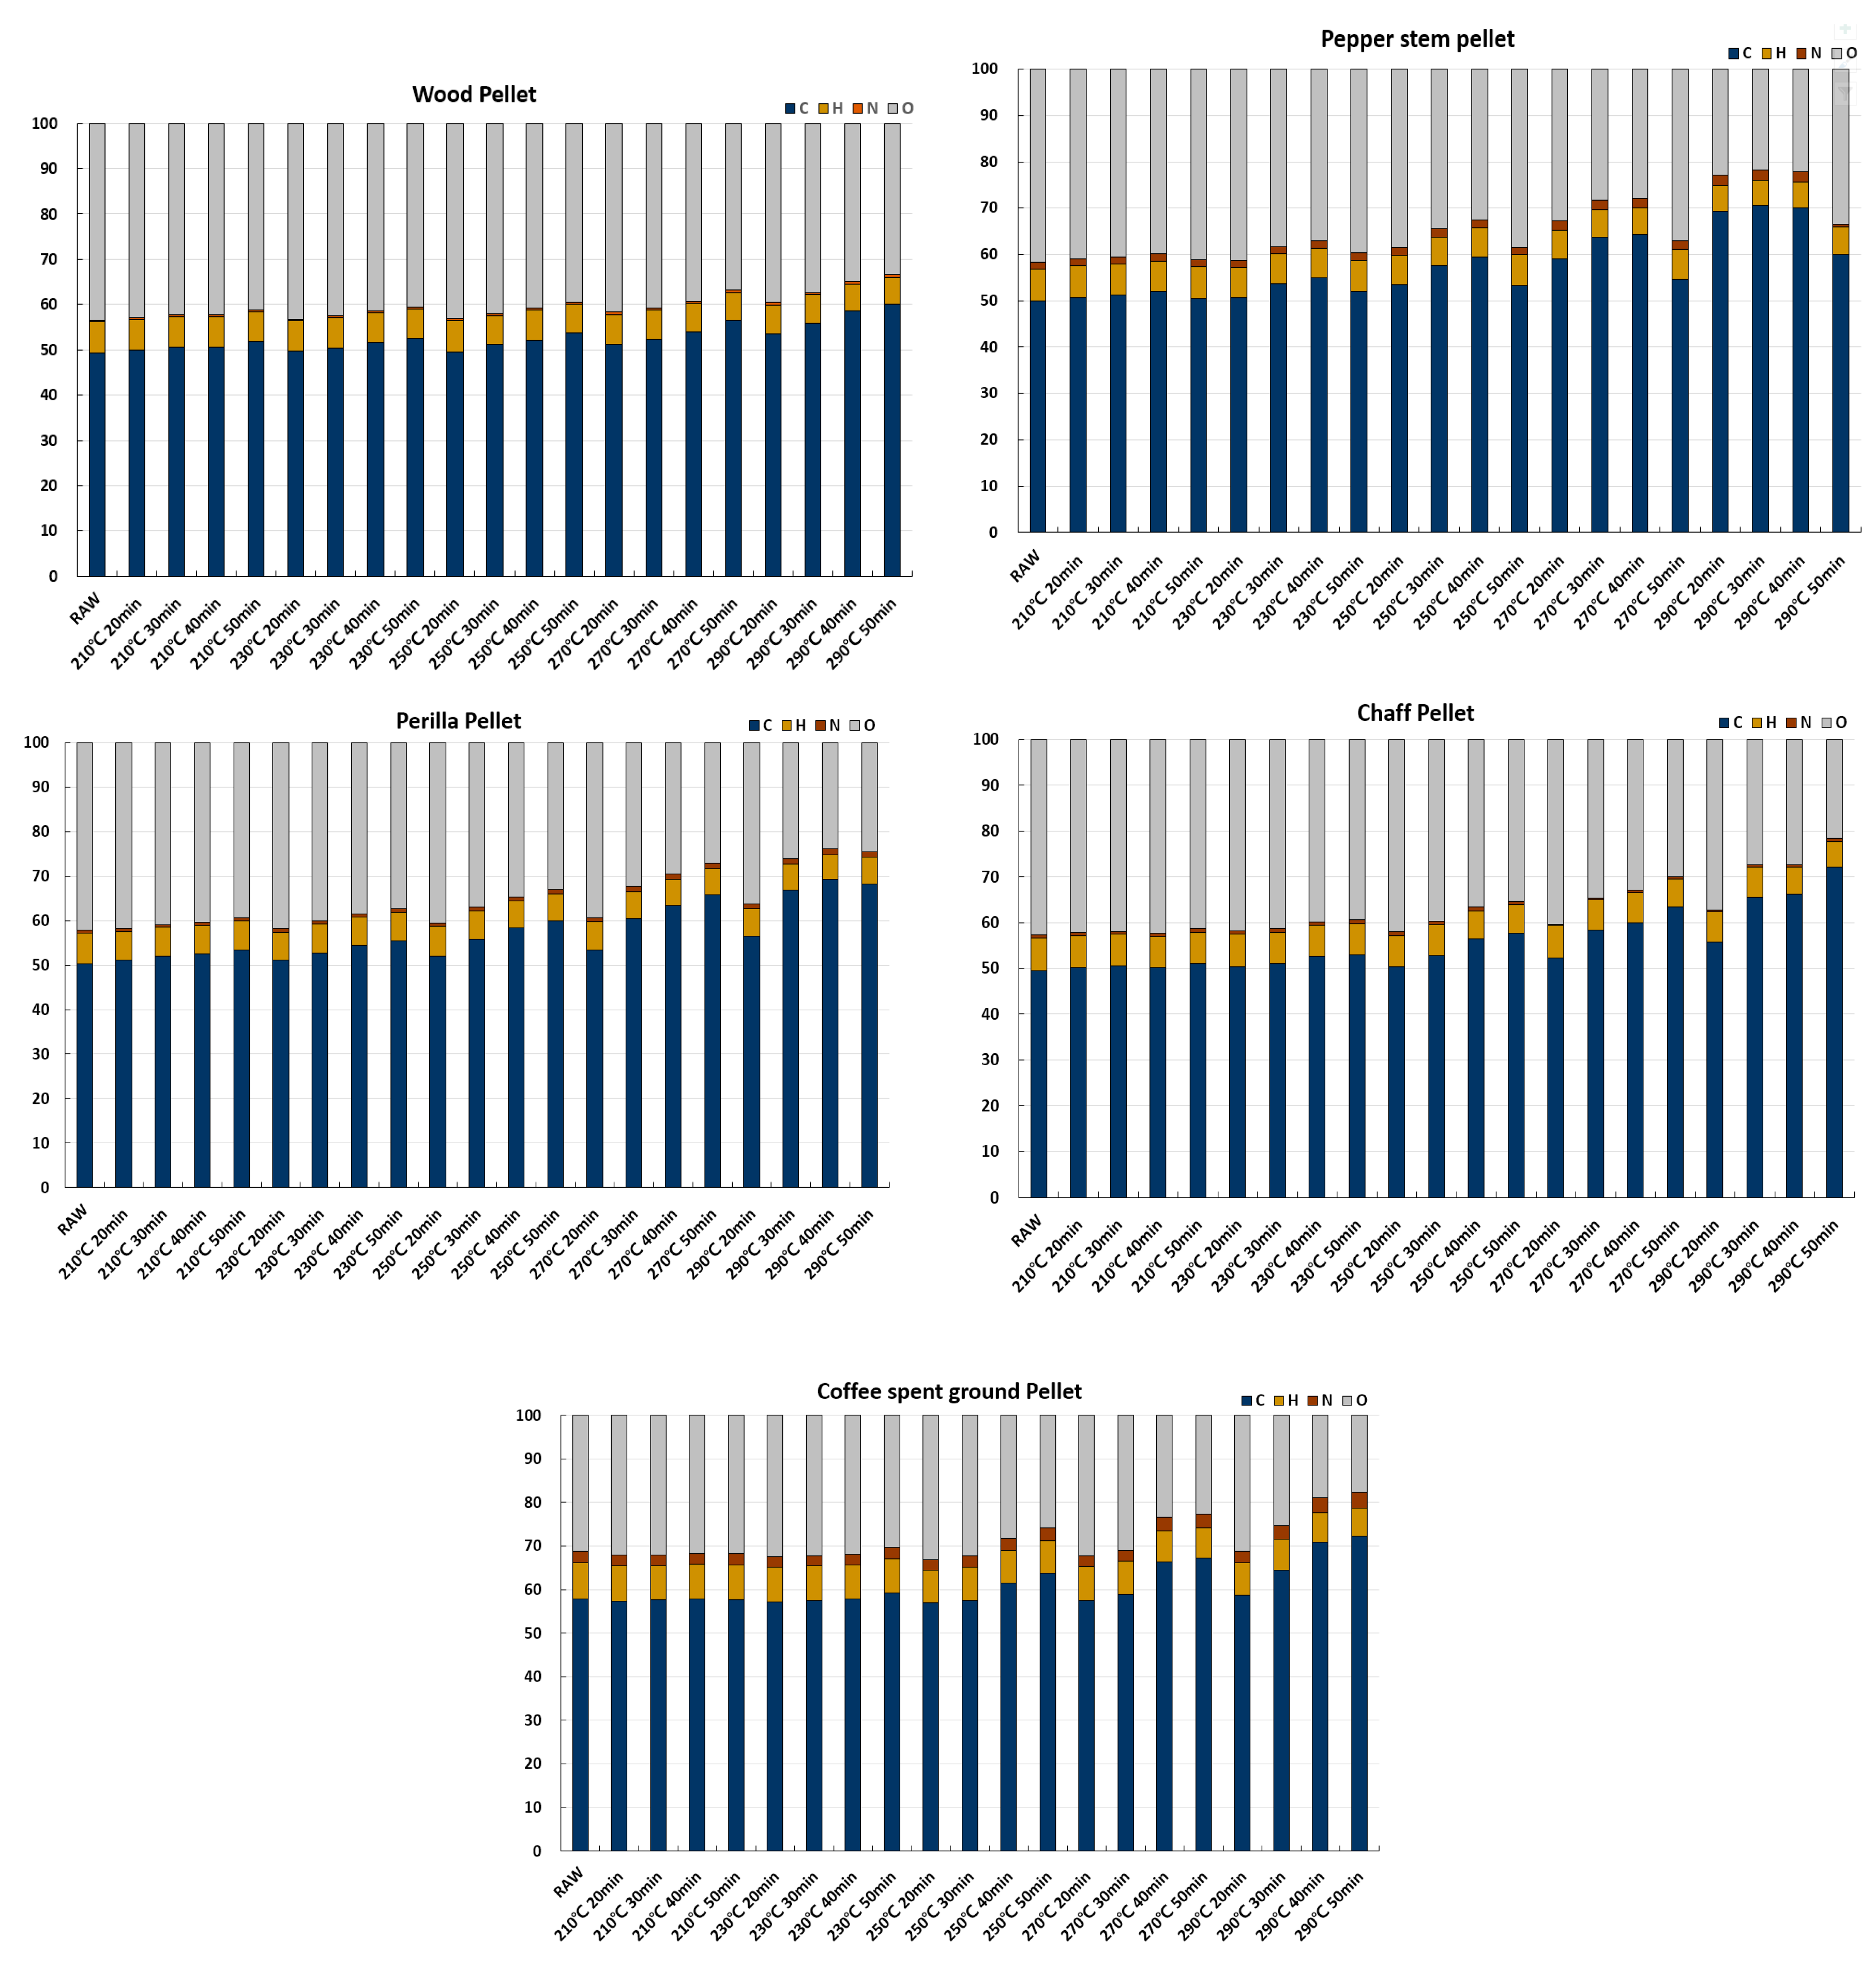
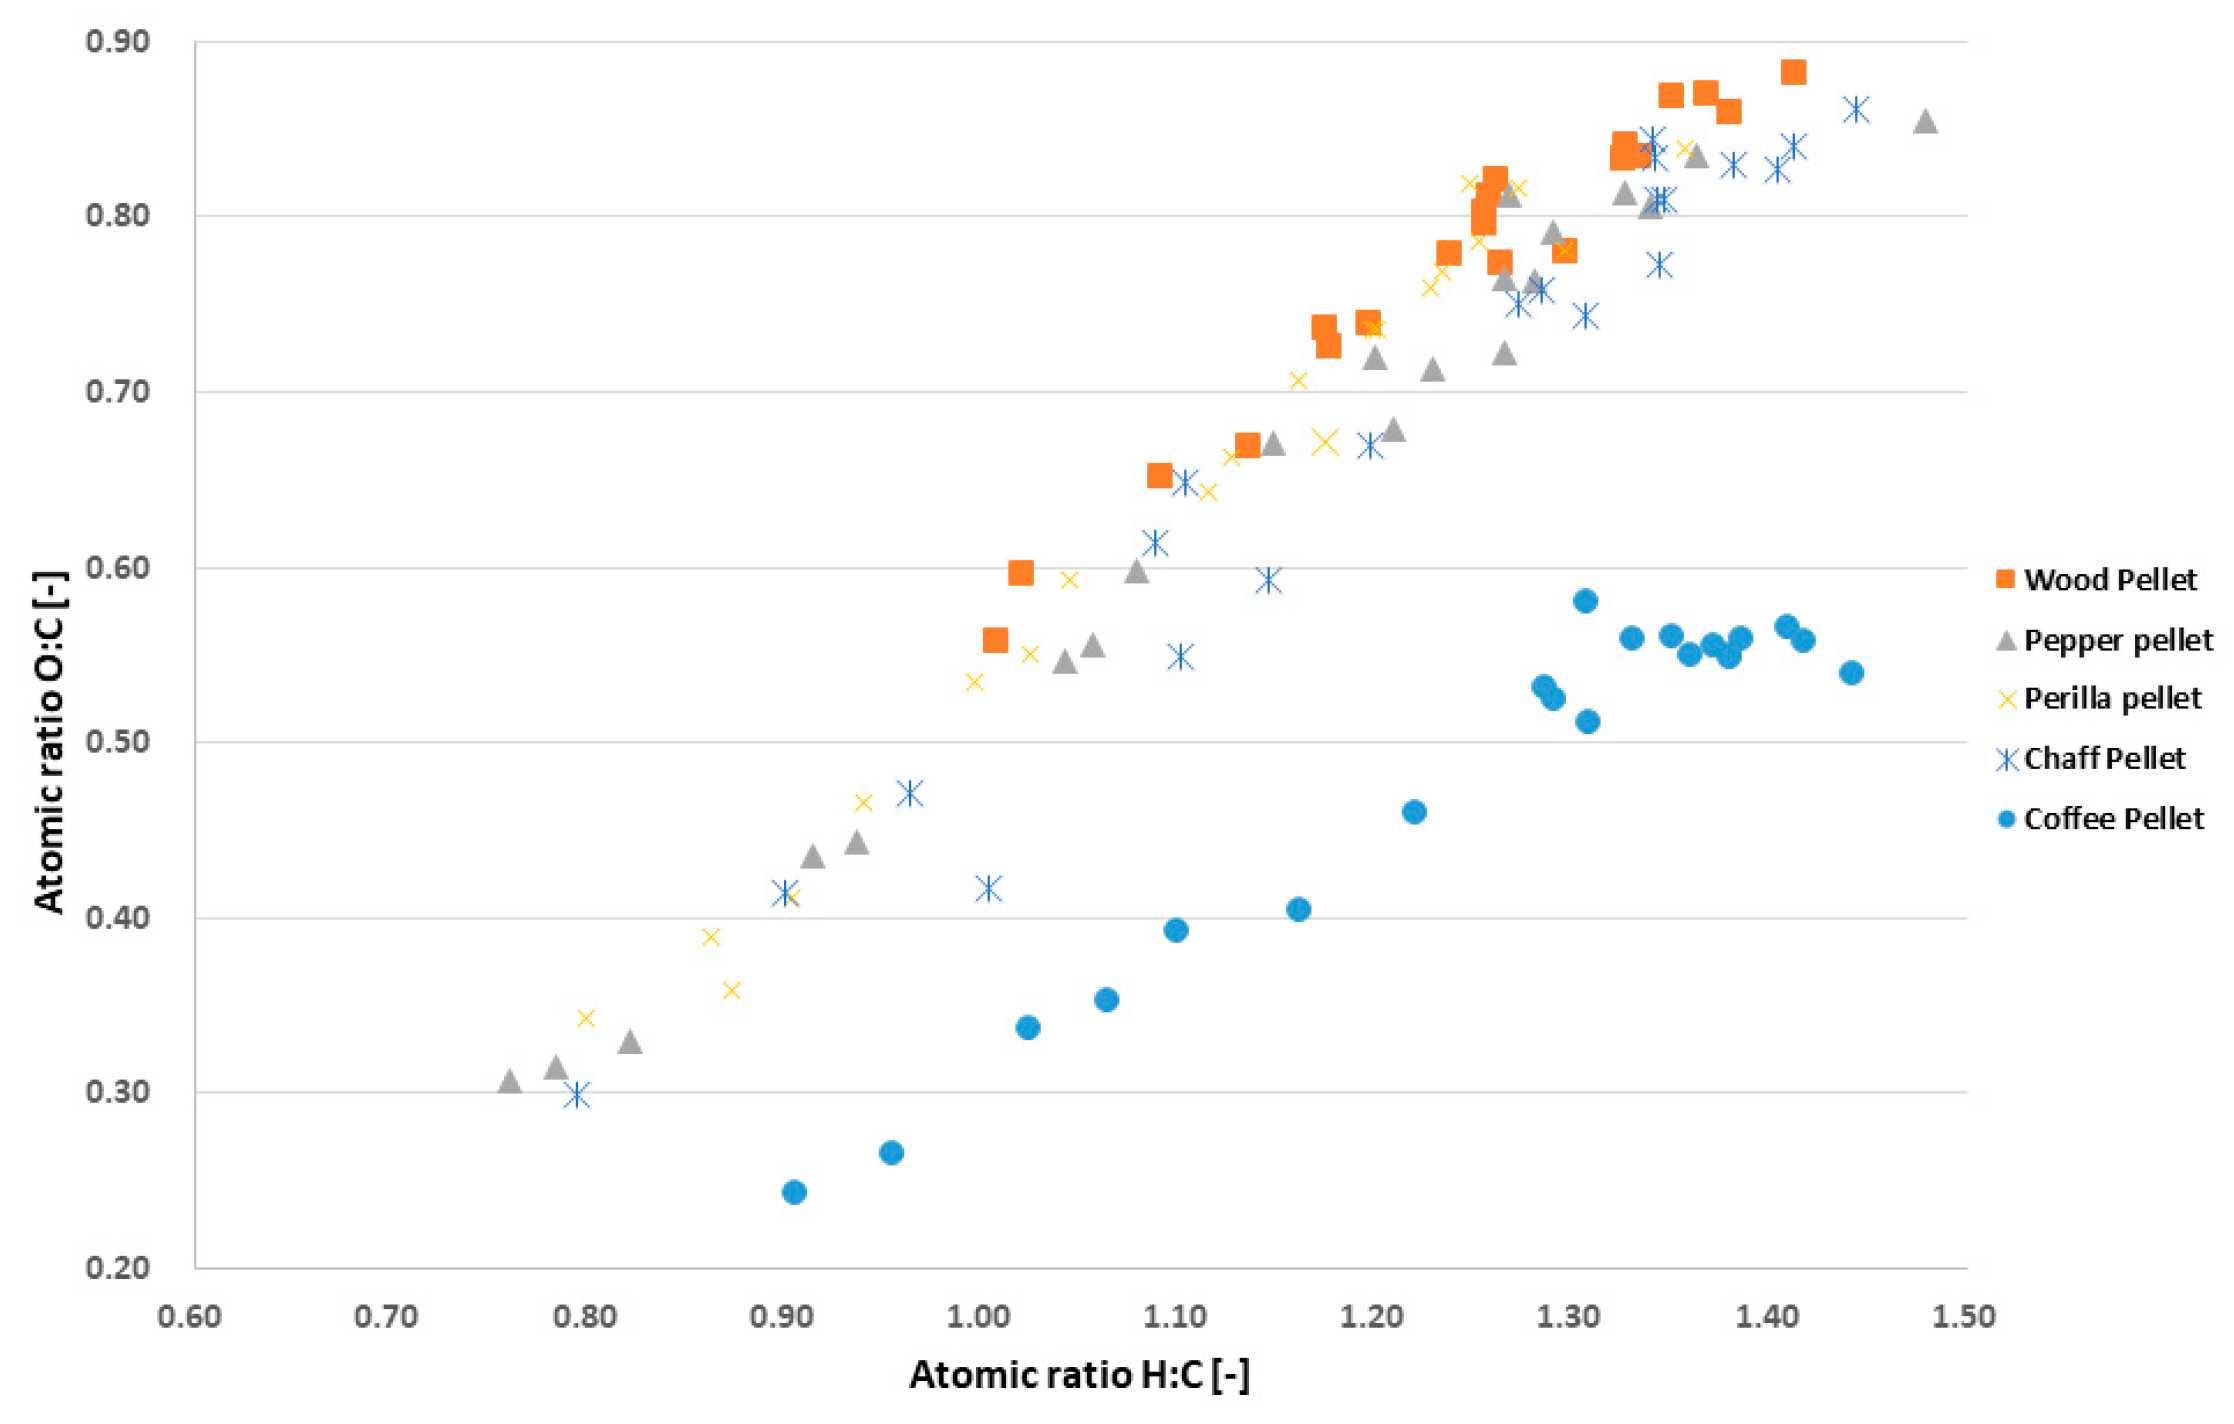
2.3.1. Ultimate Analysis and Van Krevelen Diagram

The elemental composition of a pellet can vary based on the torrefaction time and temperature. Among the elements used as biofuel, hydrogen, oxygen, and carbon primarily affect the combustion characteristics. To investigate these elemental changes, we used an elemental analyzer (EA3000, Eurovector, Pavia, Italy). Based on this analysis, we plotted the corresponding Van Krevelen diagram.

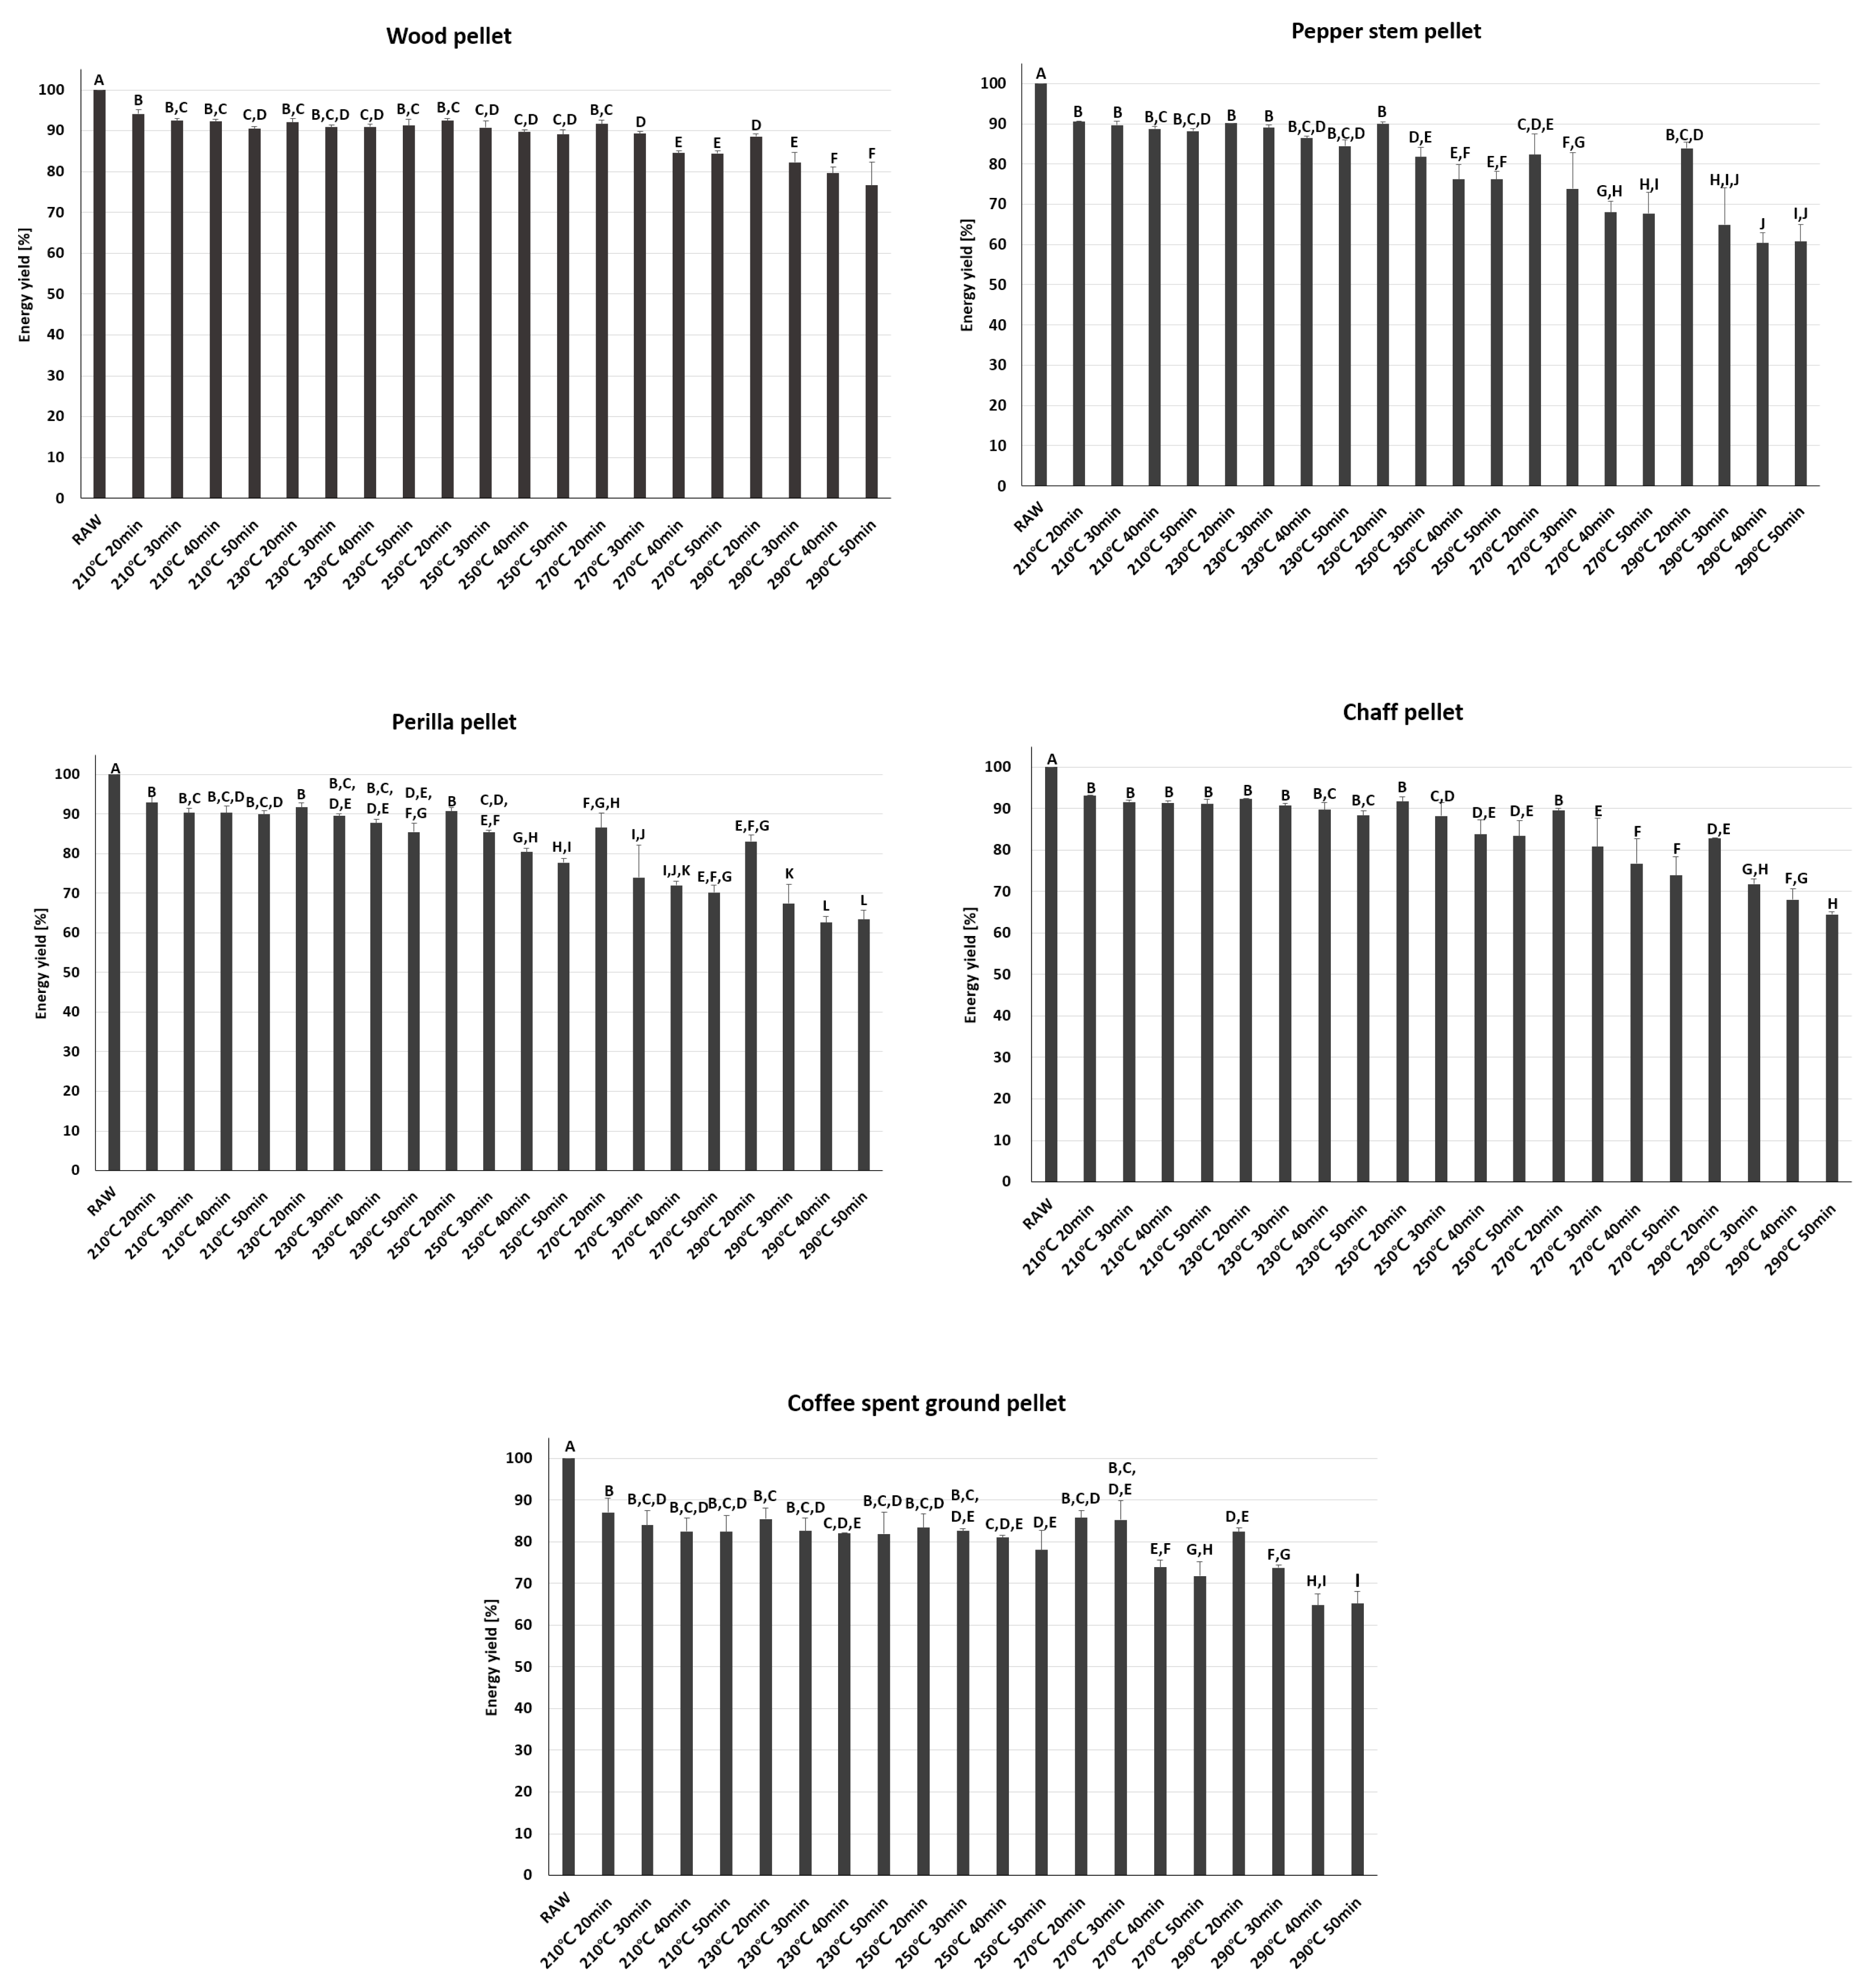
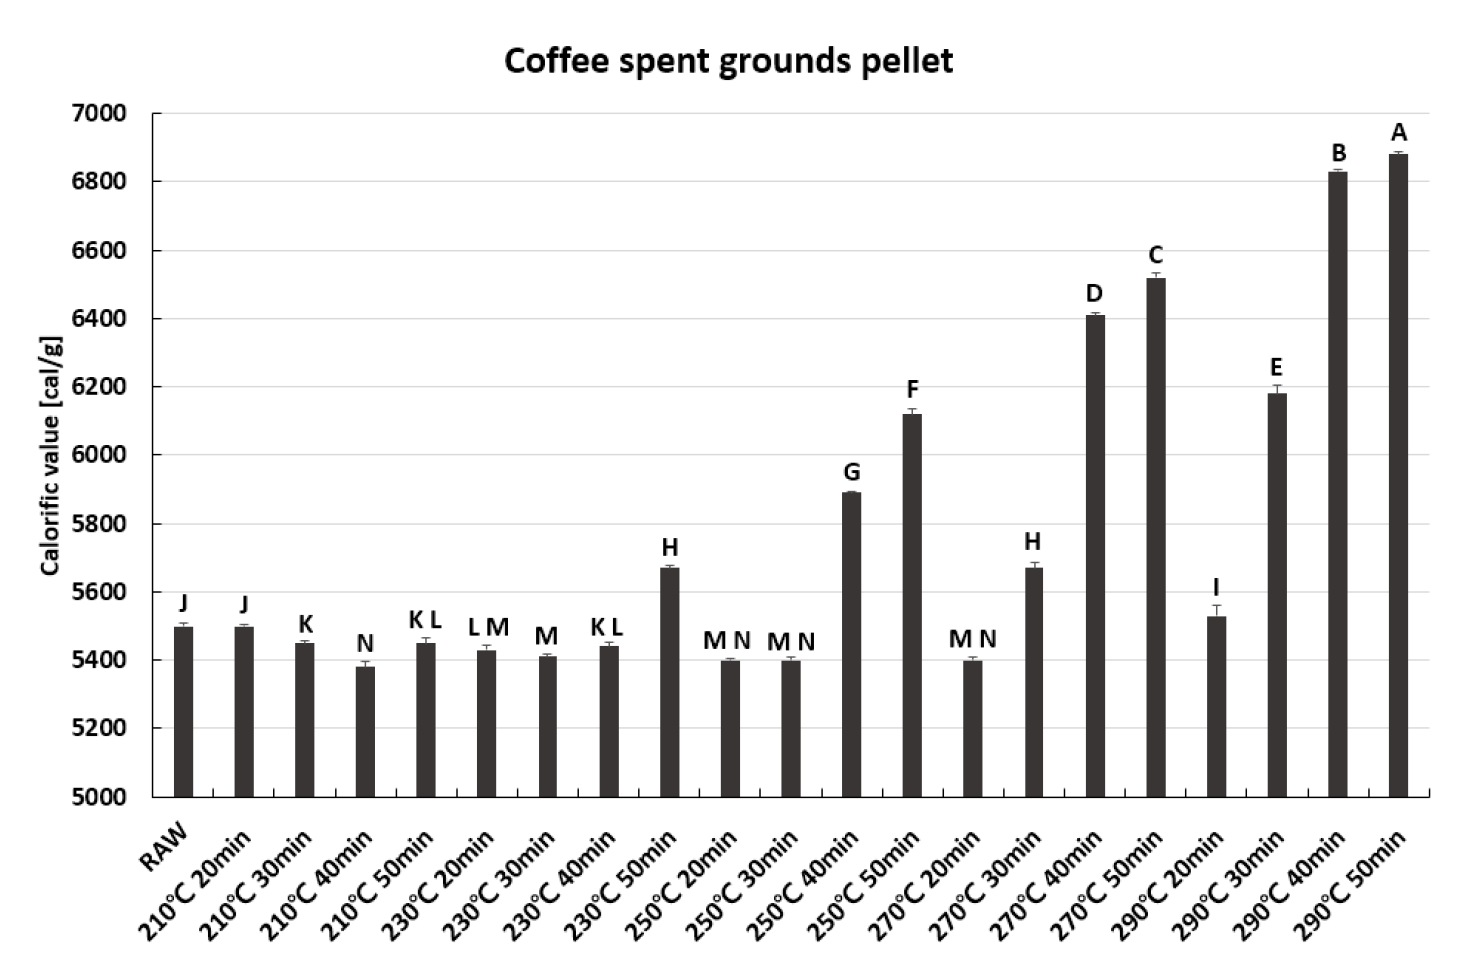
2.3.2. Calorific Value and Energy Yield

To estimate the calorific value change based on the process temperature and time, we measured the pellet calorific value three times using a calorimeter (6400, Parr Instrument Company, Moline, LI, USA) to investigate the increase in calorific value post torrefaction and to calculate the parameters related to mass loss. The energy yield was calculated as per Equation (2) [11].
EY   [ % ] = HHV torrefied HHV raw × MY ,
where, EY is energy yield and HHVtorrefaction and HHVraw are the higher heating value of torrefied pellet and the higher heating value of raw pellet.

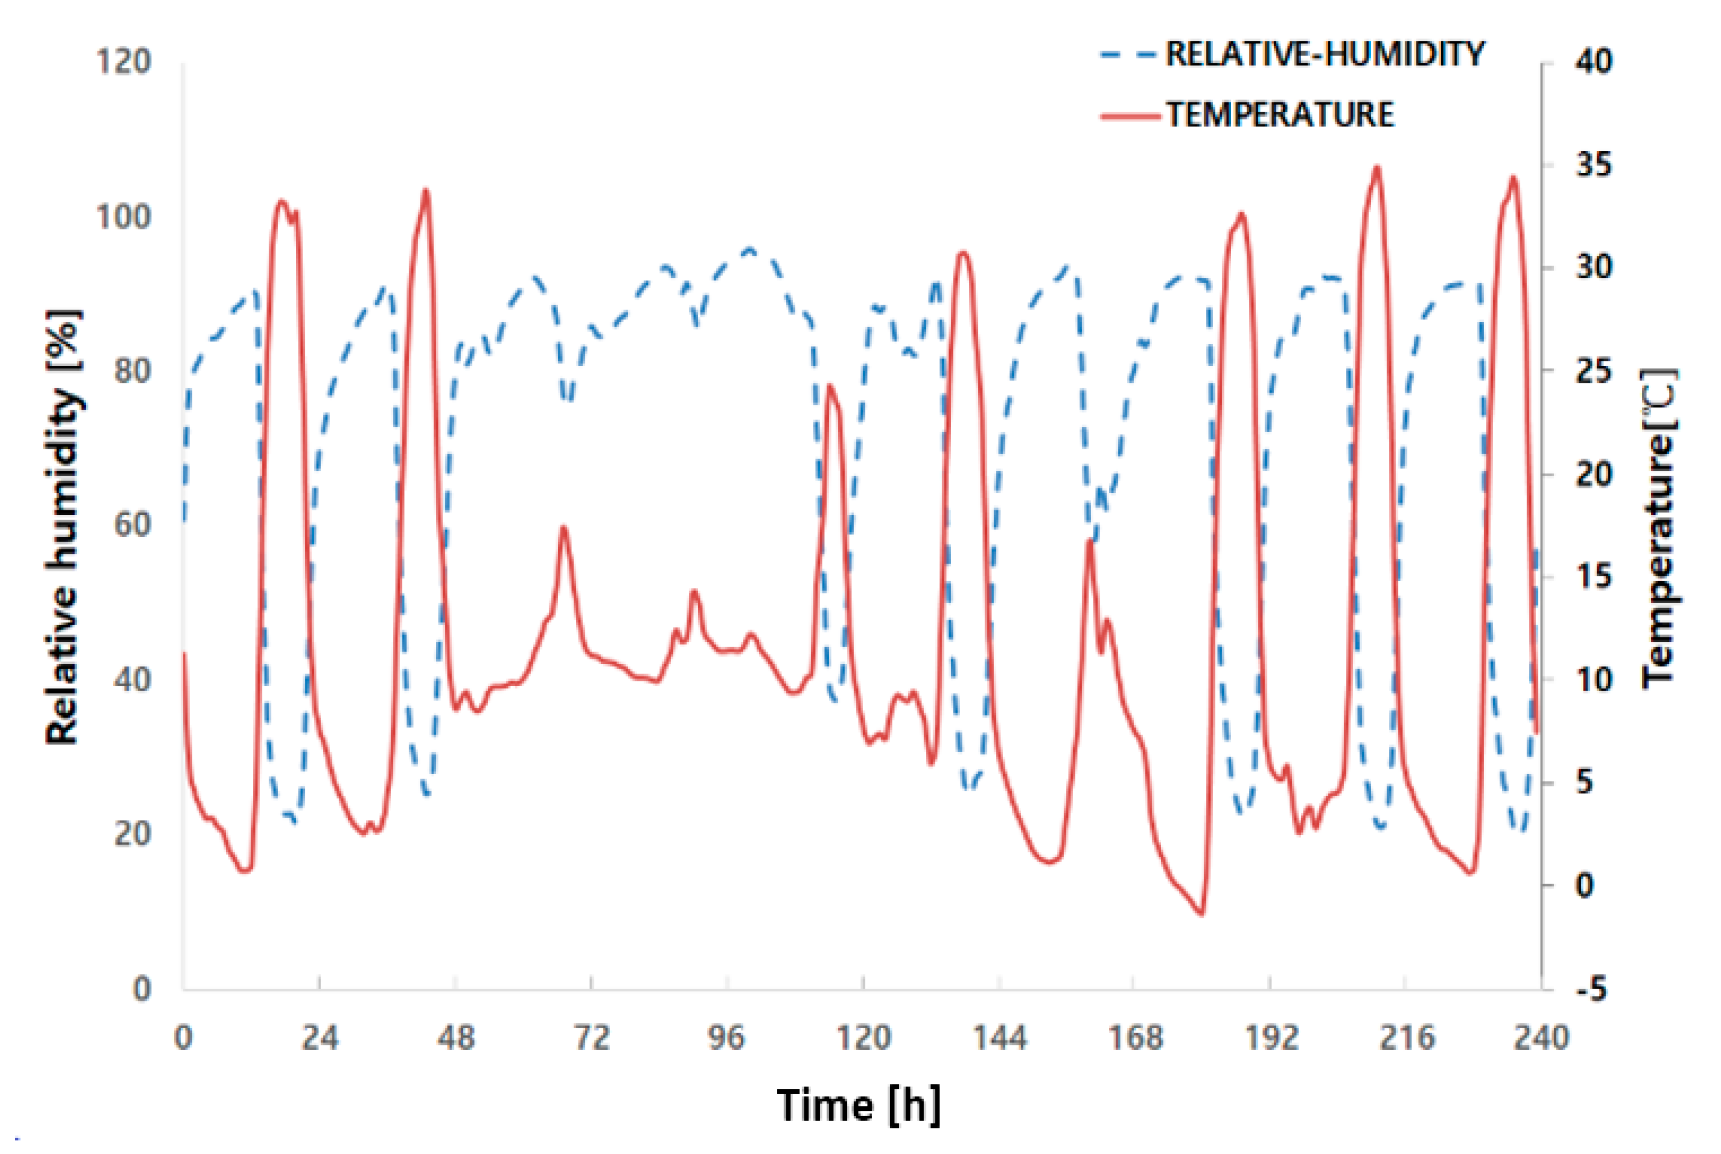
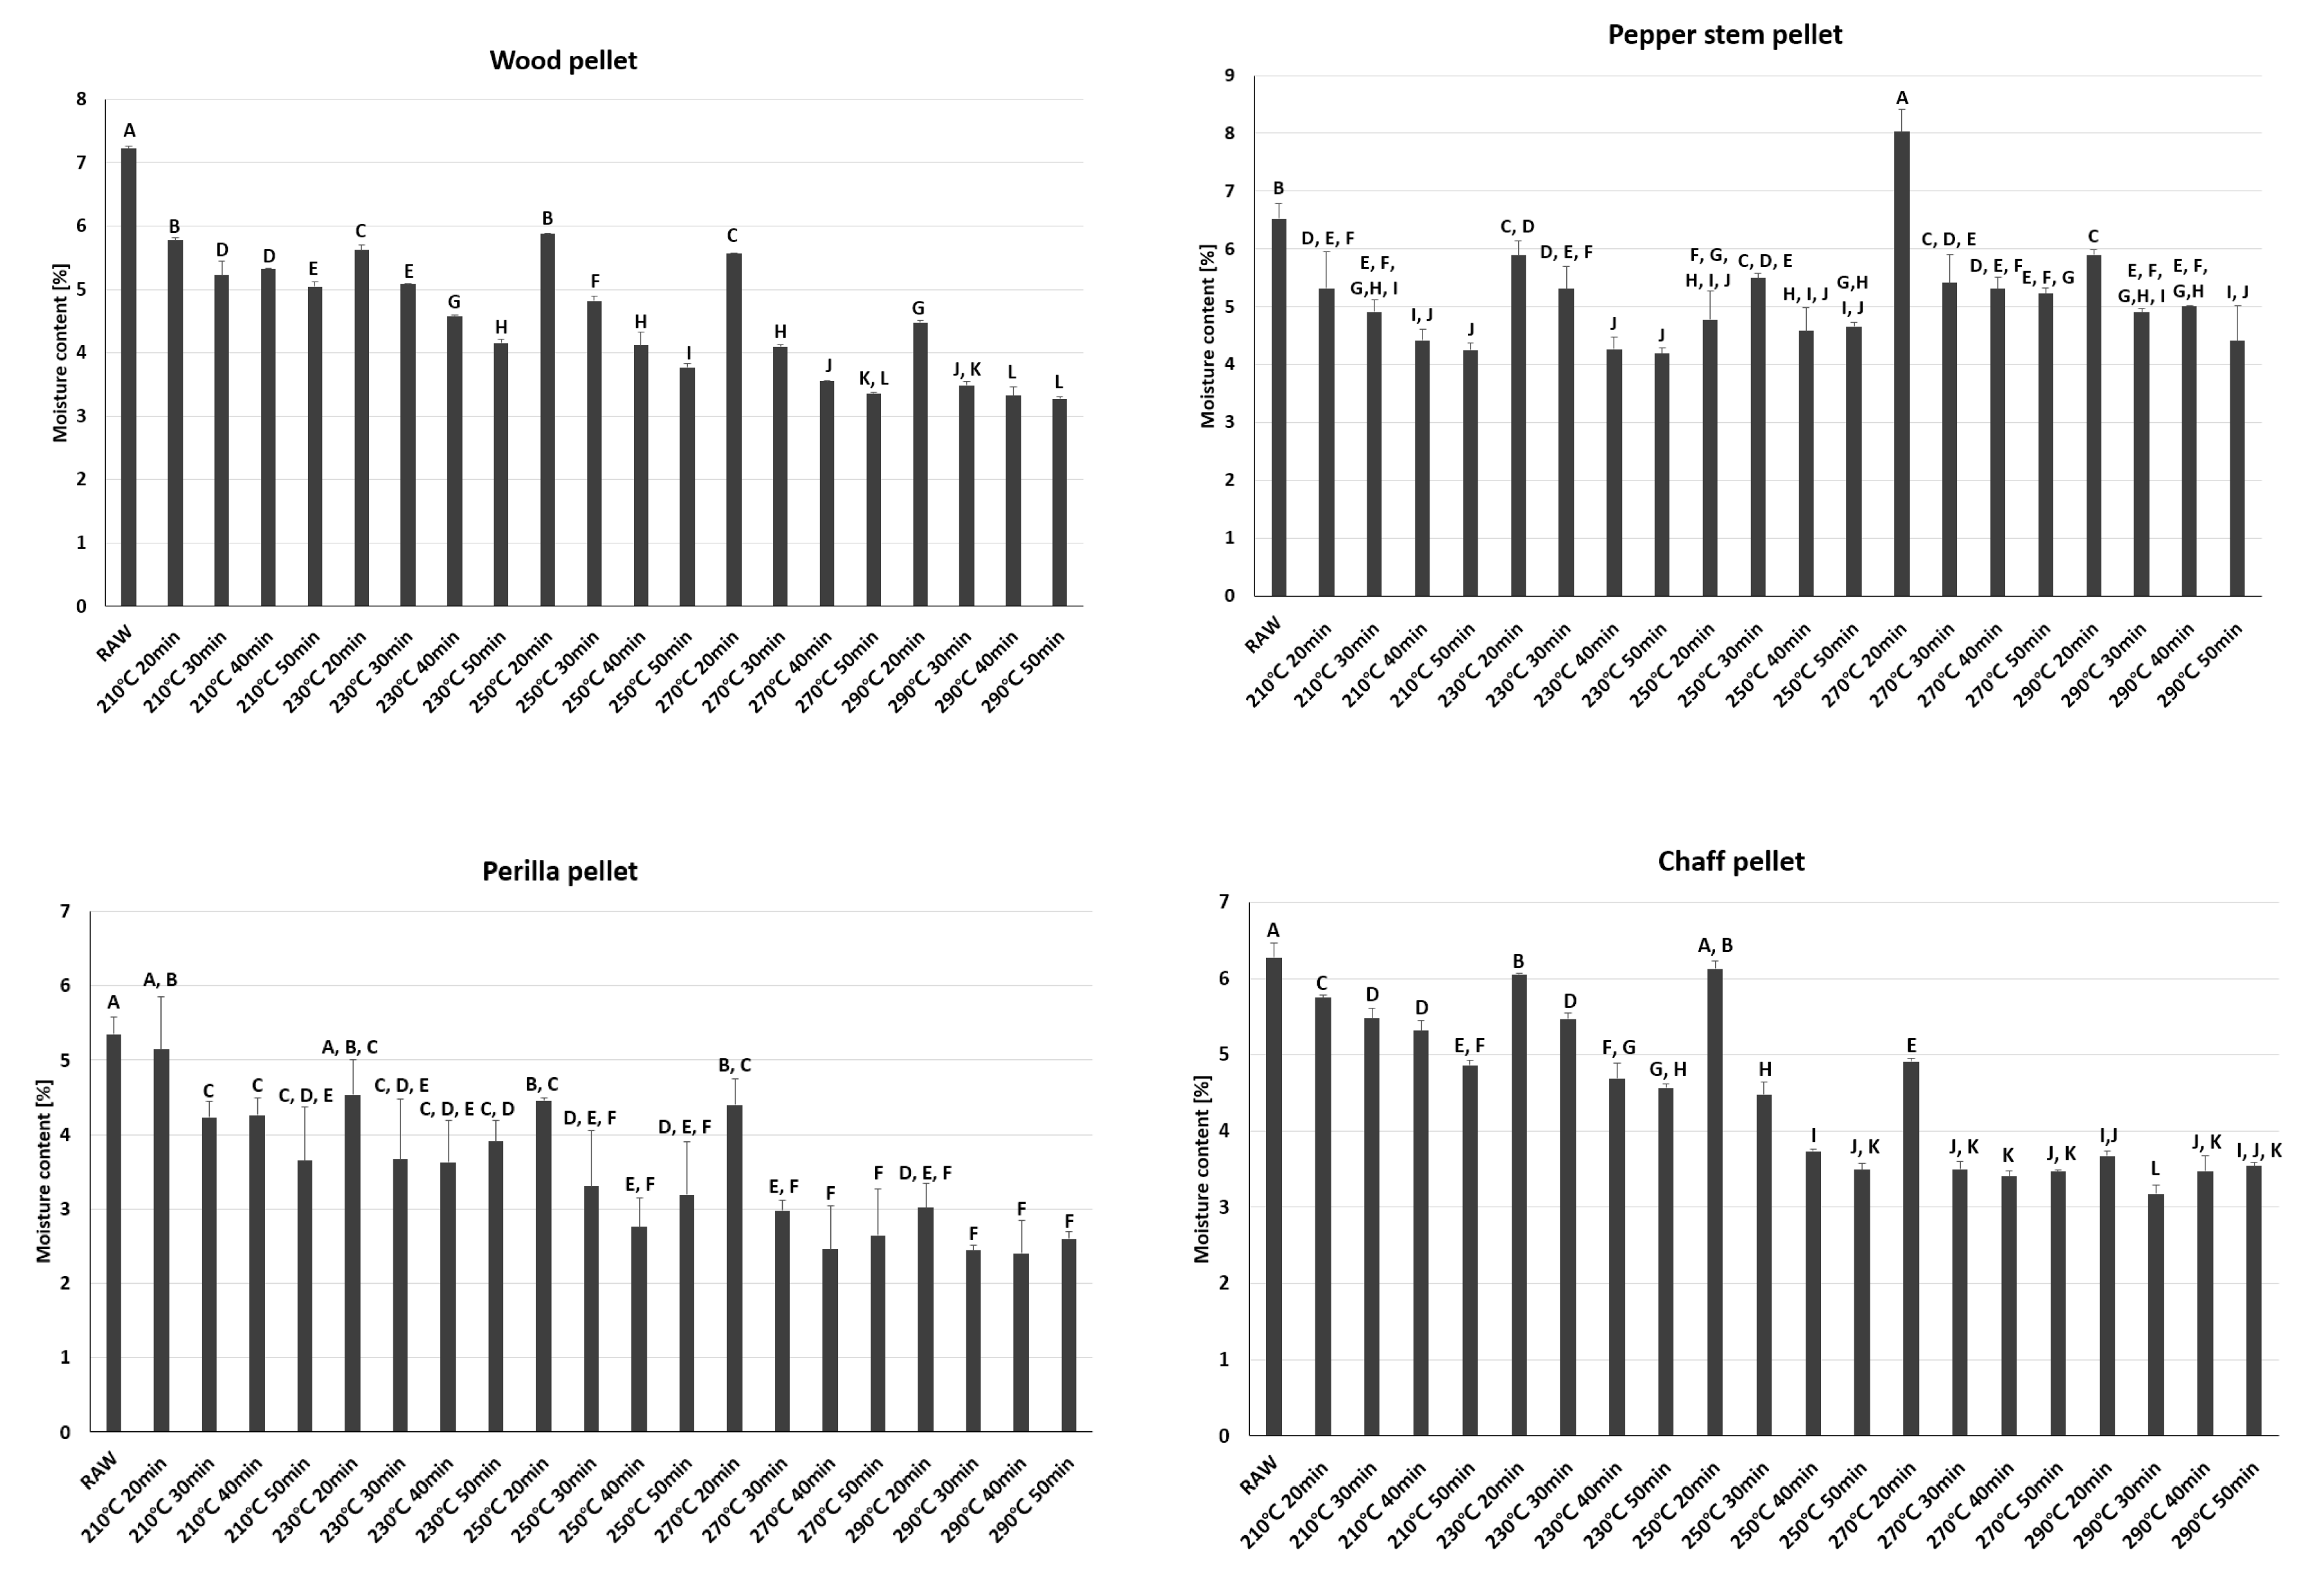
2.3.3. Hygroscopicity Evaluation

Woody biomass exhibits hygroscopicity, which means that the woody biomass moisture content increases no matter where it is during storage [12,13]. This in turn causes a calorific value drop along with damage from fungi. To evaluate hygroscopicity, each pellet and torrefied pellet were placed in a sealed greenhouse with a humidifier for 10 days. Subsequently, the moisture content differences were measured three times per each experimental case using a moisture analyzer (MA 35, Sartorius, Germany). To simulate actual field conditions, the temperature was set in the range of −2 to 35 °C and relative humidity in the range of 20% to 95%.

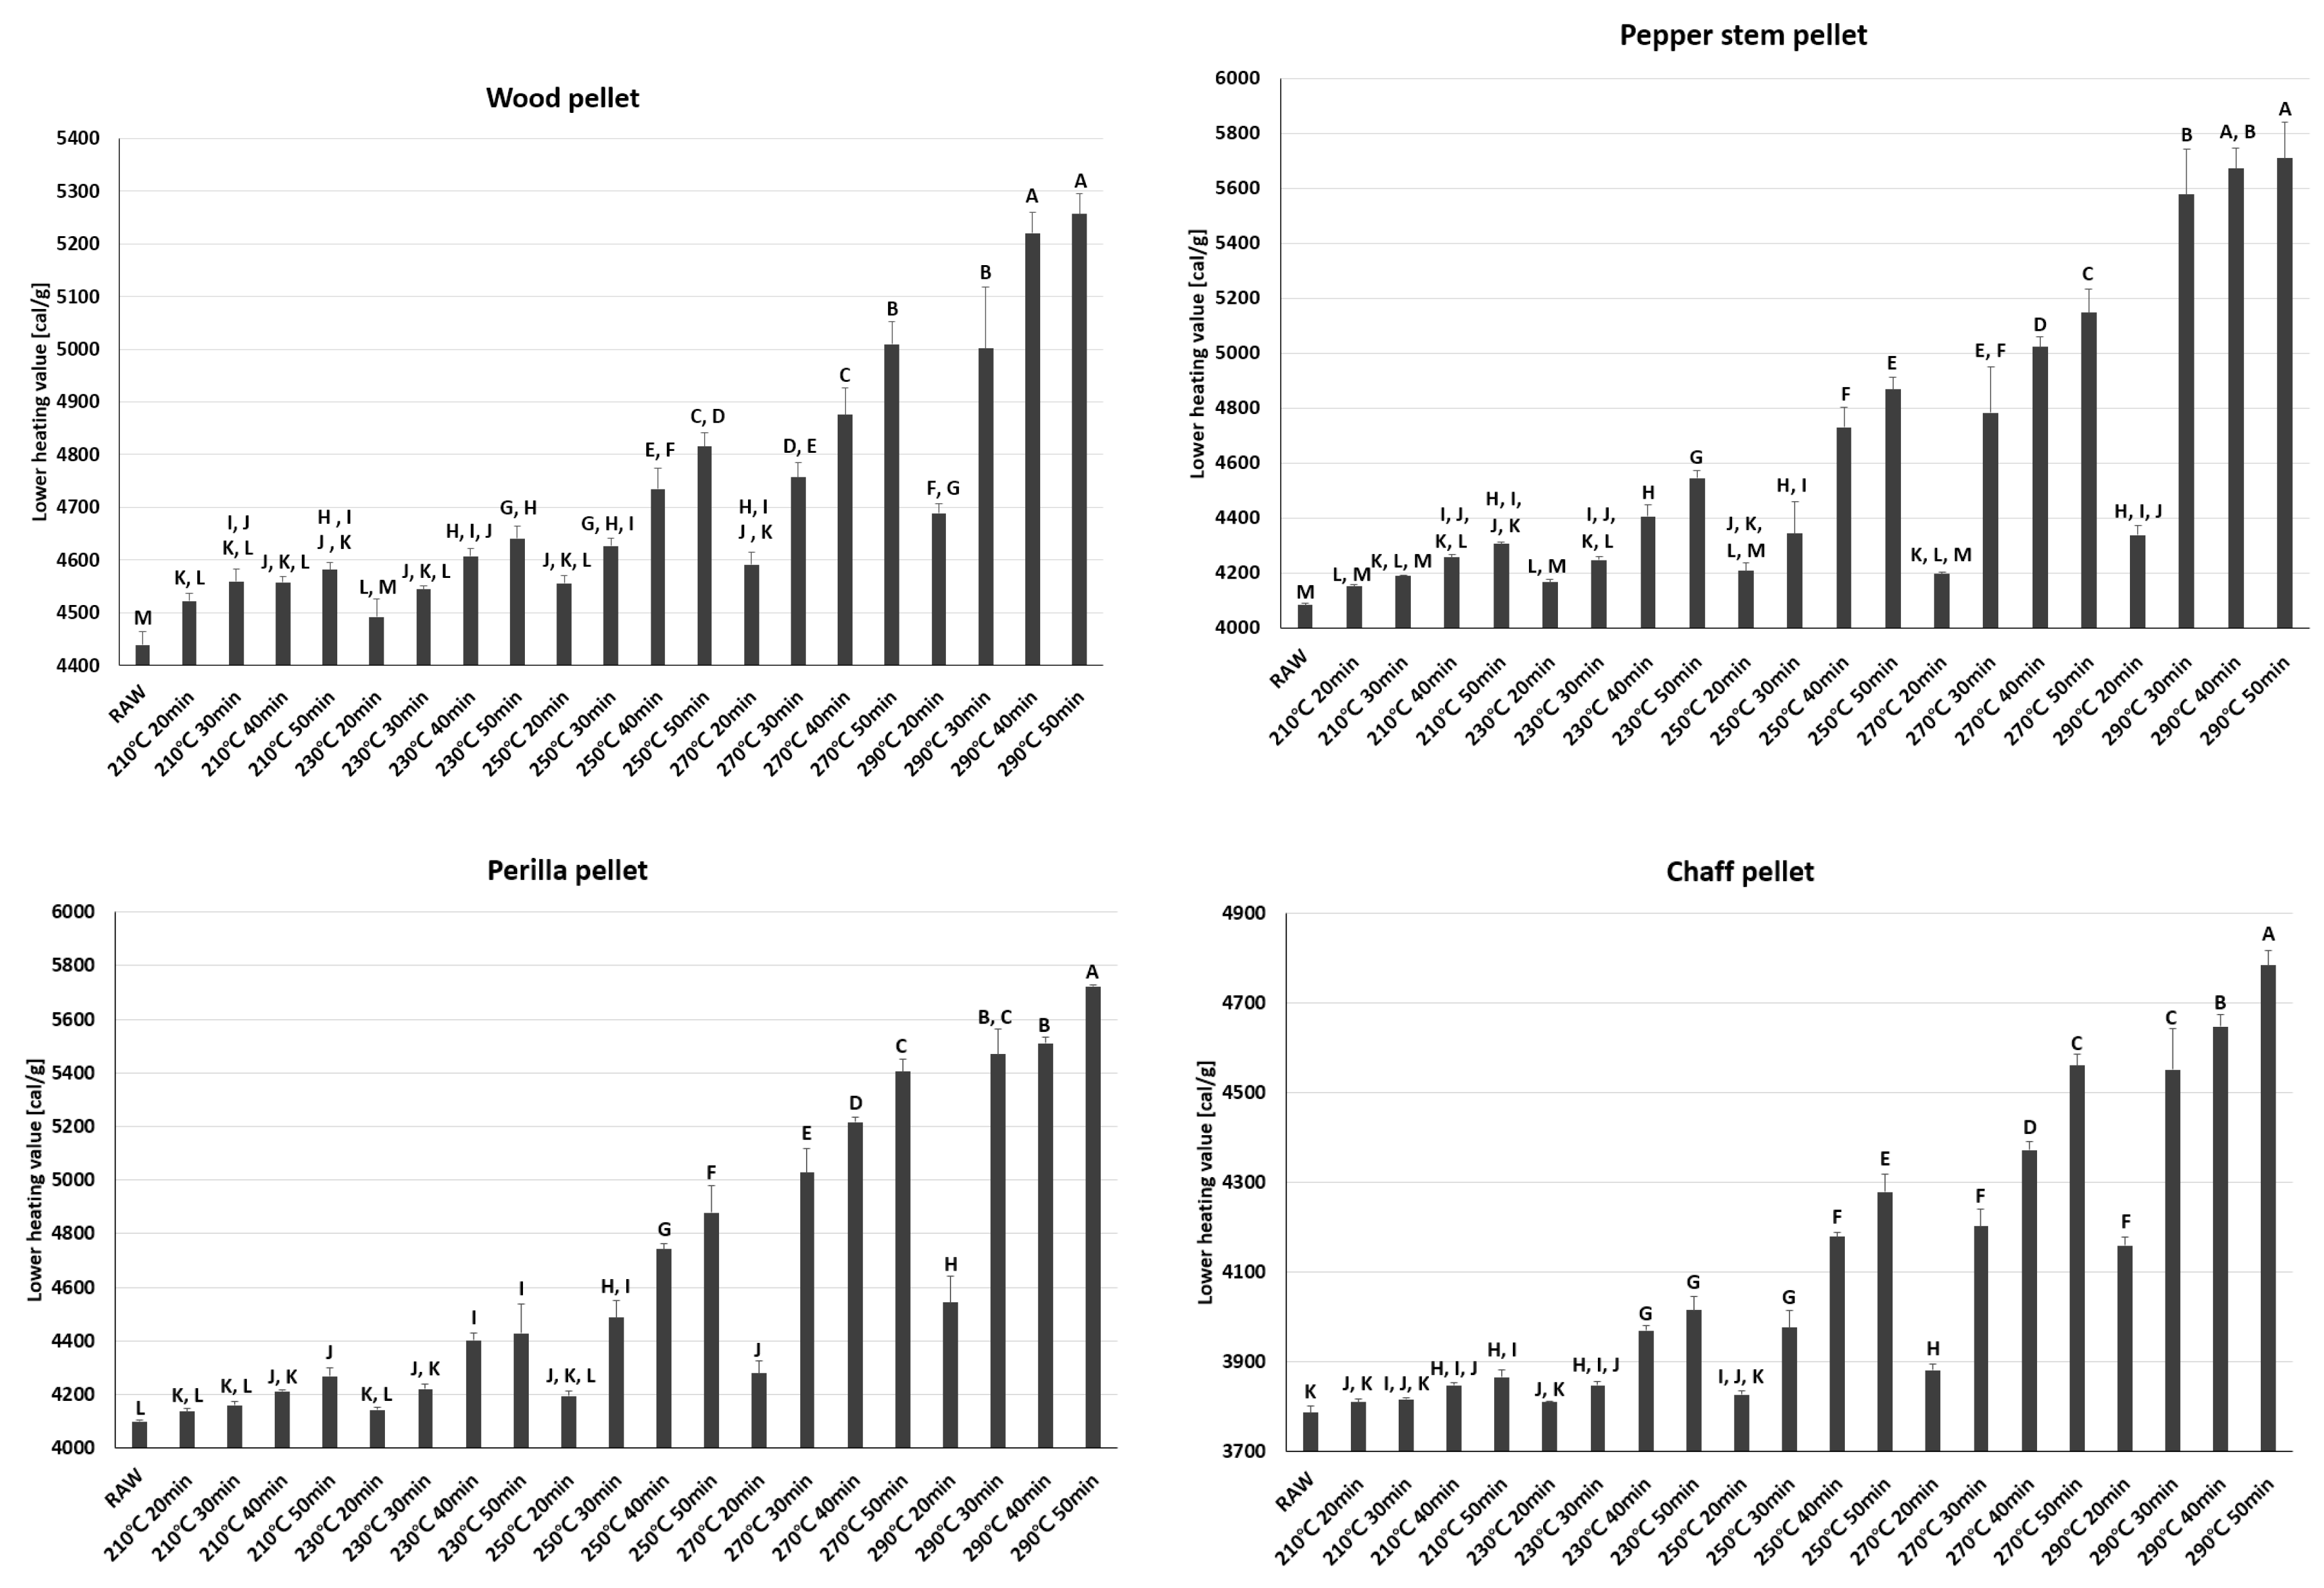
2.3.4. The Lower Heating Value (LHV) and Exergy Analysis

Biomasses are used as fuel under air-dry conditions, rather than bone-dry conditions. Therefore, they lose their energy through the latent heat of water. The resultant energy is called the lower heating value, and it can be expressed as follows Equation (3) [14]:
LHV = HHV h g ( 9 H 100 + MC 100 ) ,
where, LHV is the lower heating value, HHV is the higher heating value, hg is latent heat of vaporization, H is hydrogen element ratio in biomass, and MC is moisture content of biomass.
Exergy is defined as the available energy fraction of the supplied energy; in other words, it is the useful energy. The exergy of biomass can be expressed as follows Equation (4) [15]:
Ex = β LHV ,
β = 1.0438 + 0.0158 ( H C ) + 0.0813 ( O C )   ( O / C     0.5 ) ,
β = 1.0414 + 0.177 ( H C ) 0.3328 ( O C ) [ 1 + 0.0537 ( H C ) ] 1 0.4021 ( O C )   ( O / C   >   0.5 ) ,
where, Ex is exergy and H, O, C are the hydrogen, oxygen and carbon element ratio in biomass respectively.
However, we note that Equation (4) refers to the exergy per unit mass, and not the exergy of the remains. Therefore, we used Equation (5) to express the useful exergy (UEx):
UEx = MY × Ex 100 .

3. Results

3.1. Torrefied Pellets

The selected agro-byproduct pellets were torrefied in an electrical furnace. A longer processing time and higher processing temperature corresponded to a darker pellet color similar to that of charcoal.

3.2. Mass Yield

The mass yield of each pellet for each process condition is summarized in Table 2. We note that wood pellets exhibit a higher mass yield due to their low thermal decomposition property. Specifically, other than WP, PEP exhibits the highest thermal decomposition at high temperatures, whereas CFP exhibits the highest initial mass reduction. We speculate that this result is due to the high moisture content of CFP. Each sample showed a difference in mass loss under same conditions. Degradation ratios of hemicellulose in terms of time and temperature are different, and these differences affect the component ratio when converted into percentage.

3.3. Ultimate Analysis and Van Krevelen Diagram

The changes in the elemental composition of each sample under various torrefaction process conditions are presented in Figure 2. For a higher temperature or longer processing time, the component ratio of carbon in biomass increases along with a corresponding decrease in oxygen and hydrogen. Nitrogen shows a relative increase due to the decrease in the ratio of oxygen and hydrogen. In the Van Krevelen diagram in Figure 3, the ratio of hydrogen to carbon (H/C) is represented along the x-axis and that of oxygen to carbon (O/C) is represented along the y-axis; these elements strongly influence the calorific value. Compared with other pellets, CFP exhibits a smaller set of values, possibly due to the removal of moisture and extracts during the drying process.

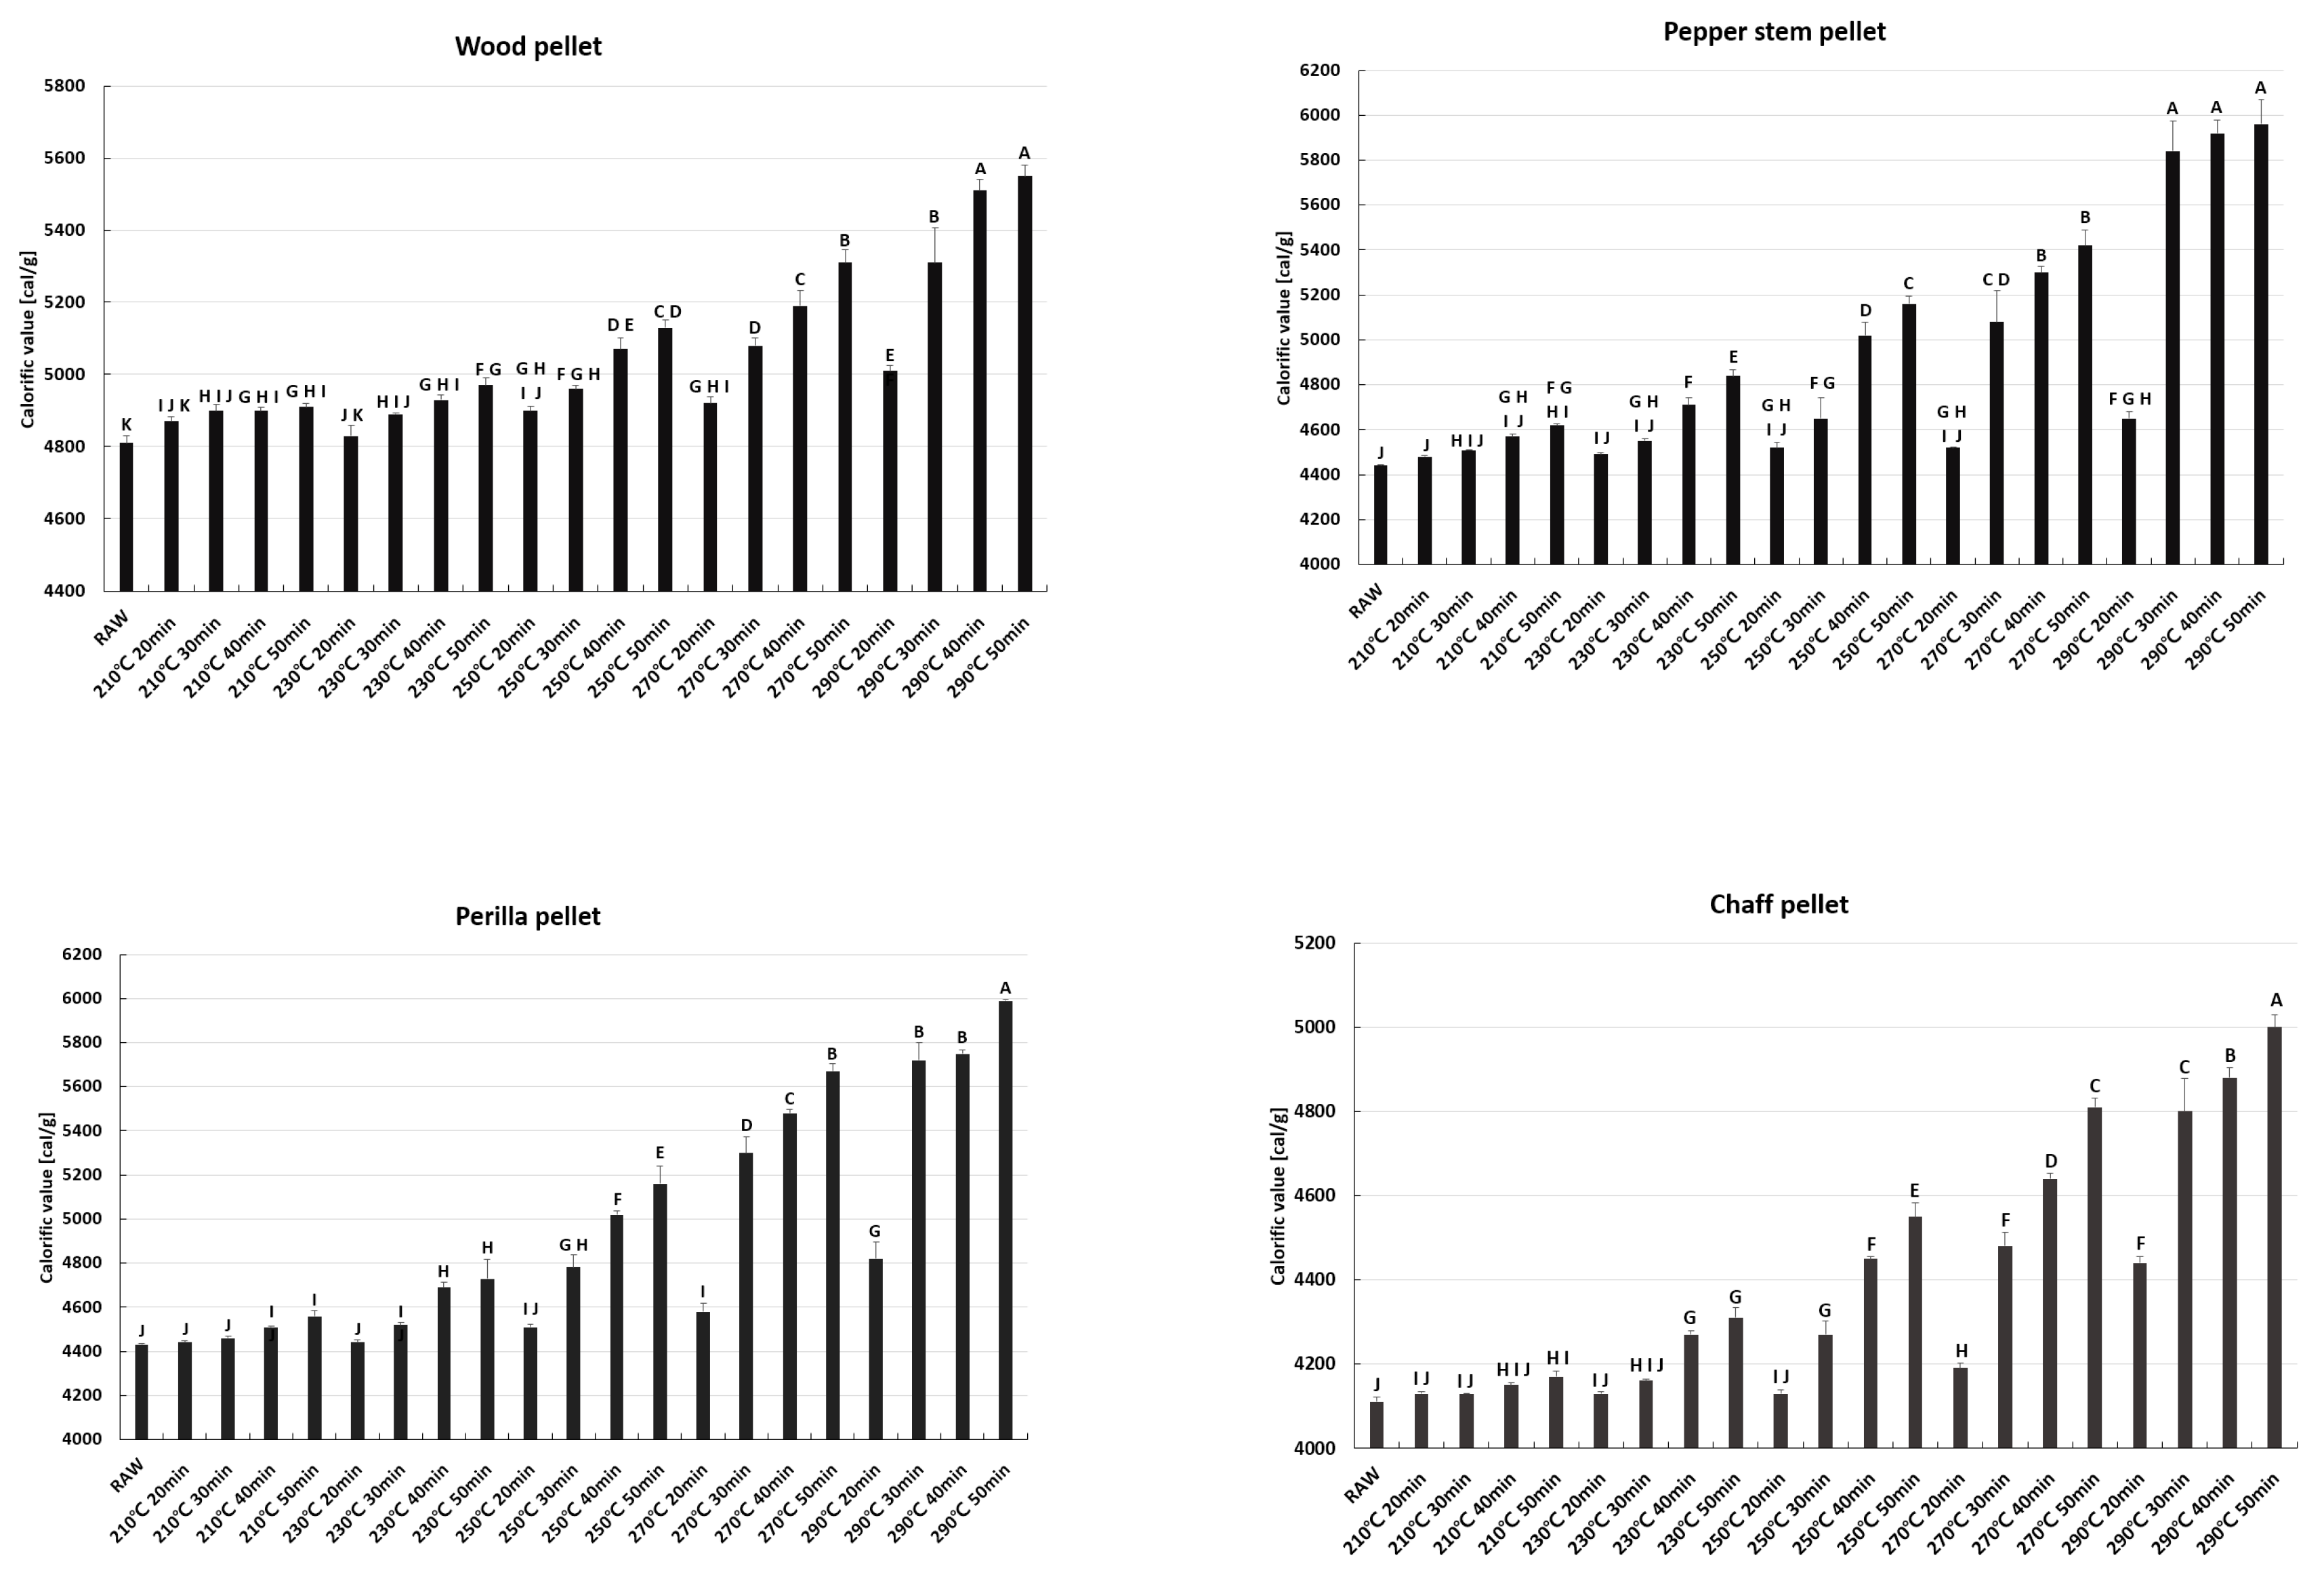
3.4. Calorific Value and Energy Yield

Figure 4 and Figure 5 depict the change in calorific value and energy yield for each sample under different process conditions respectively. The calorific value of WP increases from 4810 to 5500 kcal kg−1 at 290 °C after 50 min, which is an increase of 15%p. The calorific values of PEP and PRP increase by approximately 34%p and 35%p, respectively, due to their high thermal degradability. Further, the calorific value of CHP increases by 21%p. We speculated that the heating value of CHP did not increase greatly, possibly due to a large ash content in CHP. The calorific values of most of the pellets increase with longer process times and higher temperatures; however, the calorific value of CFP does not show a consistent trend across the process conditions. We posit that the coffee spent ground may already have reached the lower torrefaction temperature range during the coffee roasting process. Furthermore, the removal of the oil component of CFP during the torrefaction process can also reduce its calorific value. The subsequent increase in the calorific value is due to the torrefaction of the solids in the coffee spent ground. Furthermore, when compared with the other pellets, WP does not show a large calorific change; however, it does have a higher mass yield. To figure out the significant difference of each torrefied pellet’s calorific value, Duncan’s multiple test was conducted. It was showed that there were significant differences between process time and temperature. The energy yield of WP is higher than those of other pellets. In general, the energy yields of agro-pellets show a similar tendency. This make a slight increase in energy yield. Further, CFP exhibits a significantly low energy yield at less than 250 °C and after 30 min of torrefaction. This is because the calorific value of CFP and the mass yield decrease rapidly under these conditions. Further, the energy yields of the agro-pellets are less than 80% under severe torrefaction conditions above 270 °C. Further, Duncan’s multiple test was conducted for energy yield. Mass yield of torrefied pellets were decreased but their calorific values were increased so that significant difference between raw material pellet and torrefied pellets were observed. Based on these results, we estimated that the suitable torrefaction conditions for agro-pellets involve temperatures below 250 °C and a torrefaction time interval of 30 min.

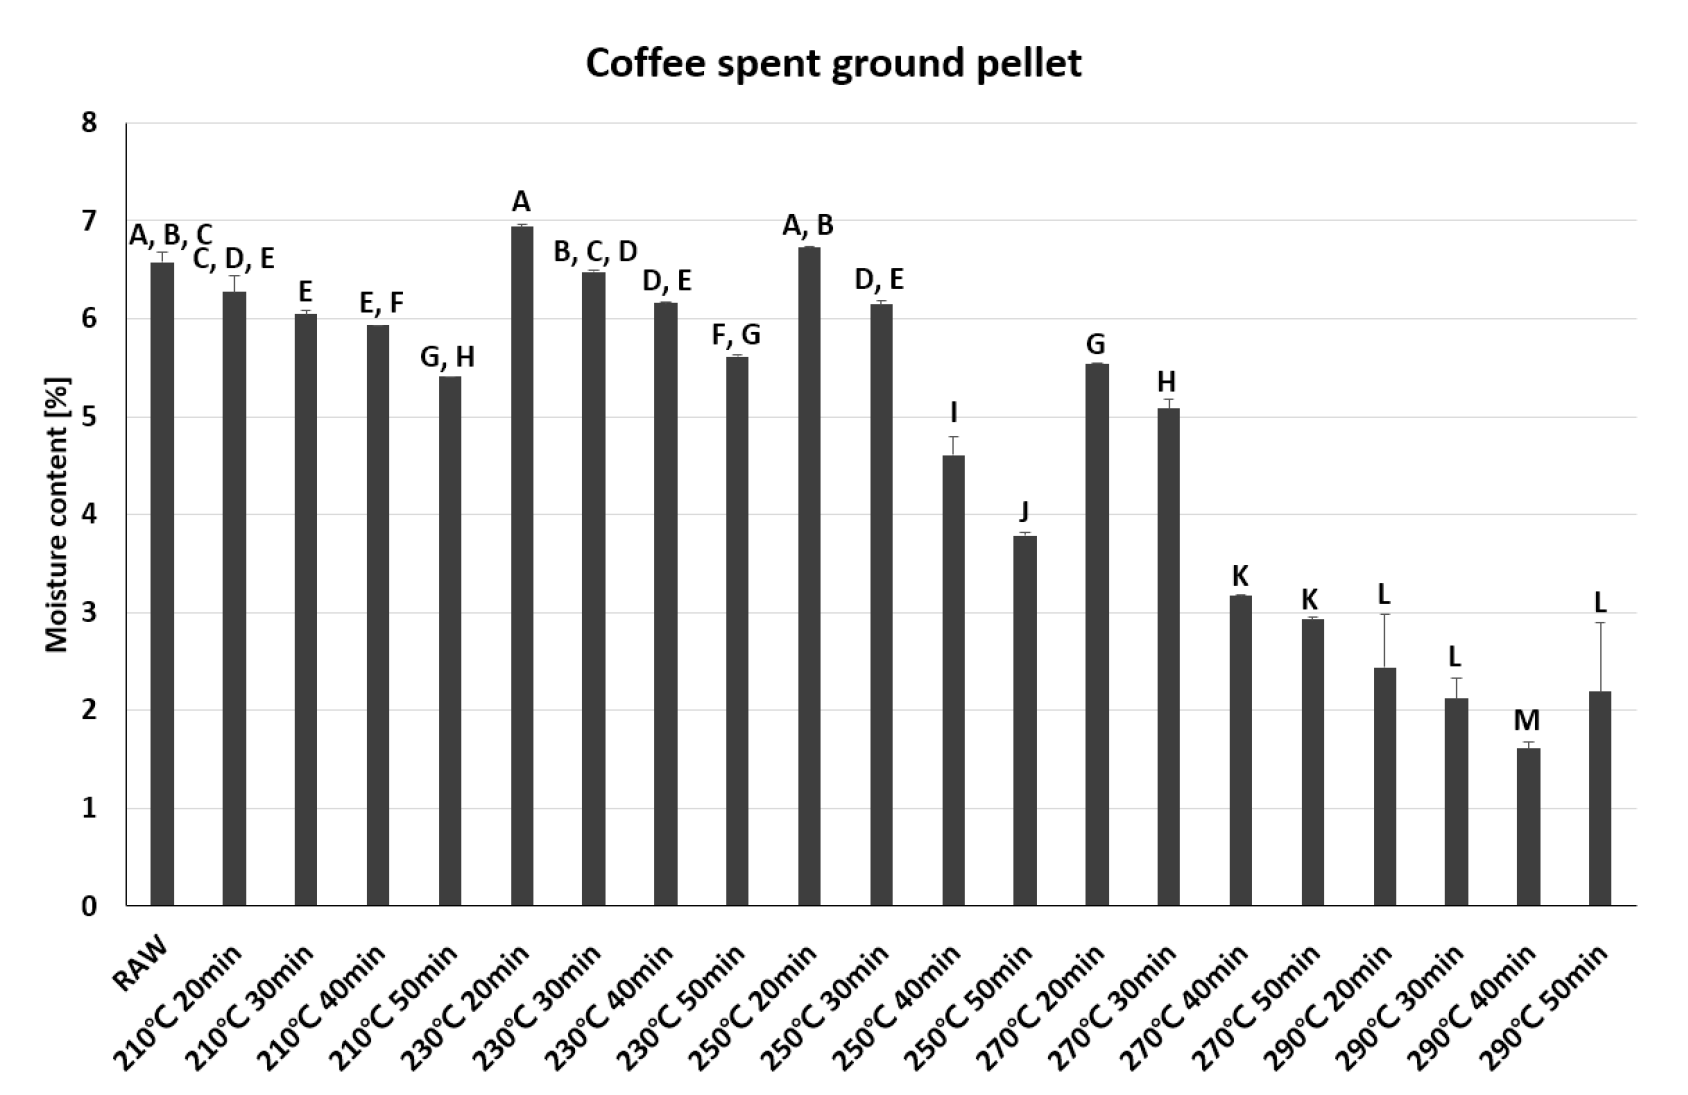
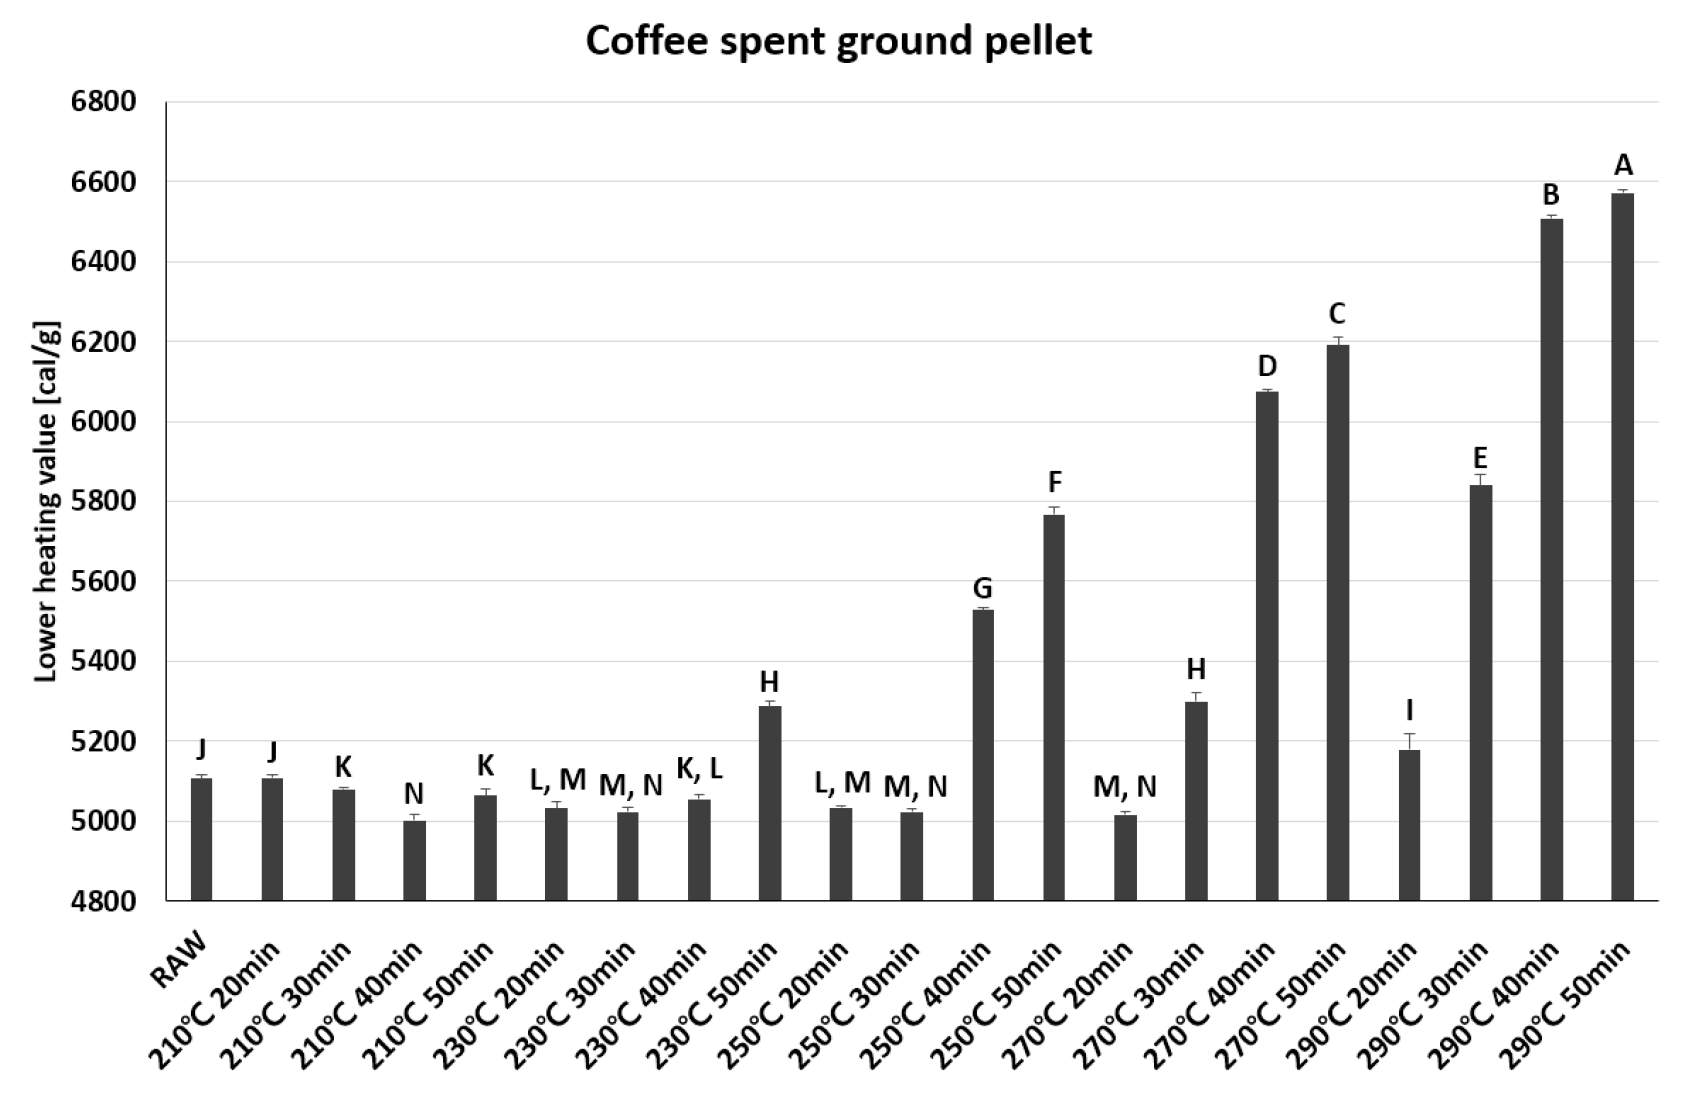
3.5. Hygroscopicity Evaluation and the Lower Heating Value

The ambient temperature and relative humidity were varied from −2 to 35 °C and from 21% to 96%, respectively. The detailed ambient conditions are presented in Figure 6. Figure 7 presents the changes in the moisture content (MC) of the pellets after a 10 days interval under various torrefaction conditions. We note that the MC of “un-torrefied” WP is 7%. Further, the MC is approximately 3% under the most severe torrefied conditions (290 °C, 50 min), and the other agro-pellets mostly exhibit low MC values relative to WP. It is highly probable that the component ratio of carbon may have increased and the ratio of hydrogen and oxygen at which water could be easily formed may have decreased due to the large mass loss of the other pellets relative to WP. The agro-pellets except for CFP exhibit approximately 2%p difference of MC, but a 5%p difference is observed for CFP. Further, some CFP samples exhibit higher MC than the untreated samples. We hypothesize that volatile materials in the CFP were removed during the torrefaction process instead of affording H–O bond transformations. However, under severe torrefaction conditions, there was no disruption of volatile matter, which led to H–O transformations.

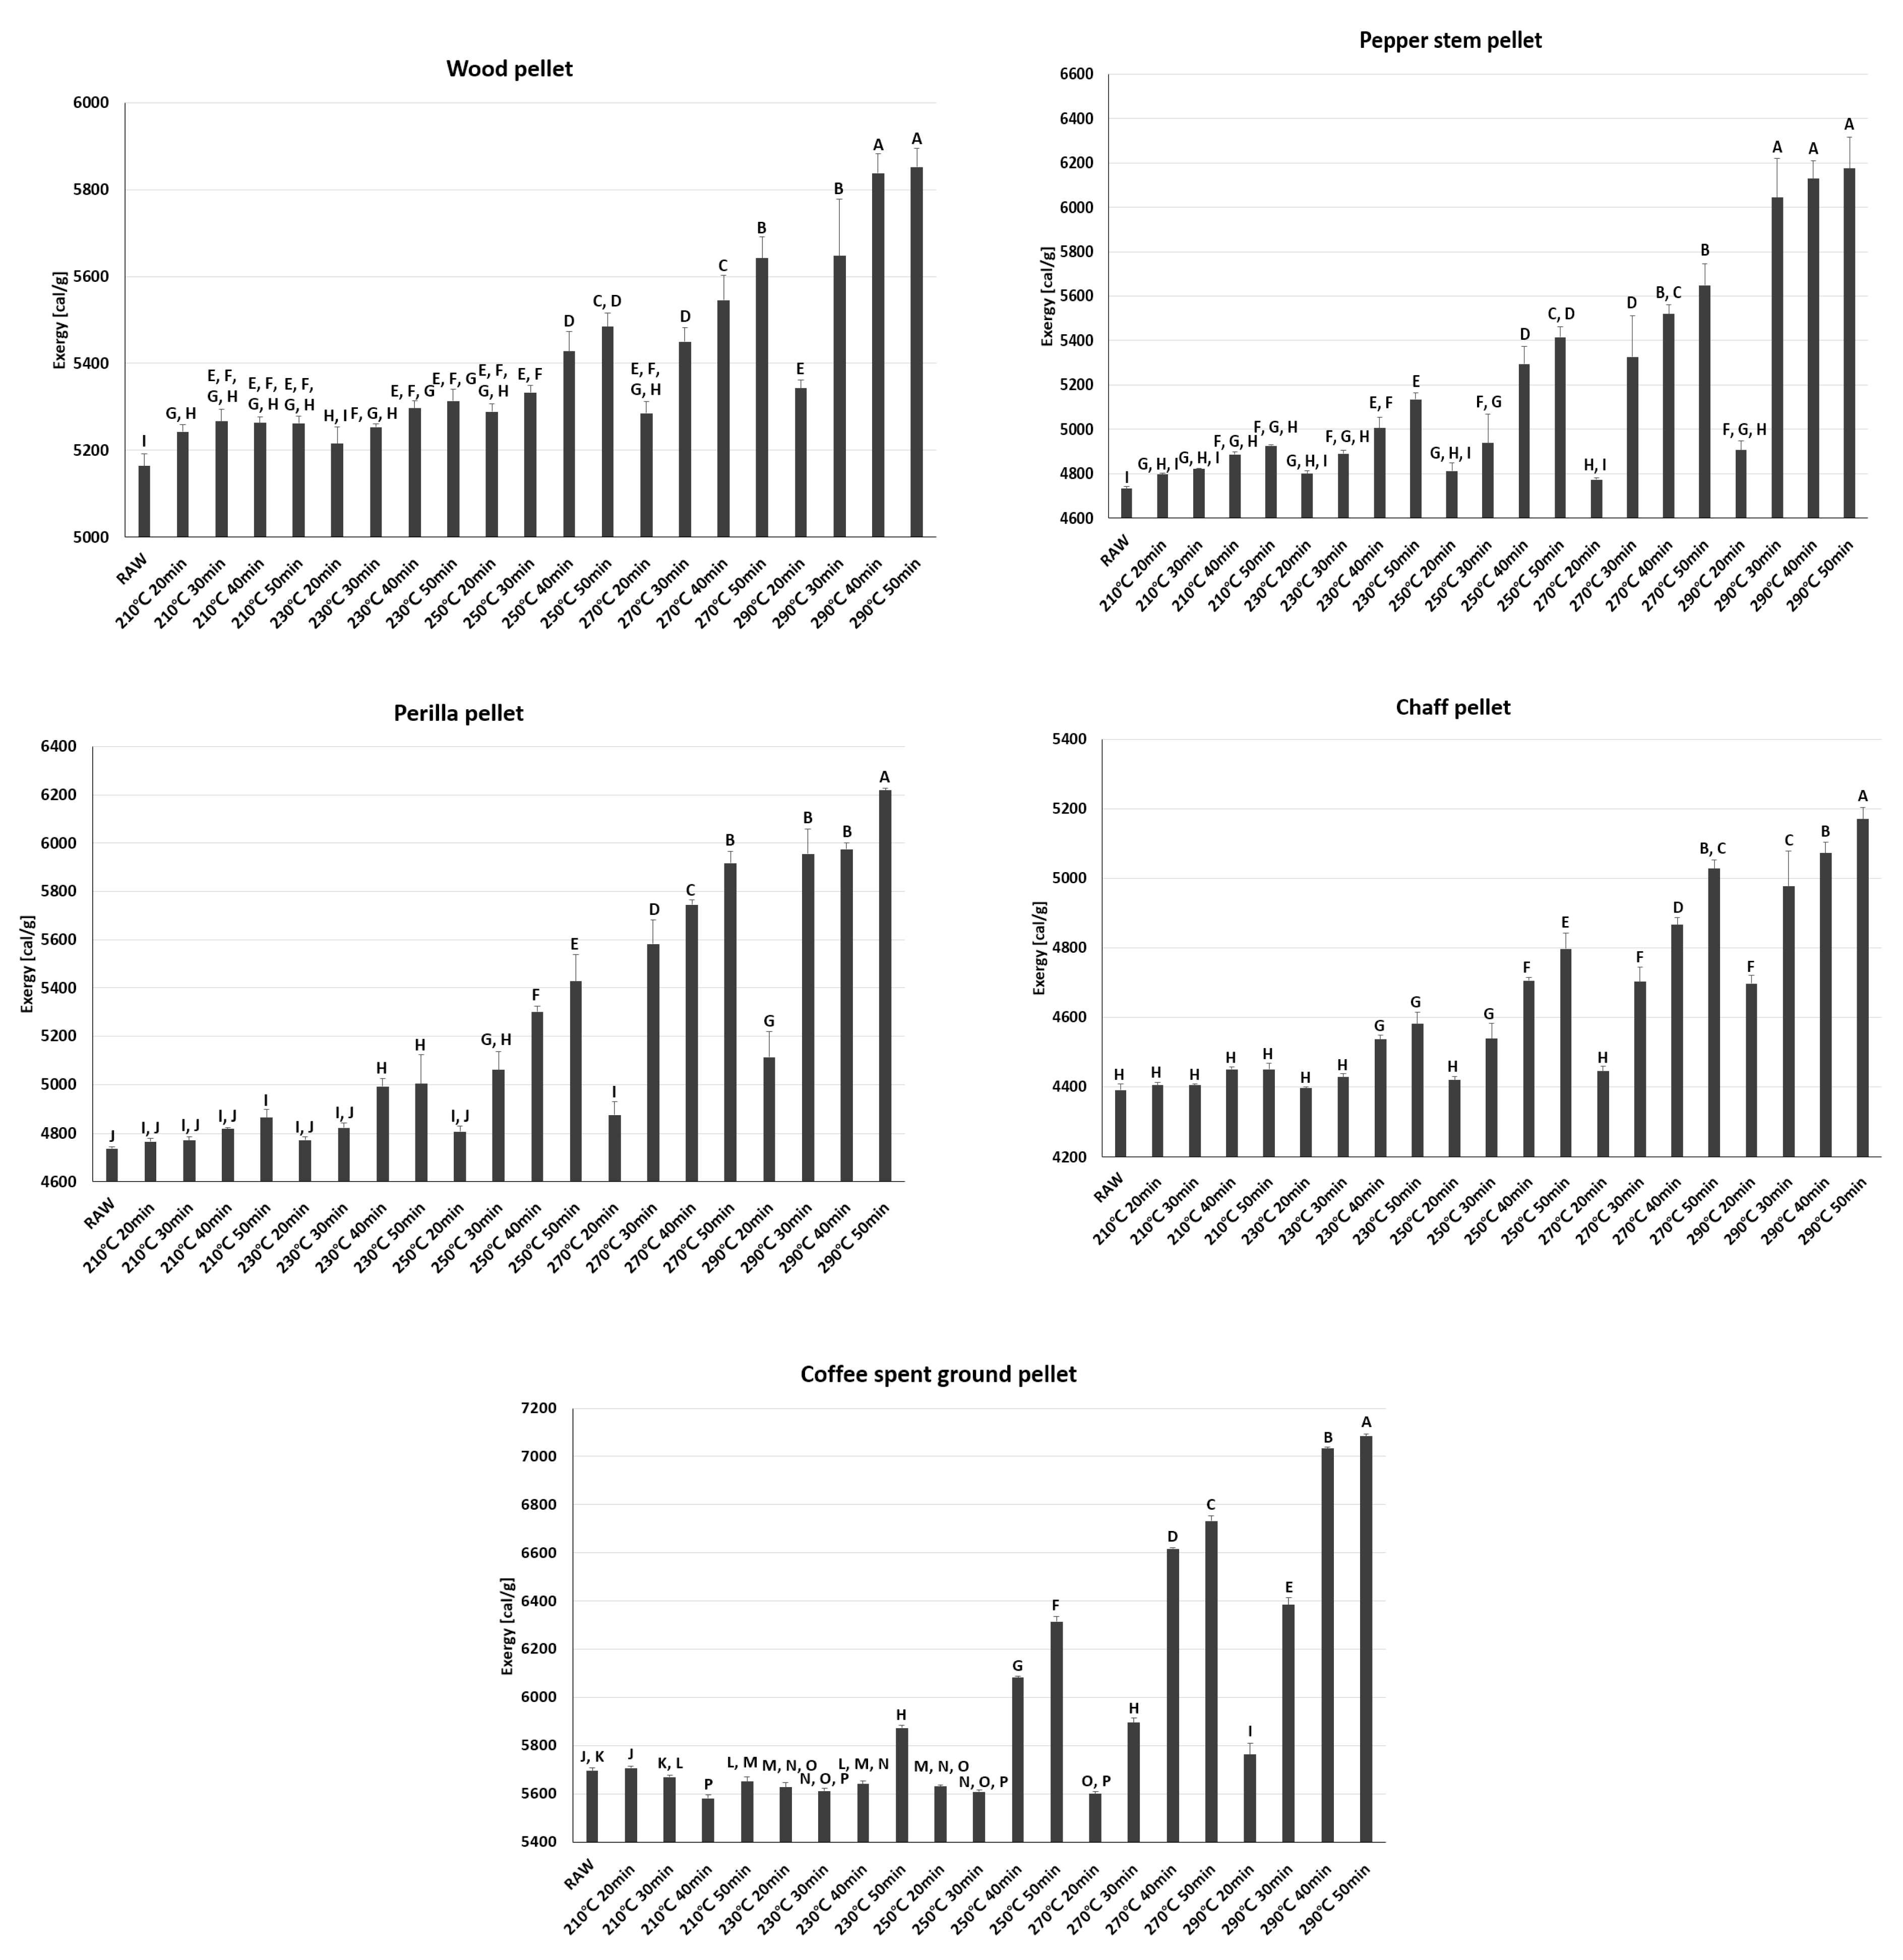
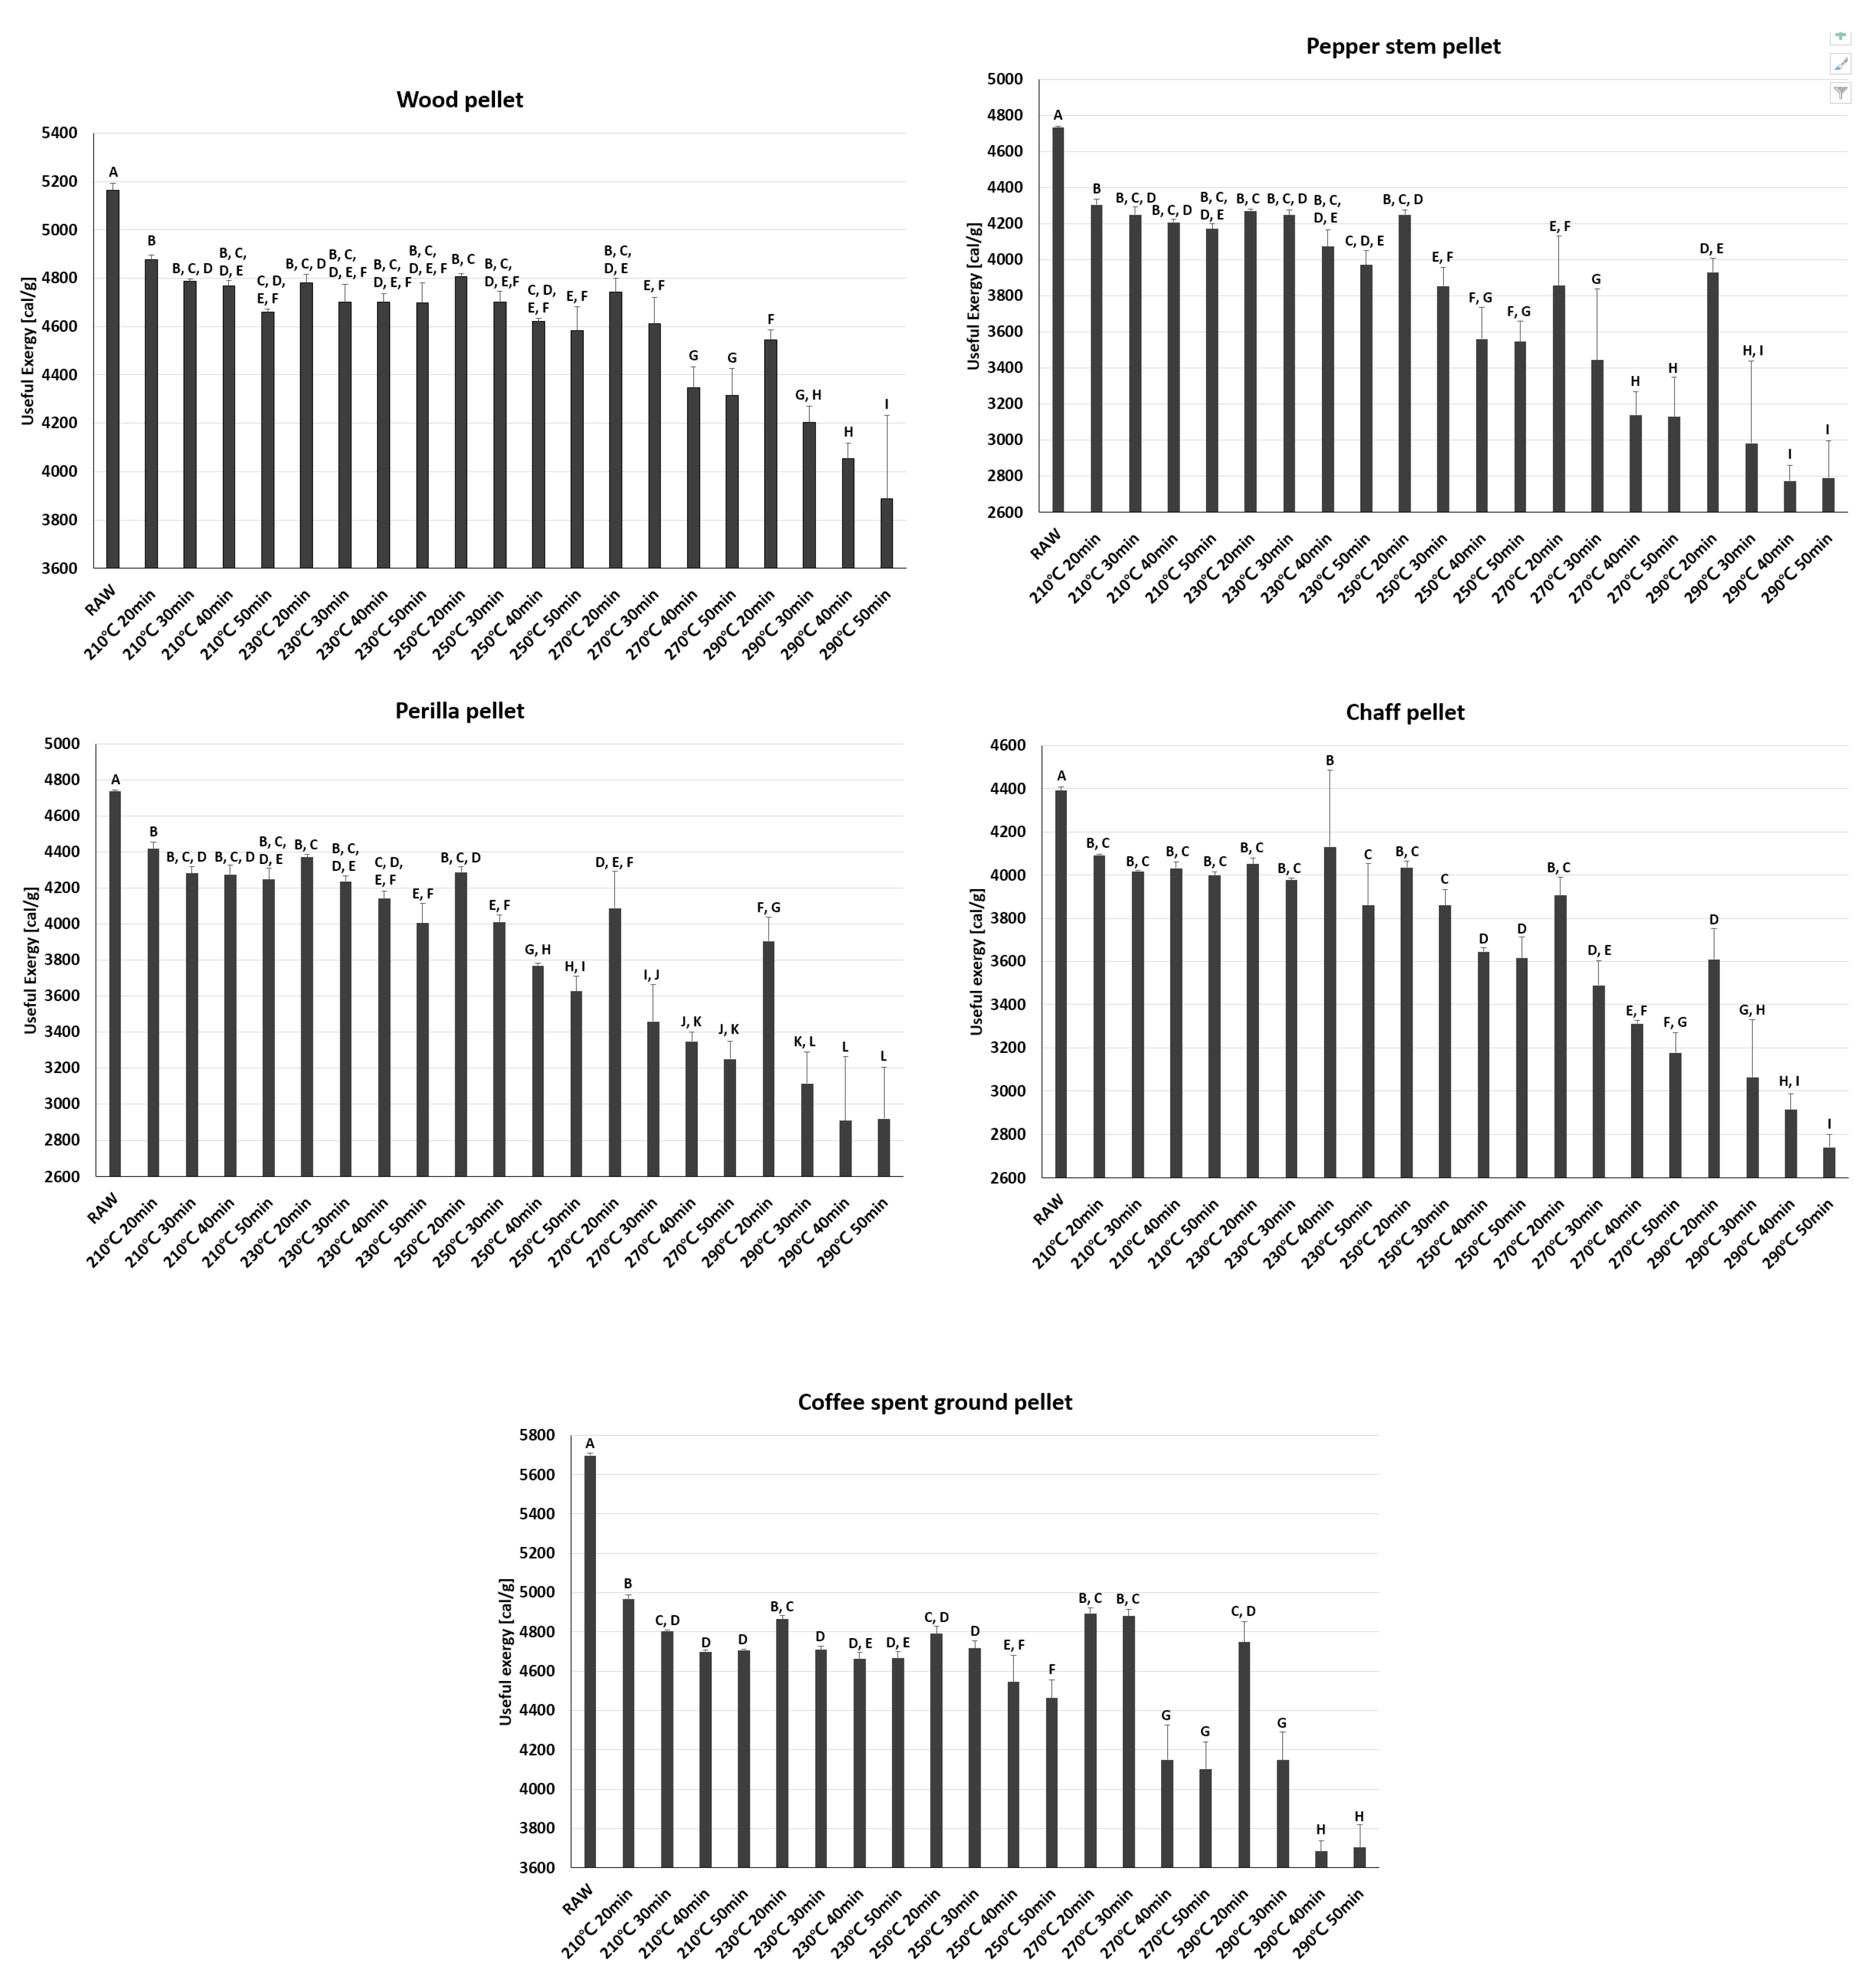
3.6. The Lower Heating Value and Exergy Analysis

Based on the MC values measured, we calculated the LHV, exergy values and useful exergy; these results are plotted in Figure 8, Figure 9 and Figure 10 respectively in each case. Owing to the variation in MC, the LHV is significantly lower than the HHV. The LHV of WP is 4456 kcal kg−1, which is similar to the HHV of PEP. However, the calculated exergy is 5183 kcal kg−1. The WP samples and the other pellets exhibit a smaller LHV than the corresponding HHV along with the increase in exergy. Results of Duncan’s multiple test of LHV and exergy showed similar groups according to process conditions, due to correlation between them. Useful exergy decreased due to the longer process time, the higher temperature, the large mass loss. For example, useful exergy of WP was from 5160 to 3890 cal g−1, PEP from 4730 to 2790 cal g−1.

3.7. Estimation of Optimal Torrefaction Conditions

The 2000-MW-grade Samcheok Green Power plant in Samcheok, Korea, was constructed to process low-grade coal with a lower heating value of approximately 4000 kcal kg−1. Further, other power plants were planned to conform to these standards. Based on this information, we estimated the range of optimal torrefaction conditions via two approaches. First, we focused on the LHV. Table 2 lists the LHV and useful exergy of each pellet type. The gray-colored cells indicate LHVs or useful exergy values greater than 4000 cal/g, which can meet the standards of Samcheok Green Power. To ensure further optimization, the LHV of WP, 4400 cal/g, was used as an additional standard, and values meeting this standard are indicated in blue in Table 3.

4. Conclusions

This study was conducted with the objective of examining the feasibility of using agro-byproduct biomass as a biofuel and improving its efficiency. We utilized torrefaction to examine the feasibility of agro-byproduct pellets as fuel and attempted to determine optimal torrefaction conditions. The examined agro-pellets exhibited high thermal degradation relative to the WP (wood) sample, which corresponded to a low mass yield. However, the agro-pellets exhibited a large increase in calorific value due to their large mass loss. The increase in the WP calorific value was approximately 15%p and the maximum increase among all the agro-pellets considered was 35%p. However, some CFP samples exhibited a decreasing tendency of the calorific value possibly due to loss of the bio-oil component of CFP. Nevertheless, the CFP calorific value increased under severe torrefaction conditions. The energy yield also exhibited a tendency similar to the mass yield for all samples. Hygroscopicity experiments indicated the torrefaction conditions increased the pellet hydrophobicity. We speculated that the torrefaction process “broke” the H–O bond, which hindered water absorption. The exergy of each sample was also calculated. Based on these parameters, we estimated the optimal torrefaction conditions. The conditions for the WP samples were selected as the optimal conditions. The optimal temperature and time conditions for PEP were determined as 230 °C and 40 min, respectively. The optimal temperature and time conditions for PRP were 230 °C, 40 min and 50 min. respectively. The CFP conditions were optimal in all cases except for the temperature and time values of 290 °C, 40 min and 50 min, respectively. However, CHP could not be practically considered as a fuel. In future studies, we plan to conduct our investigations at a pilot-scale facility.

Author Contributions

Conceptualization, K.C.O., S.P. and S.J.K.; methodology, S.J.K.; software, S.J.K.; validation, S.J.K. and S.P.; formal analysis, S.J.K. and S.P.; investigation, S.J.K. and S.P.; resources, L.H.C. and C.G.L.; data curation, M.J.K.; writing—original draft preparation, S.P.; writing—review and editing, S.P.; visualization, I.S.J.; supervision, D.H.K.; project administration, D.H.K. All authors have read and agreed to the published version of the manuscript.

Funding

This study is supported by 2016 Research Grant from Kangwon National University (No. 520160416).

Conflicts of Interest

The authors declare no conflict of interest.

References

  1. Forest Biomass Energy Association 2017 (Production+Import+Price+Stock). Available online: http://www.biomassenergy.kr/ (accessed on 1 November 2018).
  2. Lee, J.; Park, S. Estimation of Geographical & Technical Potential for Biomass Resources. New Renew. Energy 2016, 12, 53. [Google Scholar]
  3. Kanwal, S.; Chaudhry, N.; Munir, S.; Sana, H. Effect of torrefaction conditions on the physicochemical characterization of agricultural waste (sugarcane bagasse). Waste Manag. 2019, 88, 280–290. [Google Scholar] [CrossRef]
  4. Garcia, D.P.; Caraschi, J.C.; Ventorim, G.; Vieira, F.H.A.; Protásio, T. Comparative energy properties of torrefied pellets in relation to pine and elephant grass pellets. BioResources 2018, 13, 2898–2906. [Google Scholar] [CrossRef] [Green Version]
  5. Azócar, L.; Hermosilla, N.; Gay, A.; Rocha, S.; Díaz, J.; Jara, P. Brown pellet production using wheat straw from southern cities in Chile. Fuel 2019, 237, 823–832. [Google Scholar] [CrossRef]
  6. Aurel, L.; Cosmin, S.; Tatiana, D. Effects and modeling of sawdust torrefaction for beech pellets. Bioresources 2015, 10, 4726–4739. [Google Scholar]
  7. Peng, J.; Wang, J.; Bi, X.T.; Lim, C.J.; Sokhansanj, S.; Peng, H.; Jia, D. Effects of thermal treatment on energy density and hardness of torrefied wood pellets. Fuel Process. Technol. 2015, 129, 168–173. [Google Scholar] [CrossRef]
  8. Yang, Y.; Sun, M.; Zhang, M.; Zhang, K.; Wang, D.; Lei, C. A fundamental research on synchronized torrefaction and pelleting of biomass. Renew. Energy 2019, 142, 668–676. [Google Scholar] [CrossRef]
  9. Oh, K.C.; Park, S.Y.; Kim, S.J.; Choi, Y.S.; Lee, C.G.; Cho, L.H.; Kim, D.H. Development and validation of mass reduction model to optimize torrefaction for agricultural byproduct biomass. Renew. Energy 2019, 139, 988–999. [Google Scholar] [CrossRef]
  10. Cruz Ceballos, D.C.; Hawboldt, K.; Hellleur, R. Effect of production conditions on self-heating propensity of torrefied sawmill residues. Fuel 2015, 160, 227–237. [Google Scholar] [CrossRef]
  11. Rodrigues, T.O.; Rousset, P.L.A. Effects of Torrefaction on Energy Properties of Eucalyptus Grandis Wood. Cern. Lavras 2009, 15, 446–452. [Google Scholar]
  12. Chen, W.H.; Lin, B.J.; Colin, B.; Chang, J.S.; Pétrissans, A.; Bi, X.; Pétrissans, M. Hygroscopic transformation of woody biomass torrefaction for carbon storage. Appl. Energy 2018, 231, 768–776. [Google Scholar] [CrossRef]
  13. Felfli, F.F.; Luengo, C.A.; Suárez, J.A.; Beatón, P.A. Wood briquette torrefaction. Energy Sustain. Dev. 2005, 9, 19–22. [Google Scholar] [CrossRef]
  14. Basu, P. Biomass Gasification, Pyrolysis and Torrefaction: Practical Design and Theory; Academic Press: Cambridge, MA, USA, 2013; ISBN 9780123964885. [Google Scholar]
  15. Morris, D.R.; Steward, F.R. Exergy analysis of a chemical metallurgical process. Metall. Trans. B 1984, 15, 645–654. [Google Scholar] [CrossRef]
Figure 1. Prototype capsule.
Energies 13 00423 g001
Figure 2. Element component ratio of each torrefied pellet.
Energies 13 00423 g002
Figure 3. Van Krevelen diagram of torrefied pellets.
Energies 13 00423 g003
Figure 4. Calorific value of each pellet for various temperature and time conditions. Each letter in the graph is a group of significance determined by Duncan’s multiple test.
Energies 13 00423 g004aEnergies 13 00423 g004b
Figure 5. Energy yield of each pellet for various temperature and time conditions. Each letter in the graph is a group of significance determined by Duncan’s multiple test.
Energies 13 00423 g005
Figure 6. Relative humidity and ambient air temperature.
Energies 13 00423 g006
Figure 7. Change in moisture content of each pellet as a function of the process conditions 10 days after the torrefaction experiment.
Energies 13 00423 g007aEnergies 13 00423 g007b
Figure 8. The lower heating value difference of each torrefied pellet.
Energies 13 00423 g008aEnergies 13 00423 g008b
Figure 9. Exergy difference of each torrefied pellet.
Energies 13 00423 g009
Figure 10. Useful exergy difference of each torrefied pellet.
Energies 13 00423 g010
Table 1. Properties of each pellet.
PropertiesUnitsWPPEPPRPCHPCFP
Moisture content%9.010.69.79.311.1
Ash content%0.45.65.812.61.8
Gross calorific valuekcal kg−148104440443041105500
Chlorine%0.010.670.190.19<0.01
Sulfur%0.020.120.120.060.05
Asmg kg−1N.D.N.D.N.D.N.D.N.D.
Cdmg kg−10.2N.D.N.D.N.D.N.D.
Crmg kg−11239<1
Cumg kg−142015531
Pbmg kg−1112<1<1
Hgmg kg−1N.D.0.010.01<0.01<0.01
Nimg kg−112221
Znmg kg−1625563616
N.D.: Not detected.
Table 2. Mass yield of torrefied pellets.
Temp [°C]Time [min]PEP [%]PRP [%]CHP [%]CFP [%]WP [%]
2102090 (0.75)93 (0.75)93 (0.11)87 (0.24)93 (0.26)
3088 (0.85)90 (0.85)91 (0.02)85 (0.17)91 (0.32)
4086 (0.19)89 (0.19)91 (0.52)84 (0.21)91 (0.25)
5085 (0.48)87 (0.48)90 (0.15)83 (0.35)89 (0.52)
2302089 (0.22)92 (0.22)92 (0.55)86 (0.25)92 (0.31)
3087 (0.54)88 (0.54)90 (0.07)84 (0.15)89 (1.38)
4081 (1.10)83 (1.10)87 (1.04)83 (0.58)89 (0.74)
5077 (1.41)80 (1.41)84 (1.41)79 (0.39)88 (1.14)
2502088 (0.94)89 (0.94)91 (0.52)85 (0.61)91 (0.45)
3078 (0.35)79 (0.35)85 (1.48)84 (0.63)88 (0.57)
4067 (2.61)71 (2.61)77 (0.29)75 (2.31)85 (0.63)
5065 (1.66)67 (1.66)75 (2.20)71(1.65)84 (1.86)
2702081 (5.68)84 (5.68)88 (1.83)87 (0.60)90 (0.67)
3065 (5.07)62 (5.07)74 (2.74)83 (0.79)85 (1.53)
4057 (2.66)58 (2.66)68 (0.19)63 (2.73)78 (1.99)
5055 (2.94)55 (2.94)63 (1.51)61 (2.26)76 (1.51)
2902080 (0.98)76 (0.98)77 (2.77)82 (1.57)85 (0.46)
3049 (6.60)52 (6.60)62 (4.04)65 (1.99)74 (2.87)
4045(1.63) 49 (1.63)57 (1.52)52 (0.78)69 (0.96)
5045 (2.60)47 (2.60)53 (1.02)52 (1.70)66 (5.38)
All numbers in parentheses are the standard deviations.
Table 3. The lower heating value (LHV) and useful exergy of each pellet.
ProcessPEPPRPCHPCFP
LHVUExLHVUExLHVUExLHVUEx
Raw4085 (7.13)47334099 (4.85)47373786 (15.64)43915106 (10.82)5696
210 °C20 min4152 (7.25)43064137 (12.04)44203810 (6.06)40925109 (7.02)4969
30 min4192 (1.07)42514159 (13.68)42813816 (3.16)40185079 (5.86)4805
40 min4258 (10.17)42084211 (5.27)42763848 (5.99)40325002 (14.63)4698
50 min4306 (5.44)41724269 (31.24)42473866 (3.72)39985065 (17.15)4708
230 °C20 min4168 (10.82)42724142 (12.03)43723810 (3.72)40515032 (17.29)4864
30 min4248 (13.04)42484220 (16.89)42373847 (8.01)39775025 (11.37)4710
40 min4407 (42.09)40724401 (28.30)41413970 (10.65)39275056 (12.43)4662
50 min4546 (27.77)39724428 (107.65)40084016 (29.31)38605288 (10.97)4669
250 °C20 min4209 (30.50)42514194 (19.33)42893827 (8.80)40355033 (4.04)4790
30 min4345 (114.49)38534487 (65.19)40133976 (38.66)38595024 (8.14)4716
40 min4731 (72.40)35614742 (21.47)37694179 (9.10)36465527 (6.02)4561
50 min4869 (43.98)35464879 (100.45)36294278 (39.99)36155768 (17.59)4474
270 °C20 min4208 (5.10)38664280 (47.60)40883882 (12.50)39065015 (7.09)4895
30 min4784 (166.20)34395028 (89.07)34584203 (38.26)34905300 (19.69)4880
40 min5023 (37.81)31415216 (18.65)33494372 (18.90)33136075 (4.96)4156
50 min5147 (86.36)31295404 (44.46)32524562 (23.72)31786192 (19.98)4107
290 °C20 min4338 (36.68)39304544 (95.78)39044158 (93.13)36085180 (40.93)4749
30 min5578 (162.83)29835468 (95.83)31214552 (93.13)30715841 (26.98)4157
40 min5672 (75.22)27775509 (23.04)29124648 (28.44)29246508 (6.17)3684
50 min5709 (130.79)27945722 (7.18)29254785 (31.81)27456571 (9.67)3705

