Article

Feasibility Study of Co-Firing of Torrefied Empty Fruit Bunch and Coal through Boiler Simulation

1
School of Mechanical Engineering, Pusan National University, Busan 46241, Korea
2
Pusan Clean Coal Center, Pusan National University, Busan 46241, Korea
*
Author to whom correspondence should be addressed.
Energies 2020, 13(12), 3051; https://doi.org/10.3390/en13123051
Submission received: 30 April 2020 / Revised: 4 June 2020 / Accepted: 5 June 2020 / Published: 12 June 2020
(This article belongs to the Special Issue Biomass Chars: Elaboration, Characterization and Applications III)

Abstract

:
Torrefied empty fruit bunch (EFB) co-firing is a promising technology to reduce emissions from coal-fired power plants. However, co-firing can influence the combustion and heat transfer characteristics in a coal boiler. In order to study the feasibility of co-firing application of torrefied EFB (T-EFB) in boilers, the combustion characteristics, gas emissions and heat flux distribution were analyzed, respectively. First, the kinetic parameters of T-EFB devolatilization and char oxidation were obtained by experimental analysis. Second, the computational fluid dynamics (CFD) analysis was applied to the actual 500 MWe boiler simulation to further evaluate the differences in the co-firing performance parameters (combustion characteristics and emissions) of the T-EFB and the heat transfer characteristics within the boiler. Numerical results show that T-EFB co-firing can improve the ignition characteristics of pulverized coal, reduce the formation of unburned particles. When the blending ratio was increased from 10% to 50%, significantly NOx (oxides of nitrogen) reduction (levels from 170 to 98 ppm at 6% O2) was achieved. At a blending ratio above 40%, boiler combustion efficiency decreases as the total heat flux of the boiler decreases due to an increase in the amount of unburned carbon. In addition, T-EFB co-firing can affect the heat transfer characteristics of the boiler.

Graphical Abstract

1. Introduction

Globally, issues such as climate change and the depletion of fossil fuels have promoted the development and utilization of biomass renewable energy to reduce the dependence of power plants on fossil fuels [1]. At the same time, new technologies to convert raw biomass into more beneficial biomass fuels were significantly promoted [2].
Demand for palm oil has increased as economic growth that led to large-scale palm cultivation in Indonesia and Malaysia. The other reason is that palm act as the dominant agricultural crop in developing countries and the two mentioned countries produce more than 80% of the global palm oil supplement. According to data released by the Indonesian Ministry of Agriculture, the area under palm cultivation has increased 2.3 times from 2010 to 2020 [3]. At the same time, the mass production of palm oil generates a large amount of solid waste, including empty fruit bunches (EFB), palm kernel shells (PKS) and palm pressed pericarp fibers [4,5]. Generally, part of the EFB is directly used as fuel to power palm oil processing plants, part as organic fertilizer, and the remaining part is discarded or incinerated. It has attracted significant attention and interest in utilizing these industrial wastes efficiently.
General as a fuel, biomass combustion has lower input cost and technical research shows more complete than other biomass heat conversion technologies. Currently, the utilization of biomass as an alternative fuel to partial coal and added to combustion systems for co-firing has gradually developed as a common technique to achieve pollutant reduction [6,7]. However, the high moisture content of the original EFB (usually up to 60–70%) limits its direct combustion [4,8] and also affects gasification and pyrolysis reactions [9,10]. Therefore, proper pretreatment is required for biomass fuel to be stably applied into pulverized coal boilers with minimal adverse effects. Many studies have been conducted on biomass pretreatment, including drying [11], hydrothermal (HT) methods [12] and torrefaction [13]. Luke et al. [14] proposed that if satisfactory system efficiency is desired, biomass should be dried before combustion and power generation. Arif et al. [7] studied hydrothermal EFB (HT-EFB) as an energy source with hydrothermal treatment and simultaneously modelled drop tube furnace. The numerical analysis of the co-firing behavior of coal and HT-EFB in a drop tube furnace (DTF) showed that the NOX emissions from the co-firing behavior increased when the mixed mass fraction was higher than 25%. Ninduangdee et al. [15] analyzed the combustion temperature, oxygen concentration distribution and CxHy and NOX pollutant generation of pretreated EFB under different excess air by employed fluidized bed combustion technology. Luk et al. [14] developed an overall power plant model to simulate and derive the effect of energy efficiency of EFB combustion at 60% humidity in small biomass power plants under two different drying methods. Still, the result showed that the energy efficiency of both was lower. In addition, Aziz et al. [16] integrate a power generation system that utilizes an empty fruit bunch (EFB) and a palm oil processing plant, allowing the EFB converting into a higher calorific value gaseous fuel for power generation through drying and gasification processes. However, in order to achieve higher power generation efficiency, it is necessary to maintain high temperature and high-pressure conditions, which requires a higher investment cost. Therefore, the selection of pretreatment technology is particularly essential if EFB is used as an alternative to coal as a renewable fuel for power plants.
To improve the feasibility of EFB as an alternative to pulverized coal fuel in existing boilers, we applied a torrefaction technique proposed by Dutch researcher PCA Bergman et al. in 2005 [17] to change the biomass properties. The torrefaction technique usually places the raw sample material in an inert gas atmosphere and undergoes a thermochemical reaction at 200–300 °C for 30 min to 2 h [13,18,19,20] for releasing volatile substances such as carbon monoxide and remaining solid substances. The torrefaction process changes the physicochemical properties of the original biomass to make it more similar to coal [17,19,21]. The pretreated biomass has a high energy density and thermal activity compared to the raw material. Thus, the boiler load instability caused by biomass co-firing can be reduced [22]. In addition, moisture, O/C and H/C ratios, as well as grinding energy consumption all can be effectively reduced [23]. Such as Szufa et al. [24] conducted studies that oat straw torrefaction process at this temperature range of 250–350 °C has enhanced the solid biofuel qualities of maize and oat straws by the decrease of the O/C ratio and the increase of Higher heating value (HHV). In addition, roasted biomass has a smaller particle size and lower moisture content, which effectively improves the mobility of the biomass particles and the homogeneity of the fuel mixture. Finally, the torrefied biomass has more economical transportation cost than the original biomass [25].
There are numerous basic analytical and application experiments for general biomass through torrefaction pretreatment. Such as Falah et al. [26] conducted co-firing studies of torrefied wood and pulverized coal in a one megawatt pulverized coal furnace, but there was no obvious change for pollutant emissions from co-firing due to the small heat share of biomass. Moreover, Alexander et al. [27] used numerical simulation to analyze the co-combustion characteristics of torrefied sawdust with coal dust, and the results showed that it could be burned as an alternative to coal dust. Emad et al. [28] analyzed the polluting gases from co-combustion of biomass (corn stover and rice husk) with bituminous coal by using a thermoelectric dropper furnace DTF, and the results showed that the co-combustion of torrefied biomass produced lower polluting gases compared to pure coal combustion. However, there are no studies on the combustion, emission and heat transfer characteristics of T-EFB with pulverized coal, according to the current researches, which makes the T-EFB cofired application to the boiler lacking a relevant reference.
This study aims to explore the feasibility of T-EFB mixed with coal for application in large boilers. In this research, the effect of torrefaction on the properties of EFB fuel was first analyzed. Then, thermogravimetric analysis (TGA) was conducted to determine the kinetic reaction parameters of the T-EFB and the flaring behavior of pyrolytic biomass residues. Finally, the combustion characteristics, contaminant generation and the effect on heat transfer in the boiler at different mixing ratios (10–50%) were analyzed by modeling the actual boiler. The study provides positive reference data for the actual operation of thermal power plants.

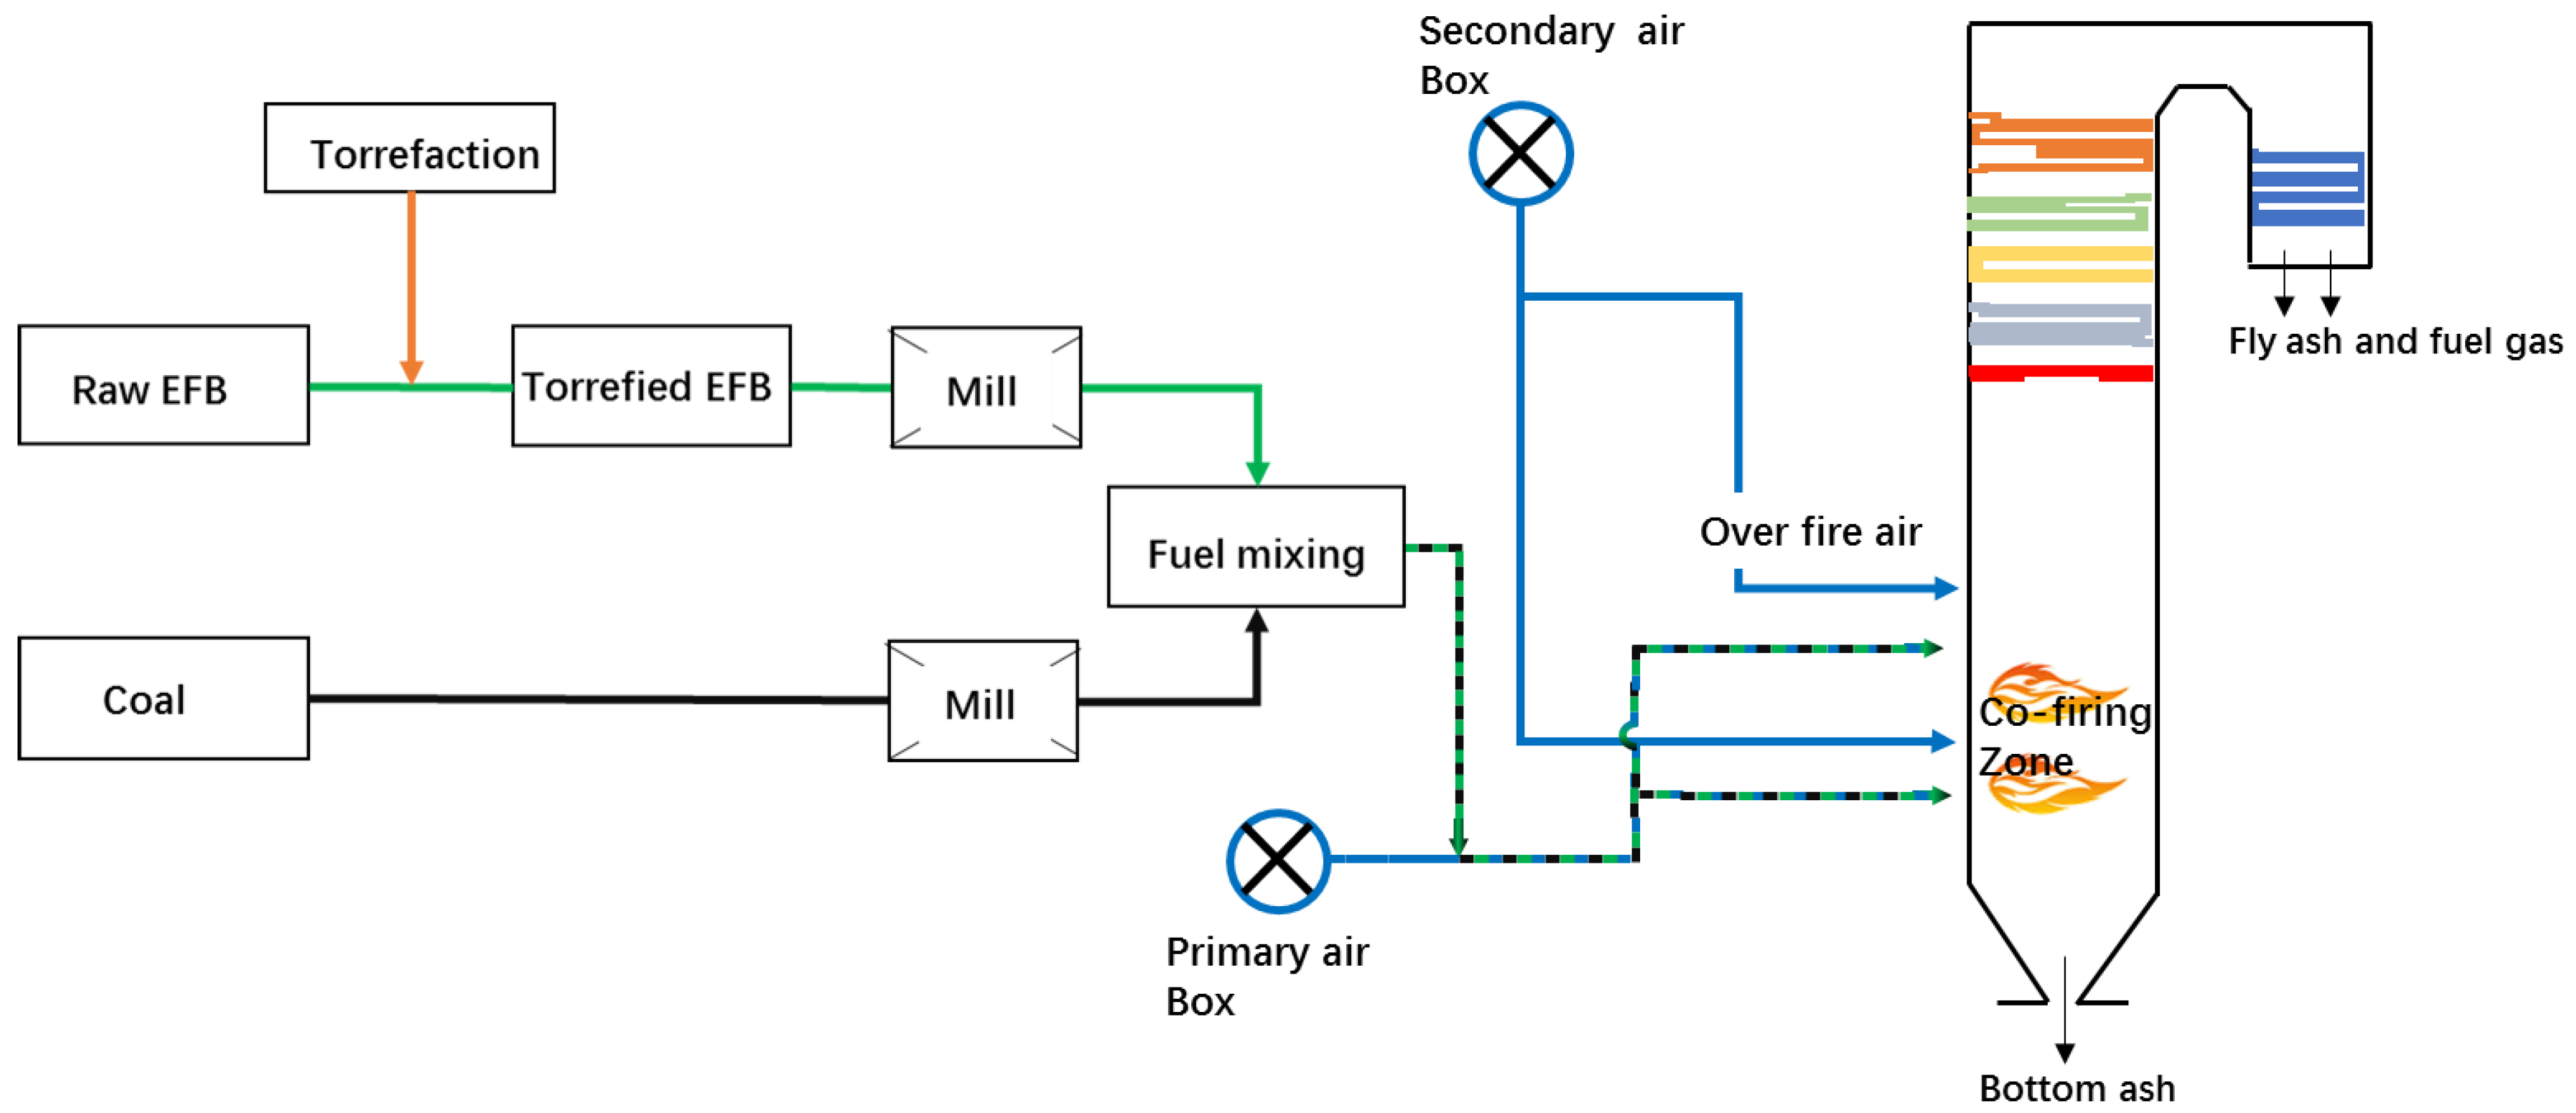
2. Torrefaction-Based Co-Firing System

Figure 1 shows a conceptual graph of T-EFB co-firing system. As shown, the raw EFB (R-EFB) is torrefied an inert atmosphere, in which the reaction is carried out at a temperature of 200–300 °C. This reaction usually requires some minutes to 2 h to improve the calorific value and property of the R-EFB. The obtained T-EFB and coal fuel were ground to a specific particle size required for boiler combustion. Then, the two kinds of fuels were mixed uniformly and were injected into the boiler through a burner for combustion.

3. Experimental Section

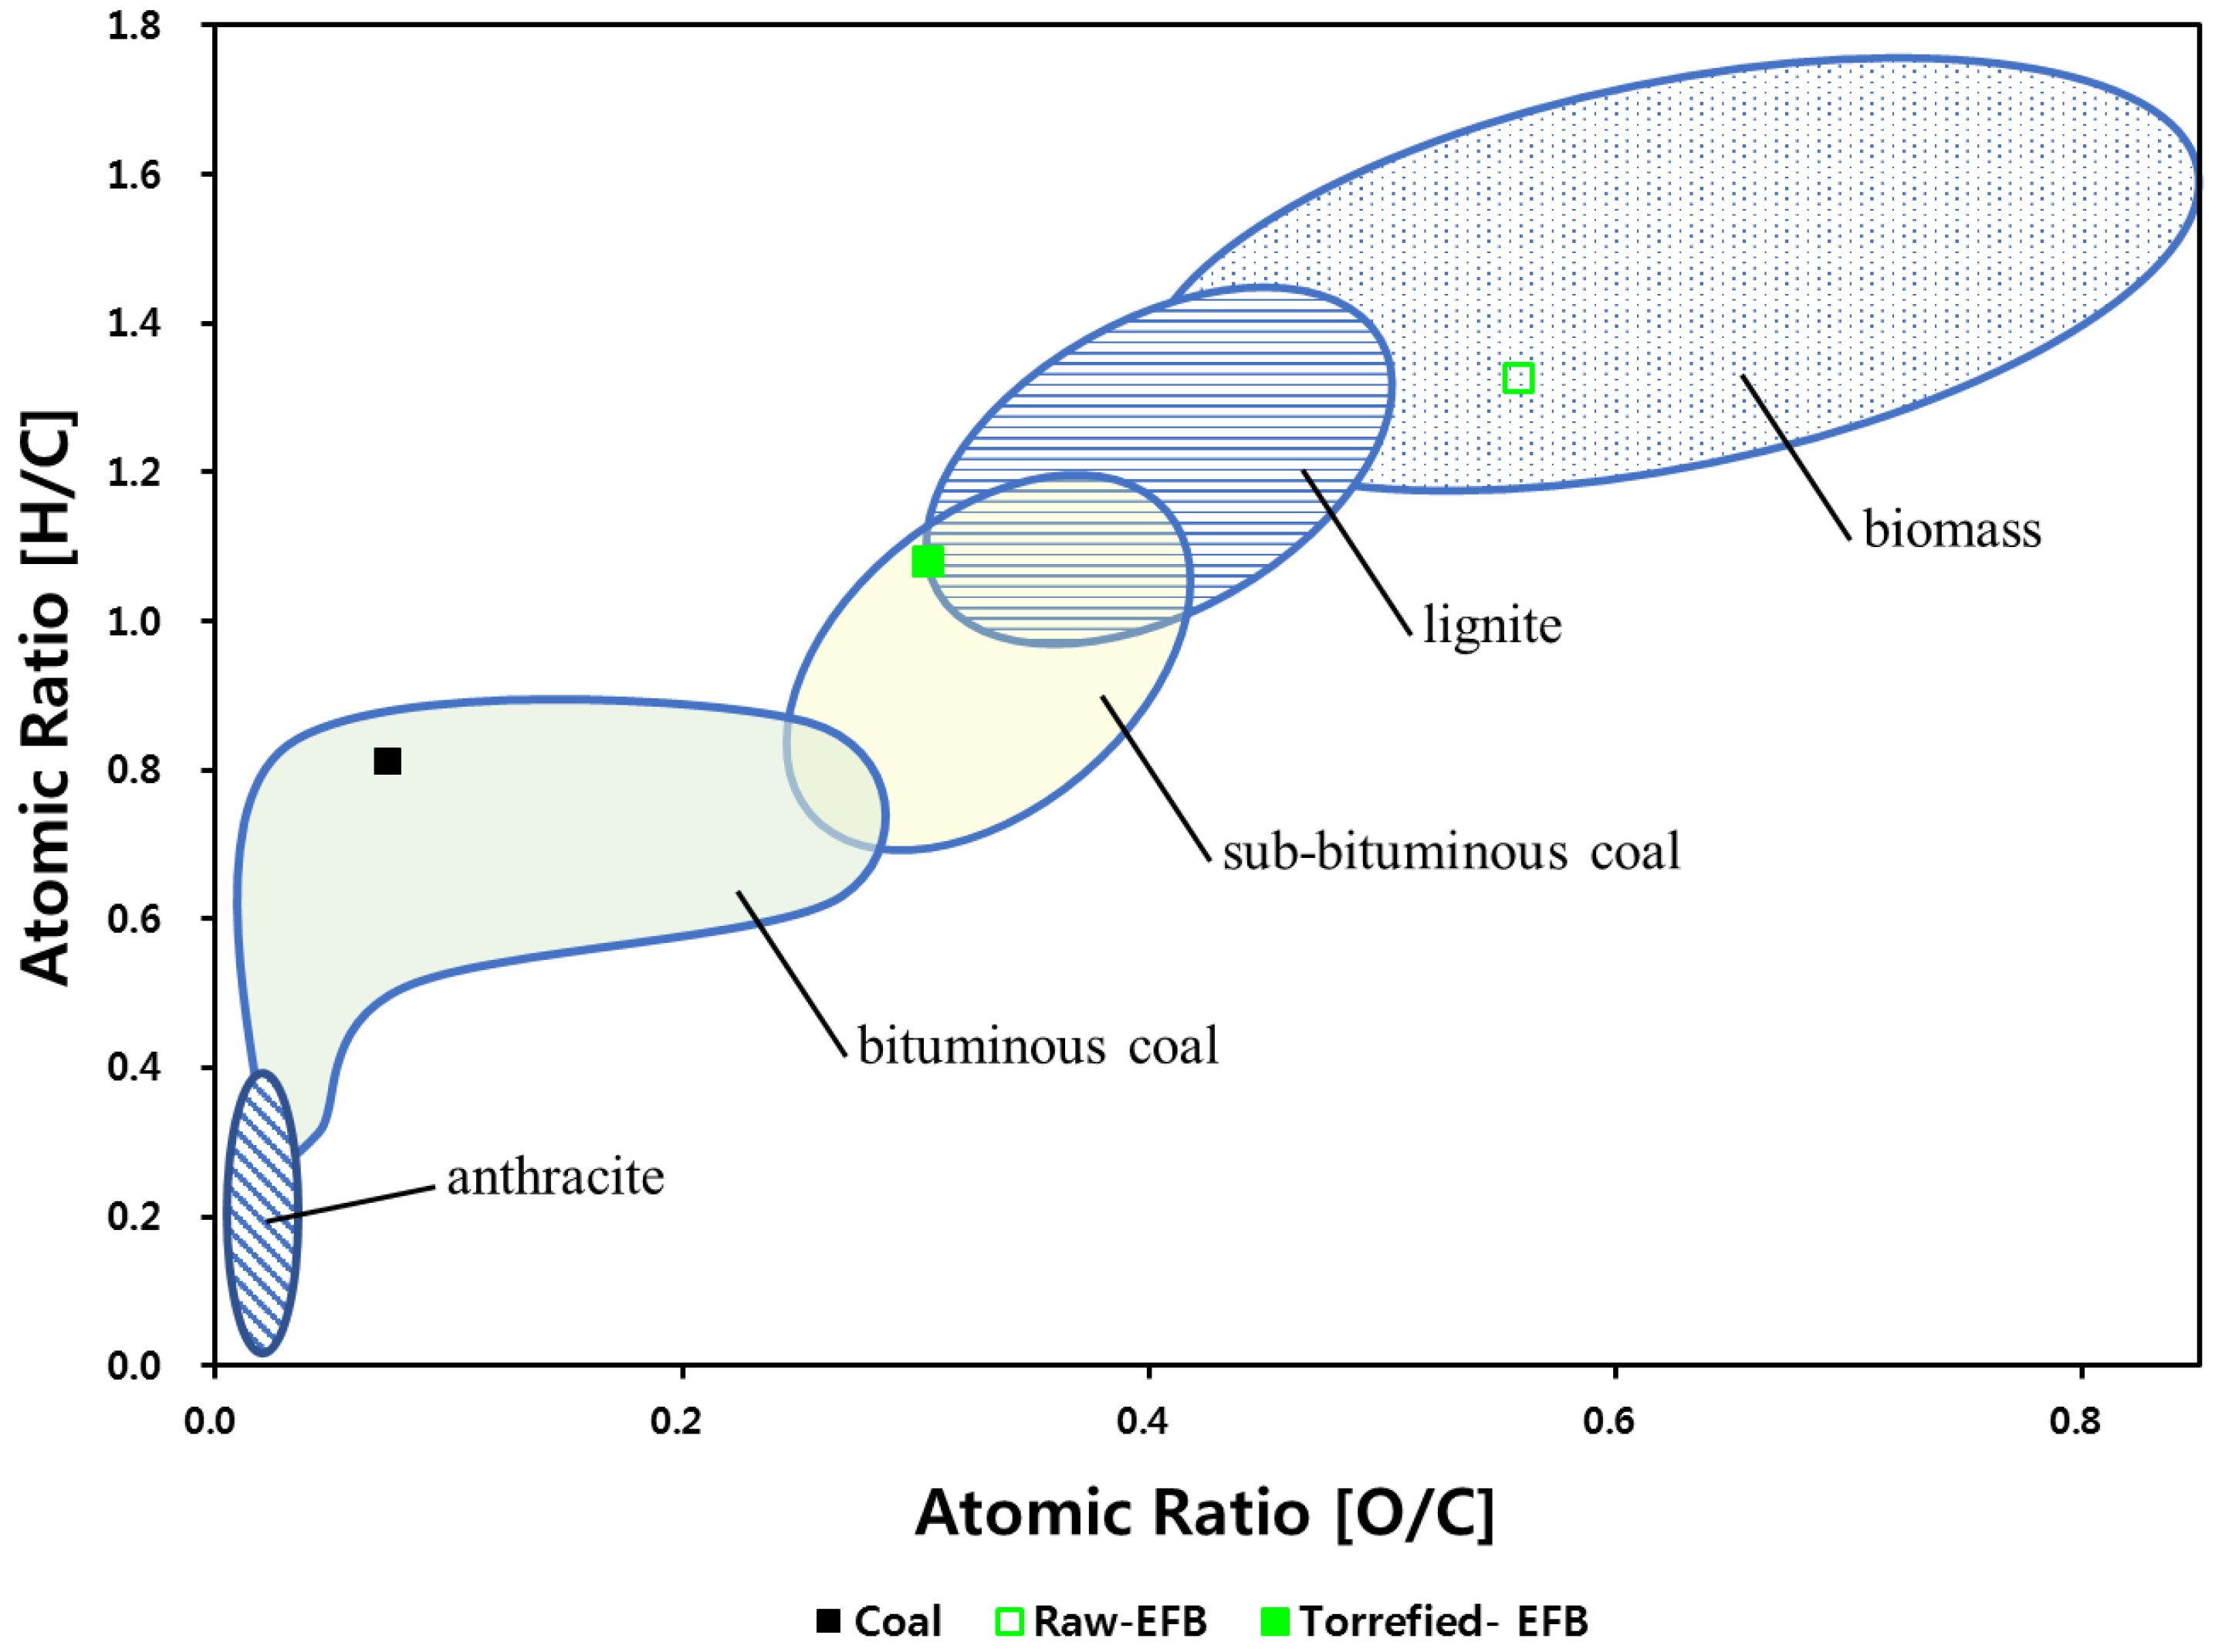
3.1. Material Properties

The EFB biomass material used in the experiment was an Indonesian R-EFB obtained from the Korea Institute of Energy Research (KIER). T-EFB is obtained by torrefying R-EFB using TGA in an inert atmosphere and a temperature of 250–300 °C for 10 min. Moreover, in this study, the coal used from the actual operating power plant. As an energy source, EFB has high power generation potential in waste biomass. The basic properties of each fuel are listed in Table 1. It contains results of a proximate analysis (TGA-701, LECO Co., Anyang, Korea), ultimate analysis (Tru. Spec. elemental analyzer and SC-432DR sulfur analyzer, LECO Co., Anyang, Korea) and calorific value (AC600 semiauto calorimeter, LECO Co., Anyang, Korea) for all samples. Each analysis was based on American Society for Testing and Materials (ASTM) D3172, D3176 and D4326, respectively. In addition to bituminous coal, the possibility of utilization of R-EFB, and T-EFB gradually increased as the fuel heating value increased. At the same time, compared with R-EFB, the volatile matter of T-EFB was further reduced after torrefaction at 250 °C while having a higher carbon content, but the ash content was increased.
As shown in Figure 2, the Van Krevelen diagram [29] shows the correlation between the atomic H/C and O/C ratios of coal, R-EFB and T-EFB obtained by torrefaction at 250 °C. Combined with the data in Table 1, we know that the energy density of R-EFB is much lower than that of coal. However, the T-EFB after torrefaction gradually reached the level of sub-bituminous coal, which means that low-rank biomass fuel can be increased by torrefaction technology to reach the standard of high-rank fuel, especially lower calorific value R-EFB [13].

3.2. Experimental Studies on TG and DTG and Kinetics Tests of T-EFB Biomass

To determine the changes in the T-EFB reaction characteristics after torrefaction, we performed a thermogravimetric analyzer (TGA, SDT Q600) test under inert nitrogen conditions and atmospheric conditions. In total, 15 mg of R-EFB and T-EFB were taken for the analysis. First, the two forms of matter were heated from room temperature at a constant heating rate (20 °C/min) to 107 °C in a nitrogen atmosphere at a flow rate of 100 mL/min. An isothermal time of approximately 10 min was maintained to evaporate the moisture completely. Then, during the pyrolysis process, the temperature was heated from 107 °C to 950 °C at a constant heating rate (20 °C/min) under a helium atmosphere. The matter was kept in an isothermal situation for 10 min, and real-time weight loss data could be obtained according to the pyrolysis of the samples. The kinetics of the two biomasses in the devolatilization process were observed. Second, the air was used as the oxidant at a flow rate of 100 mL/min, and the temperature was heated to 950 °C at a constant heating rate (20 °C/min). The same temperature was maintained for 10 min to observe the oxidation kinetics of char.

4. Description of Methodology

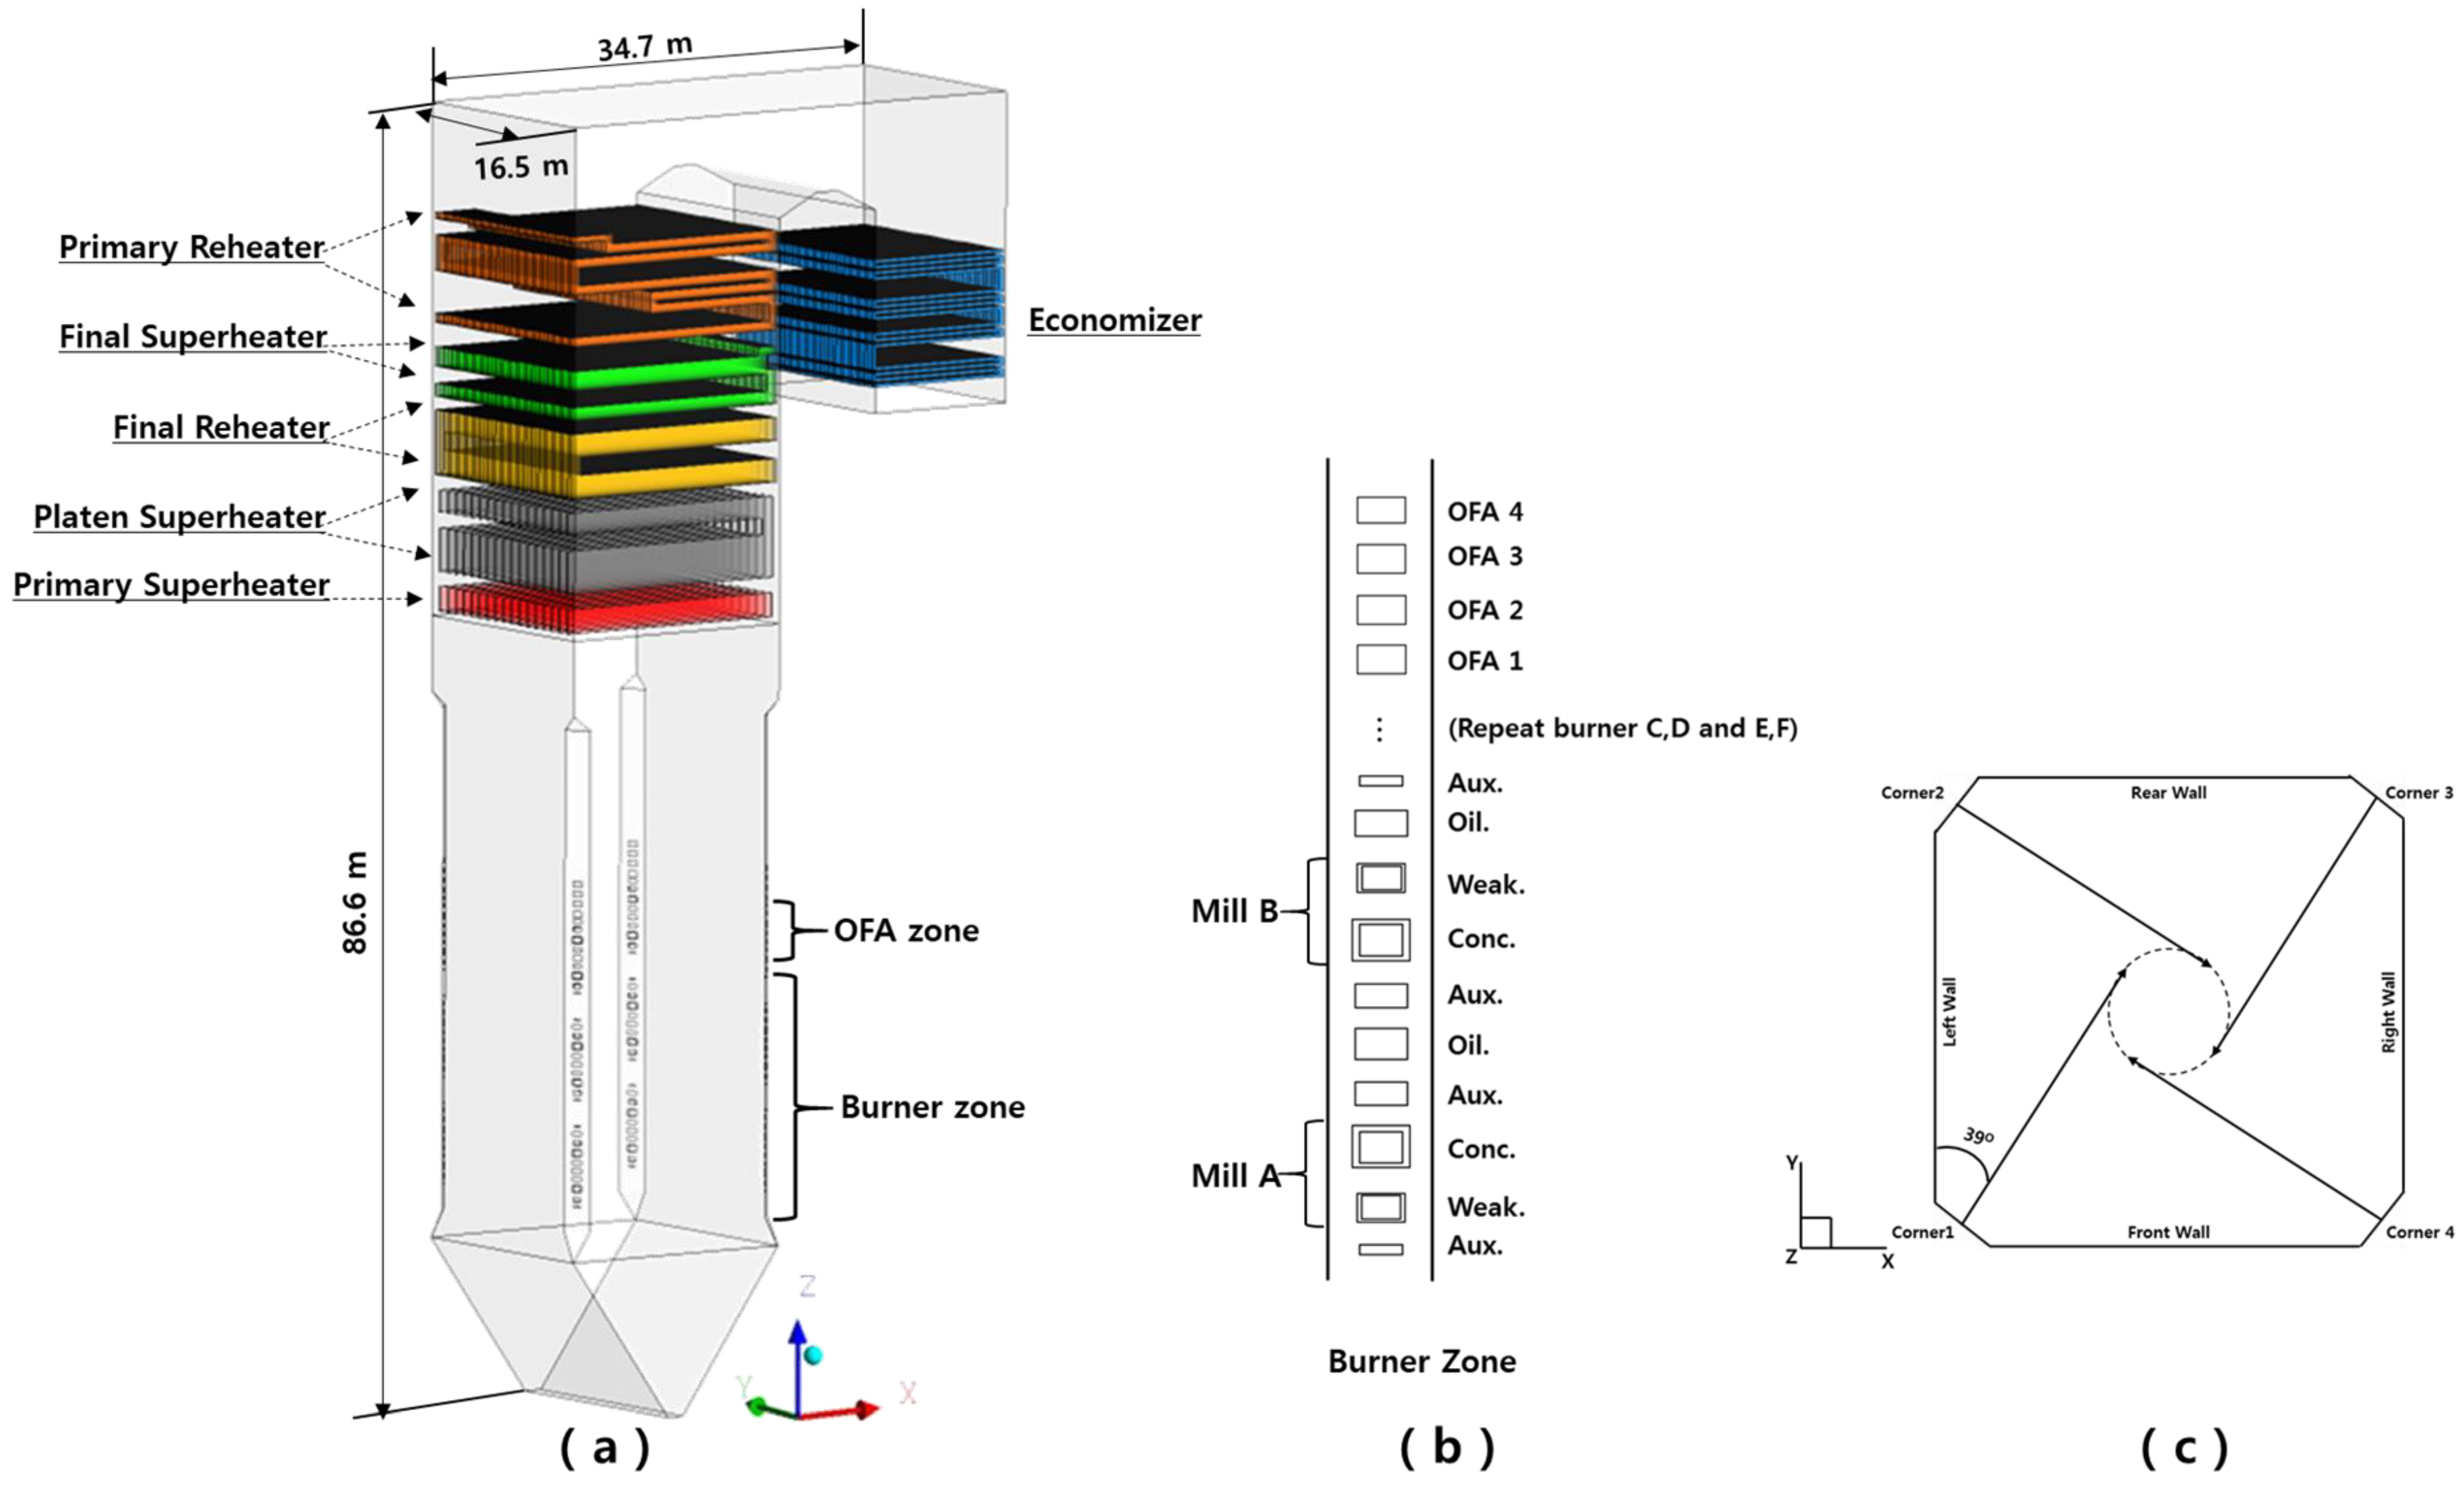
4.1. Boiler Information

The study was conducted in a 500 MWe tangential firing boiler with configuration and dimensional parameters, as shown in Figure 3a. The boiler is a tangential spray one-through boiler that achieves a 500 MWe load, and the heat receiver is horizontally located above the boiler. The efficiency of the boiler is 89.3%. Figure 3a shows the shape of the boiler. The height was 86.6 m, and the horizontal-section width and depth of the furnace were both 16.5 m. As shown in Figure 3b, the pulverized coal and the T-EFB particles were delivered by primary air to five burners (AB, CD, E and F (un-operated burner)) in the burner zone of the furnace. As shown in Figure 3c, the fuel and air ejected through the four corners form clockwise concentric combustion in the center of the furnace. Meanwhile, as the auxiliary combustion air, the secondary air directly entered the furnace through the nozzle near the burner and part of the air passed through the overfire air (OFA) port above the main combustion area, which played an active role in the burning of the fuel. The coal-fired burners used the pollution minimum (PM) burners. Each group of burners had two fuel injection ports, and the flow ratio of the fuel-rich (conc) nozzles to the fuel-lean (weak) was 7:3. Then, there were an economizer (Eco), two reheaters (RH), and three superheaters (SH) in the main flow direction at the top of the furnace outlet zone. From the hopper inlet to the boiler exit, the shape of the water wall was simplified. The combustion performance of a boiler using pulverized coal had a close relation to the operating conditions of the pulverized coal, OFA distribution and the air supply conditions of the burner. When constructing the model, the effective area of the actual burner nozzle was thoroughly considered.

4.2. Numerical Simulation

The commercial code ANSYS FLUENT (version 17.1) used in this study performs numerical simulations including turbulence, solid particle motion, particle-gas interactions, combustion and radiative heat exchange, and contaminant NOx formation in boilers [30]. CFD analysis can provide cost-effective solutions for new combustion systems [31]. A k- ε -realizable turbulence model was chosen to calculate the effect of turbulence in the boiler [30,32]. Coal and biomass reactions were modeled using a species transport model. The trajectories of pulverized coal and biomass particles were calculated by the Lagrangian method. Based on the literature [3,25], this study considered the drag force that was crucial for the orbital calculation of discrete particles. The biomass particles were assumed to be nonspherical and larger than the spherical surface area of the coal and the drag coefficients were calculated based on Haider and Levenspiel’s equation regarding to [6]. The coal particle is assumed to obey the rosin–rammler distribution with a particle size of 10–150 µm, an average of 75 μm and a distribution index of 1.15, respectively. However, in this study, the particle size of the T-EFB sample taken in the experiment was 400 μm, so the same particle size was also used in the simulation. Discrete ordinate models [33] were used to simulate radiation heat transfer effect, which approximates the solution of radiative transfer equations by discretizing the entire solid angle into a finite number of solid angles. A weighted-sum-of-gray-gases model [6,32] was applied to calculate the absorption coefficient of the gas. Both the particle emissivity and scattering coefficient used a default value of 0.9 [31]. A finite-rate/eddy-dissipation model [25,26,34] are used to calculate the volumetric homogeneous reaction. The fuel particle and gas-phase reactions were simplified into two stages, and the reactions were as follows:
I(a) Coal: C1.57H3.26O0.38N0.0956S0.0075 + 1.41 O2 → 1.57 CO + 1.63 H2O + 0.0478 N2 + 0.0075 SO2
I(b) T-EFB biomass: C1.39H2.28O0.64N0.0326S0.002 + 0.94 O2 → 1.39 CO + 1.14 H2O + 0.0163 N2 + 0.002 SO2
II CO + 0.5 O2 → CO2
In this study, since the volatile combustion of torrefied biomass pellets occurs over a short period of time, the devolatilization model used a single-rate model [35]. The fuel volatile fraction single rate reaction model is shown below.
d m d t = A   exp ( E R T p ) ( m 0 m )
where m0 (kg) is the initial volatile fraction mass, m (kg) is the post-reaction volatile fraction mass, Tp (K) is the particle temperature, R is the universal gas constant (8.3144 J mol−1 K−1), A is the pre-exponential factor (1/s) of the kinetic parameters, and E is the reaction activation energy (kJ/mol). The kinetic/diffusion limitation model is used for surface charcoal combustion. The rate of combustion reaction depends on the diffusion of the particle surface and the kinetics of the inherent chemical reaction [30,34]. The kinetic parameters of coal were referenced from the same type of coal [36] based on the simulation accuracy considerations in this study, while the kinetic parameters of T-EFB biomass were obtained from the experiments in this study. Detailed kinetic data for these two fuels are presented in Table 2.
In this study, only fuel NO and thermal NO were considered, as prompt NO was very low. Posttreatment methods have been widely used to simulate NOx generation in recent years, and by comparing field tests and simulation results, posttreatment NOx calculation models can accurately simulate NOx generation [37,38]. Among them, thermal NO refers to the formation of NO in the atmosphere by oxidizing N2 in the relatively high-temperature region of the combustion reaction, the reaction rate of which was derived from the experimental studies of Hanson and Salimian [39], and the reaction had a certain dependence on high temperature. Heat formation is determined by a series of chemical reactions that are highly temperature-dependent (called the extended Zeldovich mechanism). The main reactions that control the formation of thermodynamic NO from molecular N are as follows.
O + N 2 N + NO
N + O 2 O + NO
N + OH H + N
Fuel NO accounts for the largest share of NOx from coal combustion. Fuel NO consists mainly of the chemical bond cleavage of nitrogen in the solid fuel fraction, which is formed by the combination of oxygen and some of the fuels formed in the devolatilization phase. This is described using the De Soete model [40] and the reaction mechanism is shown in Figure 4. Furthermore, based on the comparison of simulations and experiments in the literature, the conversion rate of HCN and NH3 emitted by volatile constituents is assumed to be 9:1 for bituminous coal [41]. Whereas in the case of torrefied biomass, the conversion rate of HCN and NH3 was assumed to be 1:9 based on data from the literature [42], and the char of both was completely oxidized to NO. Other calculation submodel descriptions used in the study can be found in the literature [13,42].

4.3. Boundary Conditions and Simulation Scenarios

In this study, all simulated cases were based on field measurements for full load (500 MWe) operation (i.e., case 1 in Table 3). Detailed performance data for the boiler operation can be confirmed in Table 3. The amount of air required for simulated combustion is calculated separately based on the T-EFB mixing ratio of 10–50% (thermal basis), but the air excess ratio is 1.12. During the simulation, fuel is injected uniformly into 24 burners (A–E burner area) and the relative ratios of primary air (PA), secondary air (SA) and OFA are kept the same with pure coal combustion conditions. In addition, as temperature, carbon content concentration in the fly ash, NOx emission and other data were also measured at the monitoring port at the boiler exit zone. The measurement results data can be confirmed in Table 4. Normally, the emissivity of the boiler water wall was set at 0.6 and the temperature was 427 [43]. The calculation case is based on the velocity-pressure coupling using the SIMPLE algorithm and the second–order upwind format to improve the calculation accuracy.

5. Results and Discussion

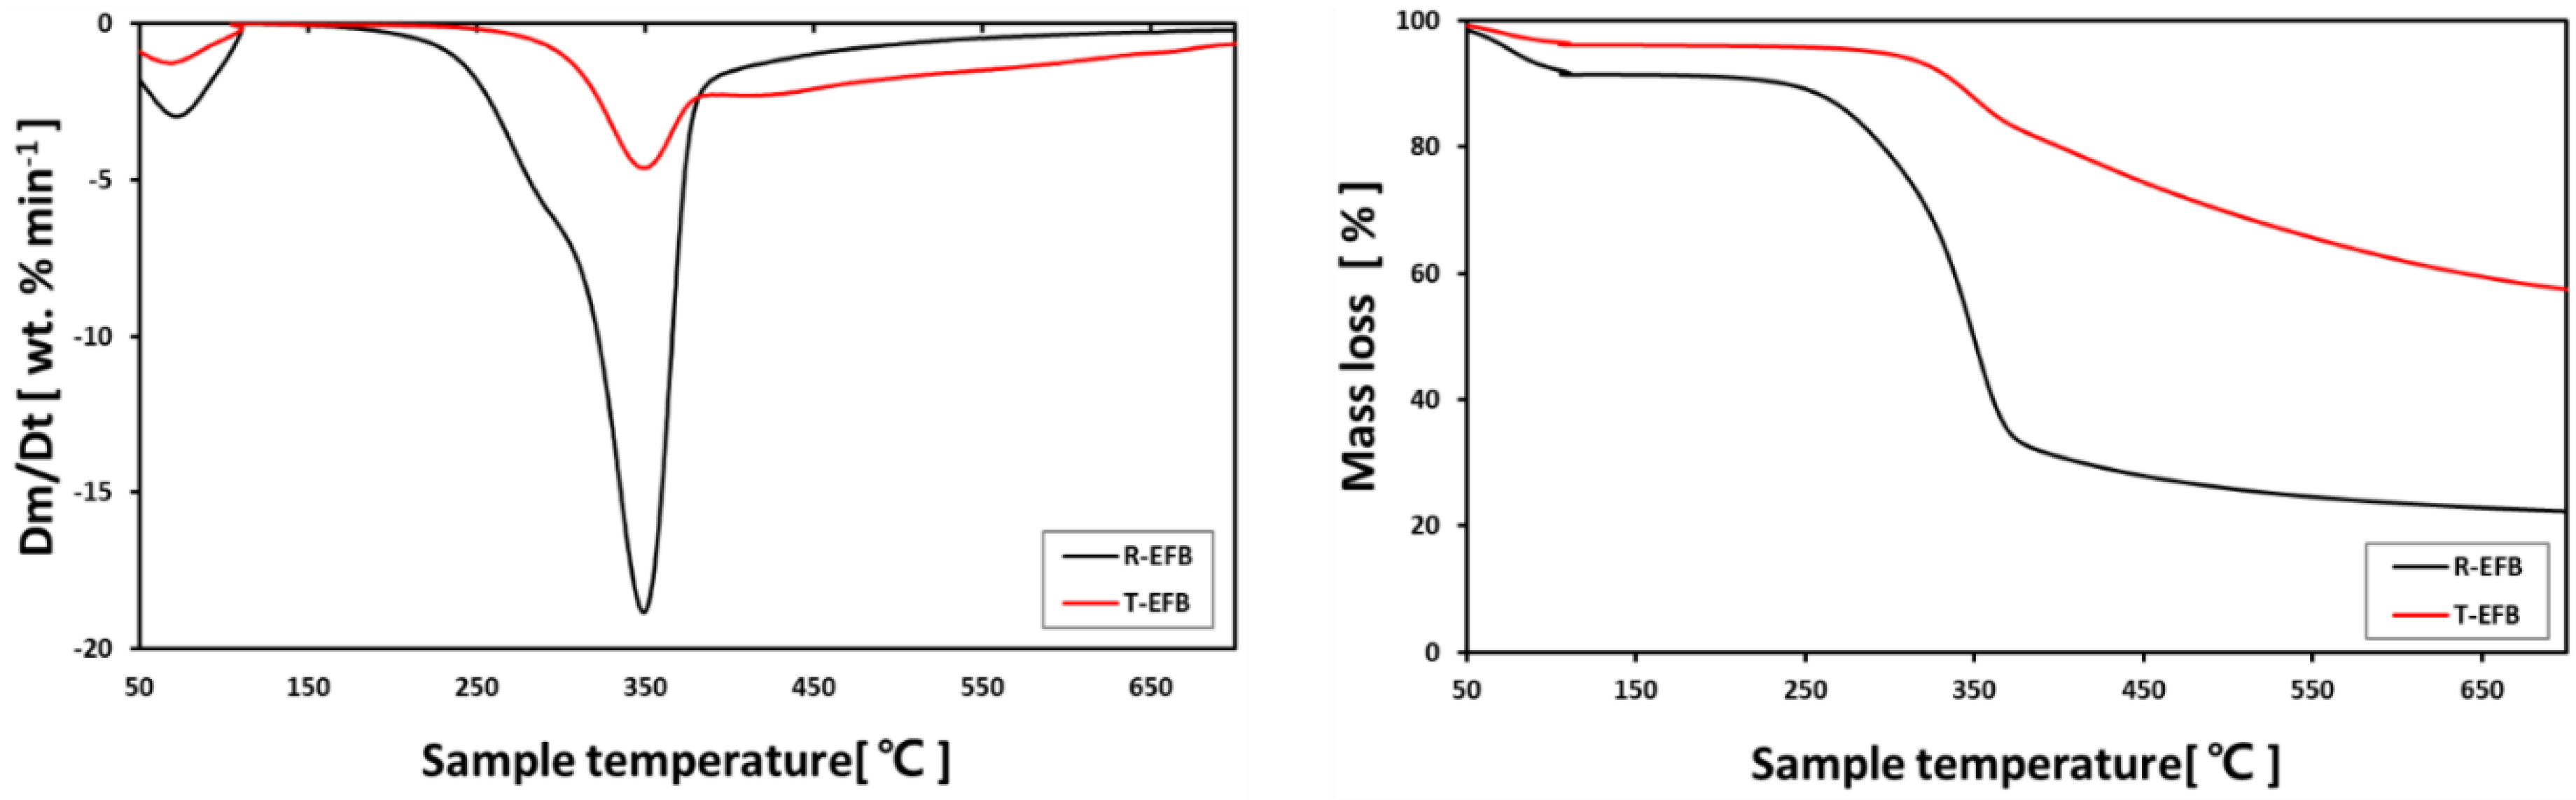
5.1. Comparison of R-EFB and T-EFB Combustion Characteristics with TG/DTG

To compare the thermal properties of the R-EFB and the T-EFB, we performed TG (Weight Loss Curves) and DTG (Derivative Thermogravimetric) tests on the two biomasses at a heating rate of 20 °C/min in TGA. Figure 5 shows the TG analysis curve and the DTG analysis curve, respectively. As shown in Figure 5, the two biomasses were dehydrated in the temperature range of 50–150 °C. The comparison showed that the R-EFB mass loss was higher than that of the T-EFB, which directly reflects the torrefaction technology that can remove more moisture from the R-EFB containing high moisture.
The initial degradation temperature of the birth material can be judged from the initial point of the drop in the TG curve. According to Novianti S. et al. studies [44], the initial degradation temperature of hemicellulose and cellulose in the biomass sample occurred between 170 °C and 250 °C. As shown in Figure 5a, the R-EFB after basic drying had the highest mass loss compared to T-EFB, reaching 78%, probably owing to the higher volatile content. Generally, hemicellulose was decomposed at less than 350 °C cellulose was degraded between 250 °C and 500 °C, and residual lignin was degraded at around 400 °C [45]. In the DTG curve, a small subpeak of the R-EFB was observed at about 295 °C, but the T-EFB did not form a subpeak, indicating that the R-EFB changed the hemicellulose structure during torrefaction. At the same time, owing to the thermal decomposition of cellulose, the main peaks of the T-EFB and the R-EFB after torrefaction were observed at around 360 °C. Because the cellulose peak of T-EFB was higher than that of R-EFB, the T-EFB reaction after torrefaction was less activated than the R-EFB because the R-EFB properties after torrefaction were closer to those of sub-bituminous coal.

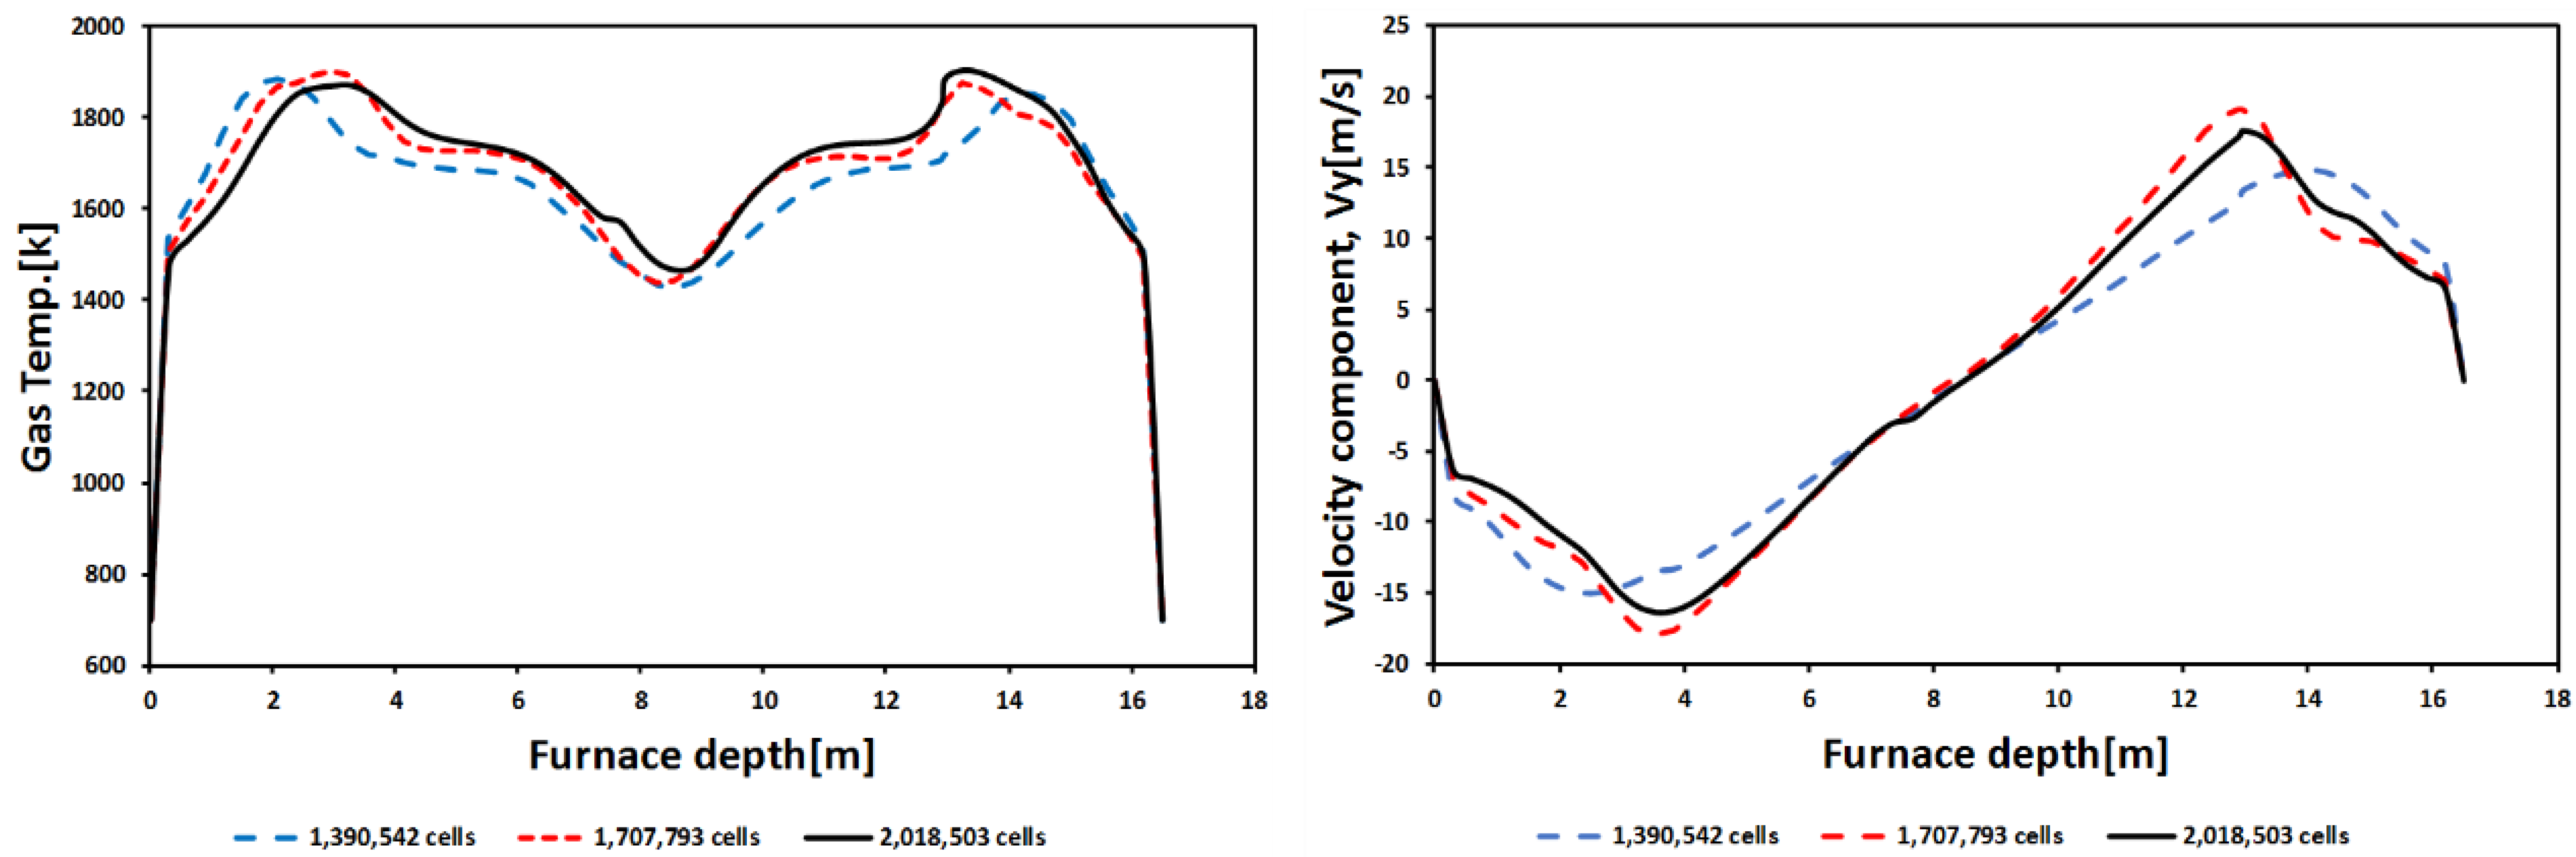
5.2. Grid Independence and Validation of the CFD Simulation

Grid independence studies were performed to the accuracy of the data results. we constructed three high-quality grids, each consisting of approximately 1.39 million, 1.7 million and 2.01 million hexahedral units. By comparing the gas temperature and the horizontal velocity component Vy, the horizontal cross section of the main combustion zone was along the centerline (x = 0–16.5 m, y = 8.25 m and z = 15.7 m). As can be seen from Figure 6, the simulation results with the three grids tended to be similar, but owing to the fineness of the grid, the 1.7 million and 2.01 million grids could accurately express the accuracy of the results. In addition to considering the economics of the time required for the simulation calculations, 1.7 million grids were eventually used for this simulation study.
Comparing the simulated data with the experimental data obtained by the power station, the temperatures are 333.5 °C and 353 °C, respectively. The simulated oxygen concentration is almost identical to the experimental data. At the same time, the simulated and experimental NOX yields are 170 ppm and 159 ppm (at 6% O2), respectively, with an error of only 6.5%. The UBC (Unburned Carbon) content simulation results and experimental data were 3.48 and 3.21, respectively, with an error of 8%. Therefore, since the UBC content is slightly less, the NOX generation increases. At the same time, compared with the NOX and UBC obtained by the DTF experiment, the NOX obtained by the DTF experiment was reduced by 28.6% compared with the pure coal combustion at the time of 30% co-firing, which is almost identical to the amount of NOX (28.2%) reduced by the case corresponding to the boiler simulation. At the same time, the number of SO2 (Sulfur Dioxide) produced was 474.2 and 476.1 ppm (at 6% O2), respectively, and the error was less than 0.4%. In addition, in Table 4, the heat absorption data of the tubes (superheater, reheater and economizer) in the upper part of the furnace obtained by simulation and experiment can be compared, and the maximum error is not more than 8%. Among them, the total endothermic value error is only 1.8%. Therefore, the above simulation results are an excellent example of the boiler combustion and pollutant emission characteristics of this study. At the same time, all the above experimental data provide a forceful verification of numerical simulation, indicating that the grid and calculation model selected in this study can accurately simulate the combustion characteristics of coal and T-EFB biomass in boilers.

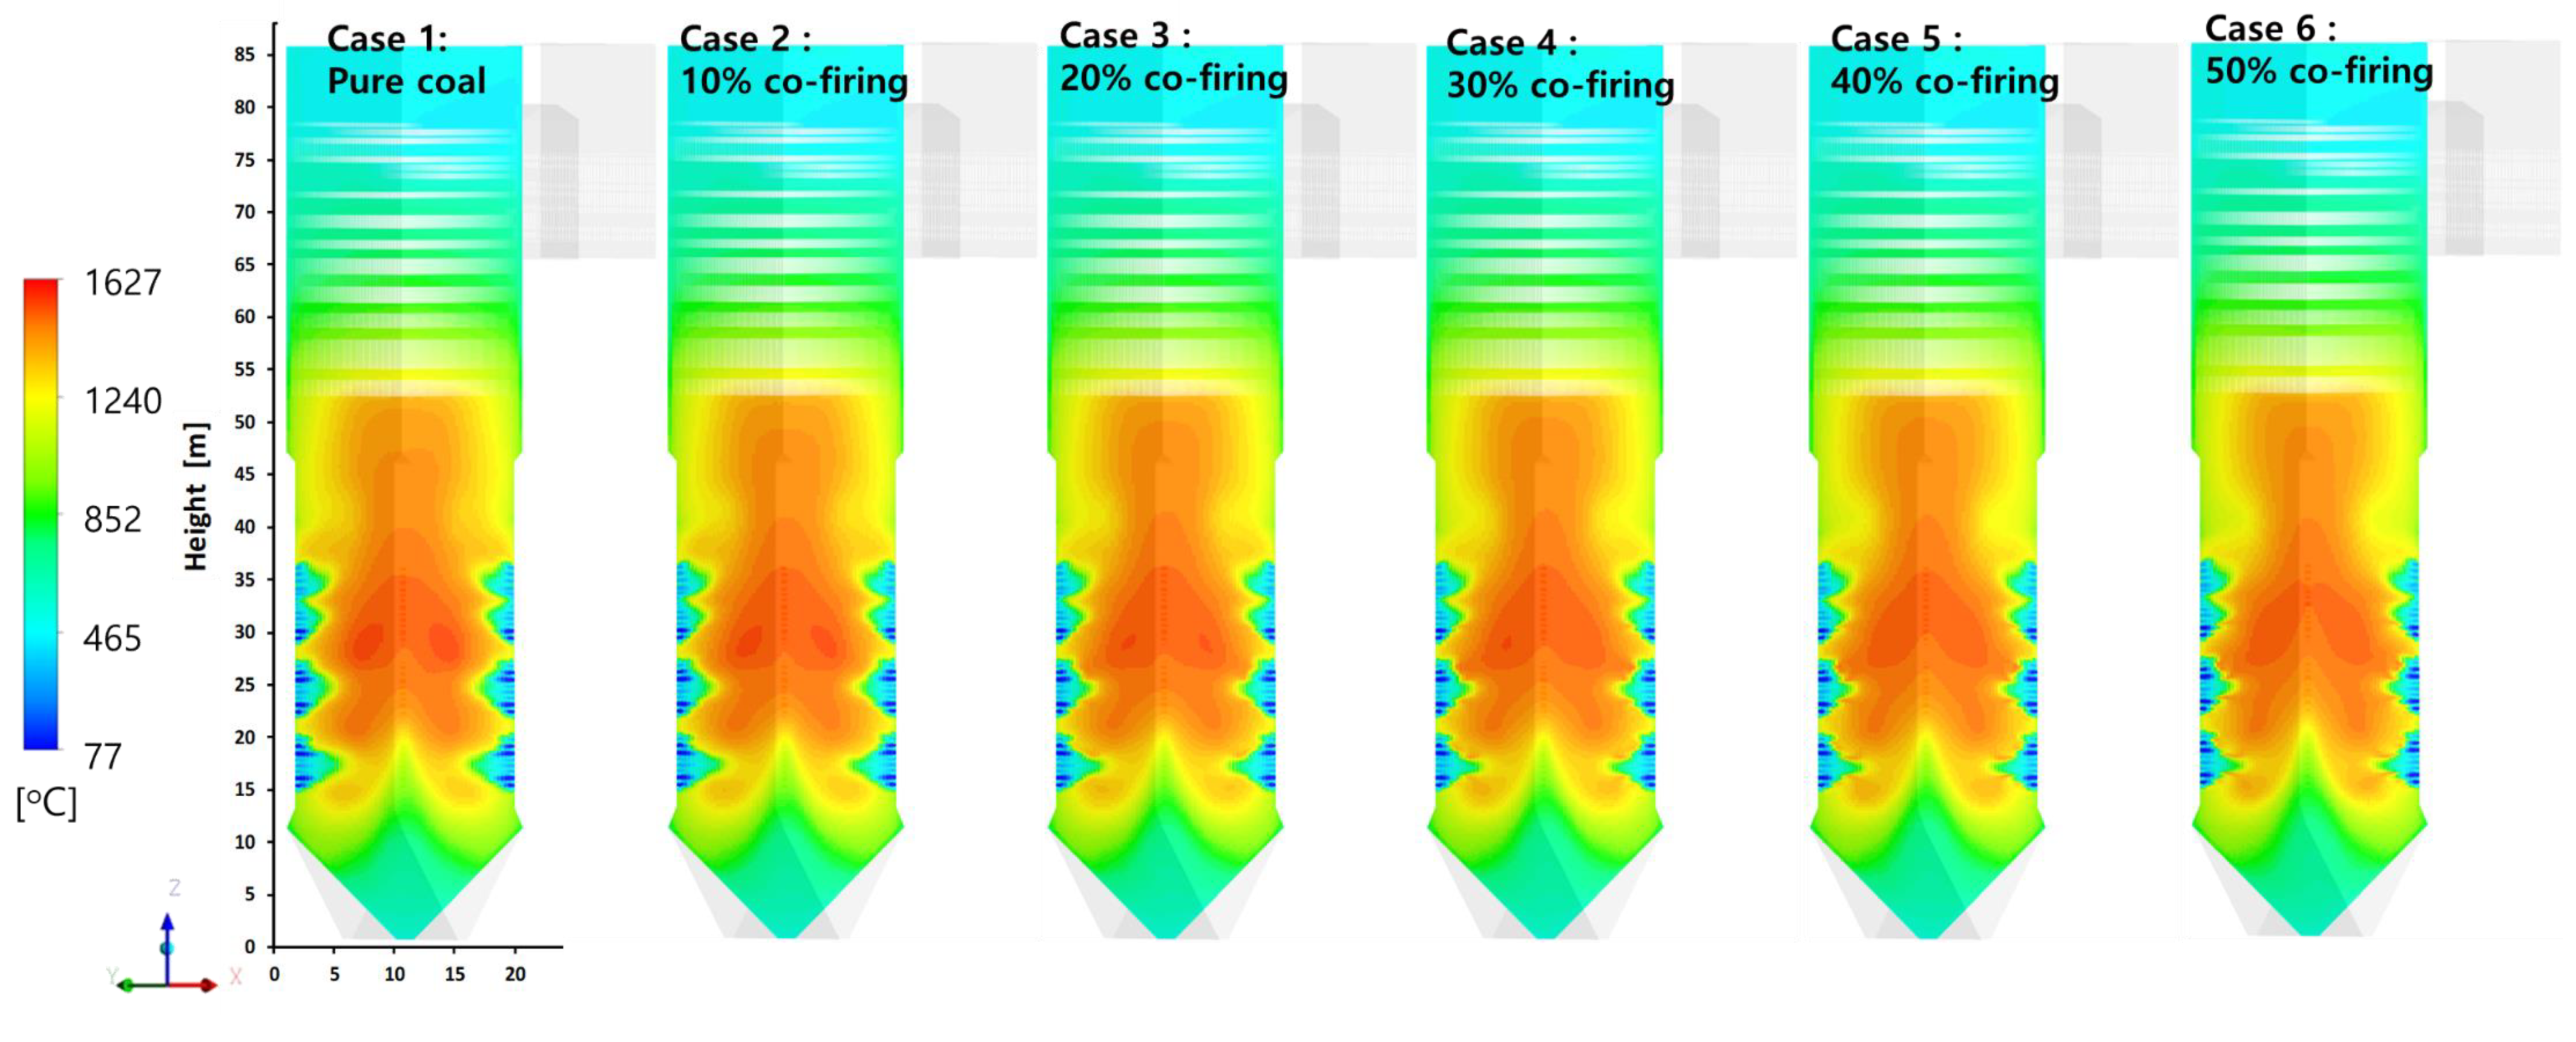
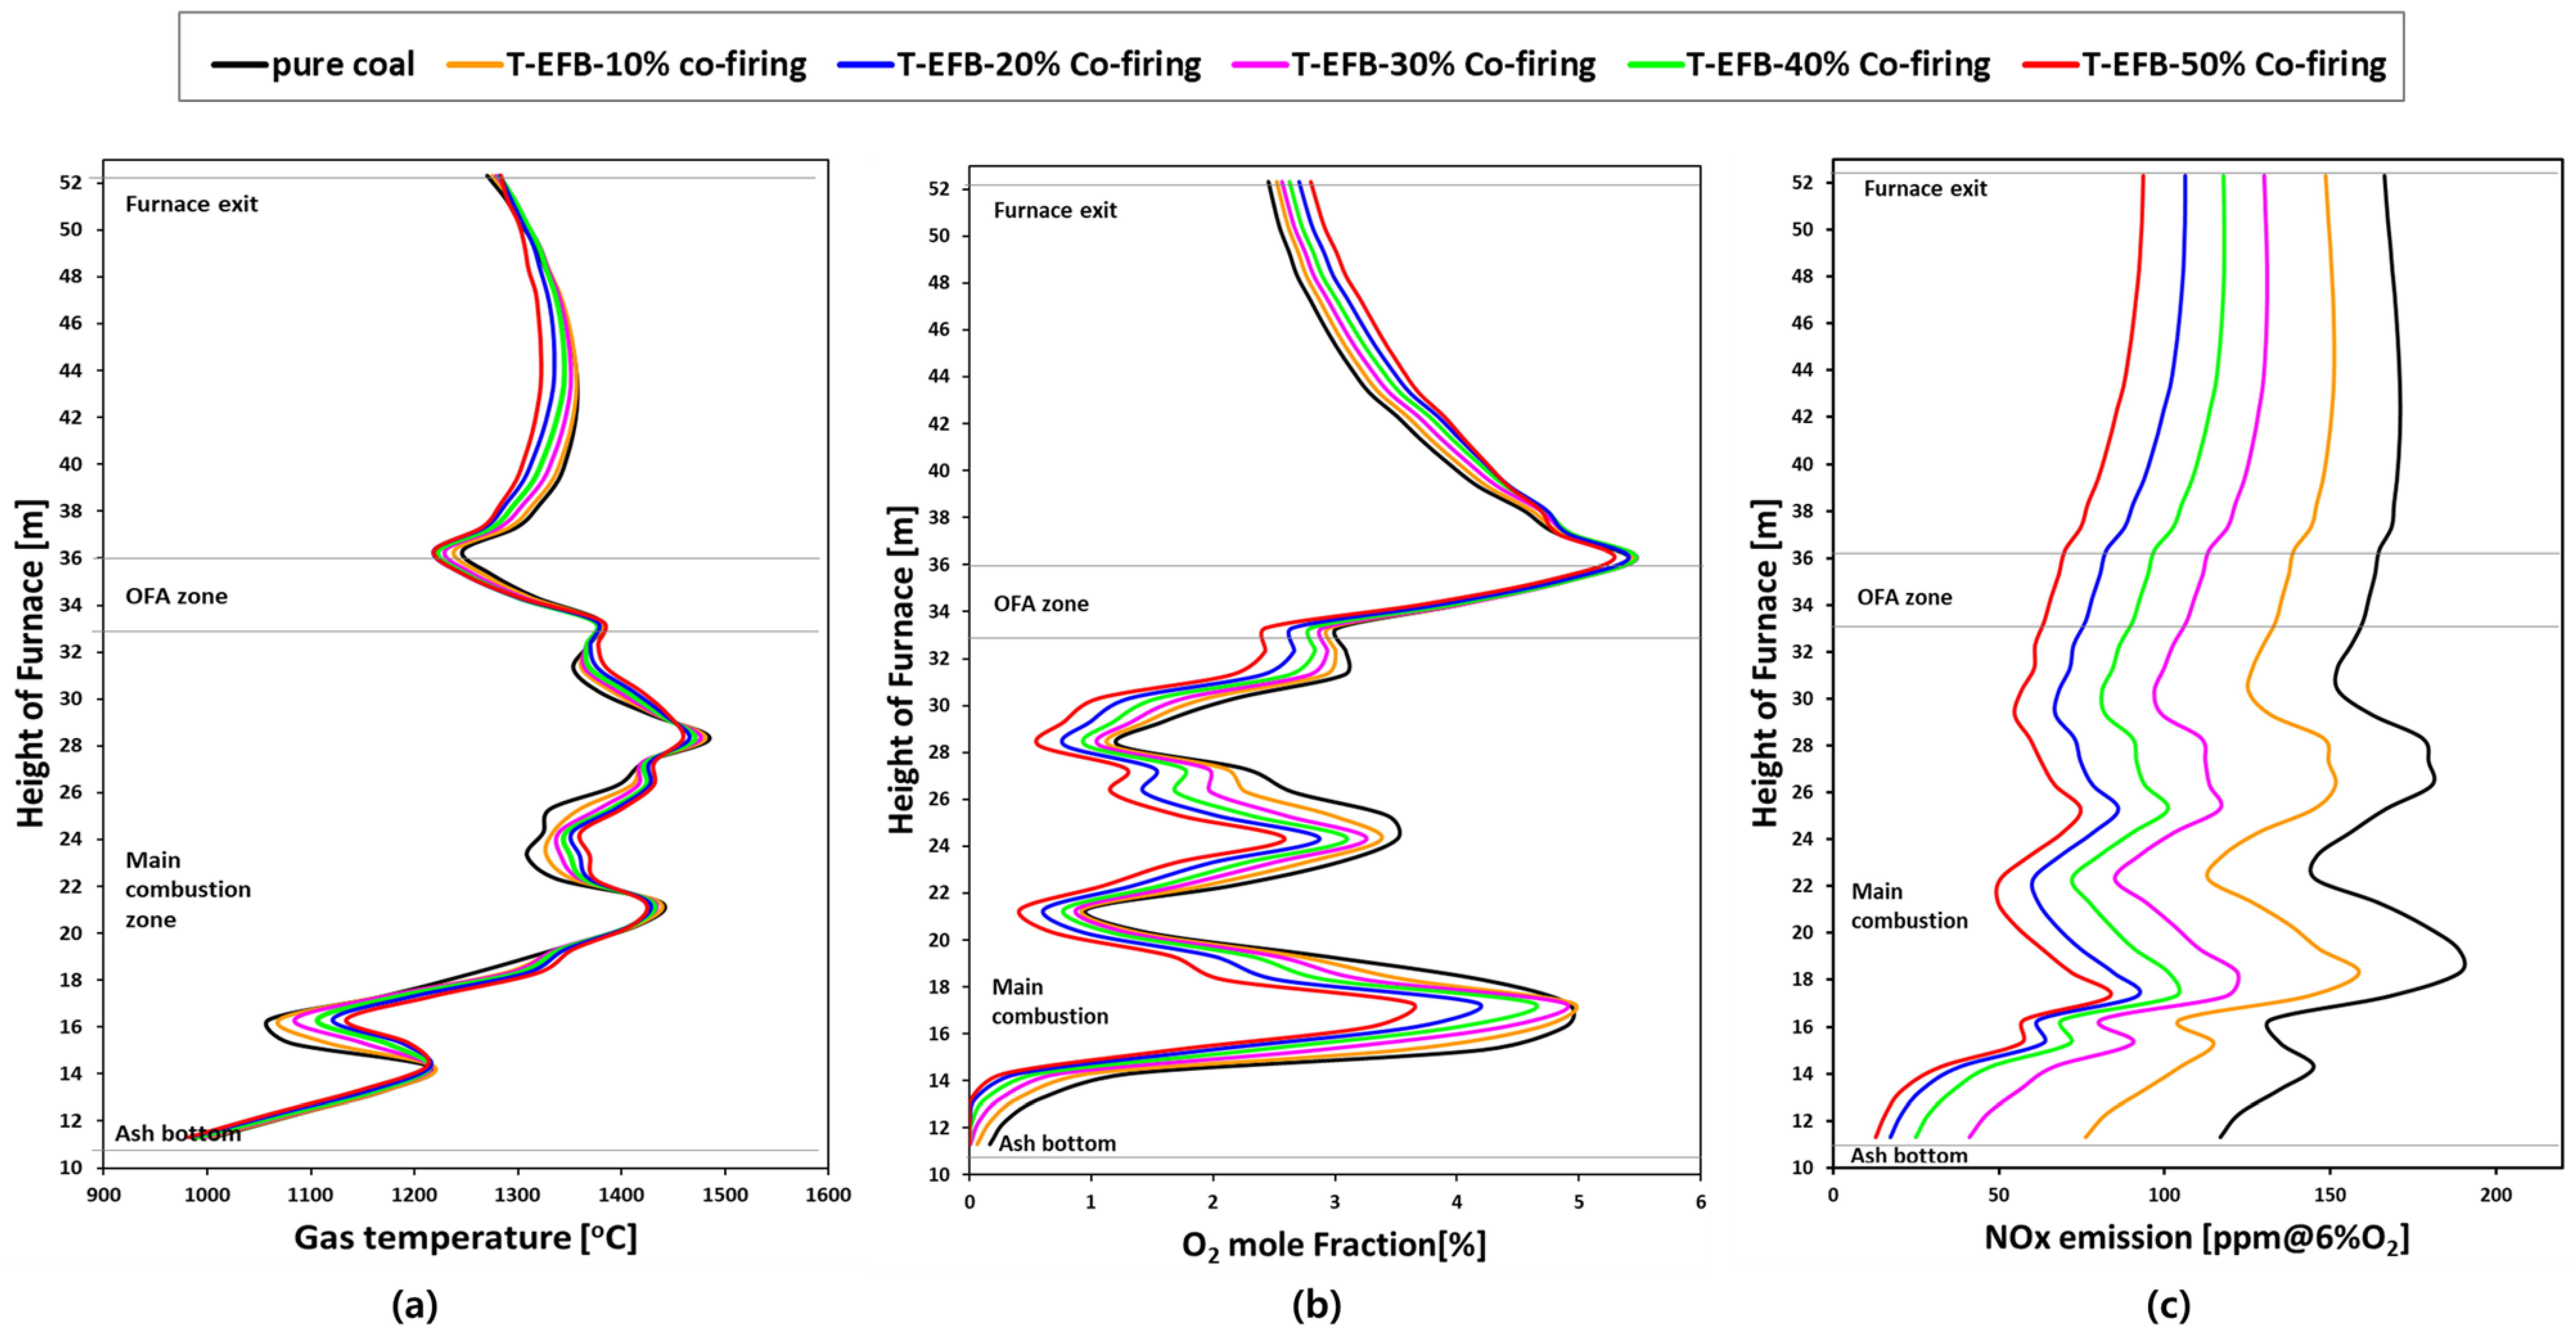
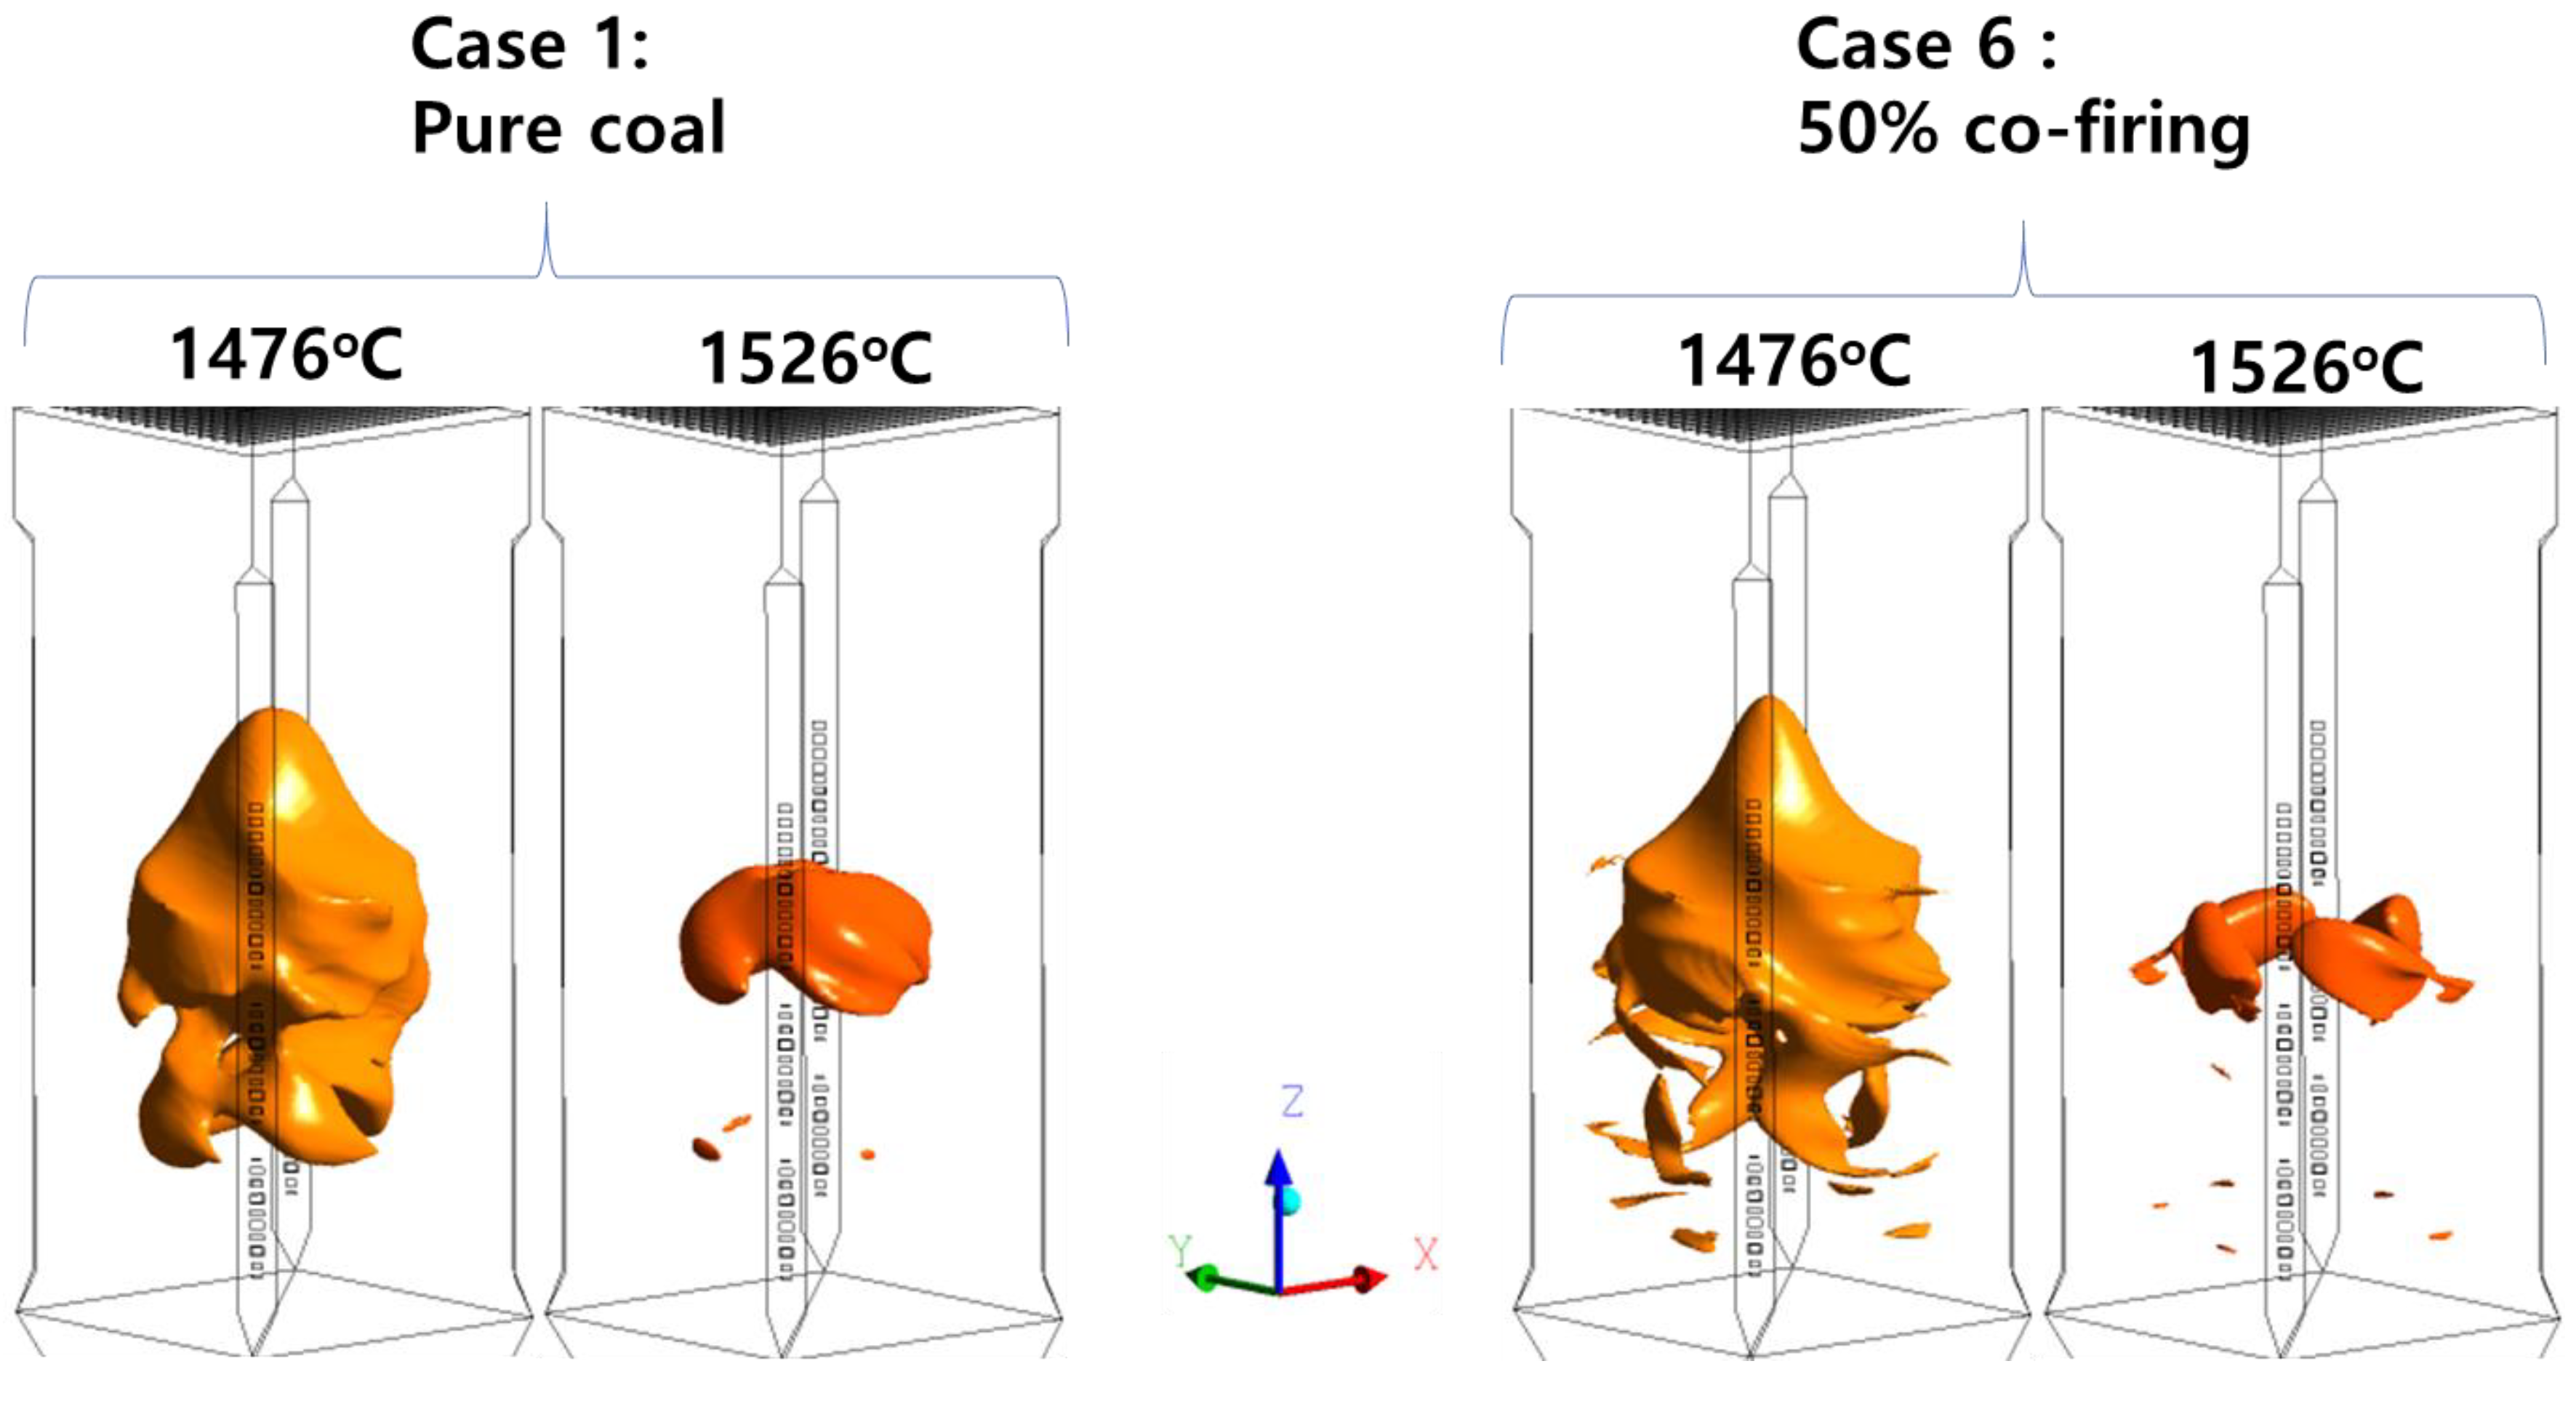
5.3. Effects of T-EFB Co-Firing Substitutions on the Combustion Characteristics

The effect of T-EFB co-firing on the combustion characteristics of the boiler was analyzed by simulation. Figure 7 shows the temperature distribution of the vertical section of the boiler for T-EFB co-firing with different blending ratios. Apparently, the simulation results show the same trend in the gas temperature distribution inside the boiler under various calculation conditions. The T-EFB has similar characteristics to sub-bituminous coal, so T-EFB pretreated by torrefaction technology revealed replace some of the coal for mixing, without affecting the combustion stability of the boiler.
Based on the temperature distribution profiles along the furnace height (from the bottom of the ash to the furnace outlet) under various T-EFB blending ratio in Figure 8a, it can be seen that the gas temperature distribution is similar for each calculation conditions, but there is some temperature difference between the main combustion zoon and the OFA burnout zoon. In the main combustion zoon, the peak temperature shows a decreasing trend as the amount of biomass added increases. According to the peak temperature data in Table 4, when the T-EFB mixing ratio reaches 50%, the peak temperature of the furnace was 25 °C lower than the highest temperature produced by the pure coal combustion. Finally, there was a clear tendency for the gas temperature decrease with Increased T-EFB substitution in the OFA burnout zoon, due to the different degree of burnout of unburned particles. Compared to the pure coal case, the average temperature under co-firing conditions was lower in the OFA burnout zone which may result from a high percentage of pulverized coal, delayed ignition in the main combustion zoon, low burnout rate and the oxidation reaction of unburned fuel in this zoon result in high temperatures. As shown in Figure 8a, the gas temperature near each burner increases slightly as the T-EFB co-firing ratio increases. The main reason is that biomass has a higher reaction rate than coal dust and contains a large amount of volatile matter, which generates much heat from combustion and conducive to improving the ignition and combustion characteristics of coal. At the same time, the heat generated by the combustion of volatile fractions of matter accelerates the rate of gas rise and shortens the particle residence time.
Figure 8b shows the average O2 concentration curve along the furnace height under various T-EFB blending ratio. In each case, higher O2 concentrations were displayed near the burners in the main combustion zone but were gradually depleted as the combustion reaction occurred. Compared with pure pulverized coal combustion, T-EFB fuel can devolatilize in a short period of time, and combustion produces high temperature to promote pulverized coal ignition, so with the co-firing ratio, O2 concentration consumption increases, and the O2 residual concentration was decreased in the main combustion zone. When comparing Case 1 and Case 6, there is a 1.5% difference in oxygen concentration near the burner zones. Therefore, pulverized coal combustion is under high temperature and low oxygen reduction conditions, which will suppress the production of fuel-based NOx in the main combustion zone.
The iso-surfaces of Figure 9 show the local high-temperature zones of 1476 °C and 1526 °C in the furnace of Case 1 (pure coal), Case 6 (50% co-firing). However, it is interesting to note that at an equivalent temperature of 1476 °C, the high-temperature zones of the 50% co-firing case is more widely distributed than the pure coal case. However, when the temperature is at 1526 °C, the T-EFB co-firing cases are again significantly less than the high temperature zones produced by the pure coal cases. The main reason for this phenomenon is that the T-EFB containing higher volatile substances in the mixed burning case is burned near the burner to generate a high temperature zone (1476 °C). On the contrary, the reduction in the amount of pulverized coal in the co-firing case caused the formation of a high temperature area (1526 °C) in the center of the furnace. The distribution of the high-temperature zones is closely related to the heat transfer of the furnace wall and the thermal NO formation. The detailed analysis will be discussed in the next section.

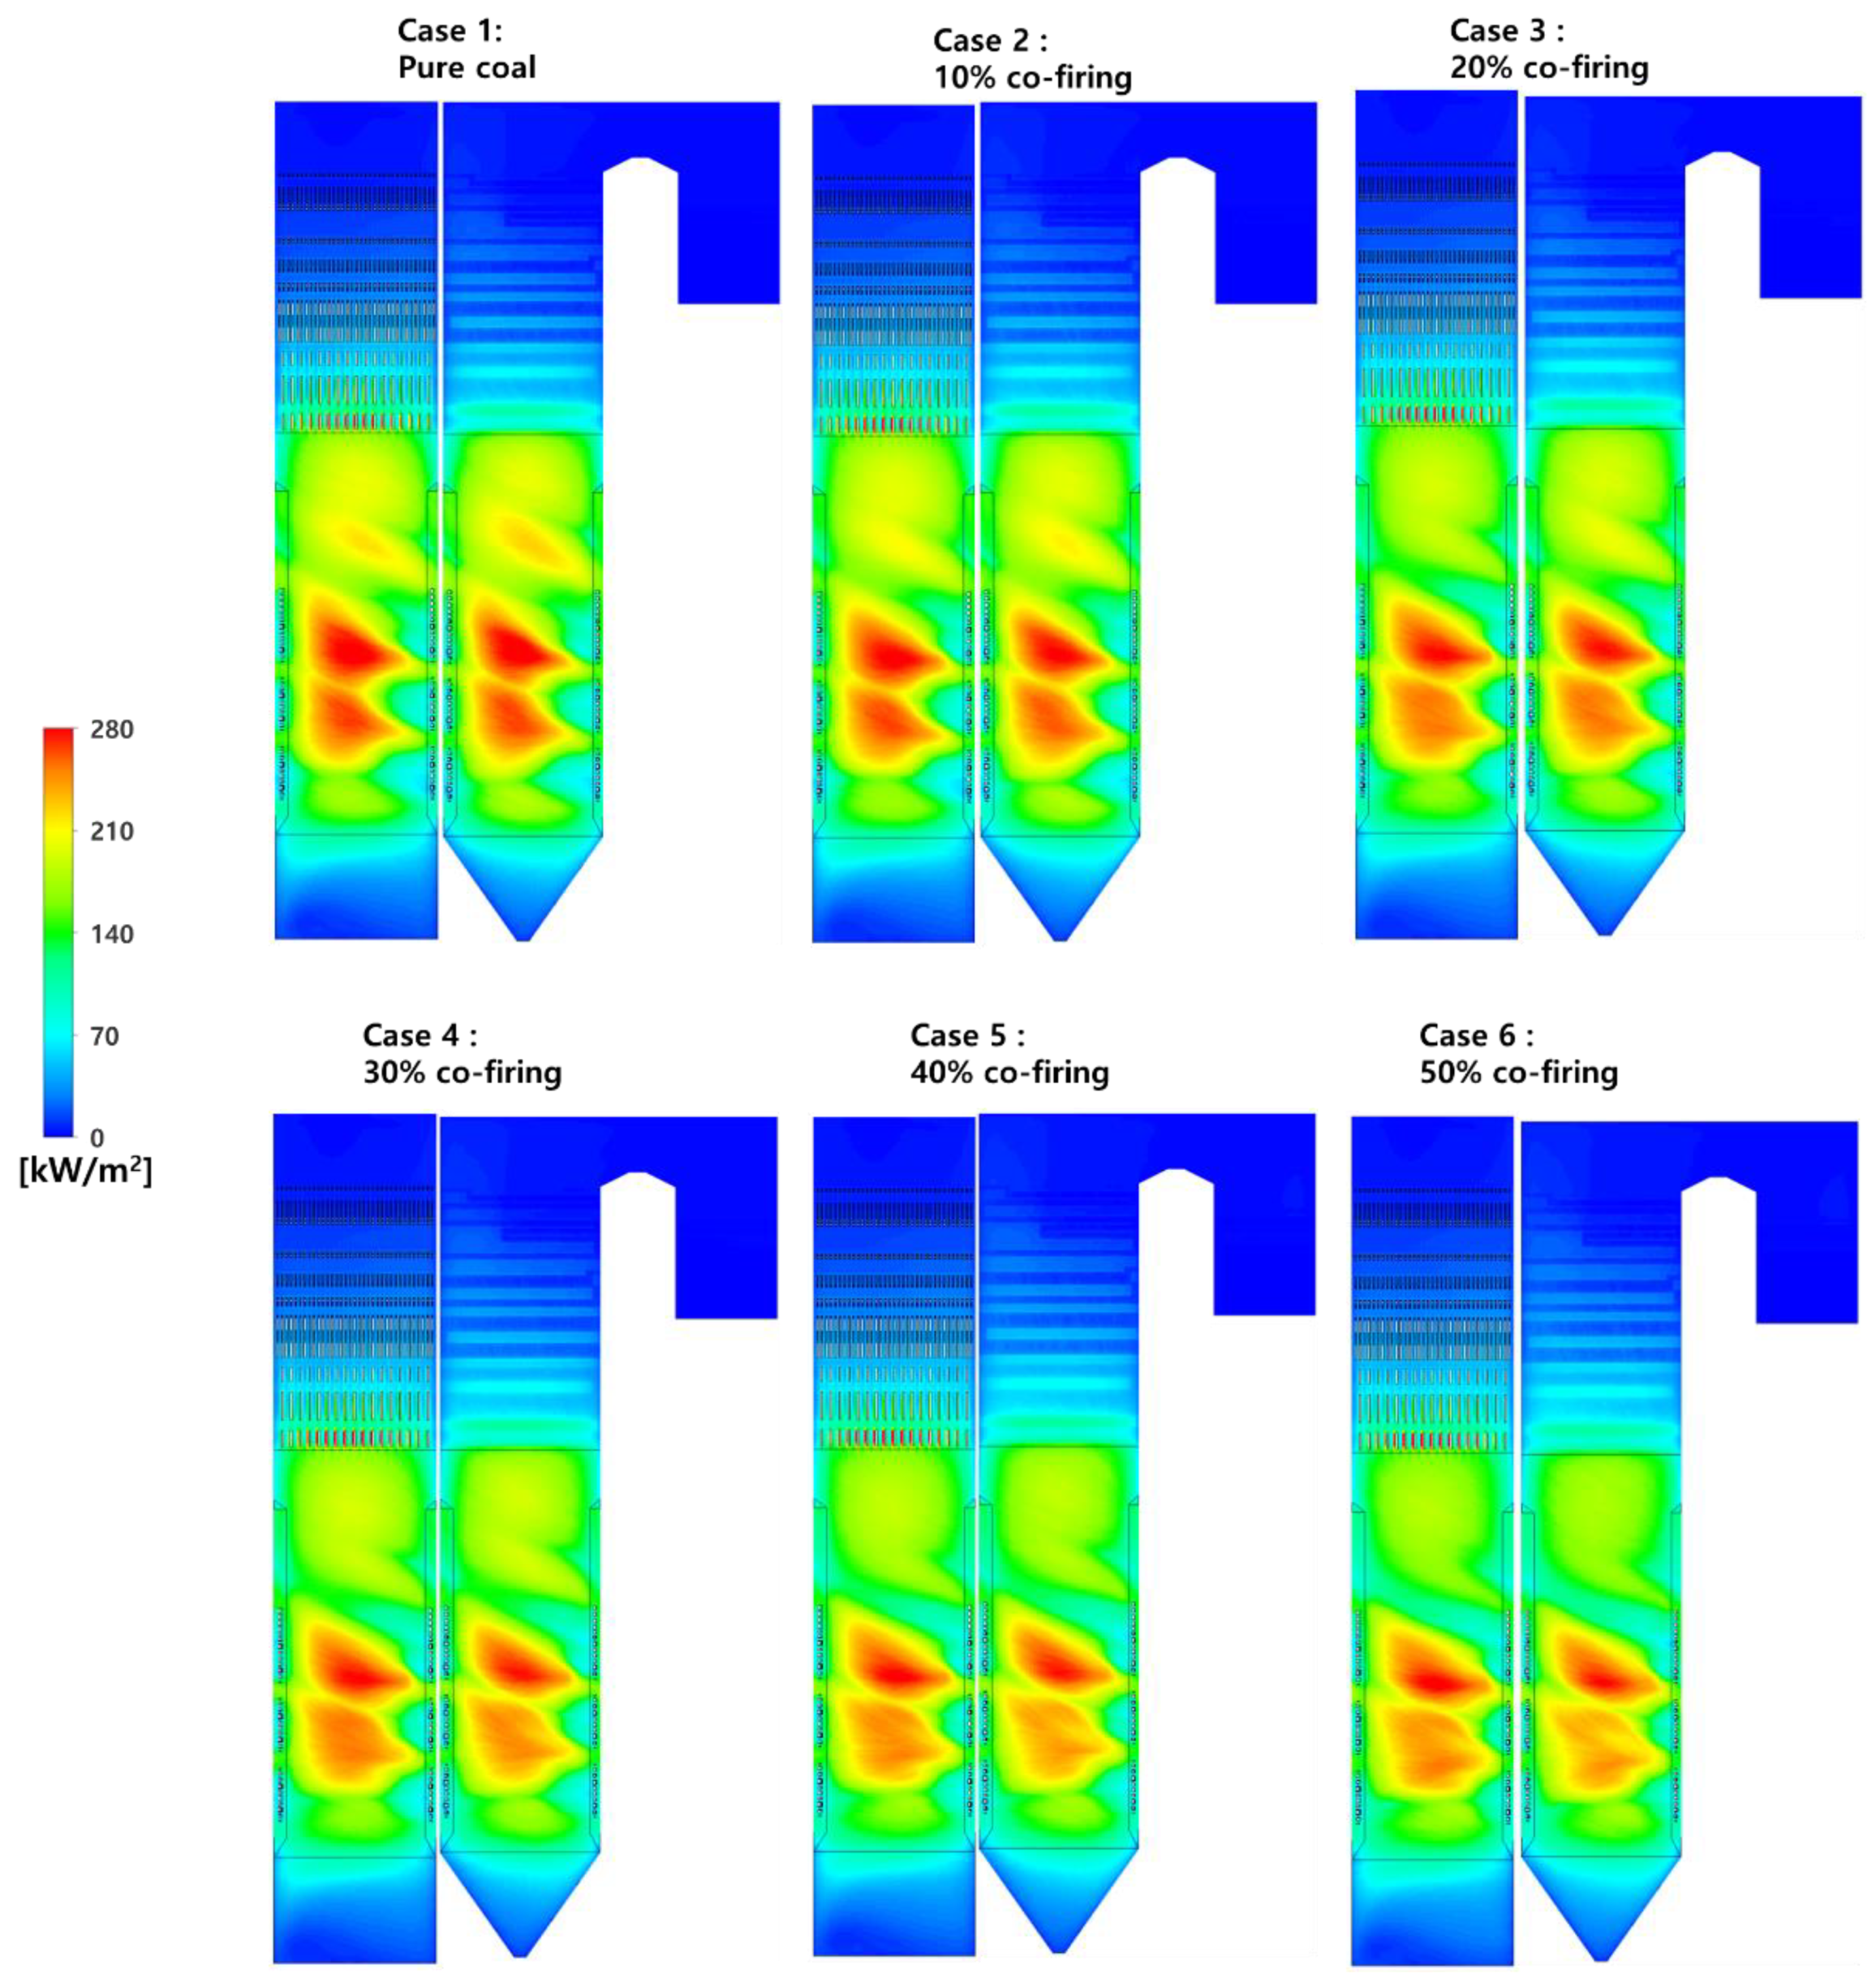
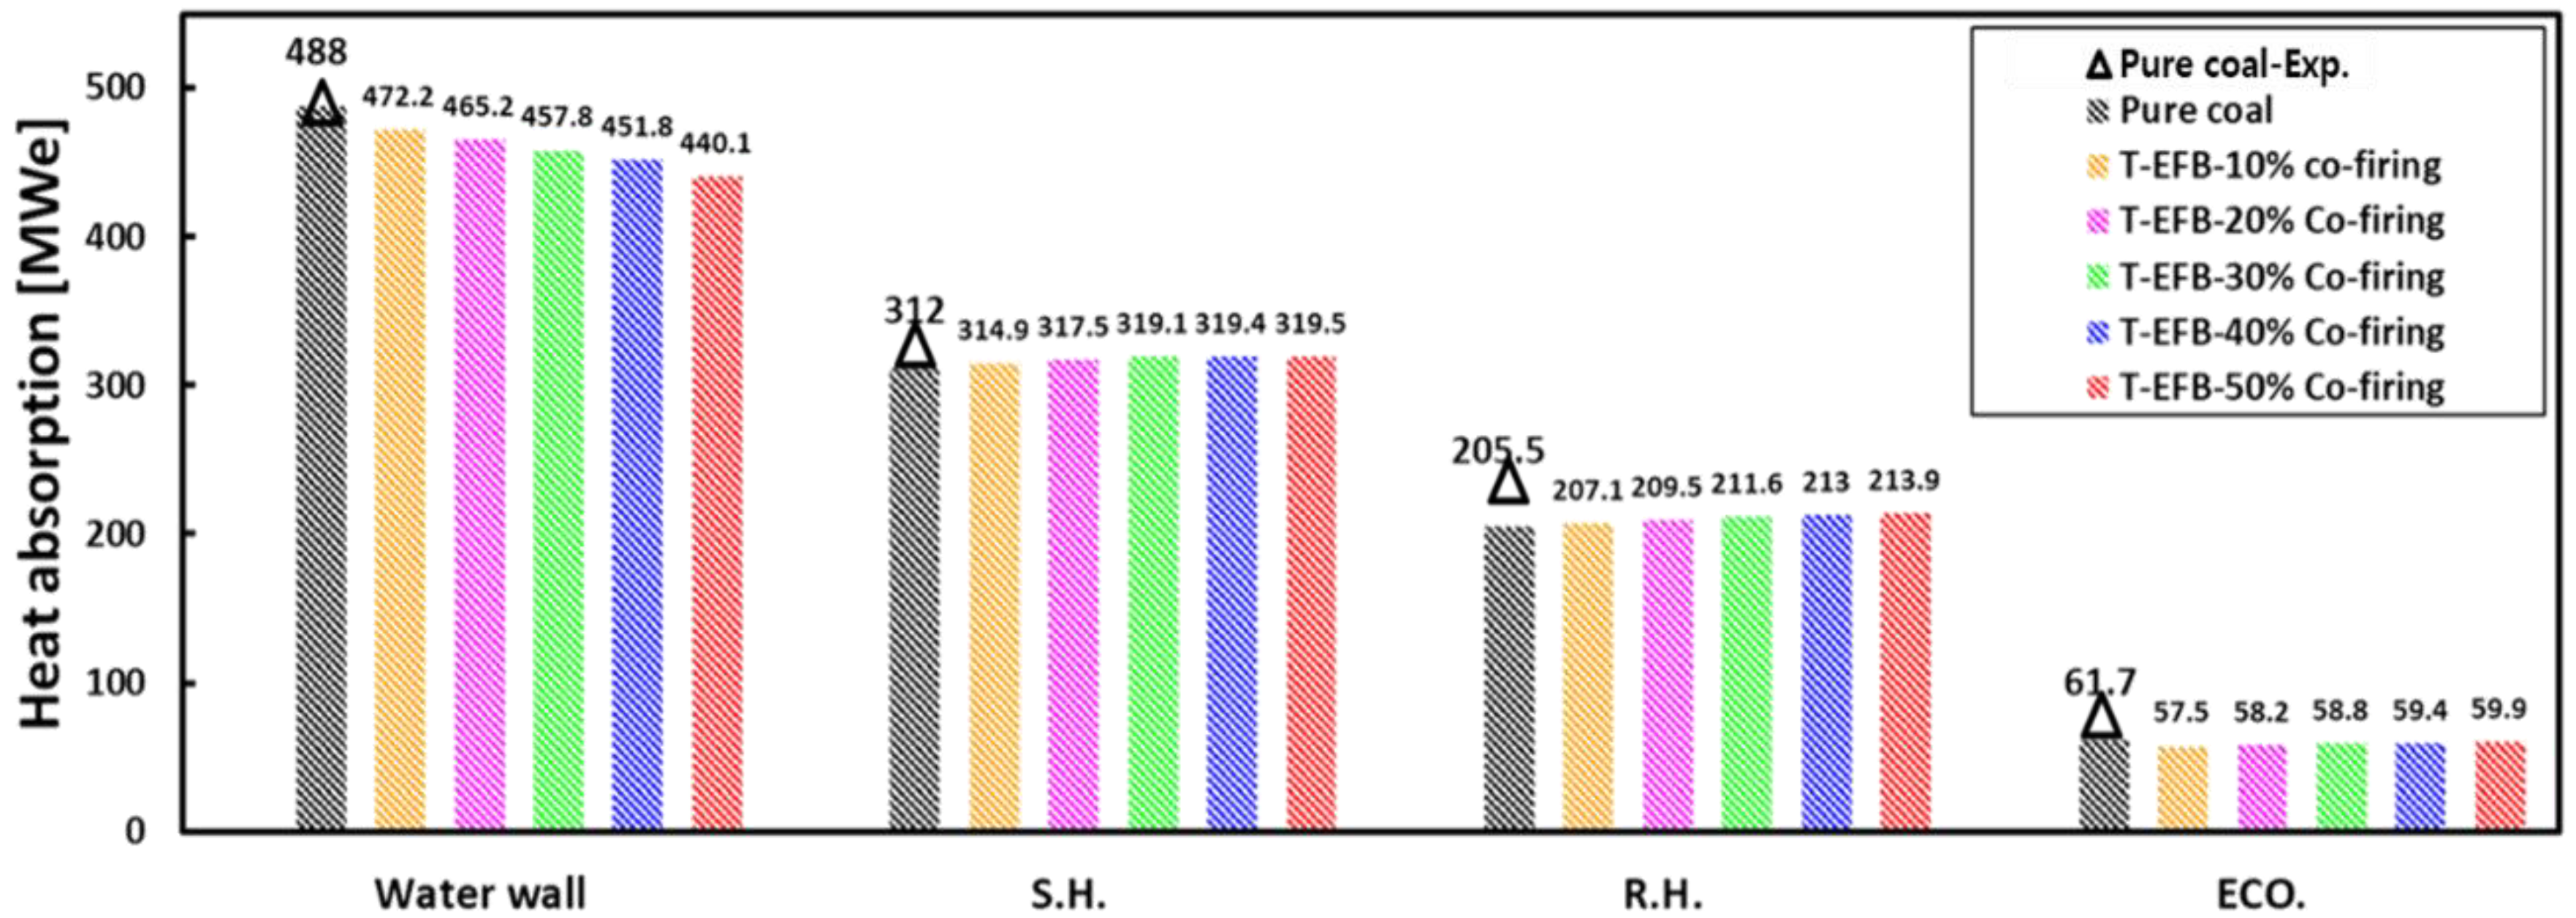
5.4. Effects of T-EFB Co-Firing Substitutions on the Heat Flux Distribution

As shown in Table 4, the furnace exit gas temperature (FEGT) was compared under the various T-EFB blending ratio. The field test data (1257 °C and simulated data (1258.8 °C) of the case 1. (pure coal) is almost the same. Moreover, the FEGT increases as the amount of T-EFB substitution increases. The maximum temperature difference between cases is about 10 °C. The temperature of the furnace outlet is very important for the operation of the boiler of the power plant, the general temperature is maintained at about 1200 °C [46]. Inside the boiler, there are two main types of heat transfer from the water walls, radiant and convective. Radiation heat transfer accounts for more than 95% of this. The water wall radiation heat transfer was mainly determined by the gas temperature. Therefore, the heat flux distribution of the furnace wall and the gas temperature distribution should have similar properties, the maximum heat flux of the furnace wall occurs at the highest temperature (i.e., the top burner area). This indicates that the heat absorption at the surface of the furnace wall was mainly determined by thermal radiation proportional to the temperature.
Figure 10 shows the heat flux distribution of the water wall at different co-firing ratios of T-EFB. It can be observed that with the increase of T-EFB, the area of heat flux distribution of the furnace wall in the main combustion area becomes more extensive, but the maximum degree of heat flux decreases, which shows a similar pattern to the gas temperature distribution. However, in the burnout area above the main combustion zone, the furnace wall heat flux shows a clear downward trend due to the lower gas temperature. Second, based on some heat exchanger heat absorption data in Table 4 and Figure 11, it can be seen that in the pure coal case, the heat absorption simulation predicted for the furnace wall is 488 MWe, which is very close to the actual operating data (482 MWe). However, when the amount of T-EFB was increased, the corresponding heat absorption at the surface of the water wall decreased. In its place, the convection tube bundle above the furnace increases heat absorption accordingly. Furthermore, the UBC reached 4.2% when the T-EFB blending ratio reached 50%, which resulted in a significant reduction in radiative heat transfer from the furnace wall. Compared to the pure coal case, heat transfer reduction is 32 MWe. Despite a small increase in the heat exchanger RH and SH above the burner zones, the total heat absorbed by the boiler is still on a downward trend and the efficiency of the boiler was slightly reduced. Therefore, T-EFB co-firing under different blending ratio conditions change the heat flux distribution during boiler operation.

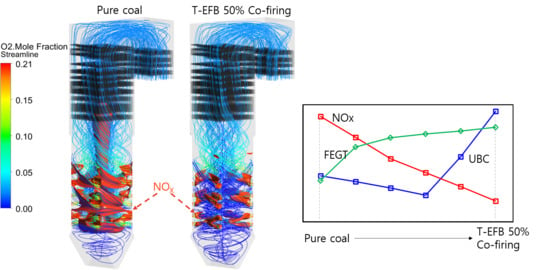
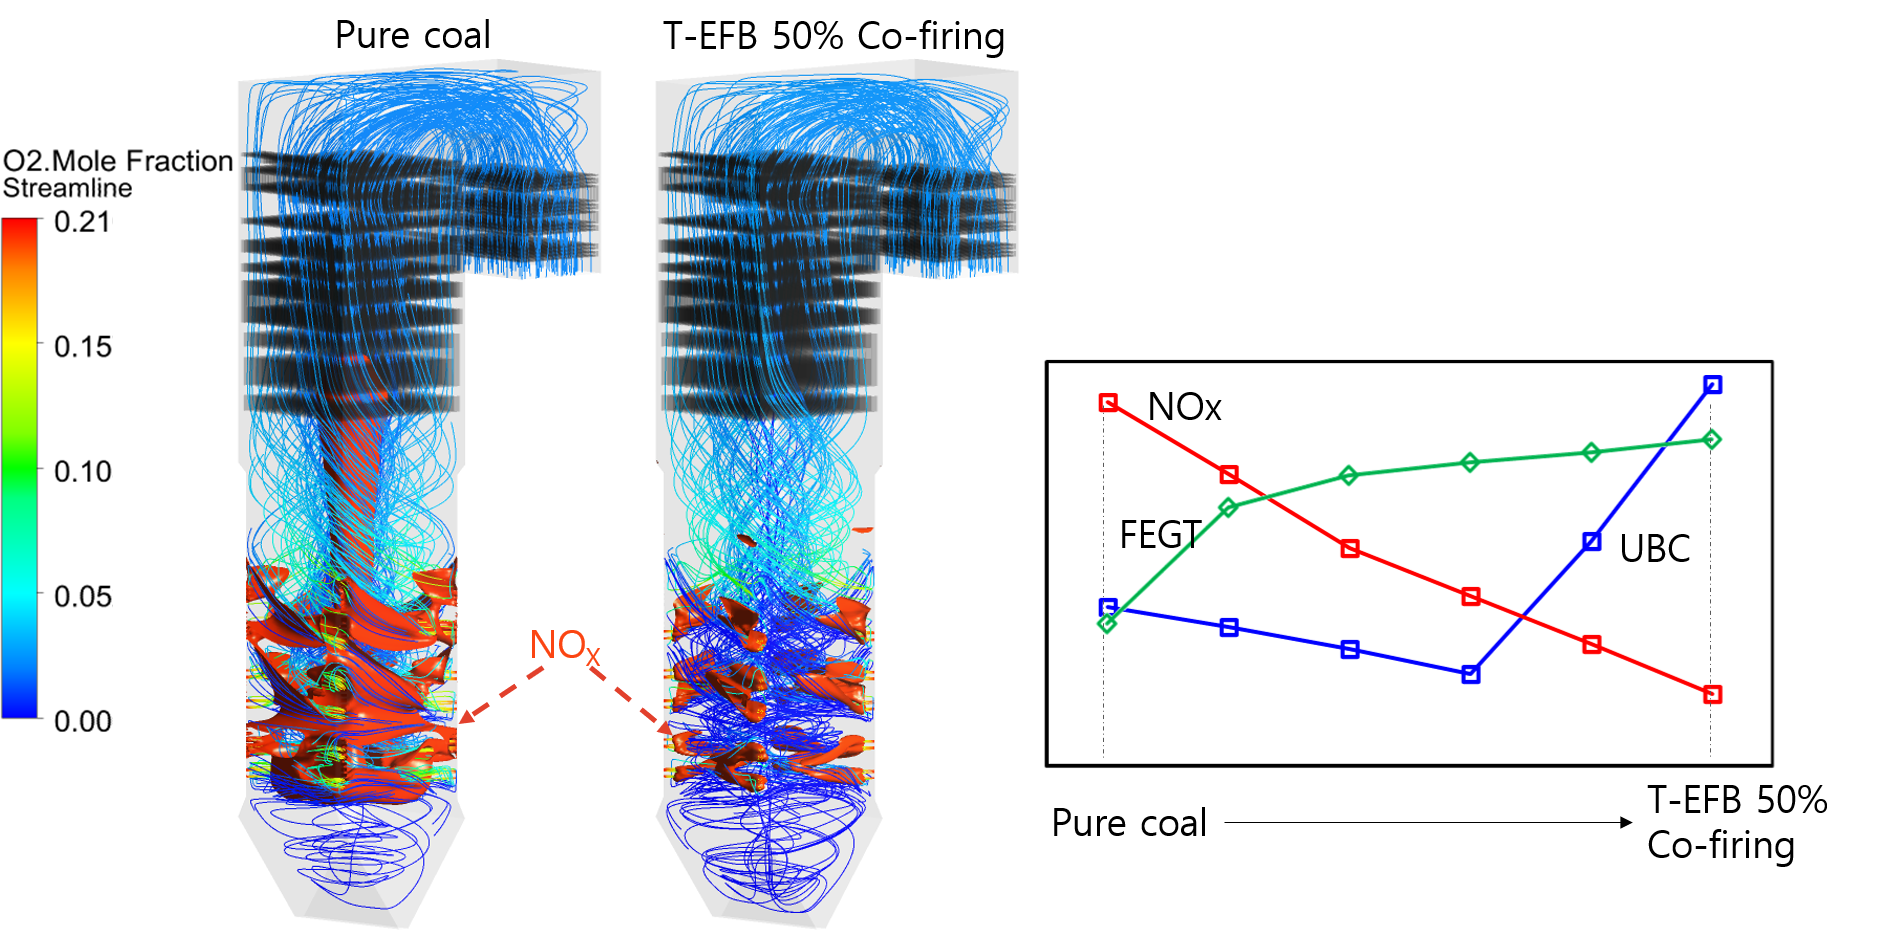
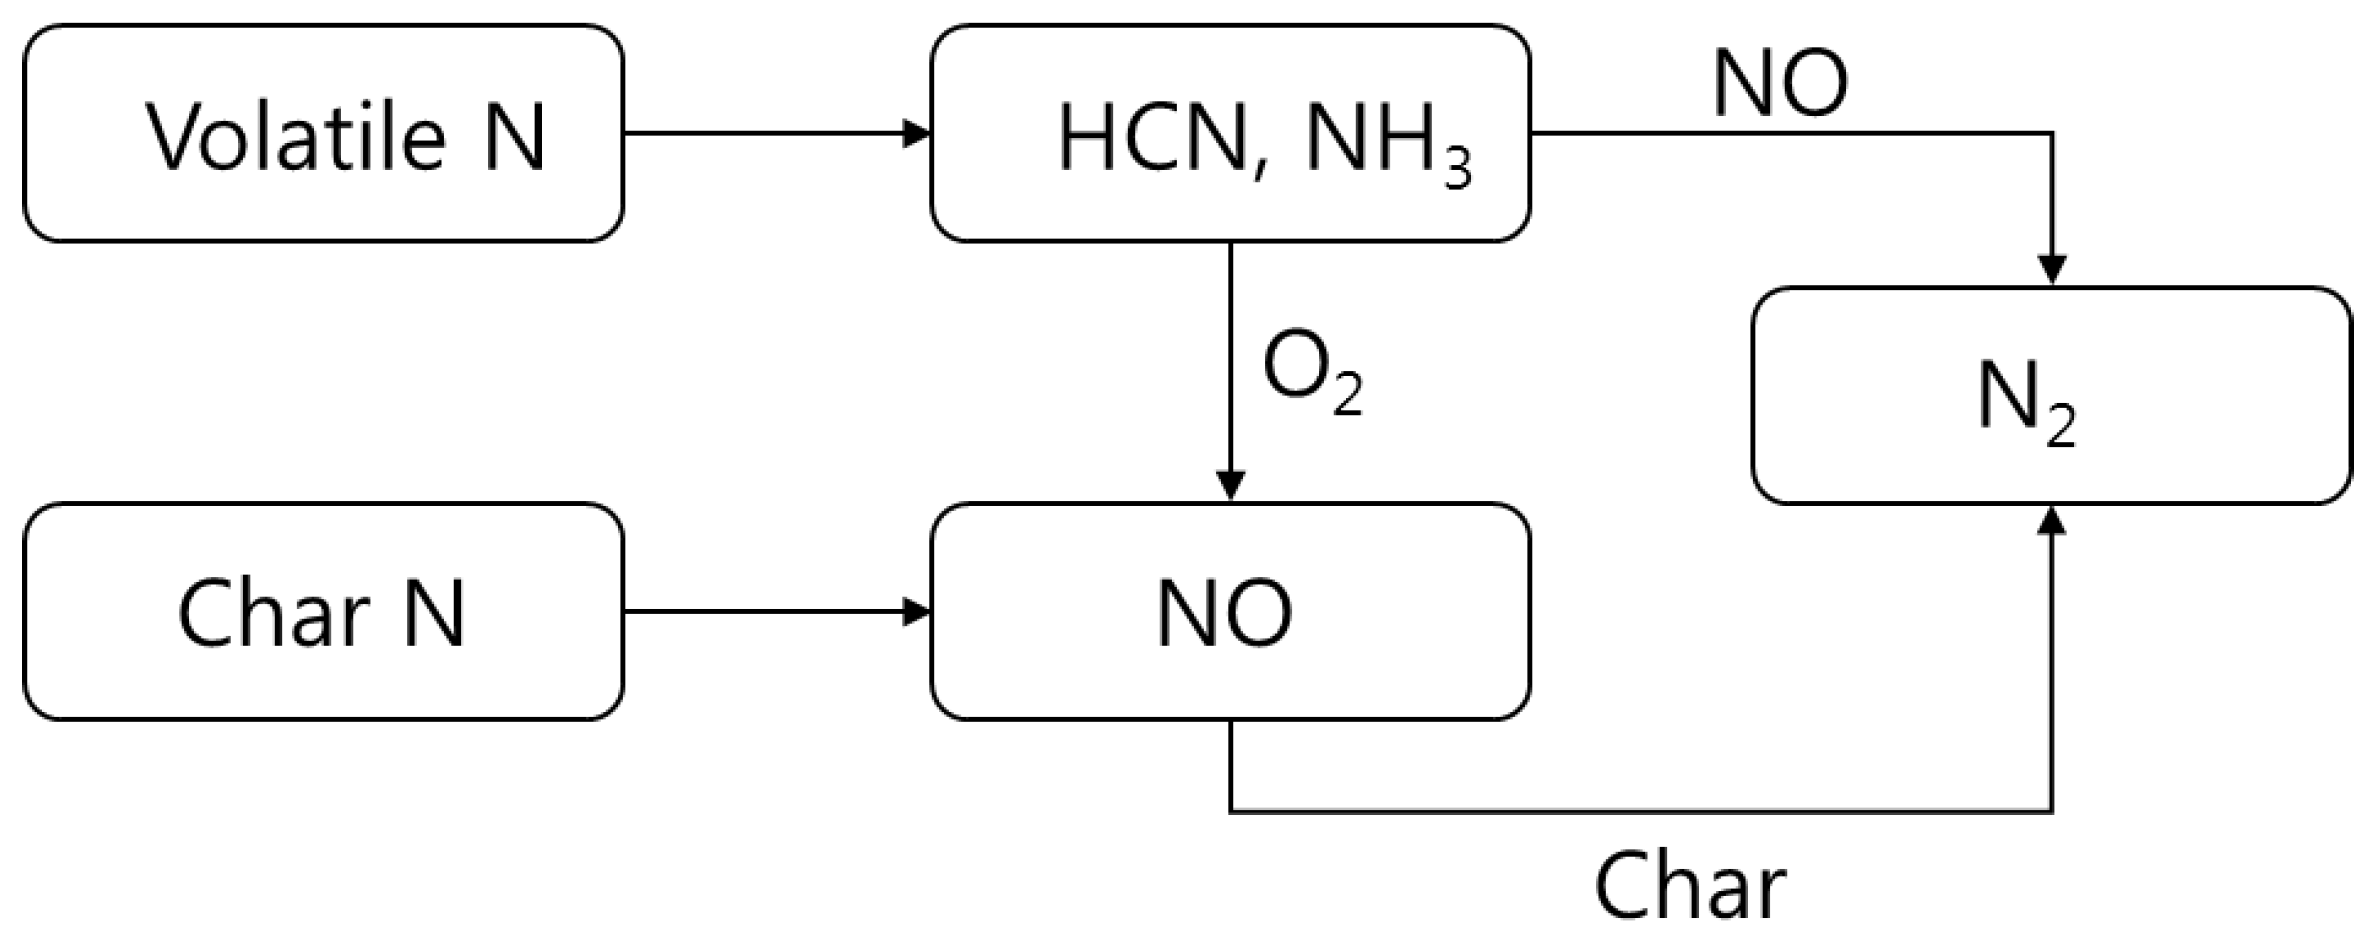
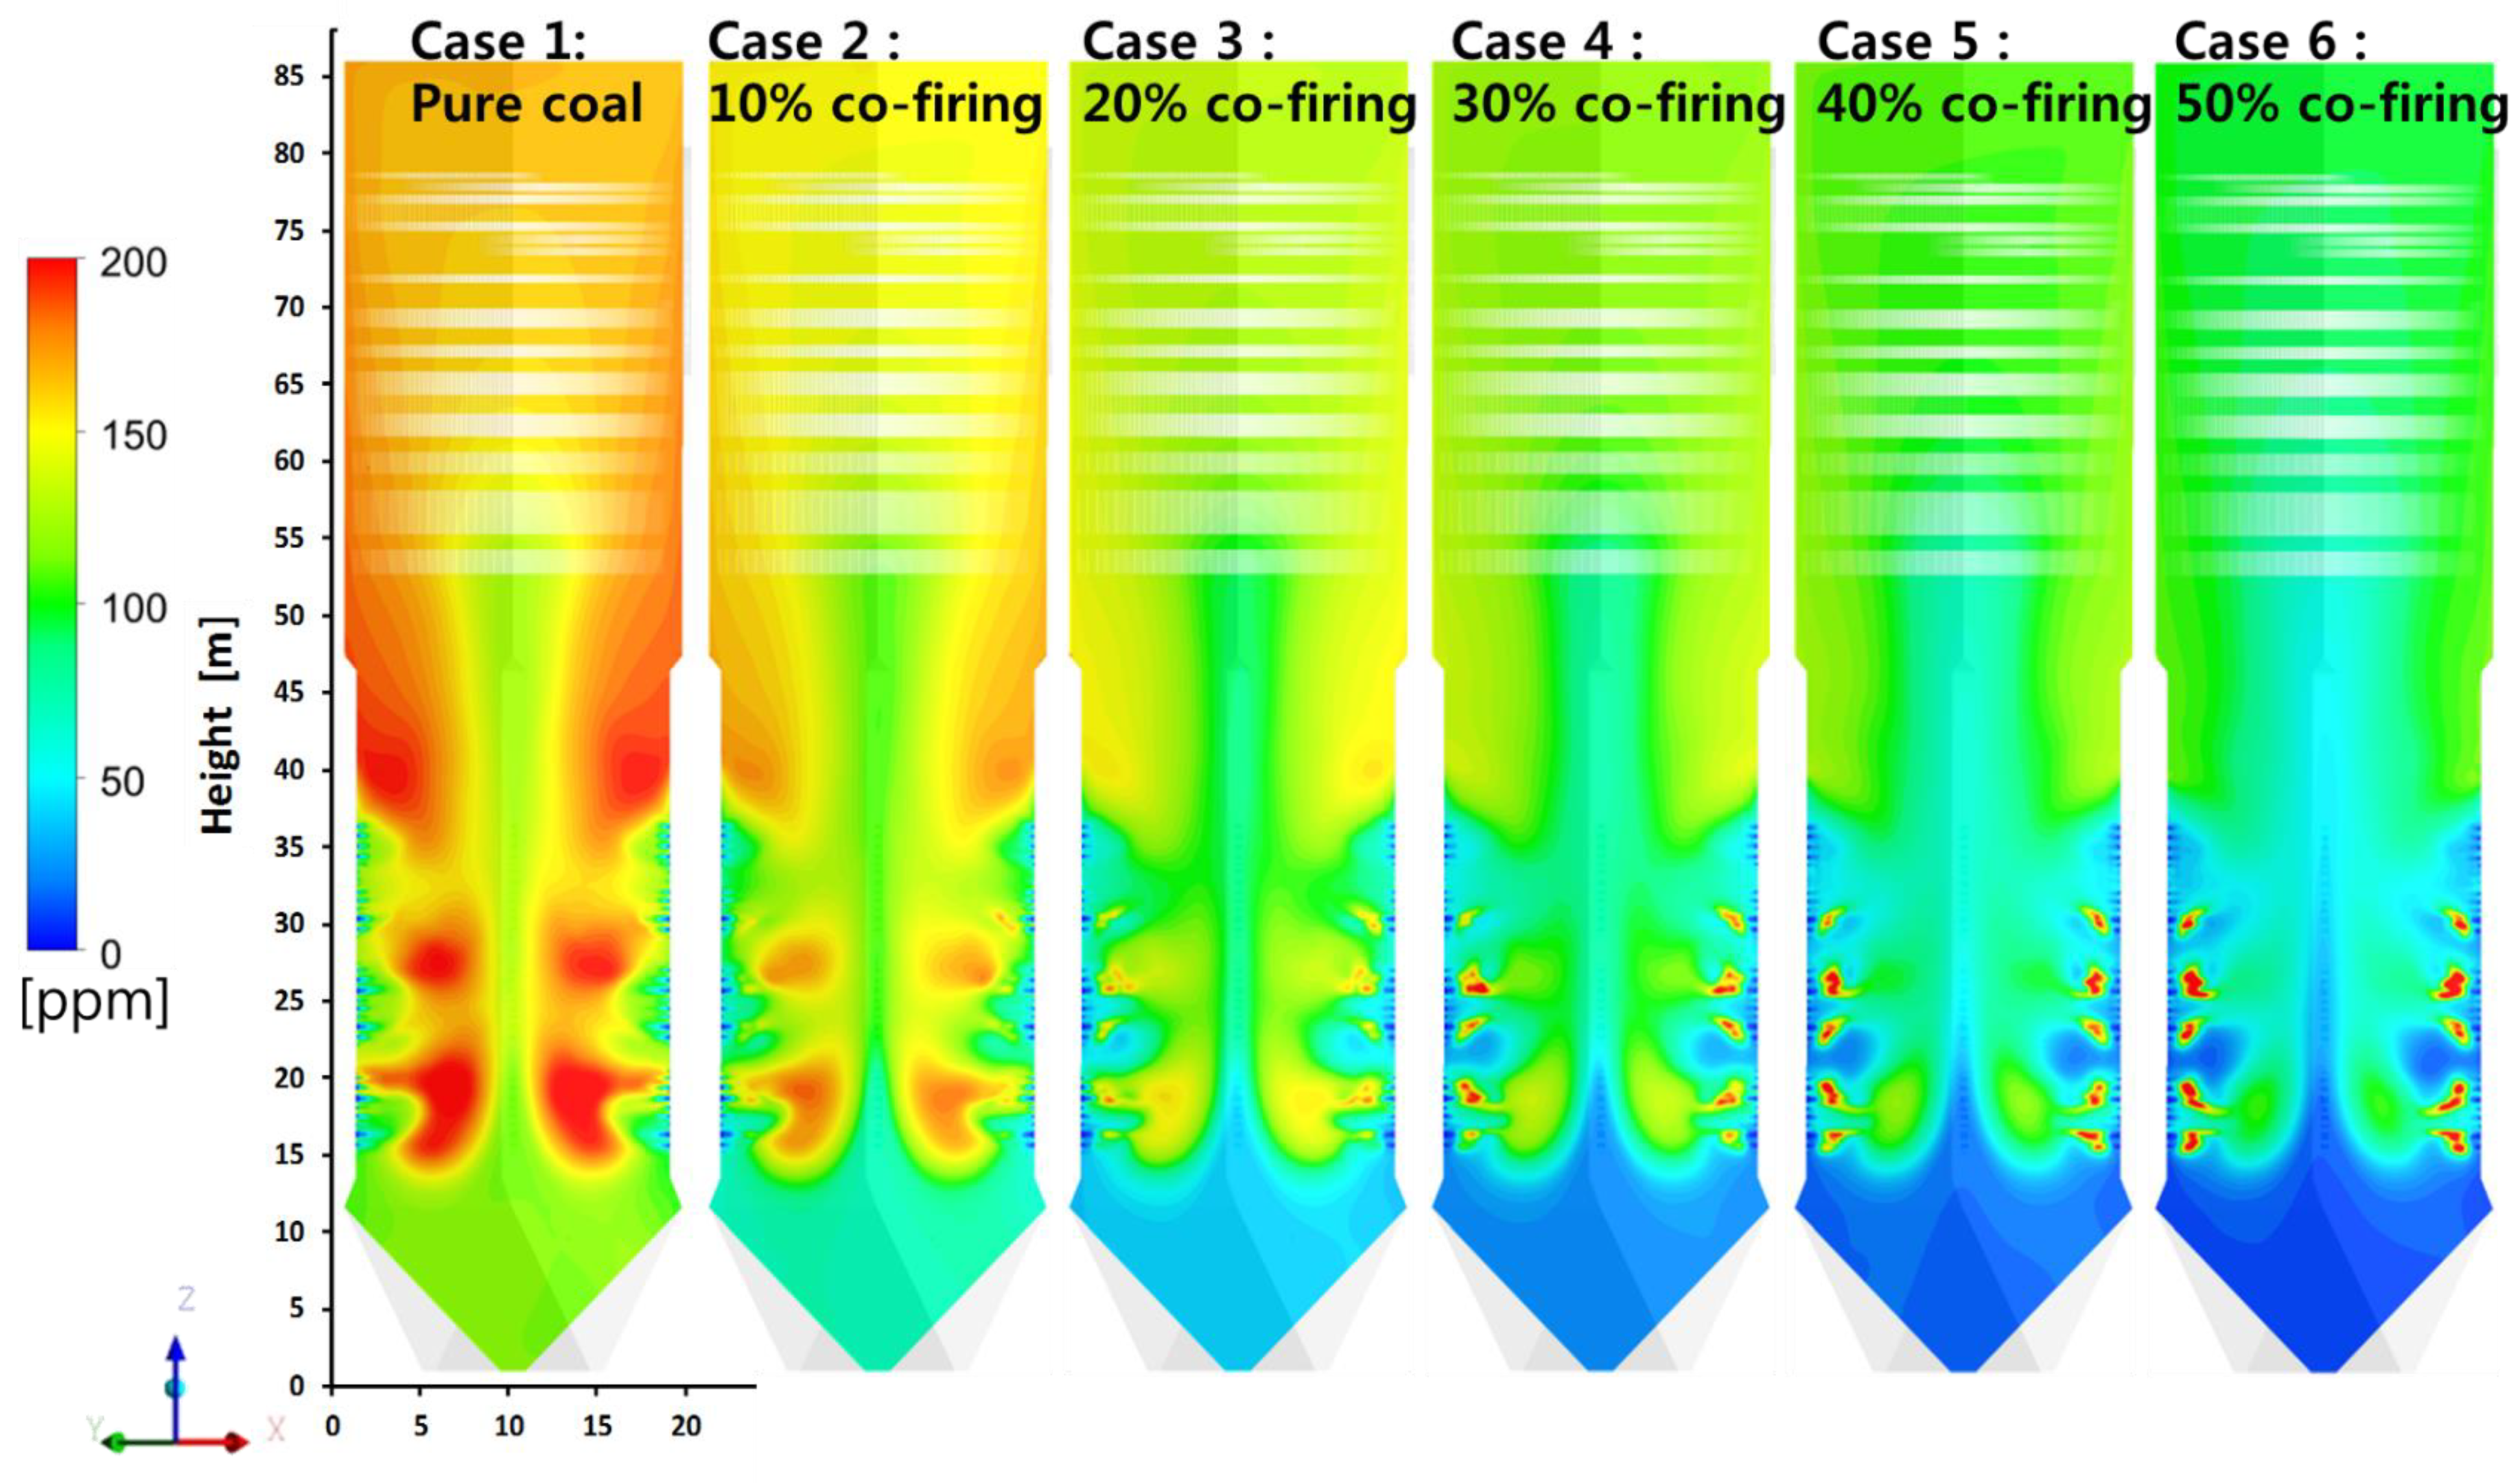
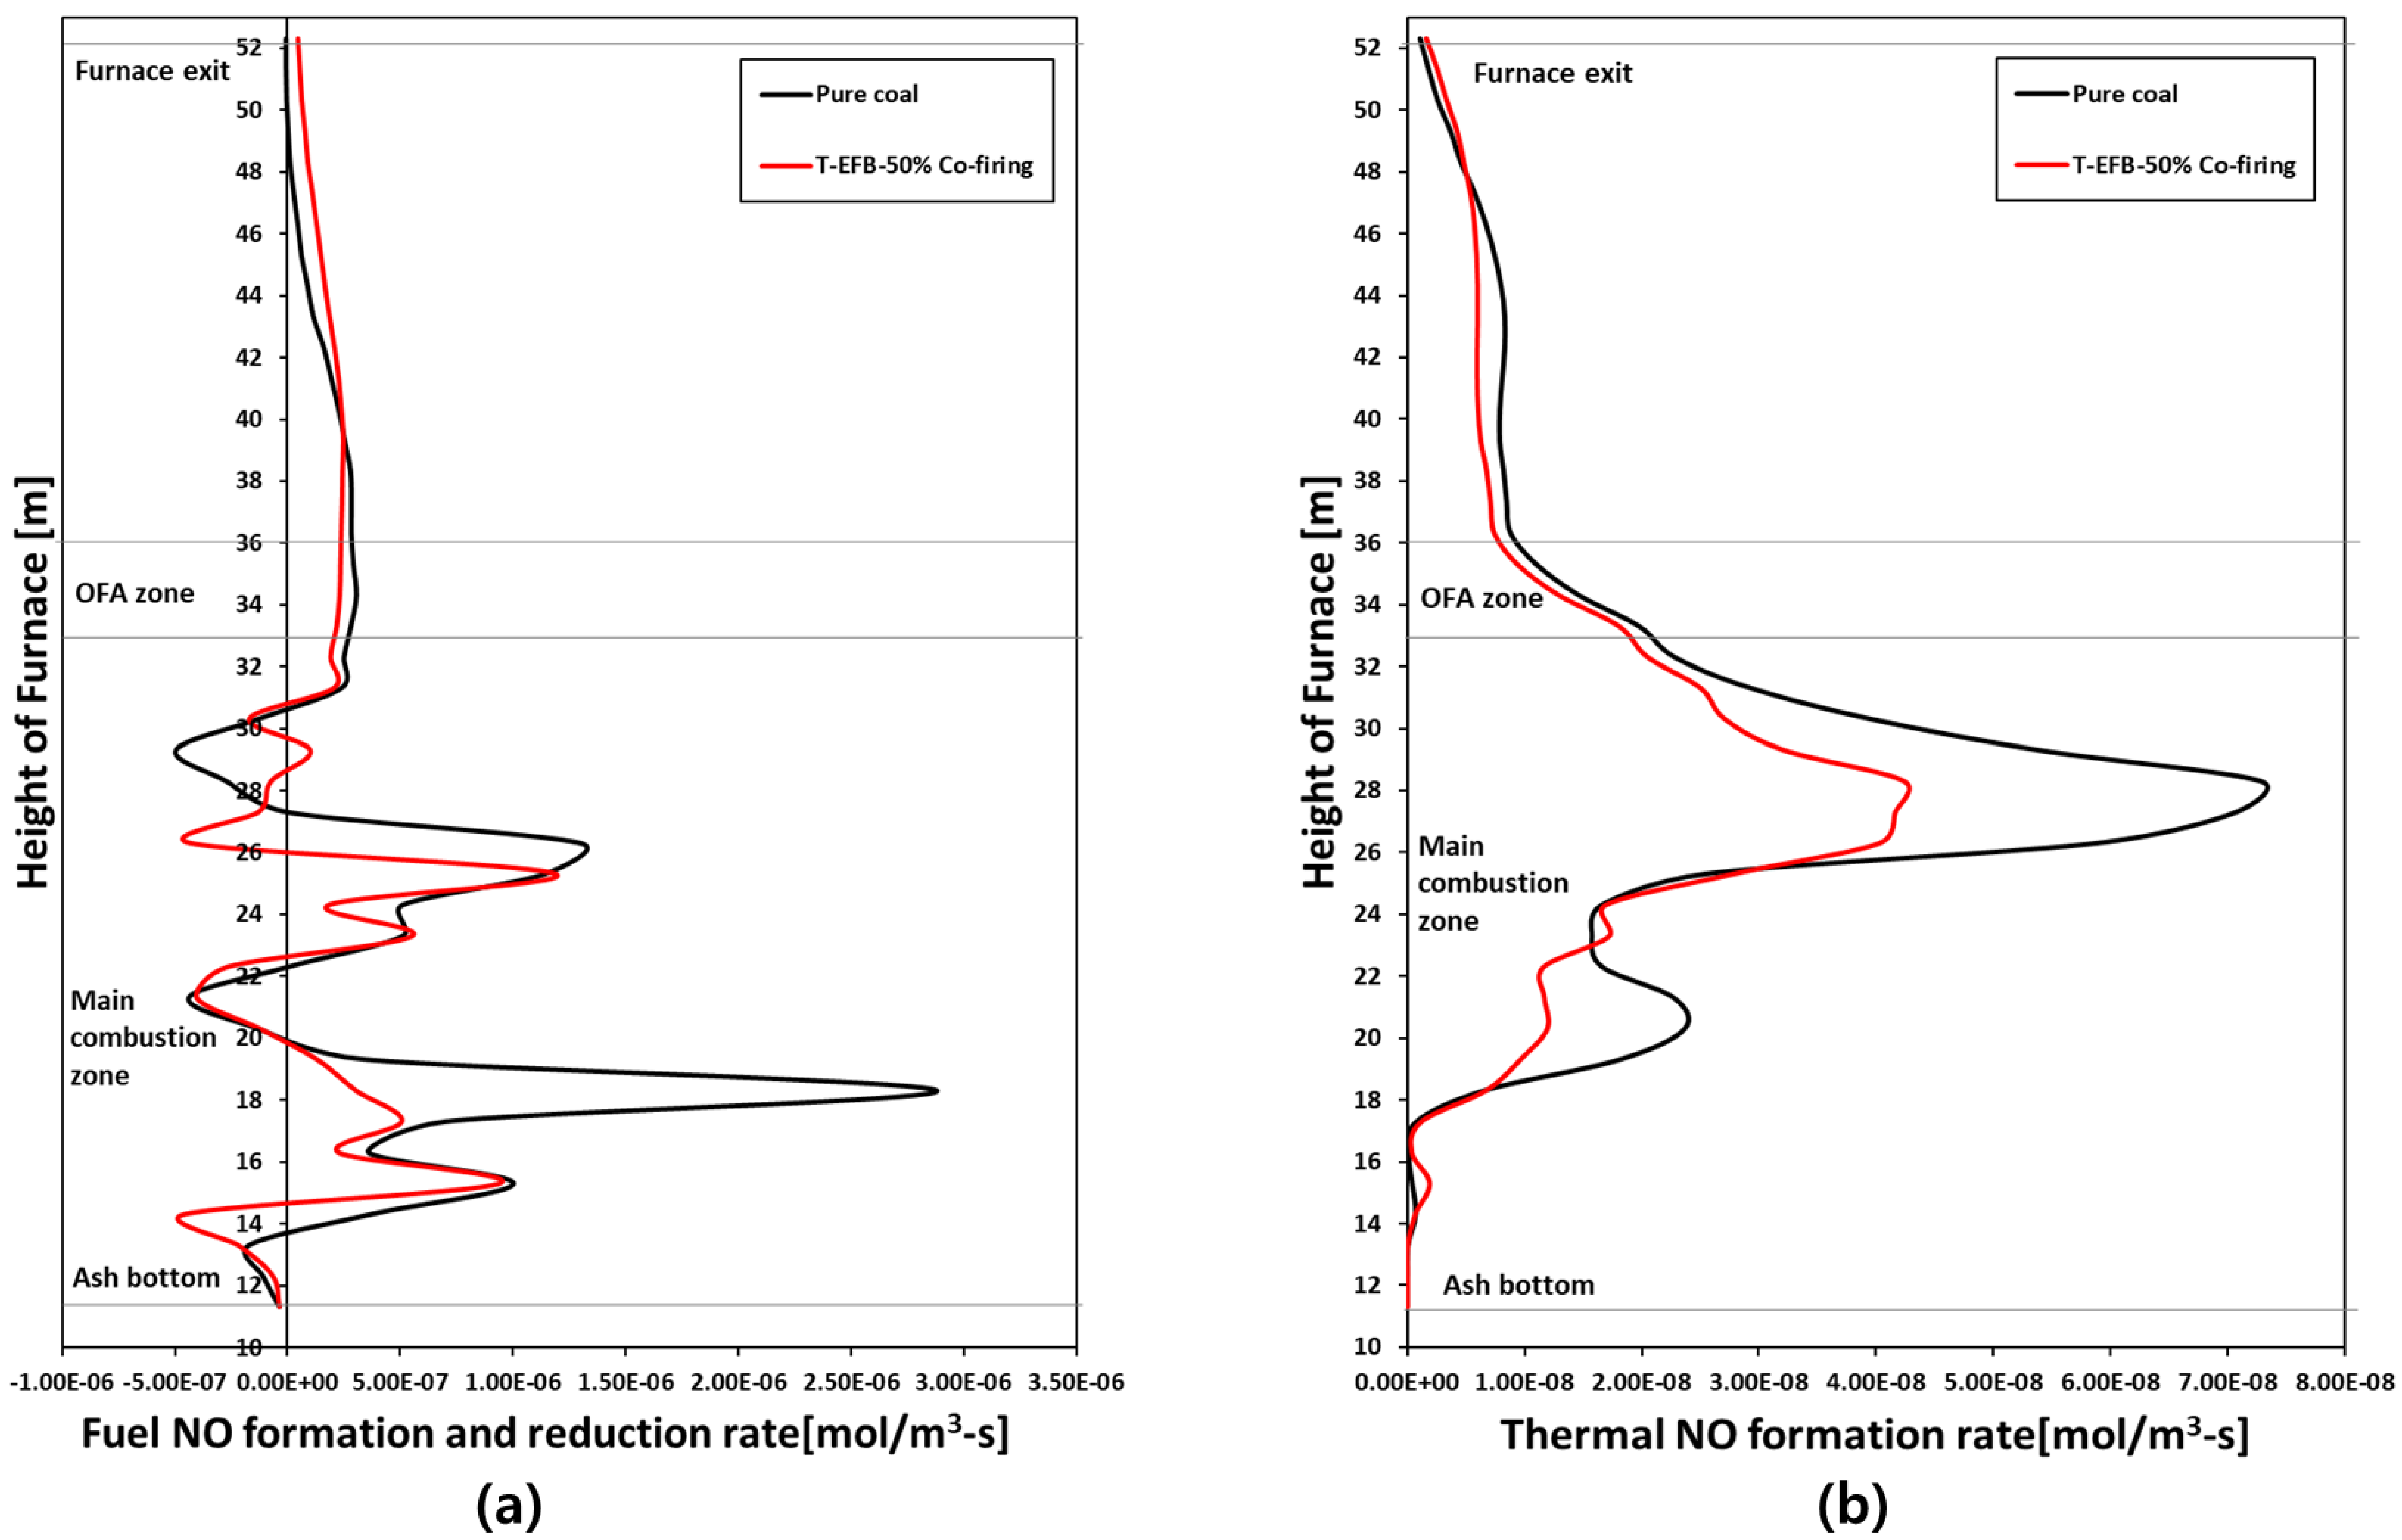
5.5. Effects of T-EFB Co-Firing Substitutions on Gas Emission (NOX, SO2)

According to the results of the boiler exit data in Table 4, the NOx reduction was observed with the increase of the co-firing ratio. When the co-firing ratio reaches 50%, the NOX reduction is 42% compared to pure coal case. The positive effect of T-EFB combustion on NOx emission reduction was demonstrated. The amount of NOx produced along the furnace height was shown in Figure 8c. As the combustion reaction proceeds, NOx gradually accumulates along the chamber height. After the OFA region, there was no significant change in NOx production. Comparison of the results obtained under different conditions shows that the total NOx decreases as the proportion of T-EFB addition increases. At the same time, as shown in Figure 12, by comparing the main distribution area of NOx formation, it can be seen that the area of high concentration of NOx from coal combustion was mainly located in the center of the furnace. With the increase of T-EFB co-firing ratio, the area near the burner gradually showed a high concentration of NOx distribution. This is caused by the rapid combustion reaction of T-EFB compared to coal to produce NOx. Therefore, T-EFB has a specific effect on total NOx formation, so fuel NO and thermal NO production should be explicitly analyzed.
Based on the analysis of the fuel composition data in Table 1, theoretically the fuel NO is reduced because the total supply fuel nitrogen content is inversely proportional to the T-EFB blending ratio. According to Figure 13a, the fuel NO formation and reduction rate along the height of the furnace can be seen, the fuel NO in the burner area is a higher formation phenomenon. Still, with the increase of the ratio of co-firing, the formation rate is reduced. At the same time, the rapid combustion reaction of T-EFB consumes oxygen. It creates a hypoxic-reducing atmosphere in the region near the upper and lower burners, which further reduces NOx production. Second, since thermal NO generation is proportional to temperature. According to the temperature distribution of high temperature (1476 °C and 1526 °C) zones in Figure 9, although the high temperature zone (1476 °C of co-firing cases is slightly more widely distributed, the high temperature zone (1526 °C is less than pure coal cases. As can be seen from the thermal NO generation rate diagram (Figure 13b), the NO generation rate peaked at 28 m high in the furnace under all conditions, but the thermal NO is relatively low under co-firing conditions.
Moreover, then, based on the predicted SO2 concentrations at the boiler exit listed in Table 4. The SO2 emissions at the boiler exit were expected to gradually decrease from 476 ppm for the pure coal case to 292 ppm for the 50% T-EFB co-firing case. A reduction of about 38%. The main reason was that the T-EFB contains only 0.15% of S content is lower than pulverized coal (0.4%), so co-firing can significantly reduce SO2 emissions.

6. Conclusions

This study analyzed the effects of torrefaction techniques on the properties of R-EFB and also evaluated the feasibility of co-firing T-EFB and coal in large-scale boiler through simulation. The effects of blending on combustion characteristics, heat flux of furnace wall and gas emissions were analyzed for different blending ratios and the and the following conclusions were obtained:
T-EFB after torrefaction technology had similar characteristics to sub-bituminous coal, low moisture, high volatility and faster reaction activation. The combustion characteristics of boilers under different blending ratio conditions were analyzed by simulation, and it was found that due to the rapid combustion of T-EFB high volatile fractional matter to generate heat, the high temperature zone inside the boiler diffused towards the burner near, but the furnace peak temperature decreased slightly. Second, T-EFB reacts faster, oxygen consumption was proportional to the co-firing ratio, which could form a low oxygen high temperature reducing atmosphere, while T-EFB co-firing promotes the fire of coal. The temperature distribution in the furnace depends mainly on the degree of fuel burnout. T-EFB co-firing could affect the heat transfer characteristics of the boiler. As the temperature of the OFA burnout area decreased, the heat flux of the water wall decreased, the furnace exit gas temperature increased, and the heat absorption of the heat exchange tubes increased. At a blending ratio above 40%, boiler combustion efficiency decreased as the total heat flux of the boiler decreased due to the rise in the amount of unburned carbon. Compared to pure coal, NOX and SO2 emissions were significantly reduced with increasing T-EFB substitution. However, the potential adverse effects of T-EFB co-firing in coal-fired boilers, such as slagging, corrosion and economics, require further study.

Author Contributions

Conceptualization, Y.J. and C.-H.J.; methodology, Y.J.; software, Y.J.; validation, Y.J., K.-H.P. and C.-H.J.; formal analysis, Y.J.; writing—original draft preparation, Y.J.; writing—review and editing, C.-H.J. All authors have read and agreed to the published version of the manuscript.

Funding

This work was conducted under framework of the research and development program of the Korea Institute of Energy Research and Korea Institute of Energy Technology Evaluation and Planning (KETEP) and the Ministry of Trade, Industry & Energy (MOTIE) of the Republic of Korea (No. 20151110100040).

Conflicts of Interest

The authors declare no conflicts of interest.

Abbreviations

CFDcomputational fluid dynamics
CO2carbon dioxide
COcarbon monoxide
DTGderivative thermogravimetric
DTFdrop tube furnace
ECOeconomizer
EFBempty fruit bunch
HHVhigher heating value
HT-EFBhydrothermal empty fruit bunch
HThydrothermal
KIERKorea institute of energy research
OFAoverfire air
NOXoxides of nitrogen
O2oxygen
PKSpalm kernel shells
PMpollution minimum
R-EFBraw empty fruit bunch
RHreheaters
SO2sulfur dioxide
SHsuperheaters
T-EFBtorrefied empty fruit bunch
TGAthermogravimetric analysis
UBCunburned carbon
TGweight loss curves
FEGTfurnace exit gas temperature
PAprimary air
SAsecondary air

References

  1. IPCC. Climate Change 2014: The Physical Science Basis. Contribution of Working Group I to the Fifth Assessment Report of the Intergovernmental Panel on Climate Change; Cambridge University Press: Cambridge, UK; New York, NY, USA, 2014. [Google Scholar]
  2. Li, J.; Brzdekiewicz, A.; Yang, W.H.; Tognotti, L.; Blasiak, W. Co-firing based on biomass torrefaction in a pulverized coal boiler with aim of 100% fuel switching. Appl. Energy 2012, 99, 344–354. [Google Scholar] [CrossRef]
  3. Tarigan, S.D.; Widyaliza, S. Expansion of oil palm plantations and forest cover changes in Bungo and Merangin districts, Jambi Province, Indonesia. Proc. Environ. Sci. 2015, 24, 199–205. [Google Scholar] [CrossRef] [Green Version]
  4. Aziz, M.; Prawisudha, P.; Prabowo, B.; Budiman, B.A. Integration of energy-efficient empty fruit bunch drying with gasification/combined cycle systems. Appl. Energy 2015, 139, 188–195. [Google Scholar] [CrossRef]
  5. Puspasari, I.; Meor Talib, M.Z.; Wan Daud, W.R.; Tasirin, S.M. Drying kinetics of oil palm frond particles in an agitated fluidized bed dryer. Dry Technol. 2012, 30, 619–630. [Google Scholar] [CrossRef]
  6. Tabet, F.; Gökalp, I. Review on CFD based models for co-firing coal and biomass. Renew. Sustain. Energy Rev. 2015, 51, 1101–1114. [Google Scholar] [CrossRef]
  7. Darmawan, A.; Budianto, D.; Aziz, M.; Tokimatsu, K. Retrofitting existing coal power plants through cofiring with hydrothermally treated empty fruit bunch and a novel integrated system. Appl. Energy 2017, 204, 1138–1147. [Google Scholar] [CrossRef]
  8. Paepatung, N.; Nopharatana, A.; Songkasiri, W. Bio-methane potential of biological solid materials and agricultural wastes. Asian J. Energy Environ. 2009, 10, 19–27. [Google Scholar]
  9. Shahidi, F. Bailey’s Industrial Oil and Fat Products, 6th ed.; John Wiley & Sons, Inc.: Hoboken, NJ, USA, 2005. [Google Scholar]
  10. Damartzis, T.; Michailos, S.; Zabaniotou, A. Energetic assessment of a combined heat and power integrated biomass gasification-internal combustion engine system by using Aspen Plus (R). Fuel Process. Technol. 2012, 95, 37–44. [Google Scholar] [CrossRef]
  11. Aziz, M.; Oda, T.; Kashiwagi, T. Innovative steam drying of empty fruit bunch with high energy efficiency. Dry Technol. 2015, 33, 395–405. [Google Scholar] [CrossRef]
  12. Zaini, I.N.; Novianti, S.; Nurdiawati, A.; Irhamna, A.R.; Aziz, M.; Yoshikawa, K. Investigation of the physical characteristics of washed hydrochar pellets made from empty fruit bunch. Fuel Process. Technol. 2017, 160, 109–120. [Google Scholar] [CrossRef]
  13. Tumuluru, J.S.; Sokhansanj, S.; Hess, J.R.; Wright, C.T.; Boardman, R.D. Review: A review on biomass torrefaction process and product properties for energy applications. Ind. Biotechnol. 2011, 7, 384–401. [Google Scholar] [CrossRef] [Green Version]
  14. Luk, H.T.; Lam, T.Y.G.; Oyedun, A.O.; Gebreegziabher, T.; Hui, C.W. Drying of biomass for power generation: A case study on power generation from empty fruit bunch. Energy 2013, 63, 205–215. [Google Scholar] [CrossRef]
  15. Ninduangdee, P.; Kuprianov, V.I. A study on combustion of oil palm empty fruit bunch in a fluidized bed using alternative bed materials: Performance, emissions, and time-domain changes in the bed condition. Appl. Energy 2016, 176, 34–48. [Google Scholar] [CrossRef]
  16. Aziz, M.; Kurniawan, T.; Oda, T.; Kashiwagi, T. Advanced power generation using biomass wastes from palm oil mills. Appl. Thermal Eng. 2017, 114, 1378–1386. [Google Scholar] [CrossRef]
  17. Bergman, P.C.A.; Boersma, A.R.; Zwart, R.W.H.; Kiel, J.H.A. Development of Torrefaction for Biomass Co-Firing in Existing Coal-Fired Power Stations. ECN Report ECN-C 2005-05-013. 2005. Available online: https://publicaties.ecn.nl/PdfFetch.aspx?nr=ECN-C--05-013 (accessed on 11 June 2020).
  18. Moscicki, K.J.; Niedzwiecki, L.; Owczarek, P.; Wnukowski, M. Commoditization of biomass: Dry torrefaction and pelletization-a review. J. Power Technol. 2014, 94, 233–249. [Google Scholar]
  19. Vander Stelt, M.J.C.; Gerhauser, H.; Kiel, J.H.A.; Ptasinski, K.J. Biomass upgrading by torrefaction for the production of biofuels: A review. Biomass Bioenergy 2011, 35, 3748–3762. [Google Scholar] [CrossRef]
  20. Acharya, B.; Dutta, A.; Minaret, J. Review on comparative study of dry and wet torrefaction. Sustain. Energy Technol. Assess 2015, 12, 26–37. [Google Scholar] [CrossRef]
  21. Uslu, A.; Faaij, A.P.; Bergman, P.C. Pre-treatment technologies, and their effect on international bioenergy supply chain logistics. Techno-economic evaluation of torrefaction, fast pyrolysis and pelletisation. Energy 2008, 33, 1206–1223. [Google Scholar] [CrossRef]
  22. Zhang, Y.; Song, K.Y. Thermal and chemical characteristics of torrefied biomass derived from a generated volatile atmosphere. Energy 2018, 165, 235–245. [Google Scholar] [CrossRef]
  23. Arias, B.; Pevida, C.; Fermoso, J.; Plaza, M.G.; Rubiera, F.; Pis, J.J. Influence of torrefaction on the grindability and reactivity of woody biomass. Fuel Process. Technol. 2008, 89, 169–175. [Google Scholar] [CrossRef] [Green Version]
  24. Szufa, S.; Dzikuć, M.; Adrian, Ł.; Piersa, P.; Romanowska-Duda, Z.; Lewandowska, W.; Marcza, M.; Błaszczuk, A.; Piwowar, A. Torrefaction of oat straw to use as solid biofuel, an additive to organic fertilizers for agriculture purposes and activated carbon—TGA analysis, kinetics. E3S Web Conf. 2020, 154, 02004. [Google Scholar] [CrossRef] [Green Version]
  25. Miedema, J.H.; Benders, R.M.J.; Moll, H.C.; Pierie, F. Renew, reduce or become more efficient? The climate contribution of biomass co-combustion in a coal-fired power plant. Appl. Energy 2017, 187, 873–885. [Google Scholar] [CrossRef] [Green Version]
  26. Falah, A.; Jan, P.B.; Alexander, S.; Jochen, S.; Bernd, E. Experimental measurements for torrefied biomass Co-combustion in a 1 M Wth pulverized coal-fired furnace. J. Energy Inst. 2020, 93, 833–846. [Google Scholar]
  27. Alexander, S.; Falah, A.; Jan-Peter, B.; Jochen, S.; Bernd, E. 3-D numerical simulation for co-firing of torrefied biomass in a pulverized-fired 1 MWth combustion chamber. Energy 2015, 85, 105–116. [Google Scholar]
  28. Emad, R.; Ren, X.H.; Panahi, A.; Yiannis, A.L. Emissions of SO2, NOx, C O2, and HCl from Co-firing of coals with raw and torrefied biomass fuels. Fuel 2018, 211, 363–374. [Google Scholar]
  29. Krevelen, V.W.D. Graphical-statistical method for the study of structure and reaction processes of coal. Fuel 1950, 29, 269–284. [Google Scholar]
  30. Ansys Fluent 17.1-Theory Guide; Fluent Inc.: New York, NY, USA, 2016.
  31. Ma, L.; Fang, Q.; Yin, C.; Wang, H.; Zhang, C.; Chen, G. A novel corner-fired boiler system of improved efficiency and coal flexibility and reduced NOx emissions. Appl. Energy 2019, 238, 453–465. [Google Scholar] [CrossRef]
  32. Zhao, S.N.; Fang, Q.Y.; Yin, C.G.; Wei, T.S.; Wang, H.J.; Zhang, C.; Chen, G. New Fuel Air Control Strategy for Reducing NOx Emissions from Corner-Fired Utility Boilers at Medium−Low Loads. Energy Fuels 2017, 31, 6689–6699. [Google Scholar] [CrossRef]
  33. Haider, A.; Levenspiel, O. Drag coefficient and terminal velocity of spherical and nonspherical particles. Powder Technol. 1989, 58, 63–70. [Google Scholar] [CrossRef]
  34. Hwang, M.Y.; Kim, S.M.; Kim, G.B.; Lee, B.H.; Song, J.H.; Park, M.S.; Jeon, C.H. Simulation studies on direct ash recycling and reburning technology in a tangentially fired 500 MW pulverized coal boiler. Fuel 2013, 114, 78–87. [Google Scholar] [CrossRef]
  35. Badzioch, S.; Hawksley, P.G.W. Kinetics of Thermal Decomposition of Pulverized Coal Particles. Ind. Eng. Chem. Process Des. Dev. 1970, 9, 521–530. [Google Scholar] [CrossRef]
  36. Sheng, C.D.; Moghtaderi, B.; Gupta, R.; Wall, T.F. A computational fluid dynamics based study of the combustion characteristics of coal blends in pulverised coal-fired furnace. Fuel 2001, 83, 1543–1552. [Google Scholar] [CrossRef]
  37. Wang, J.; Lou, H.H.; Yang, F.; Cheng, F. Numerical simulation of a decoupling and Re-burning combinative Low-NOx coal grate boiler. J. Clean. Prod. 2018, 188, 977–988. [Google Scholar] [CrossRef]
  38. Vodicka, M.; Haugen, N.E.; Gruber, A.; Hrdlicka, J. NOX formation in oxy-fuel combustion of lignite in a bubbling fluidized bed - modelling and experimental verification. Int. J. Greenh. Gas Control 2018, 76, 208–214. [Google Scholar] [CrossRef]
  39. Hanson, R.K.; Salimian, S. Survey of Rate Constants in the N/H/O System. In Combustion Chemistry; Springer: New York, NY, USA, 1984; pp. 361–421. [Google Scholar]
  40. De Soete, G.G. Overall reaction rates of NO and N2 formation from fuel nitrogen. Symp. Int. Combust. 1975, 15, 1093–1102. [Google Scholar] [CrossRef]
  41. Winter, F.; Wartha, C.; Loffler, G.; Hofbauer, H. The NO and formation Mechanism During Devolatilization and Char Combustion Under Fluidized Bed Conditions. In Proceedings of the 26th Symposium (Int’l) on Combustion, The Combustion Institute, Pittsburgh, PA, USA, 28 July–2 August 1996; pp. 3325–3334. [Google Scholar]
  42. Li, J.; Biagini, E.; Yang, W.H.; Tognotti, L.; Blasiak, W. Flame characteristics of pulverized torrefied-biomass combusted with high-temperature air. Combust. Flame 2014, 160, 2585–2594. [Google Scholar] [CrossRef] [Green Version]
  43. Choi, C.R.; Kim, C.N. Numerical investigation on the flow, combustion and NOx emission characteristics in a 500 MWe tangentially fired pulverized-coal boiler. Fuel 2009, 88, 1720–1731. [Google Scholar] [CrossRef]
  44. Novianti, S.; Zaini, I.N.; Nurdiawati, A.; Yoshikawa, K. Low potassium Content Pellet Production by Hydrothermal-W\shing Co-treatment. Int. J. Chem. Chem. Eng. Syst. 2016, 1, 28–38. [Google Scholar]
  45. Balasundram, V.; Alias, N.; Ibrahim, N.; Kasmani, R.M.; Isha, R.; Hamid, M.K.A.; Hasbullah, H. Thermal Characterization of Malaysian Biomass via Thermogravimetric Analysis. J. Energy Saf. Technol. 2018, 1, 31–38. [Google Scholar] [CrossRef]
  46. Becher, V.; Jan-Peter, B.; Goanta, A.; Hartmut, S. A combustion concept for oxyfuel processes with low recirculation rate experimental validation. Combust. Flame 2011, 158, 1542–1552. [Google Scholar] [CrossRef]
Figure 1. Conceptual graph of torrefied empty fruit bunch (T-EFB) co-firing system.
Energies 13 03051 g001
Figure 2. Van Krevelen diagram for various solid fuels in this study.
Energies 13 03051 g002
Figure 3. Overview of 500-MWe tangential firing boiler. (a) Boiler model shape; (b) arrangement of burner with mill; (c) burner injection method at four corners.
Energies 13 03051 g003
Figure 4. Reaction mechanism of fuel–NO formation pathways.
Energies 13 03051 g004
Figure 5. Comparison of thermogravimetric analysis (TGA), Derivative Thermogravimetric (DTG) and temperature profiles at a heating rate of 20 °C/min.
Energies 13 03051 g005
Figure 6. Mesh independence study for cases: gas temperature and velocity component (Vy) from front wall to rear wall along centerline of main combustion zone (x = 0–16.5 m, y = 8.25 m, z =15.7 m).
Energies 13 03051 g006
Figure 7. Simulated temperature distribution under different blending ratios of T-EFB along height of furnace.
Energies 13 03051 g007
Figure 8. Simulated gas distribution under different blending ratios of T-EFB along height of furnace (a) gas temperatures, (b) O2 mole fraction and (c) NOx emission.
Energies 13 03051 g008
Figure 9. Iso-surface temperature of 1476 °C and 1526 °C for cases 1 (pure coal) and 6 (T-EFB 50% co-firing).
Energies 13 03051 g009
Figure 10. Heat flux distributions at water wall.
Energies 13 03051 g010
Figure 11. Heat absorption among different heat transfer tube groups.
Energies 13 03051 g011
Figure 12. Simulated NOx distribution under different blending ratios of T-EFB along height.
Energies 13 03051 g012
Figure 13. Two NO types formation rate along rate along furnace height. (a) Fuel NO formation and reduction rate; (b) thermal NO formation rate.
Energies 13 03051 g013
Table 1. Fuel properties.
Fuel SamplesCoalR-EFBT-EFB
Proximate analysis (as-received basis, wt%)
Moisture14.2060.002.99
Volatile matter39.7034.8465.19
Fixed Carbon40.903.7119.00
Ash5.201.4612.82
Ultimate analysis (dry ash-free basis, wt%)
Carbon (C)81.8046.6259.45
Hydrogen (H)5.406.455.36
Nitrogen (N)2.201.211.06
Sulfur (S)0.400.0350.15
Oxygen (O)10.2045.6624.16
Calorific value (as-received basis, MJ/Kg)
HHV30.1817.0220.9
Table 2. Kinetics parameters of coal and T-EFB.
ParameterCoal aT-EFB b
Devolatilization kinetics
A (s−1)3.12 × 1051.1 × 104
E (kJ/mol)7.4 × 1048.87 × 104
Char oxidation kinetics
A (s−1)0.00436.4
E (kJ/mol)83.7110
a Kinetics of coal are from [36]. b Kinetics of T-EFB were measured in this study.
Table 3. Boiler parameters for case studies.
ItemOperation BoilerSimulation Cases
CaseCase 1Case 2Case 3Case 4Case 5Case 6
Combustion typePure coalCo-firing
T-EFB bleeding ratio (%, thermal basis)01020304050
Fuel mills in service (burn zone)A B C D E
Coal feed rates (kg/s)51.346.241.135.930.825.7
Biomass feed rates (kg/s)-6.212.518.724.931.1
PA a flow rate (kg/s)109.8110.7111.6112.4113.2113.8
SA a flow rate (kg/s)276.9279.3281.4283.5285.4287.1
OFA a flow rate (kg/s)90.791.592.292.993.594.0
Temperature of PA (°C)58.5
Temperature of SA (°C)303.5
Temperature of OFA (°C)303.5
Burner zone stoichiometry ratio0.91
a primary air (PA), secondary air (SA) and overfire air (OFA) were composed of 79 wt% N2 and 21% O2 for all cases.
Table 4. Overview of full-scale test different case results.
Case TypeCase 1Case 2Case 3Case 4Case 5Case 6
Pure CoalT-EFB 10% Co-FiringT-EFB 20% Co-FiringT-EFB 30% Co-FiringT-EFB 40% Co-FiringT-EFB 50% Co-Firing
MethodExperimentalSimulationSimulationSimulationSimulationSimulationSimulation
Furnace peak temperature (°C)-1484.51480.21476.51470.31465.11459.4
Furnace exit gas temperature (°C)12571258.8126612681268.81269.41270.2
Gas temperature at boiler exit (°C)333.5353.5360.4361.2362.1362.9363.6
O2 content at boiler exit (vol%)2.22.22.32.362.412.462.54
CO content at boiler exit (vol%)-8.8 × 10−114.9 × 10−116.64 × 10−98.02 × 10−99.9 × 10−91.29 × 10−8
CO2 content at boiler exit (vol%)-14.6014.8414.6514.6514.6514.62
SO2 content at boiler exit (ppm, at 6% O2)474.2476.1441.4402.4363.1331.7292.5
Discrepancies a (%)-0.47.315.523.730.338.6
NOX emission at boiler exit (ppm, at 6% O2)159.2170152.2133.9122110.197.8
Discrepancies a (%)-6.810.521.228.235.242.5
Average residence time of fuel particles (s)-20.2420.1920.1319.8519.619.5
Unburned carbon content (wt%)3.483.213.123.022.913.54.2
Economizer heat absorption (MW)64.361.757.558.258.859.459.9
Reheater heat absorption (MW)224205.5207.1209.5211.6213213.9
Superheater heat absorption (MW)317312314.9317.5319.1319.4319.5
Water wall heat absorption (MW)482.1488472.2465.2457.8451.8440.1
Total heat absorption (MW)10871067.21051.71050.41047.31043.61033.4
a Discrepancies = (simulation data—experimental data) × 100/experimental data.

