Abstract
With the continuous proliferation of renewable energy generation, distributed photovoltaic inverters operating at a maximum power point reduce the inertia of power systems, degrading system frequency stability and potentially causing severe oscillations in systems after being disturbed. The virtual synchronous generator (VSG) control method, which causes photovoltaic inverters to possess inertia and damping, now plays an important role in the field of distributed generation. However, while introducing the advantages of synchronous machines, problems with oscillations are also introduced and the stochastic fluctuation characteristic of photovoltaics results in the stochastic drifting of the operating point. This paper presents an adaptive controller parameter design method for a photovoltaic-VSG (PV-VSG) integrated power system. Firstly, a small-signal model of the PV-VSG is built and a state space model is deduced. Then, the small-signal stability and low frequency oscillation characteristics of the photovoltaic power generation system are analyzed. Finally, considering the limitations of system oscillations and the stochastic drifting of the operating point, a global optimization design method for controller parameters used to improve system stability is proposed. The time domain simulation shows that an optimized PV-VSG could provide sufficient damping in the case of photovoltaic power output changes across a wider range.
1. Introduction
Resource shortages around the world are becoming more and more serious, and the development of renewable power generation technologies is extremely urgent. As a clean and renewable energy source, solar power plays a more and more important role in China’s energy strategy and its installed capacity is increasing day by day [1,2]. However, since photovoltaic inverters based on power electronic inverter interfaces have almost no rotational kinetic energy, the inertia of these systems will also decrease when they are connected to the power grid on a large scale. When the system power fluctuates, the frequency may oscillate or even cause the frequency stability to collapse, which seriously threatens the stable operation of the system. The impact of large-scale solar power access on grid stability will be further exposed and deteriorated, and system stability faces unprecedented challenges [3,4,5].
As an important factor affecting the dynamic characteristics of the frequency, system inertia has become a key point of research regarding the stable operation of a high-permeability photovoltaic microgrid. The low inertia caused by photovoltaic inverters is gaining more and more attention [6,7,8]. In order to improve the frequency dynamic stability of photovoltaic systems, it is particularly important to improve the control performance of the inverter. When a power system is in the electromechanical transient transition process, the mechanical inertia of the synchronous generator rotor provides transient energy, suppresses the change in the grid frequency, and strives for a response time for regulation, which plays a vital role in grid stability. Following the principle of its function, the idea of virtual synchronous generator control for renewable energy has been proposed by scholars and has received extensive attention in academic circles and industry in recent years [9,10,11,12]. The virtual synchronous generator (VSG) introduces a rotor equation to make the inverter similar to a traditional synchronous generator in both the operating mechanism and the external characteristics, which can provide significant inertial support for the system [13,14].
The characteristics of the VSG meet the needs of future grids for distributed photovoltaic (PV) power access. Thus, virtual synchronous machine technology provides a new idea and technical route for solving many problems brought about by large-scale photovoltaic power supply access to power systems. In the existing literature, virtual synchronous machine topology and control structures are mainly used for cases in which the DC side is an energy storage battery, that is, the virtual prime mover simulated on the DC side is a kind of “power source with constant voltage and unlimited capacity”. The DC source of a traditional VSG is mainly used for energy storage batteries, which ignores the influence of DC side dynamic characteristics to some extent [9,12]. In general, distributed photovoltaic power output is susceptible to external environmental factors and has strong randomness, volatility, and finiteness [15,16,17]. Hence, the traditional VSG has a limited application range and is difficult to apply to distributed PV access.
For this reason, the PV-VSG has been proposed by scholars as a way to apply virtual synchronous machine control to photovoltaic inverters to cause them to have better inertia and damping [18,19,20,21]. However, most of existing studies mainly simulate different PV-VSG control strategies and do not analyze the PV-VSG grid-connected system from the perspective of system stability. The parameter design is mainly designed for the operating point at a single output level. In [22], which combs VSG technology and considers the dynamic characteristics of a primary source, a PV-VSG and its control strategies are proposed. However, this work only simulates the effect of a PV-VSG and does not analyze the stability of the system and the selection of controller parameters. Virtual synchronous machine control allows the photovoltaic power station to participate in power grid frequency modulation and improve the system frequency stability. At the same time, it opens the channel that interacts with the active power of the system under disturbance, and has a non-negligible influence on the oscillation of the power system [23,24].
In this paper, an accurate small-signal model of a PV-VSG is established and the influence of controller parameters on the small-signal stability of the system is analyzed, and based on this, a globally optimized parameter design method is proposed. Firstly, with full consideration of a detailed model of each important link in the photovoltaic power generation system, a small-signal model of a PV-VSG that is suitable for transient stability analysis is established. Then, the small-signal stability and low frequency oscillation characteristics of the photovoltaic power generation system are analyzed. Finally, considering the limitations of system oscillations and the stochastic drifting of the operating point, a global optimization design method for controller parameters used to improve system stability is proposed. A time domain simulation shows that the optimized PV-VSG could provide sufficient damping in the case of photovoltaic power output changes across a wider range.
2. Small-Signal Model of a PV-VSG Integrated Power System
The photovoltaic power generation system consists of photovoltaic cell components, energy storage capacitors, inverters, and controllers. The photovoltaic power generation system structure is shown in Figure 1.
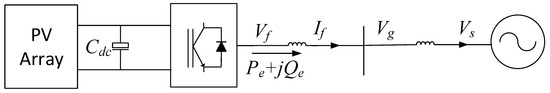
Figure 1.
Structure of photovoltaic (PV) power generation system. Legend: , DC filter capacitor; , AC side output voltage; , voltage of the parallel point with power systems, , voltage of the power systems; and , the active power and reactive power of PV-VSG.
2.1. PV Cell Model
The exact model of the photovoltaic cell module can be established according to the theory of electronics, but the exact model is very complicated, and some parameters are difficult to measure directly, which is not convenient for research and applications. The traditional practical engineering model is utilized as the PV cell model. The model uses four factory electrical parameters of the photovoltaic cell, namely, short-circuit current , open circuit voltage , and current and voltage , when the photovoltaic cell obtains maximum power under standard conditions and test parameters (, ). The U-I equation, Equation (1), under non-standard conditions is
The short-circuit current , open-circuit voltage , and current at maximum power and voltage under non-standard conditions can be obtained by Equations (4)–(9), i.e.,
where e is the natural logarithmic base, approximately 2.71828. The compensation coefficients , , and are 0.0025 °C, 0.5 , and 0.00288 °C, respectively.
2.2. DC Link Model
The mathematical model of the intermediate capacitor is as shown in Equation (10),
where is the capacitance value of the intermediate capacitor, is the DC voltage of the capacitor, is the current from the PV cells to the intermediate capacitor, and is the active power from the intermediate capacitor to the grid-side converter.
2.3. Inverter and Controller Model
In the photovoltaic power generation system, the topology of the voltage-type three-phase PWM (Pulse Width Modulation) inverter controlled by sinusoidal pulse width modulation (SPWM) is shown in Figure 2. Considering that the research object of this paper is mainly the electromechanical frequency band, the high frequency dynamic process in the system was ignored to simplify the research.
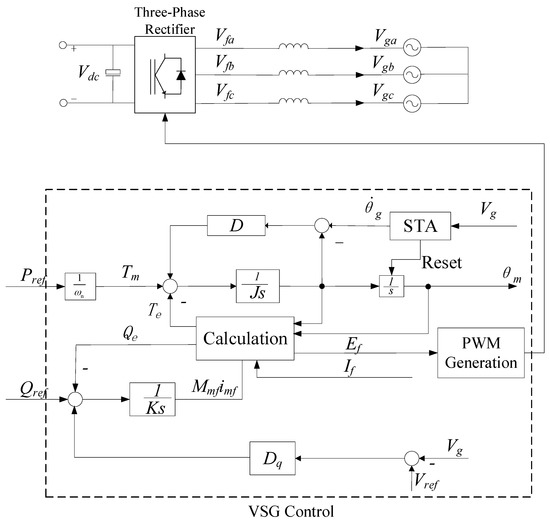
Figure 2.
Inverter with virtual synchronous generator (VSG) control structure diagram. Legend: , the frequency of the equivalent internal potential of VSG; , the base frequency of the grid; and , the set values of active and reactive which are used to control the output power of the inverter; J, the inertia of the virtual synchronous machine; D, the damping coefficient; K, the gain factor of the reactive controller.
The dynamic equation of the VSG control method is
where and are the output active and reactive powers of the inverter, and the calculations are
In a traditional virtual synchronous generator control, the virtual synchronous machine topology and the control structure are mainly used for the cases in which the DC side is an energy storage battery, that is, the virtual prime mover simulated on the DC side is a kind of “power source with constant voltage and unlimited capacity”. However, the dynamic characteristics of photovoltaic power supply are more complicated. The available output range of photovoltaic power supply is , and there are stable operation areas and unstable operation areas. The stable operation area of the photovoltaic power supply can also be determined by the DC voltage, that is, the DC voltage () corresponding to the MPP (Maximum Power Point) point is the minimum DC voltage that can be achieved by the photovoltaic power supply. If the DC voltage continues to decrease, it will travel to the unstable region. Thus, in order to fully consider the dynamic characteristics of the photovoltaic power supply, and regardless of the external power demand, it should be guaranteed to operate in a stable area.
As is shown in Figure 3, is the maximum power point and is the corresponding output power which could be obtained by the maximum power tracing algorithm. Considering the stable area of the PV-VSG, the upper limit of is set as 0, and thus the will lower than , and the PV-VSG operate within a stable area. The control equation of the and can be obtained as
The dynamic equation is
where is the integral coefficient of the PI controller and is the maximum power point of the photovoltaic component.
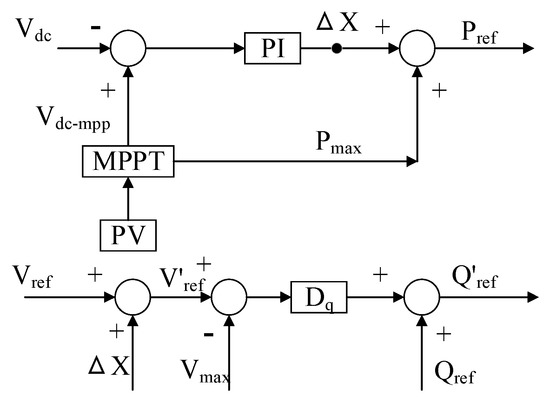
Figure 3.
Output control considering photovoltaic output characteristics. Legend: the maximum power point , the corresponding output power of the maximum power point.
2.4. The Linearization Model
The PV-VSG dynamic model as given in Equations (1)–(14) is linearized to obtain a small-signal model of a photovoltaic battery with VSG control.
In Equation (15), is the PV-VSG state variable, is the PV-VSG bus voltage, and is the PV-VSG bus injection current. The matrices in the formula are
where the elements in the matrix are
By combining Equations (15)–(23), a small-signal state space model of the system shown in Figure 1 can be obtained, i.e.,
where is the state vector; is the input vector; and , , , and are the state matrix, input matrix, output matrix, and direct transfer matrix, respectively. Equation (24) is a linearized model of a PV-VSG grid-connected system.
3. Global Optimization Design Method for Controller Parameters of PV-VSG
3.1. Analysis of Eigenvalues of PV-VSG Systems
The system shown in Table 1 is taken as an example for small-signal analysis of the PV-VSG. The initial conditions of the PV battery are S = 1000, , and T = 25 °C.

Table 1.
Main parameters.
According to the linearization model of the PV-VSG, small-signal stability analysis was performed on the test system and the eigenvalues of the state matrix are shown in the Table 2. As can be seen from the table, the damping of modes 2–3 is small and subsynchronous oscillation is prone to occur. Modes 4–5 are low-frequency oscillation modes.
Table 2.
Eigenvalues of the studied PV system.
In order to analyze the stability range of the system and the variation of the eigenvalues, the eigenvalue trajectories of the PV-VSG generation system have been calculated, as shown in Figure 4.
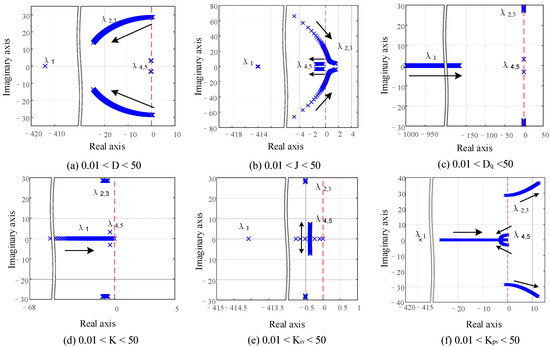
Figure 4.
The eigenvalue locus plot under different combinations of controller parameters.
(1) Active power loop parameters. The active power loop parameters include D and J, which simulate the characteristics of the generator and provide inertia and damping for the system. It can be seen from Figure 4a that the change in D mainly affects and has little effect on the other modes. As D increases, moves toward the stable area and the imaginary part decreases significantly. The change in modes and is not obvious, so the increase in D is beneficial to the attenuation of the mode. It can be seen from Figure 4b that the change in J mainly affects ,, and has little effect on the other modes. As J increases, moves toward the unstable area and the imaginary part increases significantly. The change in mode is not obvious. However, the increase also leads to the movement of mode towards the stable area, but this is less obvious. Thus, the increase in J should be limited to a certain range.
(2) Voltage regulation parameters. The voltage regulation parameters include and K, which simulate the characteristics of the excitation regulation and adjust the voltage at the point of interconnection. It can be seen from Figure 4c that the change in mainly affects . As D increases, moves toward the stable area. The imaginary part of mode decreases slightly and the change in is not obvious. It can be seen from Figure 4d that the change in K mainly affects and . As K increases, mode moves toward the unstable area and mode moves towards the stable area. The change in mode is not obvious.
(3) PV power regulation parameter. The voltage regulation parameters include and , which generate the based on the output characteristics of the photovoltaic battery and keep the photovoltaic generation system working around the maximum power point. It can be seen from Figure 4e that the change in mainly affects . As increases, mode gradually moves from the unstable region toward the stable region, and then the imaginary part begins to increase. It can be seen from Figure 4f that the change in mainly affects and . As increases, the imaginary part of the mode gradually decreases and then begins to move from the stable region toward the unstable region. Mode gradually moves from the unstable area toward the stable area.
3.2. Optimization Method for Controller Parameters of PV-VSG
In order to improve the stability and stability margin of the photovoltaic power generation system, controller parameters can be designed. According to the influence law of the characteristic value on the transient characteristics of the system, the parameter selection of the controller should make the absolute value of the real part of the eigenvalue as large as possible to shorten the transient process and return it to the steady state. Considering that the frequency of the power system is 50 Hz, it is desirable that the oscillation frequency of the oscillation mode be much smaller than 50 Hz. In order to reduce the number of oscillation cycles, it is desirable that the damping of each mode be relatively large.
The traditional controller parameter design method is to determine each controller parameter according to the analysis of the eigenvalue trajectory of the system. However, the traditional design method lacks scientific and reasonable quantitative design standards and cannot provide an optimal parameter combination in the global scope for the characteristics of system parameter coupling. Based on the general rules of parameter design, this paper utilizes a quantitative model to reflect the comprehensive benefits of different parameter combinations. In summary, the control parameters should be chosen such that the real part of the eigenvalue is negative and its absolute value is large; the absolute value of the eigenvalue’s imaginary part is small. Therefore, the objective function of control parameter optimization is
where is the ith eigenvalue of the system; Re() and Im() are the real and imaginary parts of , respectively; and and are the weights of the real part of , respectively.
The initial conditions of the photovoltaic power generation system under different lighting conditions and temperature are different, which affects the accuracy of the small-signal model. Thus, the linearization is performed under different initial conditions. The objective function of the control parameter optimization is
where is the objective function of the control parameter optimization in the jth initial condition. In order to ensure the stability of the system, the value of the controller parameters and the real part of the eigenvalue must be limited, i.e.,
where , , , , and are the upper limit stability thresholds which can be obtained according to the eigenvalue trajectories of the PV-VSG generation system. Considering system dynamic performance, can be obtained by maintaining the damping of the open loop transfer function of the VSG. is the stable threshold of the real part of the eigenvalue, which is a negative number, and the larger the absolute value, the more stable the stability of the system. The controller parameter optimization design goal is transformed into searching for the optimal combination of all parameters satisfying the constraint within the entire parameter range, so that the objective function U is maximized.
4. Simulation and Results
In the test system, , , , , , , and are taken to be 30, 10, 20, 10, 20, 20, and −2, respectively. The optimal combination of parameters according to the global optimal design method is shown in Table 3, and the corresponding system eigenvalues are shown in Table 4.
Table 3.
Global optimal controller parameters.
Table 4.
Eigenvalues of PV-VSG using initial parameters and optimized parameters.
To further demonstrate the effectiveness of the proposed parameter design method, a time domain simulation has been performed. A contrast method in [25] is utilized to highlight the effectiveness of the proposed method. The comparison method is designed based on the small-signal model when the light intensity is 750.
Case A: First let the system work at the operating point where the light intensity is 1000; at this time the PV-VSG output active power is At 1 s, the light intensity of the PV-VSG is increased by 5% and reverted back to the initial values 20 ms later. Figure 5 shows the active power of the PV-VSG using the initial parameters, the proposed method, and the contrast method. Because the robustness has been considered in the parameter design, it is not surprising that the damping ratios of the proposed method are considerably better than those of the other method.
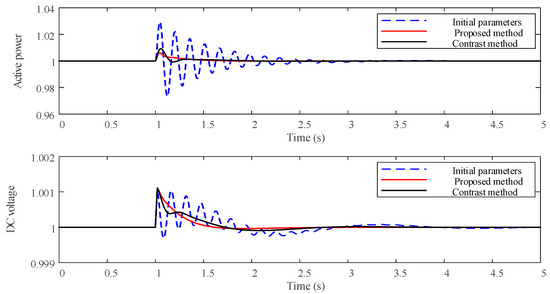
Figure 5.
Active power and DC voltage of the PV-VSG with small disturbance.
Case B: First let the system work at the operating point where the light intensity is 1000; at this time the PV-VSG output active power is . At 1 s, the light intensity of the PV-VSG is increased by 5% and reverted back to the initial values at 5 s. Figure 6 shows the active power of the PV-VSG using the initial parameters, the proposed method, and the contrast method. It can be seen that after the application of the optimal parameters, the active power is quickly attenuated and the PV-VSG switches to the new operating point with a faster speed and less oscillation.
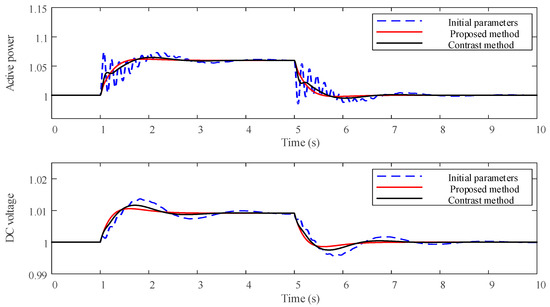
Figure 6.
Active power and DC voltage of the PV-VSG with small drift at the operating point.
Case C: The fluctuation of solar power output is used to test the performance of the proposed method. At 1 s, the light intensity of PV-VSG starts to change randomly by 5%. In Figure 7, the blue, red, and black curves represent the dynamic active powers and DC voltage of the PV-VSG with the initial parameters, with the proposed method, and with the contrast method, respectively. From the figure, it can be observed that the red curves have smaller oscillation magnitudes than the blue and black curves, proving the increased robustness of the proposed method.
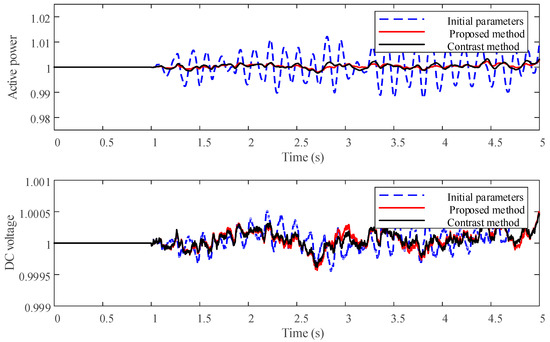
Figure 7.
Active power and DC voltage of the PV-VSG with random perturbation.
Case D: At 1 s, the light intensity of PV-VSG decreases from 1000 to 300. Then, the light intensity increases from 300 to 750 at 4 s. The parameter design method proposed in this paper takes into account the difference in operating points caused by light intensity and temperature. Great damping is achieved for different output levels and is not designed for a single operating point. The time domain simulation results using the initial parameters, the proposed method, and the contrast method are shown in Figure 8. When the output changes and the system operating point is far away from the initial operating point of the initial parameter controller design, the proposed method has a better suppression effect on oscillation than the other method.
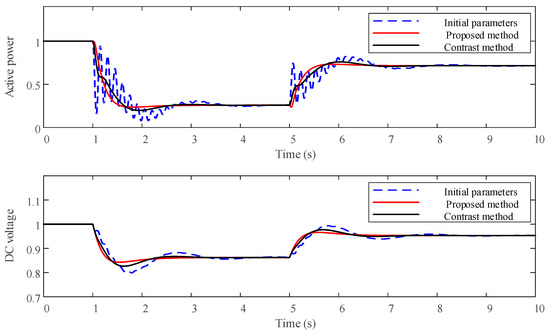
Figure 8.
Active power and DC voltage of the PV-VSG with big drift at the operating point.
Case E: A three-phase temporary fault is applied at the bus of PV-VSG at t = 1 s and is cleared 20 ms later. The dynamic responses of the PV-VSG are shown in Figure 9. The four blue, red, and black curves represent the dynamic active powers and DC voltage of the PV-VSG with the initial parameters, with the proposed method, and with the contrast method, respectively. It can be seen from the figure that the proposed method gives a better damping performance under fault conditions. It is clear from Figure 9 that the proposed method damps oscillations within 200 ms, thereby confirming the robustness of the proposed methodology under fault conditions.
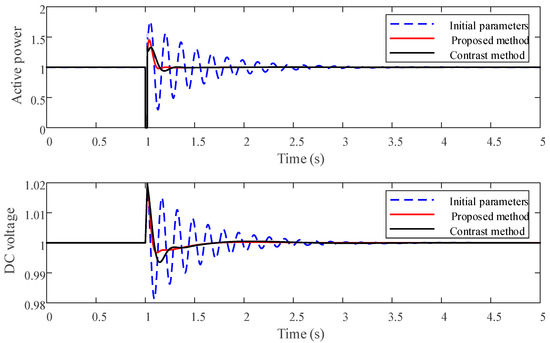
Figure 9.
Active power and DC voltage of the PV-VSG with a three-phase temporary fault.
5. Conclusions
For the PV-VSG integrated power system, this paper presents an adaptive controller parameter design method. A small-signal model of a PV-VSG is built and the small-signal stability and oscillation characteristics of the photovoltaic power generation system are analyzed. Considering the limitations of system oscillations and the stochastic drifting of the operating point, controller parameters are designed using a global optimization method to improve system stability. The optimized parameters are used to maintain a good damping performance when the output of the PV cells randomly drifts at the operating point. The time domain simulation results of the PV-VSG integrated power system prove the effectiveness and adaptability of the proposed parameter design method.
In this paper, the power system into which PV-VSG is incorporated is an infinite system. In an actual system, the interaction between PV-VSG and other dynamic components in the system such as generators and HVDC (High Voltage Direct Current), etc., may cause oscillation. Studying the dynamic interaction between PV-VSG and complex systems and the suppression of oscillations will be the focus of future research.
Author Contributions
Conceptualization, J.D.; methodology, N.X.; software, T.W.; validation, J.J.; formal analysis, T.W.; investigation, T.W.; resources, J.D.; data curation, J.Y.; supervision, S.P.; writing—original draft preparation, T.W.; writing—review and editing, T.W.; visualization, T.W. All authors have read and agreed to the published version of the manuscript.
Funding
This research was funded by Fundamental Research Funds for the Central Universities (2018MS006).
Acknowledgments
This work was supported by Fundamental Research Funds for the Central Universities (2018MS006).
Conflicts of Interest
No conflict of interest exists in the submission of this manuscript and the manuscript has been approved by all authors for publication. We would like to declare on behalf of my co-authors that the work described was original research that has not been published previously and is not under consideration for publication elsewhere, in whole or in part.
References
- Foresi, J.; Babej, A.; Han, R.; Liao, T.; Wang, C.; King, D.L. Suncore’s CPV power plant deployment in western China. In Proceedings of the 2014 IEEE 40th Photovoltaic Specialists Conference, Denver, CO, USA, 8–13 June 2014; pp. 3282–3286. [Google Scholar]
- Wang, D.; Yuan, X.; Zhao, M.; Qian, Y. Impact of large-scale photovoltaic generation integration structure on static voltage stability in China’s Qinghai province network. J. Eng. 2017, 2017, 671–675. [Google Scholar] [CrossRef]
- Tamimi, B.; Canizares, C.A.; Bhattacharya, K. System Stability Impact of Large-Scale and Distributed Solar Photovoltaic Generation: The Case of Ontario, Canada. IEEE Trans. Sustain. Energy 2013, 4, 680–688. [Google Scholar] [CrossRef]
- Maslo, K. Impact of Photovoltaics on Frequency Stability of Power System During Solar Eclipse. IEEE Trans. Power Syst. 2016, 31, 3648–3655. [Google Scholar] [CrossRef]
- Sinder, R.L.; Assis, T.M.L.; Taranto, G.N. Impact of photovoltaic systems on voltage stability in islanded distribution networks. J. Eng. 2019, 2019, 5023–5027. [Google Scholar] [CrossRef]
- Nguyen, N.; Mitra, J. An Analysis of the Effects and Dependency of Wind Power Penetration on System Frequency Regulation. IEEE Trans. Sustain. Energy 2016, 7, 354–363. [Google Scholar] [CrossRef]
- Bevrani, H.; Ghosh, A.; Ledwich, G. Renewable energy sources and frequency regulation: Survey and new perspectives. IET Renew. Power Gener. 2010, 4, 438–457. [Google Scholar] [CrossRef]
- David, N.; Wang, Z. Physical rotor inertia of DFIG wind turbines for short-term frequency regulation in low-inertia grids. In Proceedings of the 2017 IEEE Power & Energy Society General Meeting, Chicago, IL, USA, 16–20 July 2017. [Google Scholar]
- Zhong, Q.; Weiss, G. Synchronverters: Inverters That Mimic Synchronous Generators. IEEE Trans. Ind. Electron. 2011, 58, 1259–1267. [Google Scholar] [CrossRef]
- Beck, H.P.; Hesse, R. In Virtual synchronous machine. In Proceedings of the 2007 9th International Conference on Electrical Power Quality and Utilisation, Barcelona, Spain, 9–11 October 2007; pp. 1–6. [Google Scholar]
- Bevrani, H.; Ise, T.; Miura, Y. Virtual synchronous generators: A survey and new perspectives. Int. J. Electr. Power Energy Syst. 2014, 54, 244–254. [Google Scholar] [CrossRef]
- Zhong, Q.; Nguyen, P.; Ma, Z.; Sheng, W. Self-Synchronized Synchronverters: Inverters Without a Dedicated Synchronization Unit. IEEE Trans. Power Electron. 2014, 29, 617–630. [Google Scholar] [CrossRef]
- Driesen, J.; Visscher, K. Virtual synchronous generators. In Proceedings of the 2008 IEEE Power and Energy Society General Meeting-Conversion and Delivery of Electrical Energy in the 21st Century, Pittsburgh, PA, USA, 20–24 July 2008. [Google Scholar]
- Hirase, Y.; Abe, K.; Sugimoto, K.; Shindo, Y. Energy, A Grid Connected Inverter with Virtual Synchronous Generator Model of Algebraic Type. IEEJ Trans. Power Energy 2012, 132, 371–380. [Google Scholar] [CrossRef]
- Mahmud, M.A.; Pota, H.R.; Hossain, M.J. Dynamic Stability of Three-Phase Grid-Connected Photovoltaic System Using Zero Dynamic Design Approach. IEEE J. Photovolt. 2012, 2, 564–571. [Google Scholar] [CrossRef]
- Eftekharnejad, S.; Vittal, V.; Heydt, G.T.; Keel, B.; Loehr, J. Small Signal Stability Assessment of Power Systems with Increased Penetration of Photovoltaic Generation: A Case Study. IEEE Trans. Sustain. Energy 2013, 4, 960–967. [Google Scholar] [CrossRef]
- Li, C. Unstable Operation of Photovoltaic Inverter from Field Experiences. IEEE Trans. Power Deliv. 2018, 33, 1013–1015. [Google Scholar] [CrossRef]
- Yang, L.; Gan, J.; Xia, C.; Hu, Z.; Gao, B.; Qu, L. Research on the Frequency Regulation Strategy of Virtual Synchronous Generator Based Photovoltaic Power Plant. In Proceedings of the 2018 IEEE 8th International Conference on Cyber Technology in Automation Control and Intelligent Systems, Tianjin, China, 19–23 July 2018. [Google Scholar]
- Guo, Y.; Chen, L.; Li, K.; Zheng, T.; Mei, S. A novel control strategy for stand-alone Photovoltaic system based on Virtual Synchronous Generator. In Proceedings of the 2016 IEEE Power and Energy Society General Meeting, Boston, MA, USA, 17–21 July 2016; pp. 1–5. [Google Scholar]
- Mao, M.; Cheng, Q.; Yong, D. Applications, Decentralized Coordination Power Control for Islanding Microgrid Based on PV/BES-VSG. CPSS Trans. Power Electron. 2018, 3, 14–24. [Google Scholar]
- Yu, Y.; Hu, X. Active Disturbance Rejection Control Strategy for Grid-Connected Photovoltaic Inverter Based on Virtual Synchronous Generator. IEEE Access 2019, 7, 17328–17336. [Google Scholar] [CrossRef]
- Mei, S.; Zheng, T.; Chen, L.; Li, C.; Si, Y.; Guo, Y. A comprehensive consensus-based distributed control strategy for grid-connected PV-VSG. In Proceedings of the 2016 35th Chinese Control Conference, Chengdu, China, 27–29 July 2016; pp. 10029–10034. [Google Scholar]
- Du, W.; Fu, Q.; Wang, H. Power System Small-Signal Angular Stability Affected by Virtual Synchronous Generators. IEEE Trans. Power Syst. 2019, 34, 3209–3219. [Google Scholar] [CrossRef]
- Li, Z.; Jia, X. An Improved VSG Control Strategy Based on the Amplitude-frequency Characteristics of Virtual Power. IEEE Access 2019, 7, 101096–101105. [Google Scholar] [CrossRef]
- Wu, H.; Ruan, X.; Yang, D.; Chen, X.; Zhao, W.; Lv, Z.; Zhong, Q. Small-Signal Modeling and Parameters Design for Virtual Synchronous Generators. IEEE Trans. Ind. Electron. 2016, 63, 4292–4303. [Google Scholar] [CrossRef]


© 2020 by the authors. Licensee MDPI, Basel, Switzerland. This article is an open access article distributed under the terms and conditions of the Creative Commons Attribution (CC BY) license (http://creativecommons.org/licenses/by/4.0/).