Article

Energy End-Use Categorization and Performance Indicators for Energy Management in the Engineering Industry

Department of Management and Engineering, Division of Energy Systems, Linköping University, SE-581 83 Linköping, Sweden
*
Author to whom correspondence should be addressed.
Energies 2020, 13(2), 369; https://doi.org/10.3390/en13020369
Submission received: 10 December 2019 / Revised: 9 January 2020 / Accepted: 10 January 2020 / Published: 12 January 2020

Abstract

:
Energy efficiency (EE) improvement is one of the most crucial elements in the decarbonization of industry. EE potential within industries largely remains untapped due to the lack of information regarding potential EE measures (EEM), knowledge regarding energy use, and due to the existence of some inconsistencies in the evaluation of energy use. Classification of energy end-using processes would increase the understanding of energy use, which in turn would increase the detection and deployment of EEMs. The study presents a novel taxonomy with hierarchical levels for energy end-use in manufacturing operations for the engineering industry, analyzes processes in terms of energy end-use (EEU) and CO2 emissions, and scrutinizes energy performance indicators (EnPIs), as well as proposing potential new EnPIs that are suitable for the engineering industry. Even though the study has been conducted with a focus on the Swedish engineering industry, the study may be generalizable to the engineering industry beyond Sweden.

Graphical Abstract

1. Introduction

In 2018, 37% of global energy end-use (EEU) [1] and 36% of total CO2 emissions emanated from the industrial sector [2]. In Sweden, industrial EEU is about 38% of the total energy use, of which 5.2% is from the engineering industry [3]. Energy efficiency (EE) has been widely recognized as a promising way of decoupling the energy-related CO2 emissions from economic growth. According to the international energy agency (IEA), improved EE from all sectors could deliver 35% of the cumulative CO2 savings required by 2050 to meet the goals of the Paris Agreement [4].
Although EE continues to improve, unfortunately, the improvement rate of EE slowed continuously for the third consecutive year to 2018 as shown by the IEA [5]. Additionally, various studies show that the implementation rate of energy efficiency measures (EEMs) is still low [6,7]. Among various barriers to EE implementation, some are related directly to lack of information and knowledge of EE, as shown in various studies, see e.g., [8,9,10,11]. Comprehensive knowledge of the industrial energy use of the processes is key for effective energy efficiency in industries, as shown in a study conducted by Thollander [12]. Another study by Thollander [
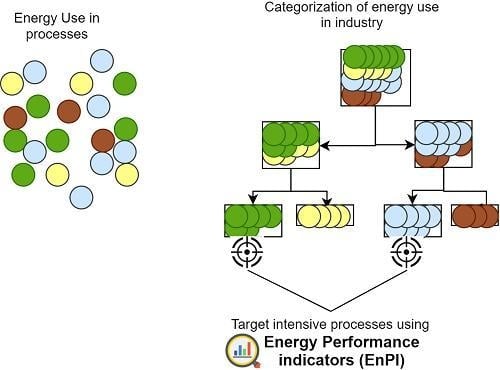
13] shows that there is a wide difference in energy data for industries between countries and that there is a need for a general taxonomy or general categorization for structuring EEU. A taxonomical classification can and will provide a simple and generalized, yet reliable, representation of complex phenomena and would be the basis for communication and understanding [14]. Animals and insects, are more complex than industrial production, and have successfully been categorized, while EEU of industrial processes still lacks a harmonized taxonomy [13]. An EEU taxonomy enhances the credibility and consistency of energy data, increases the knowledge of the EE potential, and enhances the deployment rates of EEMs [
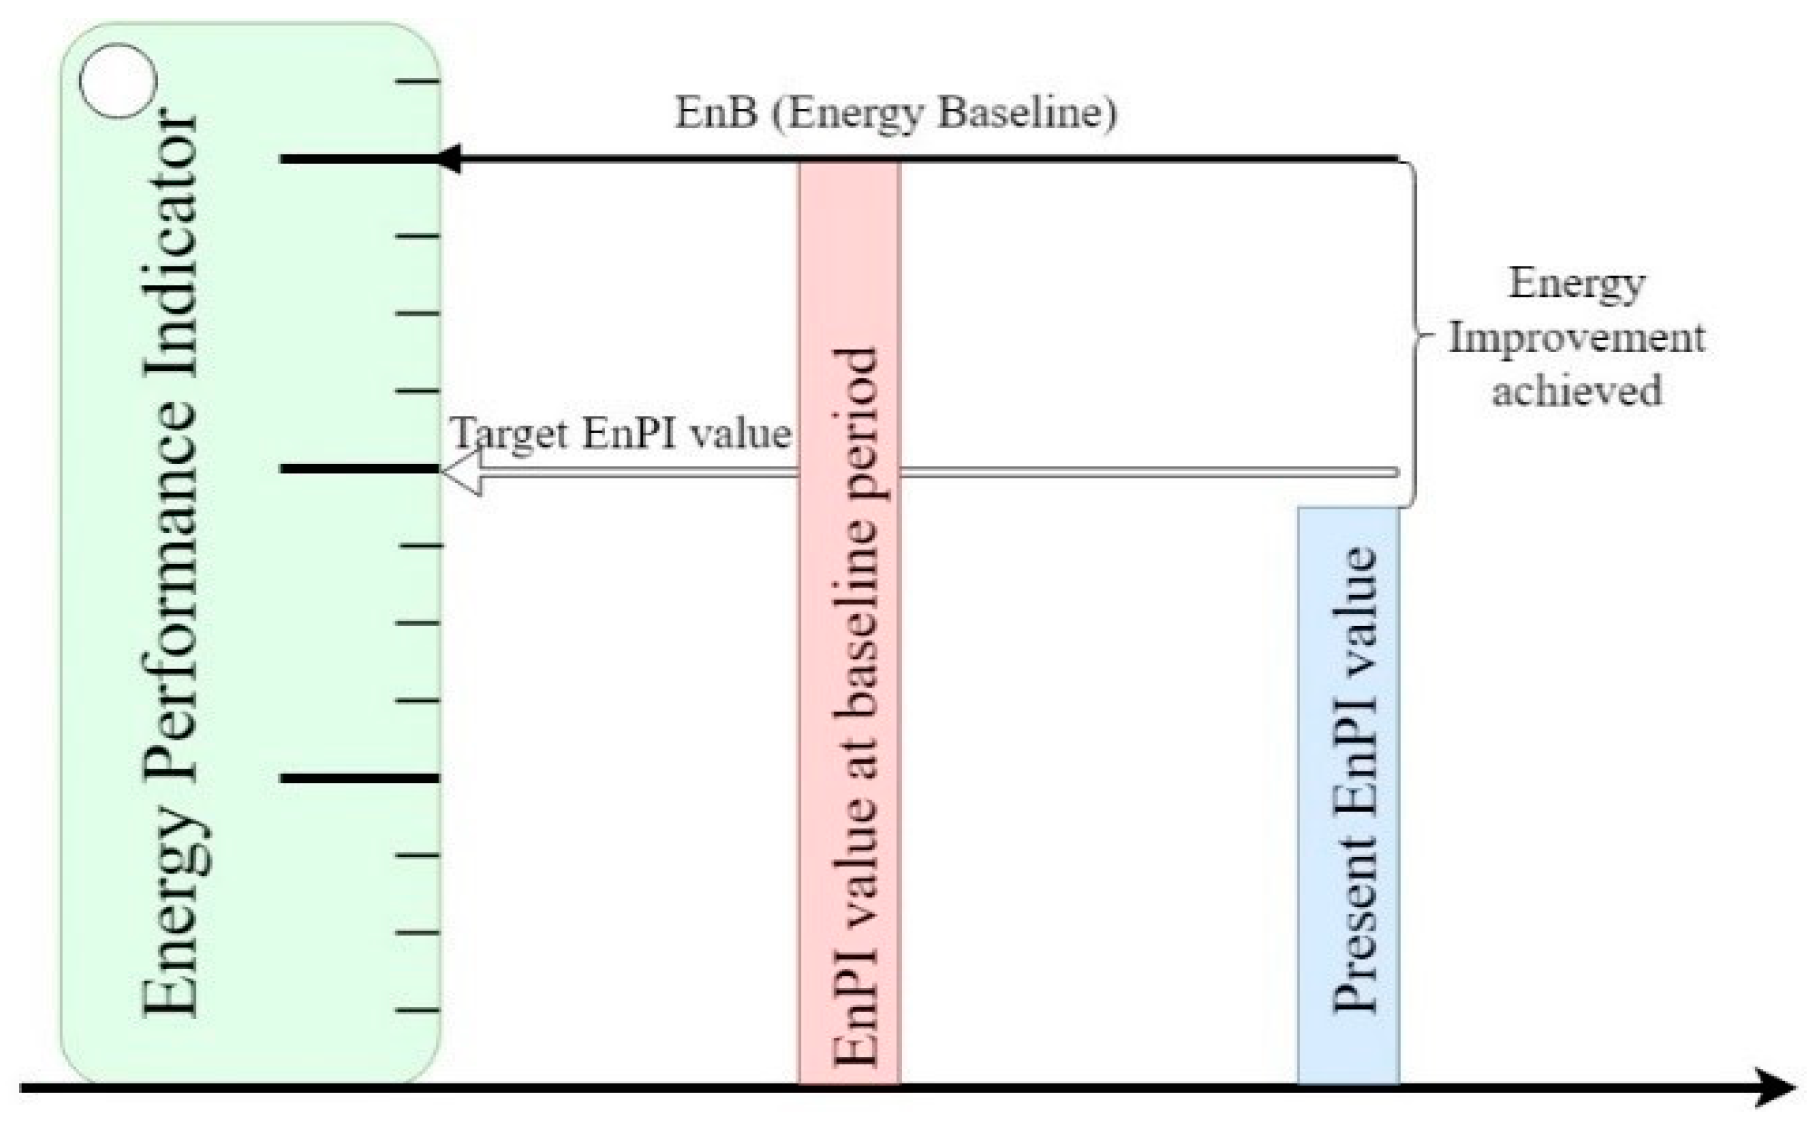
15]. Furthermore, to understand the deployment level and EE potential, it is also necessary to identify relevant energy performance indicators (EnPIs). As per ISO 50006, an EnPI can be defined as a gauge to understand and monitor energy performance related to energy [16]. EnPIs assist the organizations in understanding the deployment level and formulating the energy management objective in the organization [16]. For example, if two industries have similar operation, identifying the base process and measuring performance with EnPIs helps to compare the EE.
The primary aim of this paper is to evaluate the EEU application in terms of production properties/function and to introduce a taxonomy for EEU operations in the engineering industry. The second aim of the study is to analyze the EEU and CO2 emissions of different processes categorized in the engineering industry. The final aim of the study is to analyze in-house EnPIs and propose potential new operational EnPIs that are suitable for the engineering industry. Based on this, the following three research questions are to be answered:
  • How can the manufacturing processes be classified in terms of energy use to create a general taxonomy?
  • How much energy end-use and CO2 emissions correspond to each process in the taxonomy?
  • Can EnPIs be developed and integrated into operations for the engineering industry?
This research is carried out using energy audit data specifically from engineering industries in Sweden. An engineering industry can be defined as the industries involved in the manufacturing of engineered products, mostly of metals. EEU in industries refers to the energy finally consumed by the different processes in the industry. There have been different studies categorizing the production processes based on aspects like flow process [17], organizational systematics [18], production technology [19] energy use [20], etc. However, to the authors’ knowledge, there have been no studies on categorization of EEUs processes in the engineering industries. This study is thus beneficial for a more comprehensive understanding of both EEU and CO2 emissions. This would facilitate targeting the highest potential at the process level and enhance the consistency of reports, allowing more credible comparison and stringency in data compilation, e.g., national storage of energy audits from energy policy programs. Additionally, the study enables easier identification and enhances opportunities for benchmarking of EEU.

2. Research Background

Knowledge of energy-related information on processes allows for the assessment and optimization of the potential and improvements of EEMs, before and after implementation [21]. A comprehensive categorization enables scholars to understand the problems [22] and enhances knowledge about the choice of EEMs. For managers, categorization provides a baseline for benchmarking the existing manufacturing system with competitive firms and other available technologies [22]. Categorization along with EnPIs helps in measurement and control, which are keys to establishing an effective energy management system [23,24].

2.1. Taxonomy

Taxonomy can be defined as the “theory and practice of delimiting and classifying different kinds of entities” [18], the entity studied here being the EEU in industrial processes. One of the suggested earlier attempts at taxonomy or categorization of the industrial EEU by Söderström [20], further developed by Thollander et al. [25], was to use the unit process concept. Primarily, all processes are divided into two main categories: production processes “the processes which are directly needed to produce products” and support processes “the processes that mainly support the production, but are not directly for production” [26]. This taxonomy has divided the unit processes into eleven production and ten support processes [26]. This classification has been broadly used by other researchers in different studies, for example to explain how to conduct an audit [25], to compare EEU of SMEs in different countries [13], to study EE potentials in SMEs [27], and to explain a bottom-up approach [26]. However, many production processes could not be allocated as per the above classification as the production processes vary with the industry. Due to this limitation some of the studies, such as energy management in the food industry [28], energy efficiency in the Italian fruit and vegetable processing industry [29], and EE in primary metals, plastics, and textile SMEs [7], did not use the unit processes concept. Further, it lacks hierarchical classification depending on the complexity of energy use from simple to complex. Hierarchical classification facilitates information retrieval and it aids the comparative research between manufacturing systems [18]. So, a hierarchical classification exclusive to each industrial sector can enhance the monitoring and analyzing of the energy use and helps in seeking the optimal potential.
The critical task in developing the classification system is to determine what attributes to use [22]. To identify classification attributes, both energy supply and energy use properties which determine the energy flow delineated in the production system. Energy supply attributes refer to the nature of energy supplied to the processes and energy use attributes refers to how energy is used in operations to add value to the material or service. One of the supply attributes in the classification can be the energy carrier. ISO 13600 defines energy carrier as “a substance or phenomenon that can be used to produce mechanical work or heat or to operate chemical or physical processes” [30]. To know the basic attributes pertaining to energy use in manufacturing, it is important to understand the manufacturing methods. At a general level, there are five basic manufacturing methods widely used in the engineering industry: casting, forming and shaping, machining, joining, and surface treatment [19,31,32]. Each of the manufacturing methods has different basic operations. For example, in casting, the basic steps including pattern making, core making, molding, melting, pouring, and cleaning [19]. These operations further have processes. For example, the melting process involves heating the material in an oven. The amount of energy and type of energy carrier vary with the manufacturing process, technology, and material [19].

2.2. Energy Performance Indicators

EnPIs are used to understand energy performance related to energy use, EE, and plays an important role in evaluating efficiency and effectiveness of EEM [16,23,24]. Implementing and monitoring EnPIs is very important to support the energy related decision making [33]. EnPI and energy baseline (EnB) are two key interrelated elements that enable the measurements related to EE, use, and performance [16,33,34]. EnB is used as a reference to quantify the energy performance before and after the implementation of the improvement actions [16]. Figure 1 illustrates the relationship between EnPI, EnB, energy target, and measurement of performance before and after implementation [16].
It is important to include the energy use characteristics and variable loads affecting the energy use, such as weather, occupancy, production hours, etc. while developing an EnPI [16]. The cause-effect relationship is central in distinguishing relevant variables from non-relevant ones [21]. According to ISO 50006 and IEA reports, based on characteristics, four types of EnPIs exist, which are energy use, simple ratio, statistical modeling, and simulation modeling used for EE improvement [16,35]. Energy use is “using the total energy use over a period of time” such as kWh, GJ, etc., [16], [35]. Energy intensity is an example of a simple ratio, which is defined as “rate of energy use per unit activity data” [16] such as specific energy consumption (SEC) [36], energy use (kWh) per production (ton) [35]. A statistical model can be a linear regression model or a non-linear regression model [35]. A simulation model can be applied over each boundary in order to measure improvements in EE and energy performance [35].
Defining energy performance boundaries is very important for defining an EnPI. According to ISO 50006, there are three primary EnPI boundary levels, which are individual, system, and organizational, as shown in Figure 2 [16]. Organizational figures are EnPIs related to the factory level, in which it represents a holistic view with major interactions between departments, total energy use and related expenses, and overall performance [33]. System figures are EnPIs related to the evaluation of the process line level, in which a comparison of similar processes is possible [33]. Meanwhile, EnPIs on an individual level are usually done for a detailed assessment of energy use and the related cost per manufacturing step or equipment level [33]. Interactions between different levels should be considered while developing related EnPIs [33]. Another categorization of indicators as per [26] is divided into three different levels, such as overall figures, support process-specific figures, and production process-specific figures [26].
Due to the complexity and variety of the manufacturing processes, no single EE indicator can be used for all cases [37]. It should be designed for a specific manufacturing process and industry sector. Many of the monitored EnPIs are physical indicators measured only at an aggregated level, such as total energy use, SEC, etc., [34]. Research shows that establishing clear EnPIs that can be followed up is an important factor for effective in-house energy management in industry and for continuous improvement [34]. While developing EnPIs, it is important to consider both the parameters, i.e., relevant variables affecting energy performance, and boundary level to monitor energy performance [16,21].

3. Methodology

The methodology for this paper uses a mixed-method approach with the inclusion of both empirical and axiomatic approaches. The axiomatic approach is used as a comprehensive literature review of previous studies in similar fields and expands the analysis by including energy audit reports for a solution. Then, the empirical approach is used to establish a result consisting of interviews with structured questionnaires. Combining both scientific study and audit report enhances the applicability of this research in industrial practice. Different steps were applied in this study, as shown in Figure 3, and are detailed below.
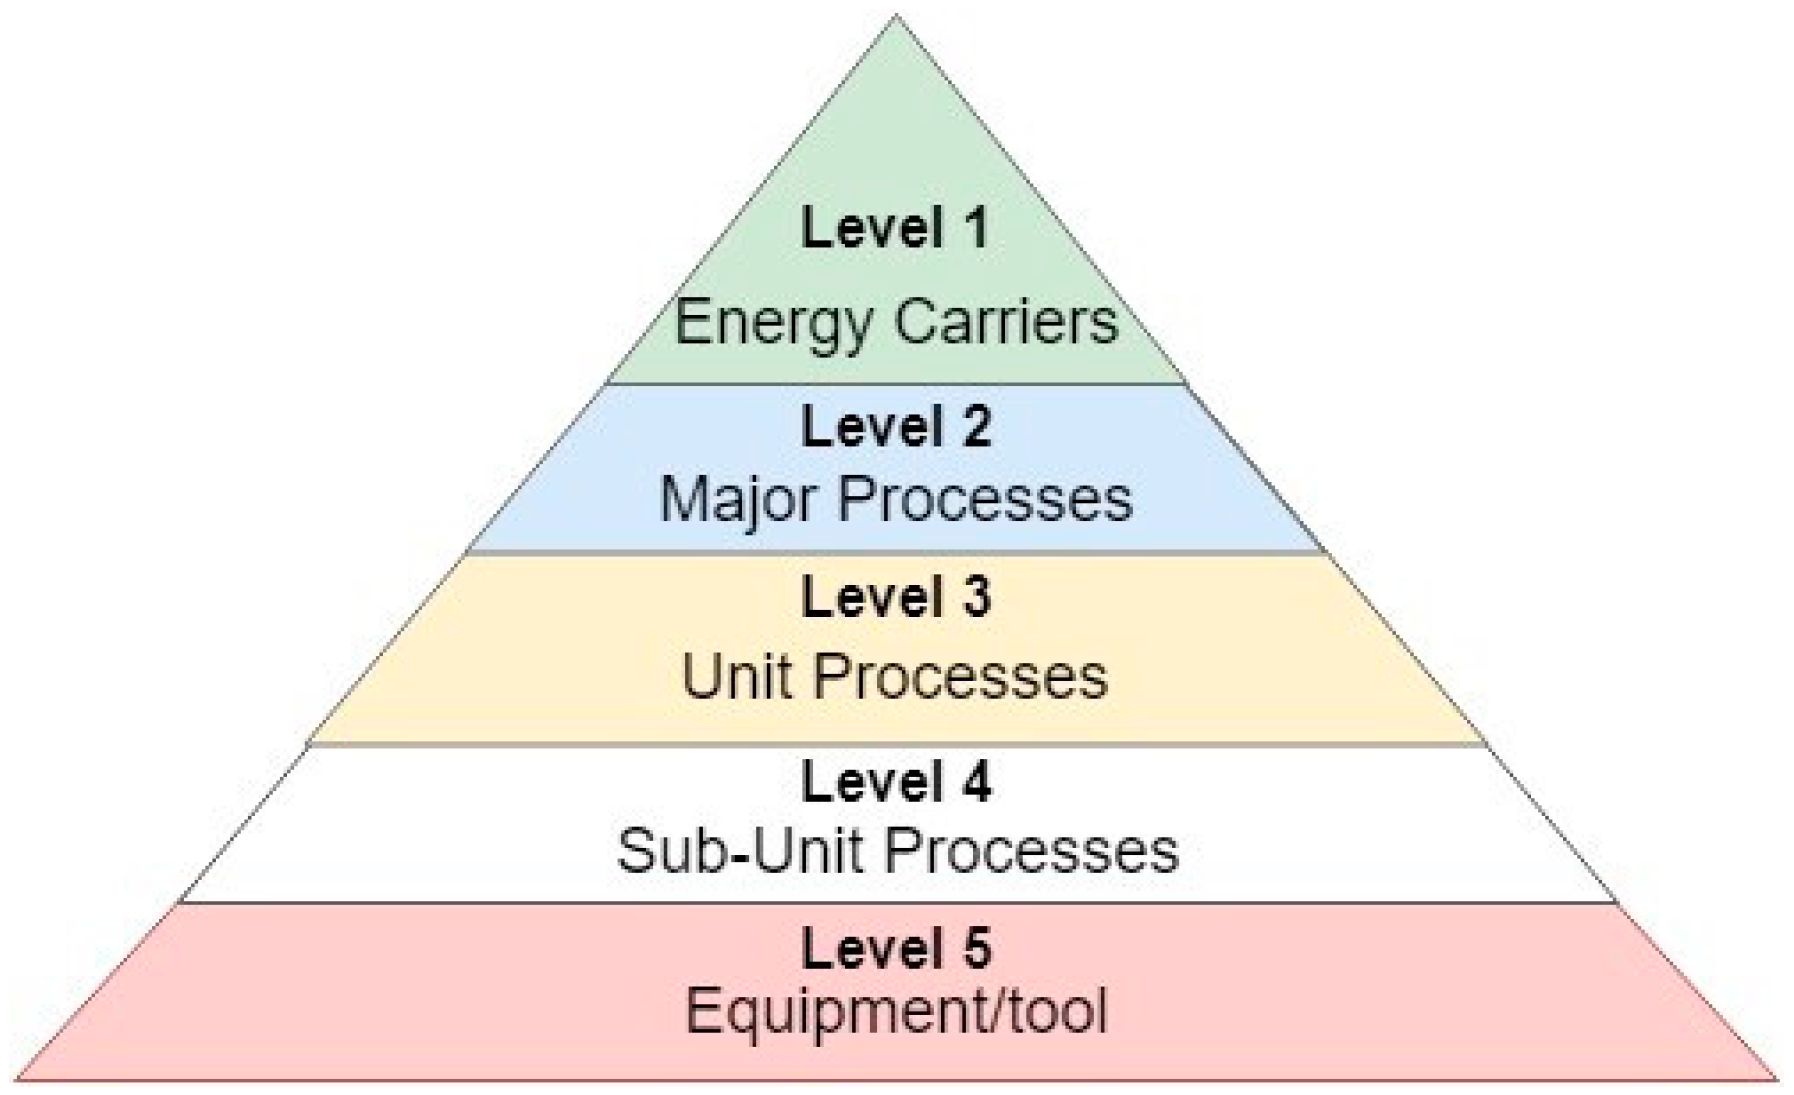
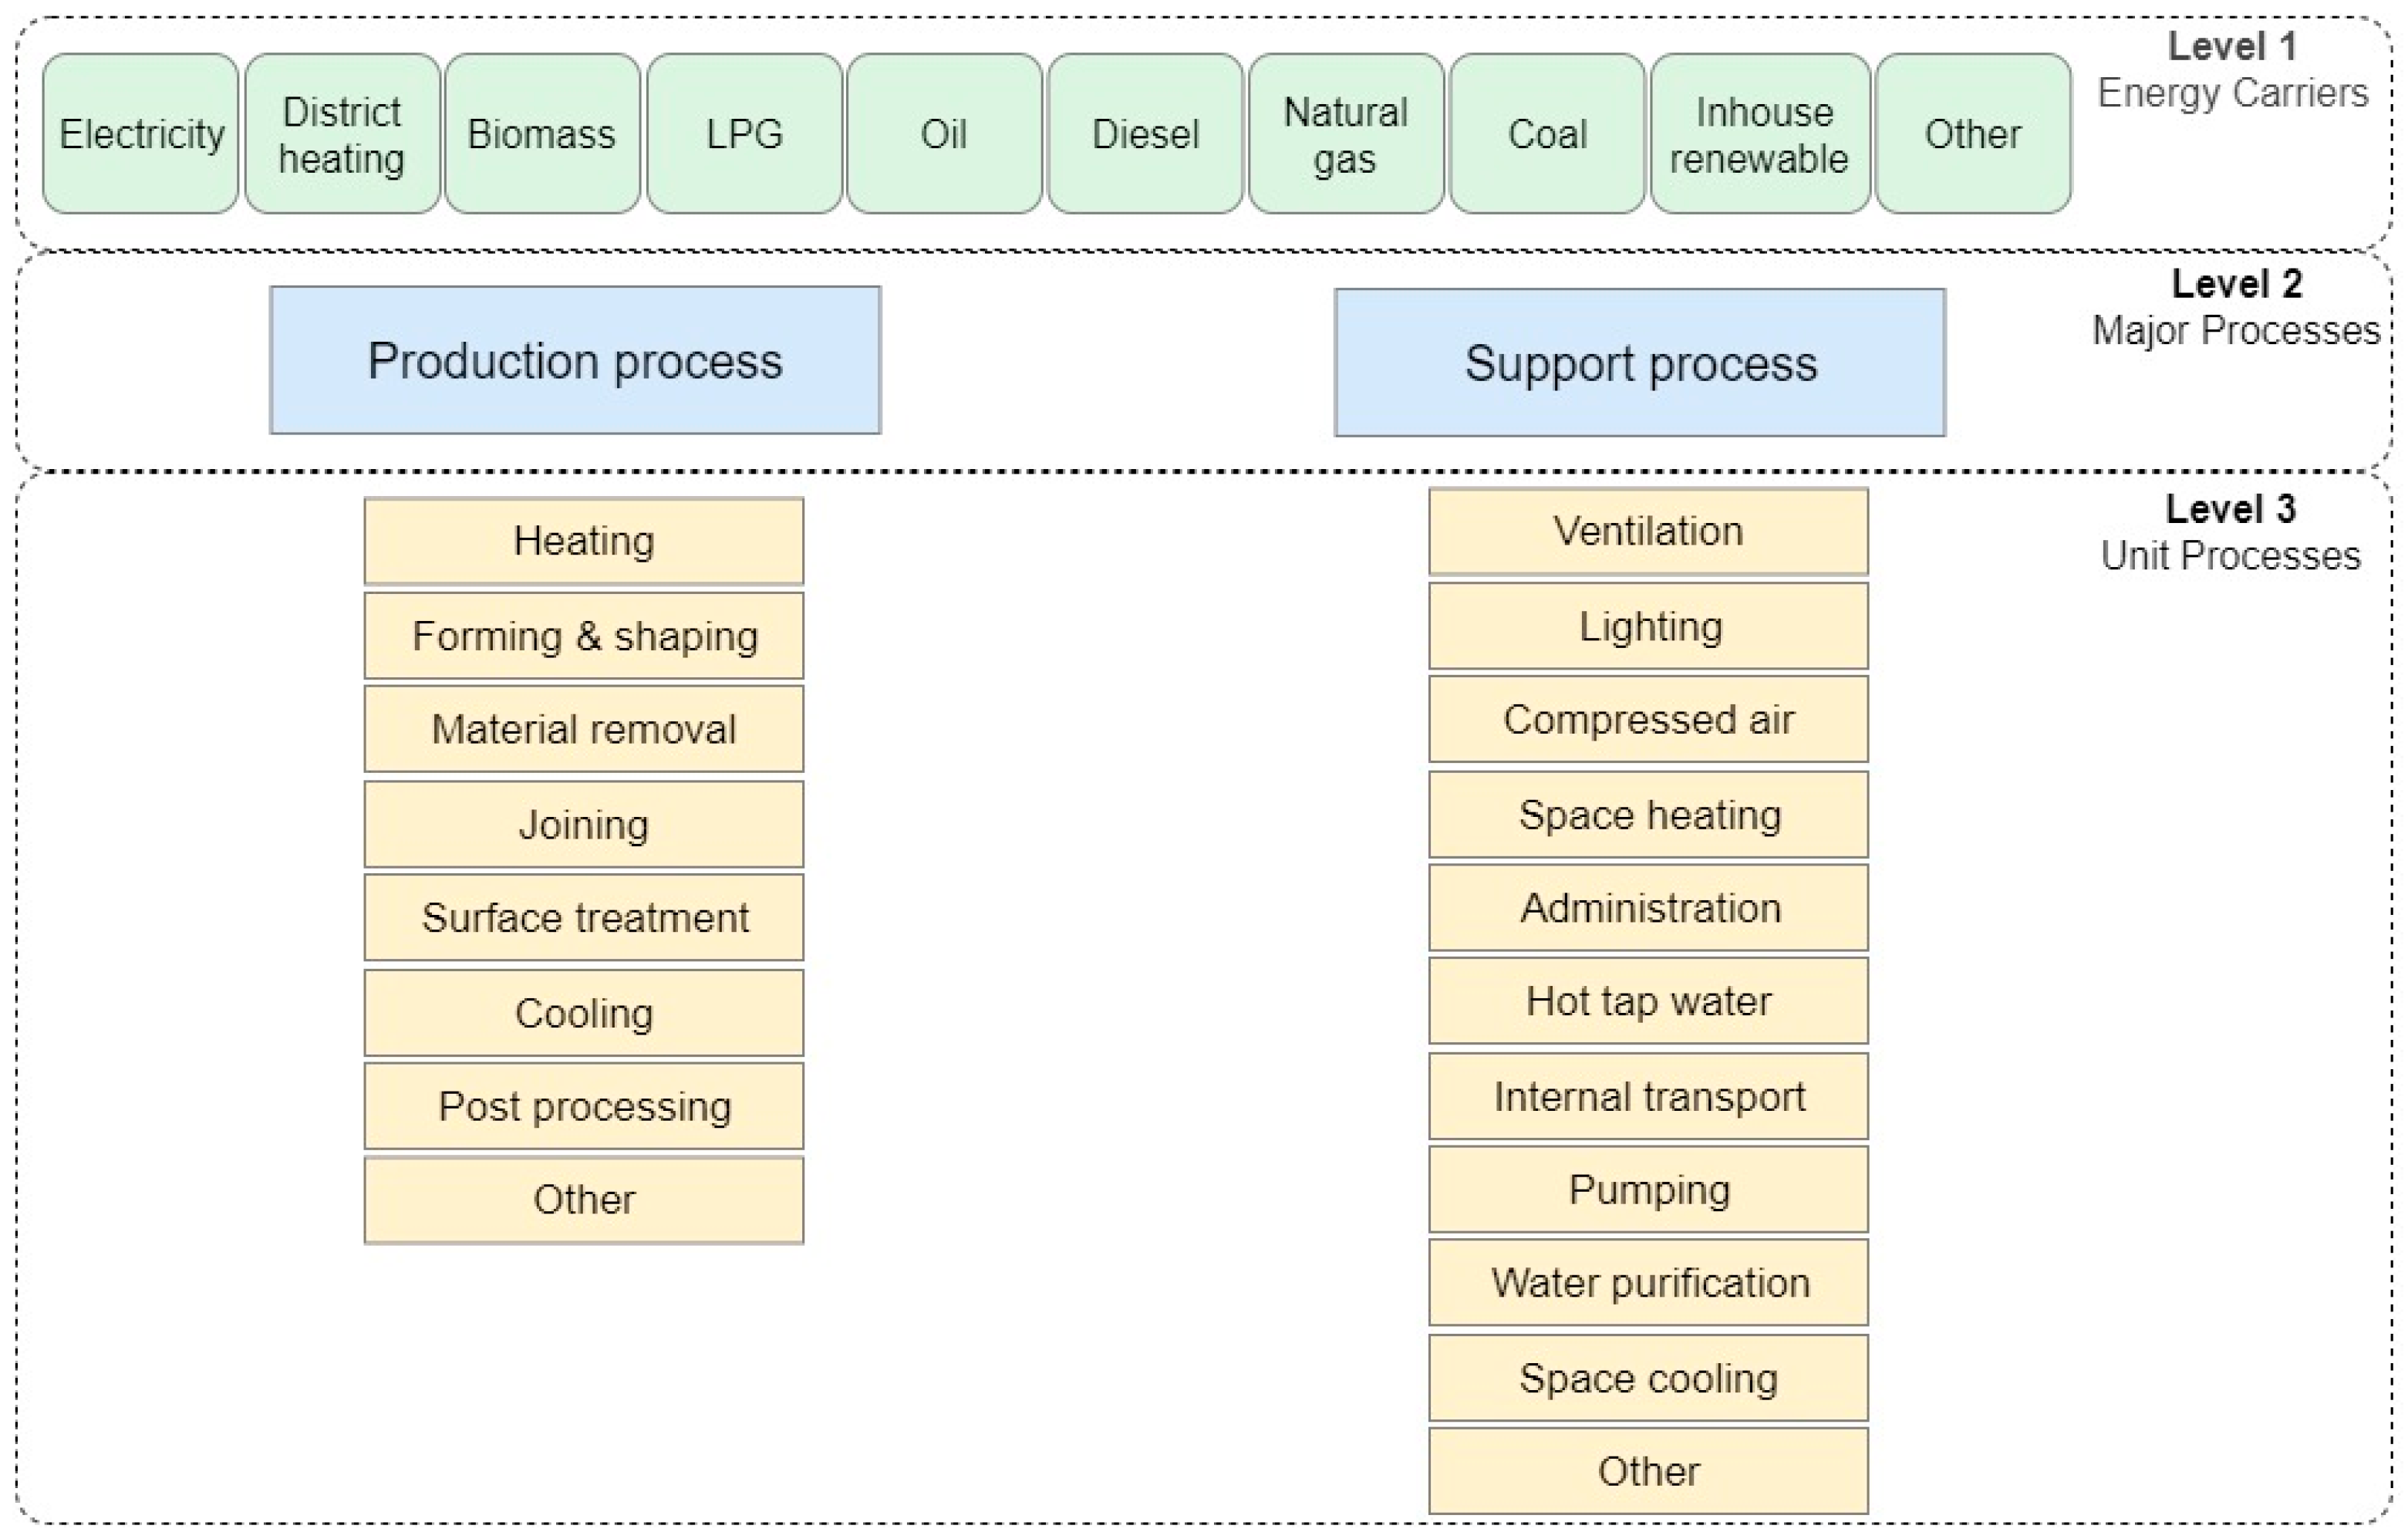
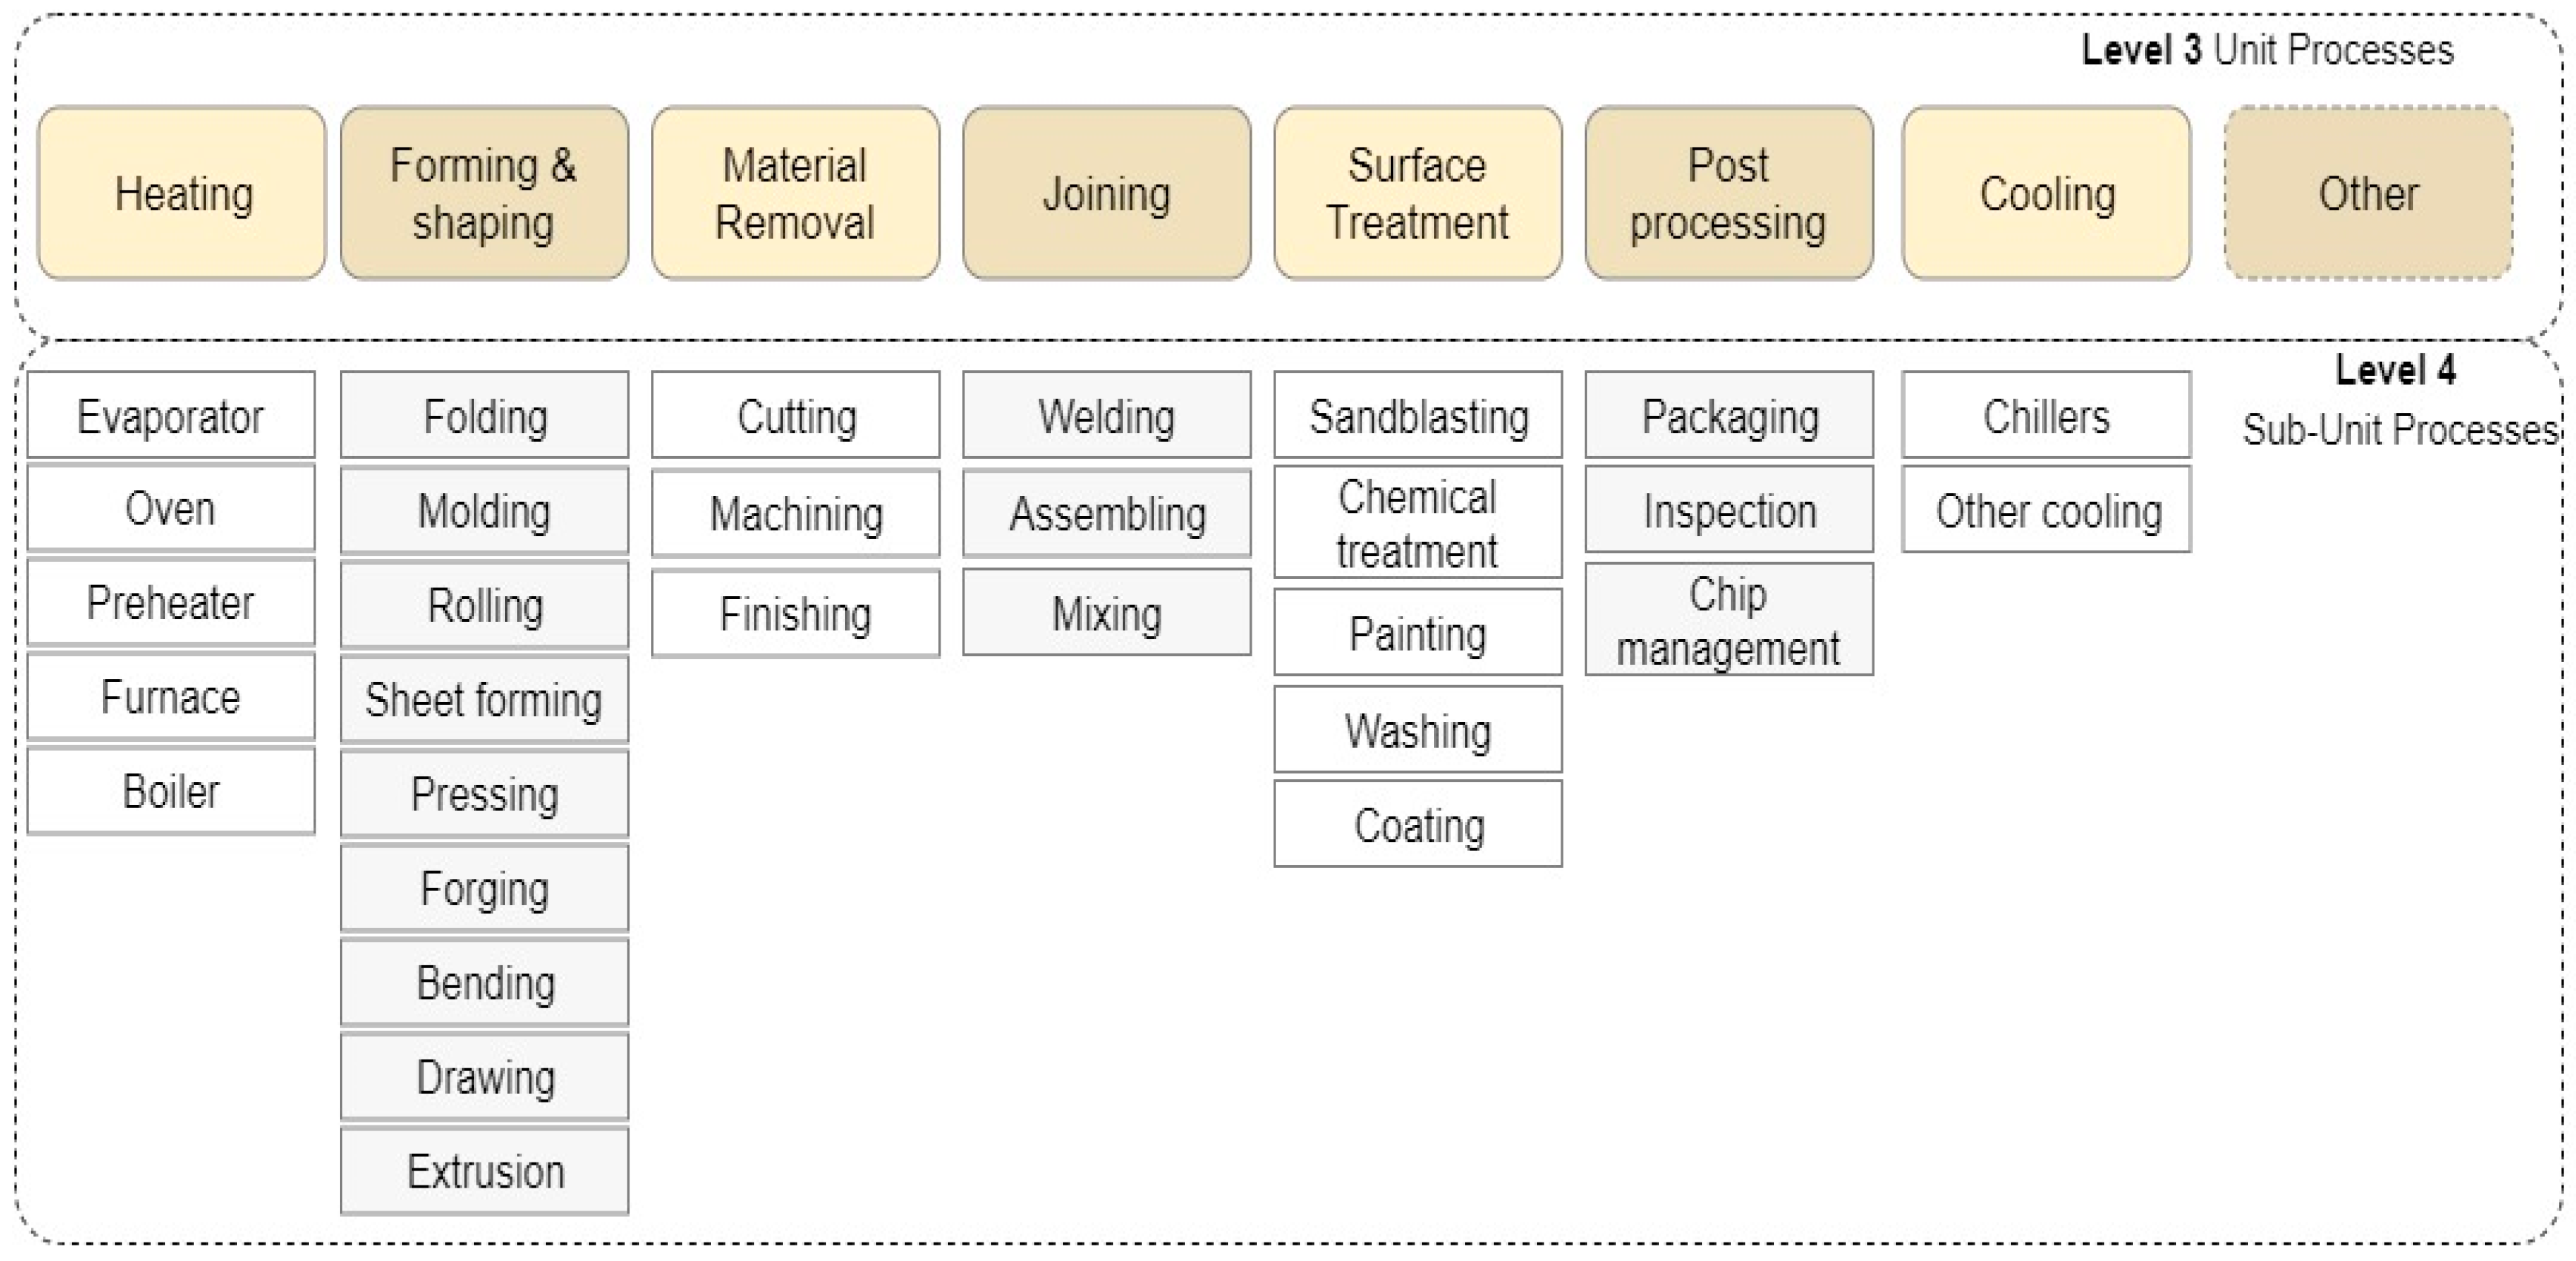
(1) The state-of-the-art analysis: The basis for the taxonomy is the identification of levels of hierarchy, as in biological taxonomy, by using an axiomatic approach. Four levels of hierarchy were framed based on the analysis of literature on manufacturing methods using classification science. A comprehensive literature review and an energy audit case study with an axiomatic approach were used to generate the process tree for EEU as part of general taxonomy. The energy audit reports used for the case study were bottom-up EEU data and were collected with the help of a private energy consultant firm. The details of audit reports are presented in Table 1. As EEU is not well classified in all collected reports, only 26 audit reports out of the 41 were selected for this study.
(2) The interviews: The interviews were carried out with energy managers from the engineering industry using a structured questionnaire. The questionnaire had three parts; the first part aimed to understand how the company was aligned to the energy management in the company. The second part was to validate the taxonomy developed in step 1 and collect feedback reviews from the industry for the taxonomy. The third part of the questionnaire was structured to investigate and collect EnPIs used in the sector.
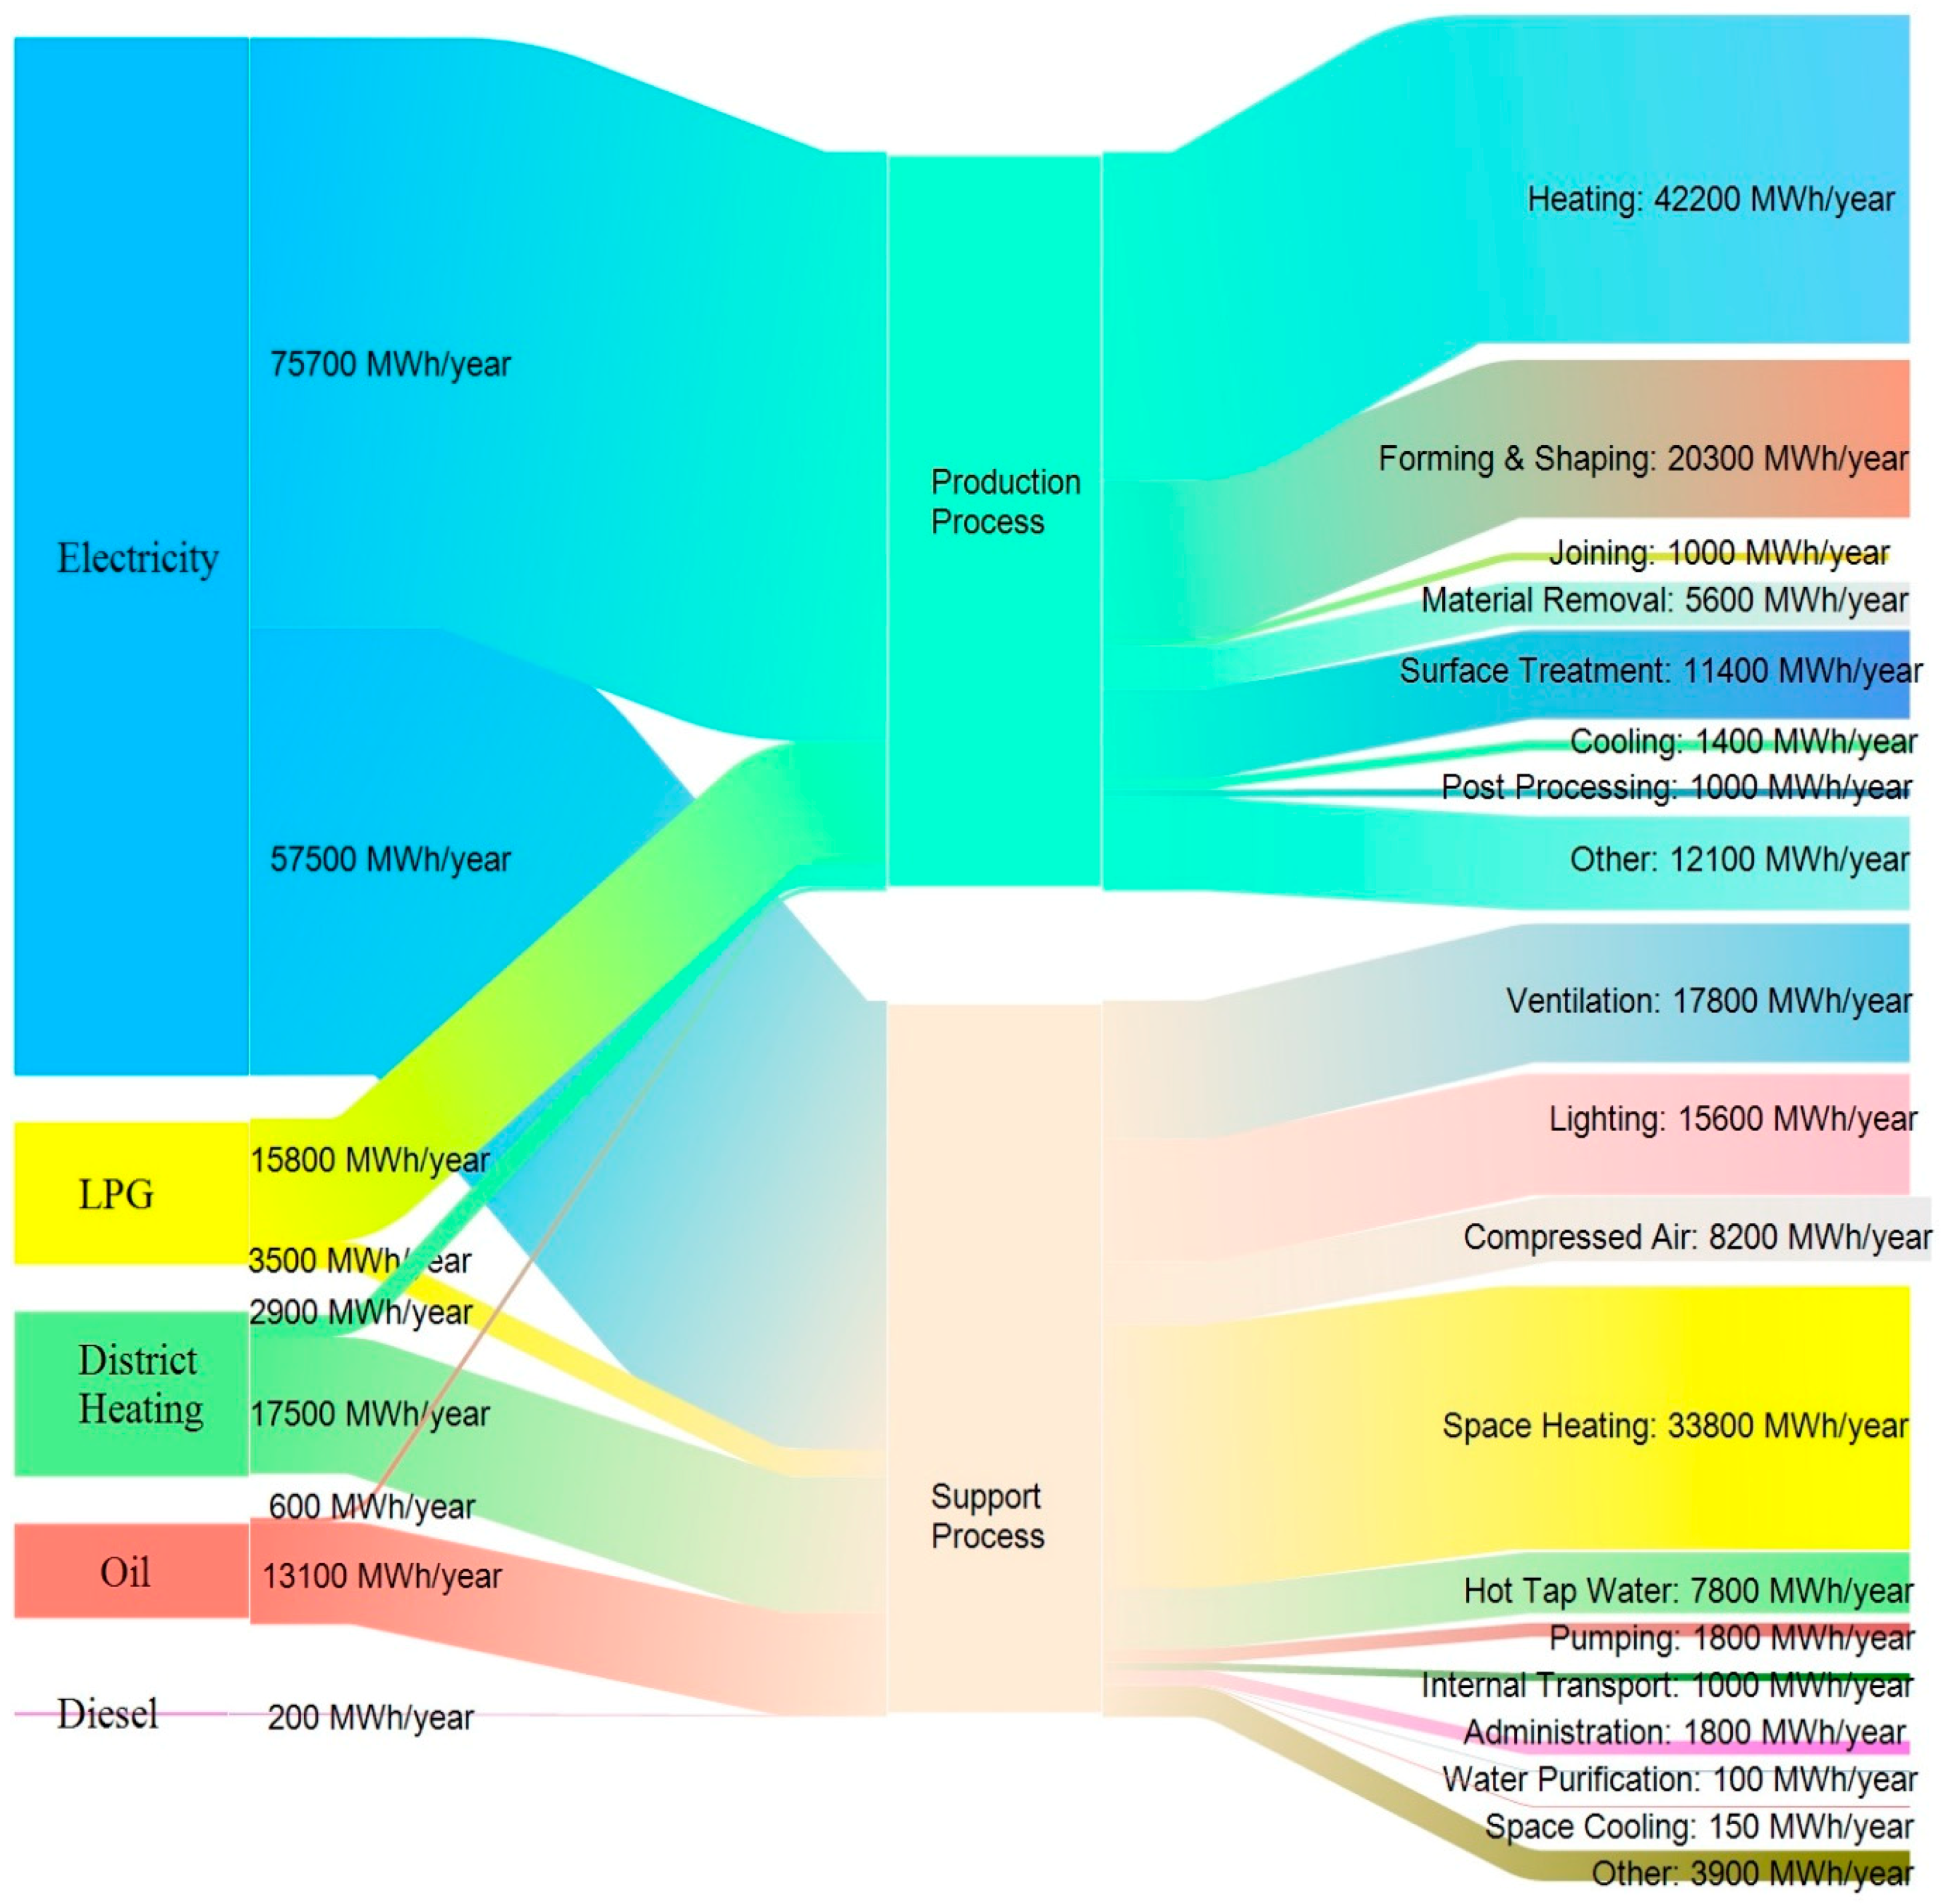
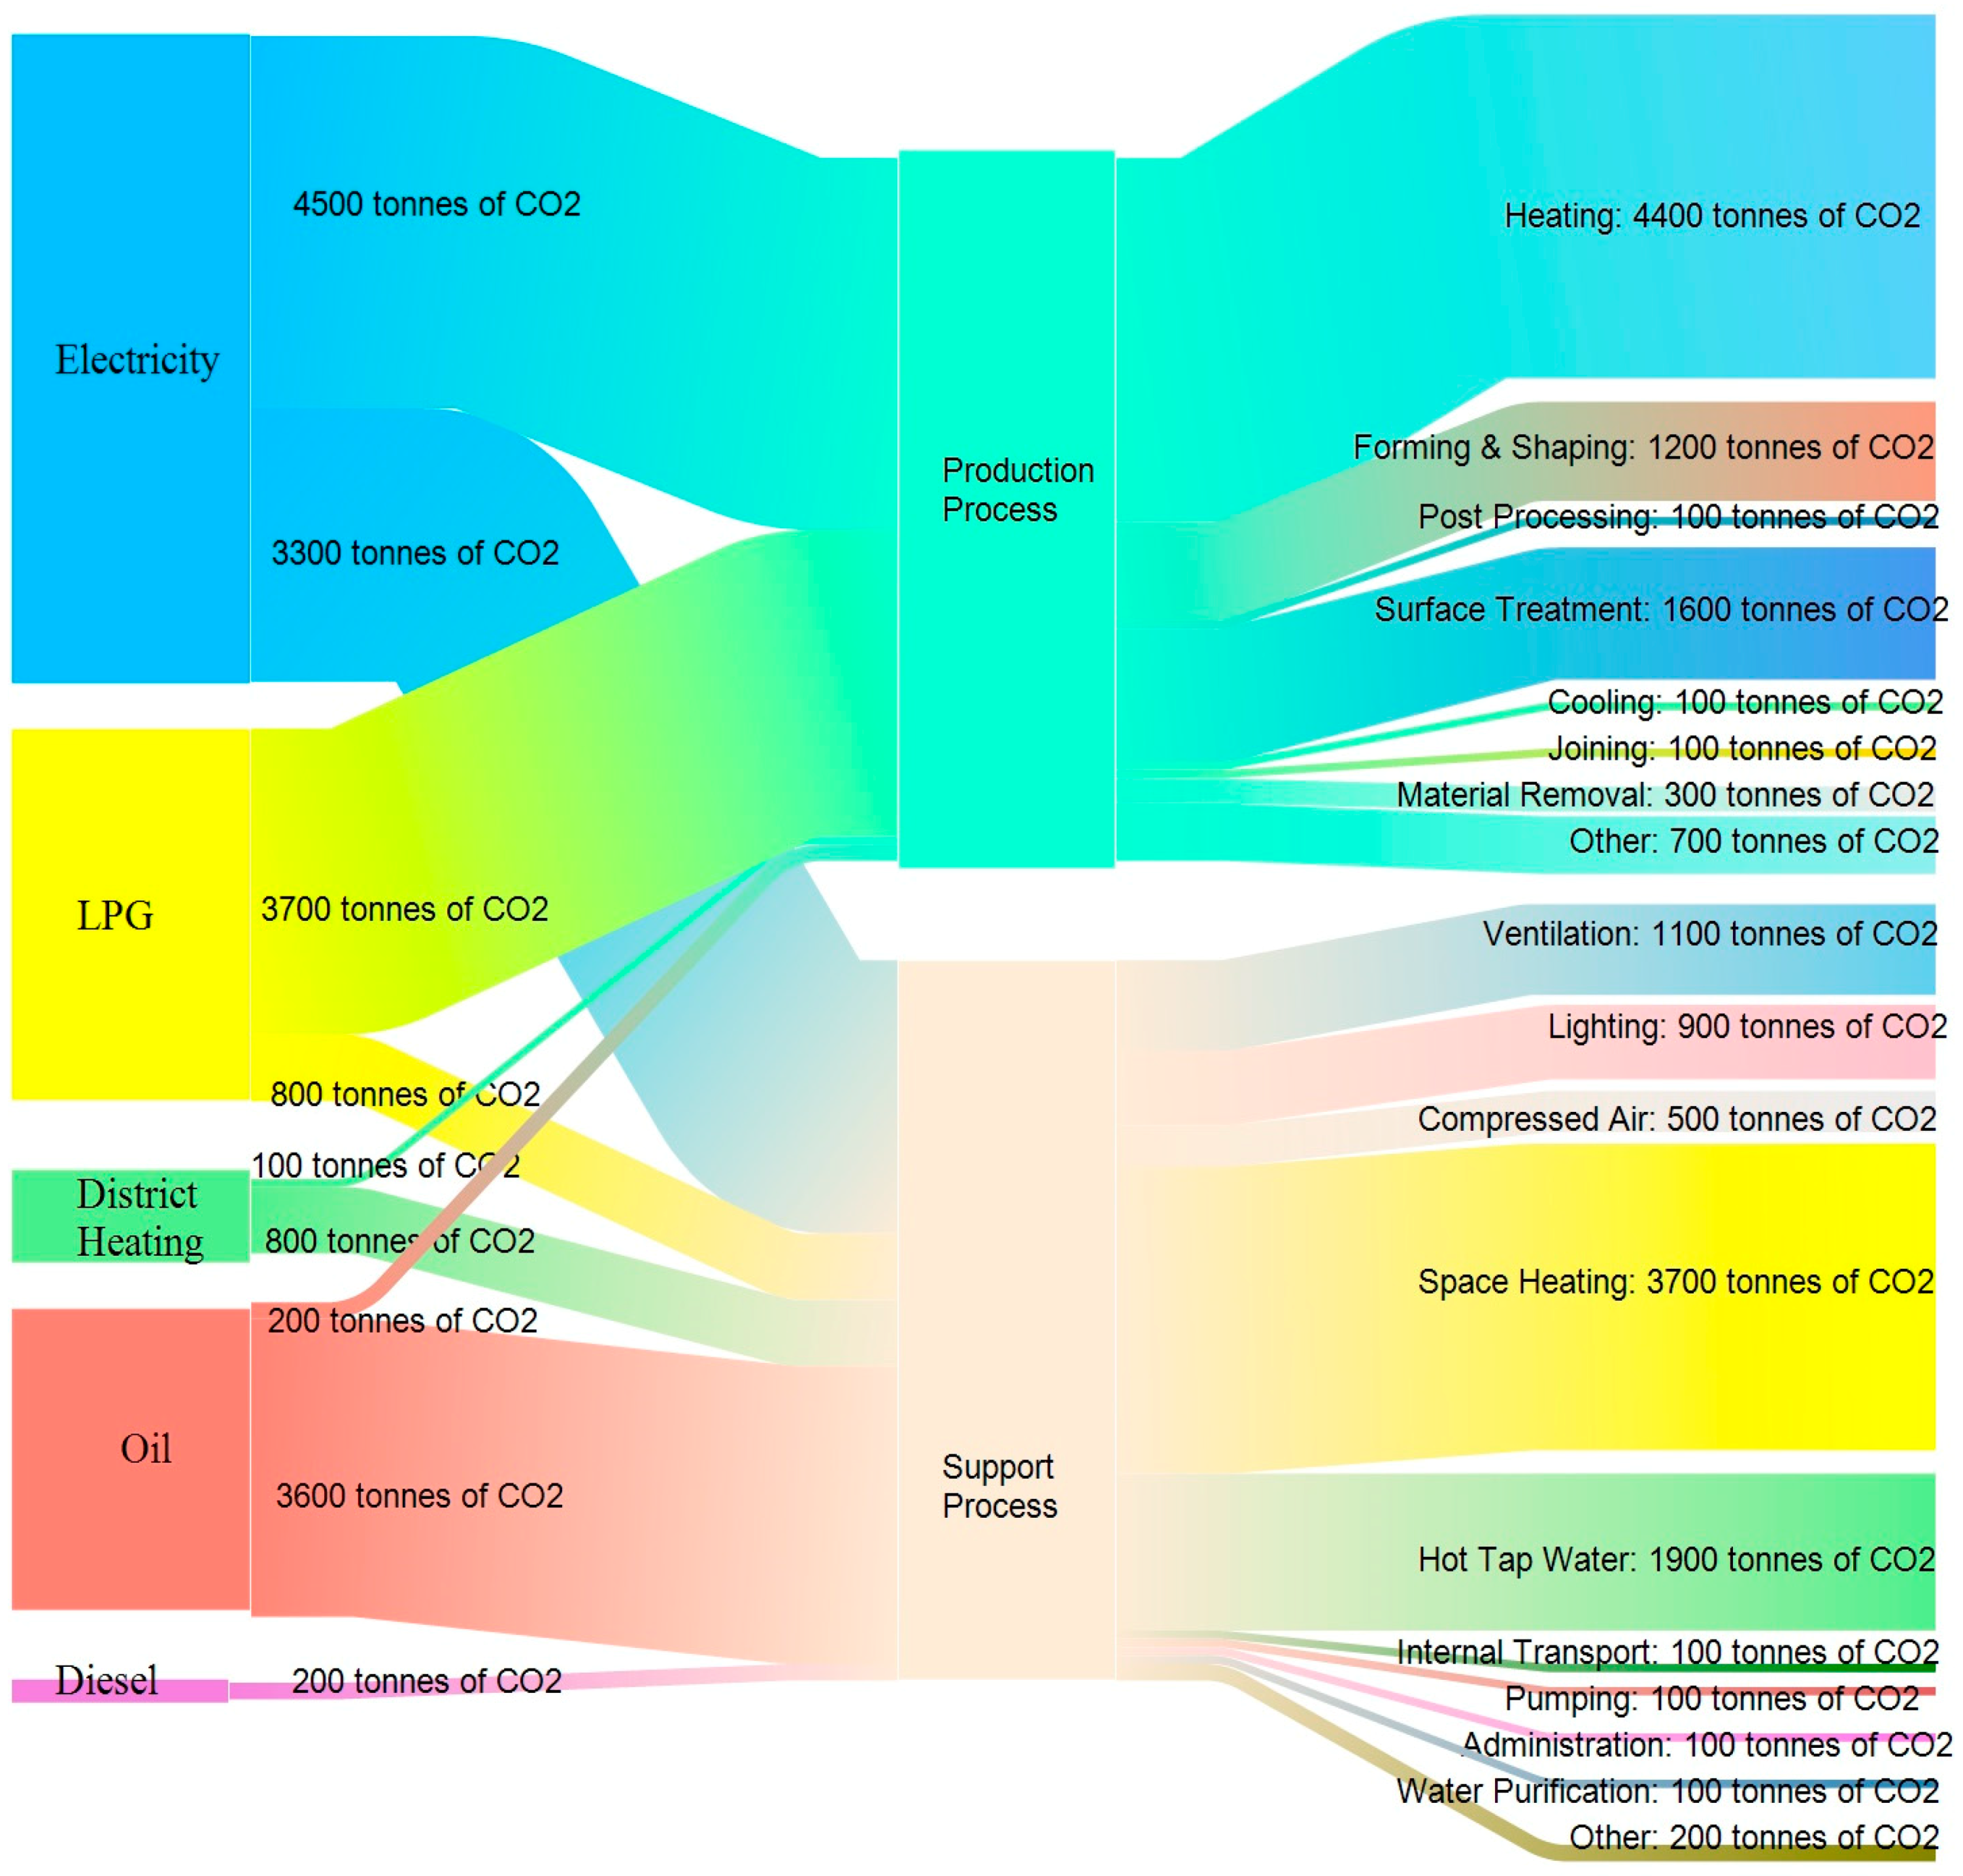
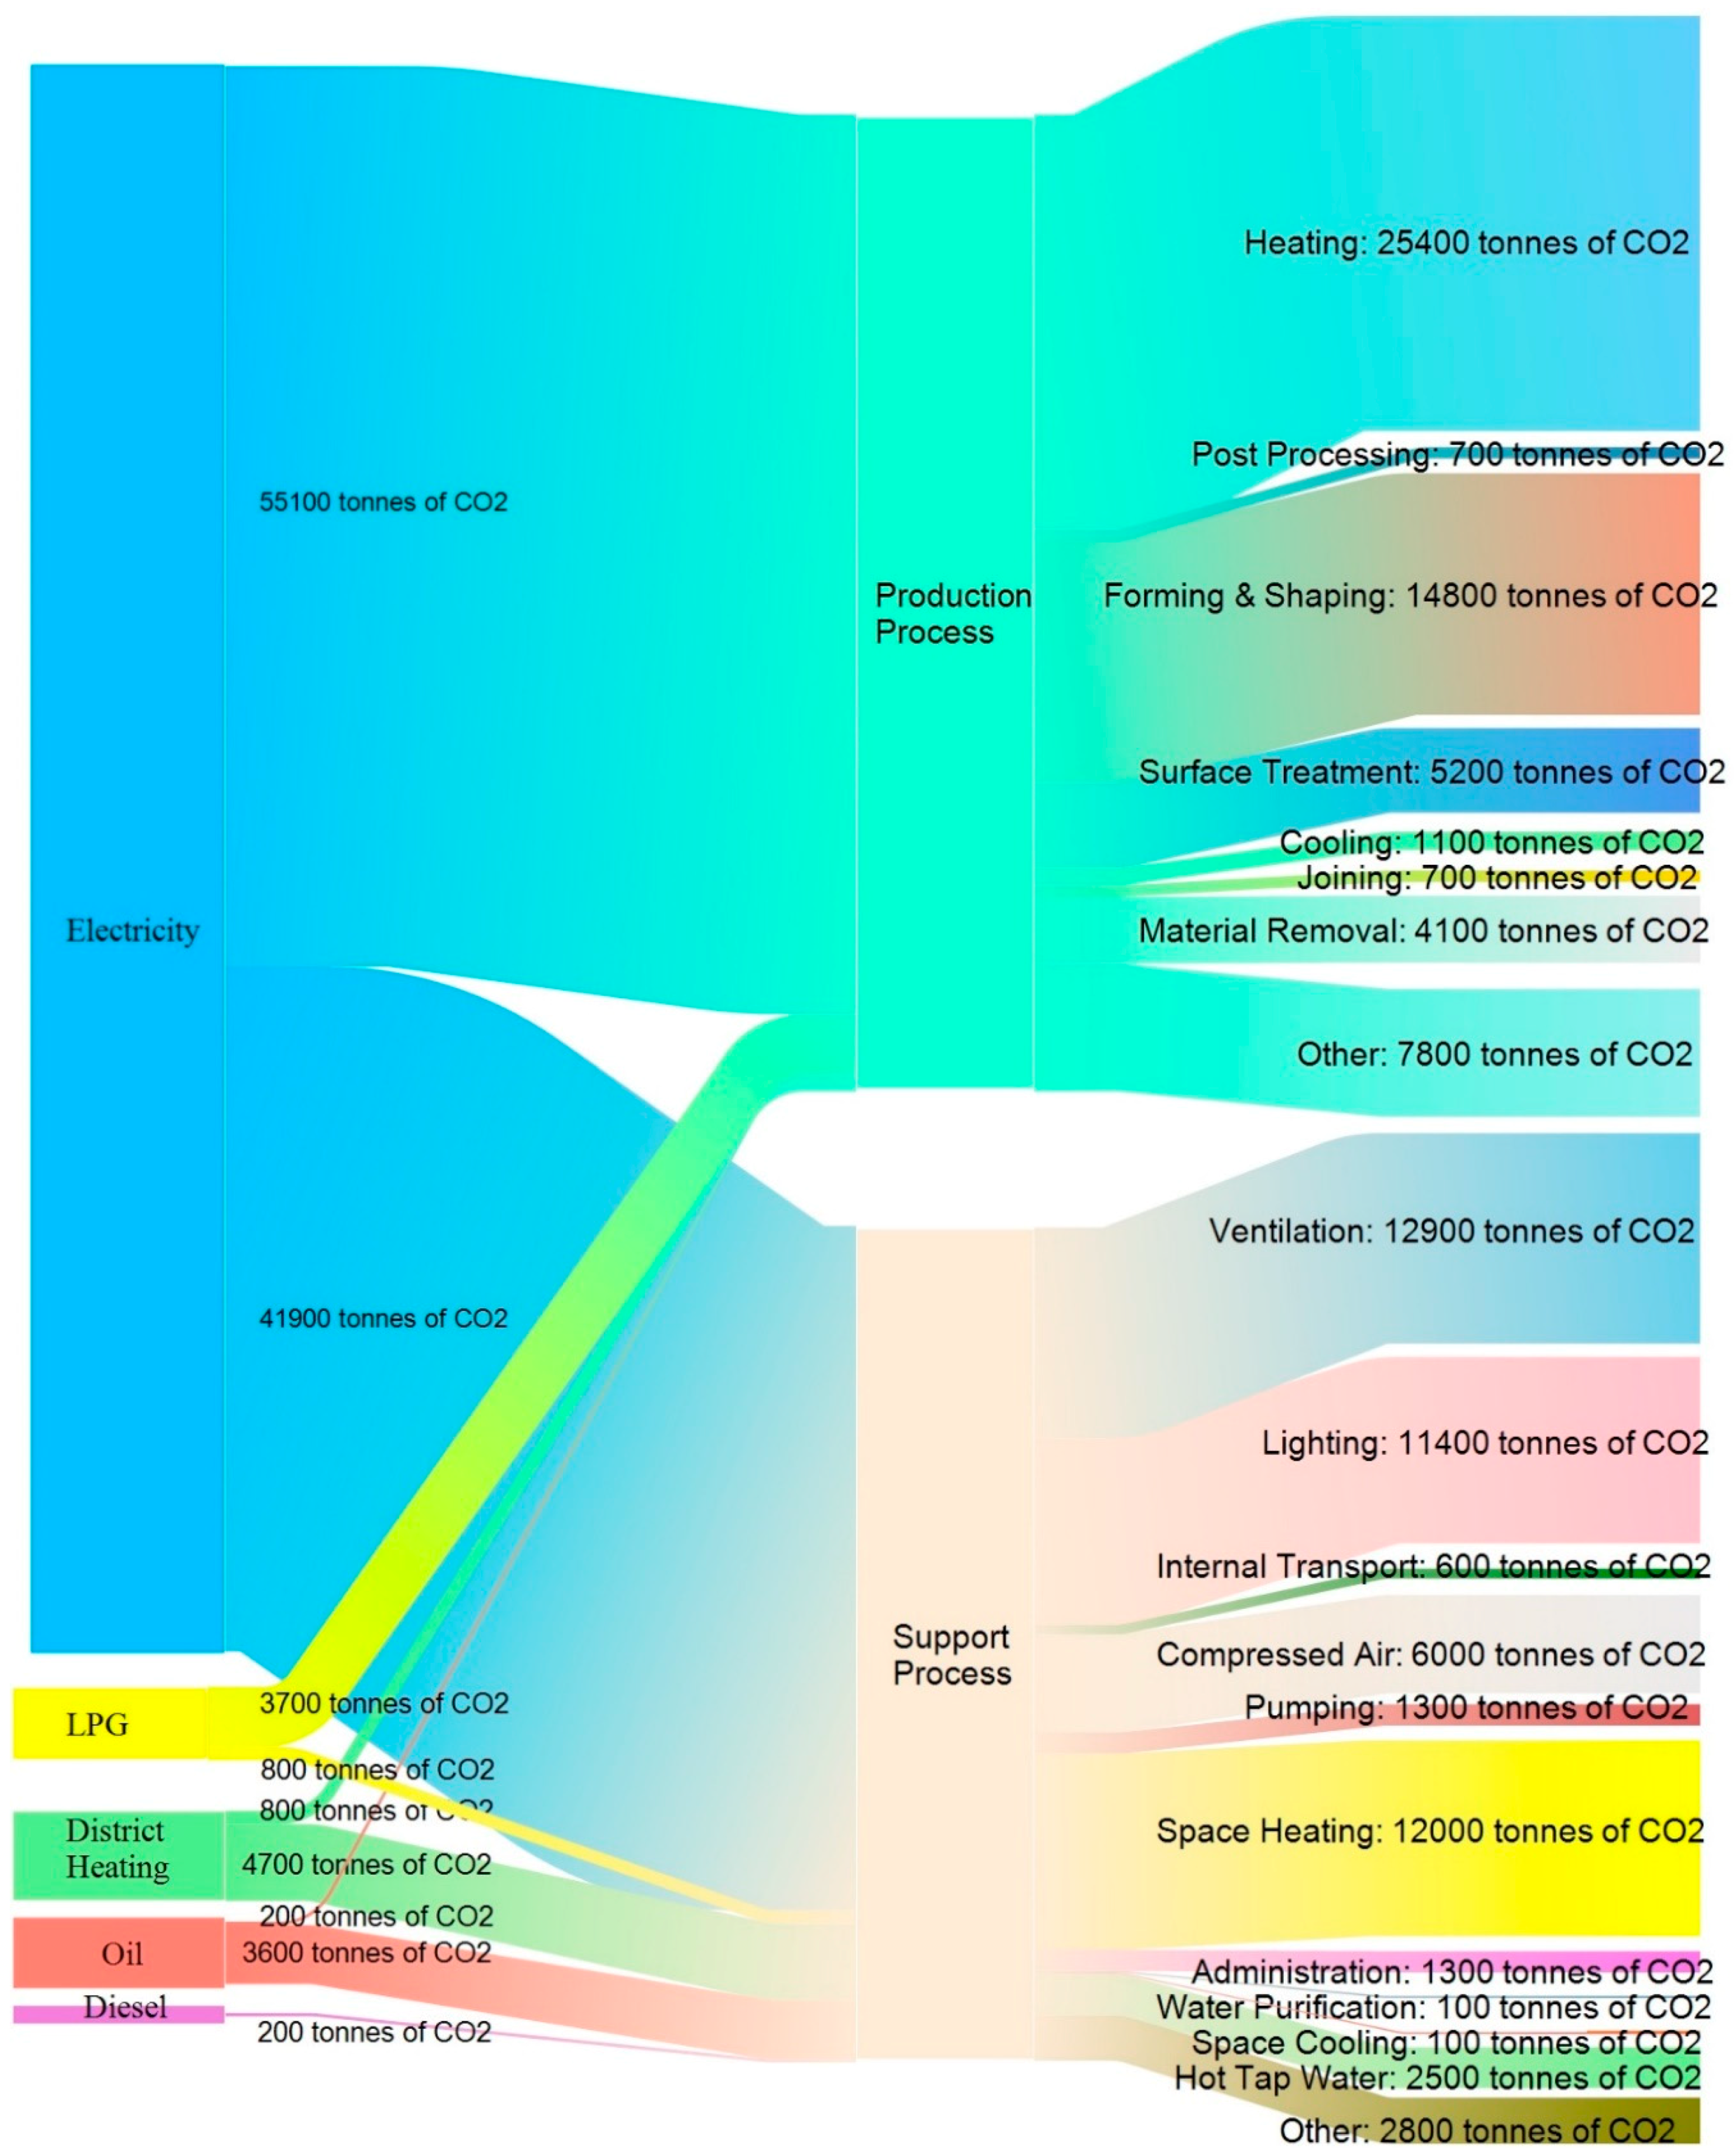
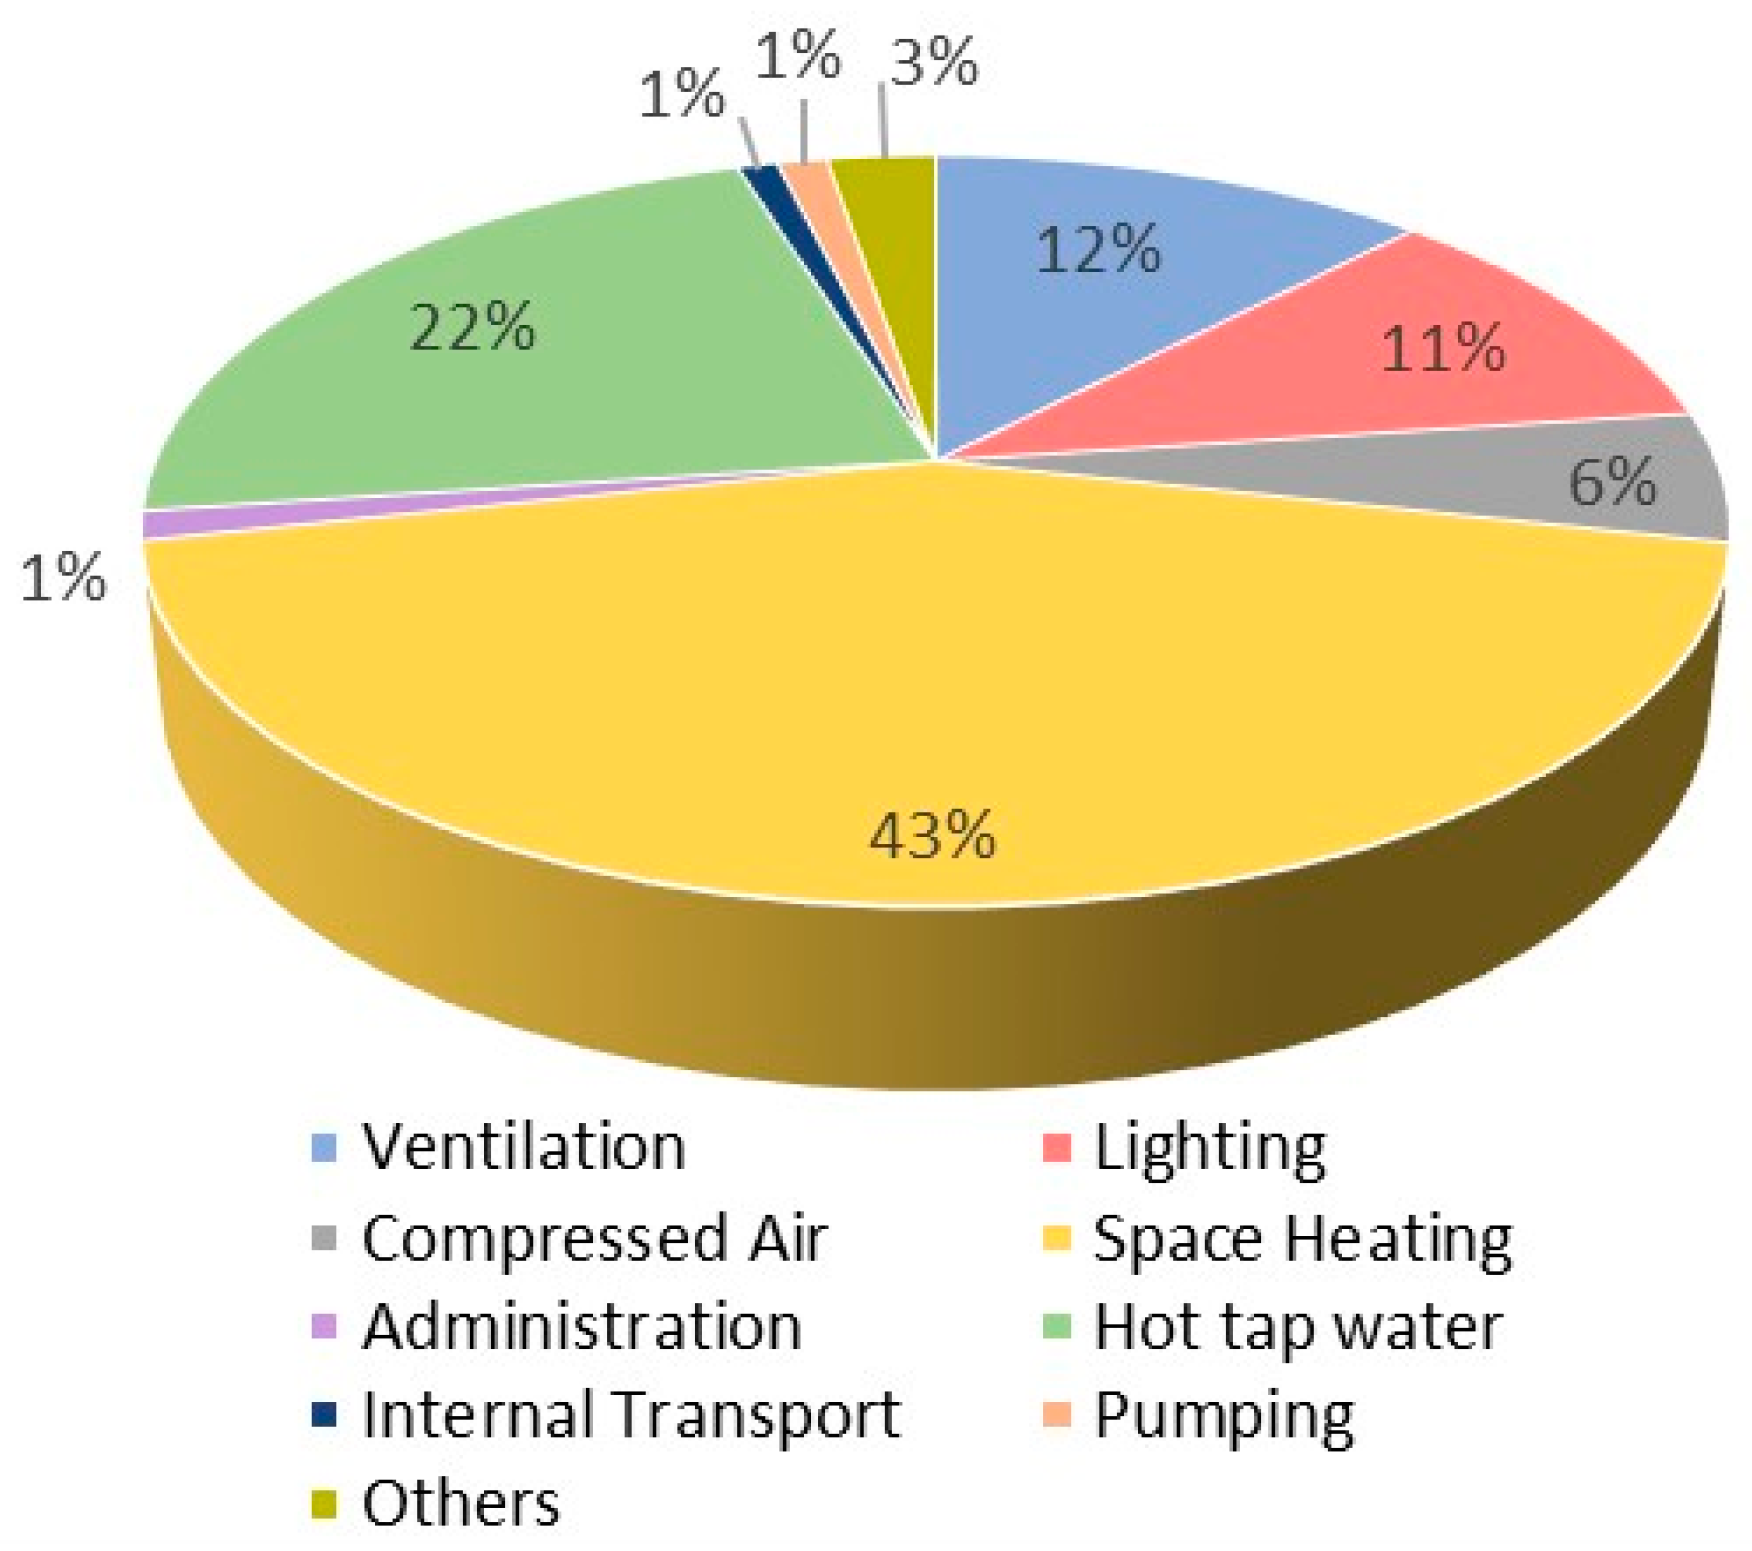
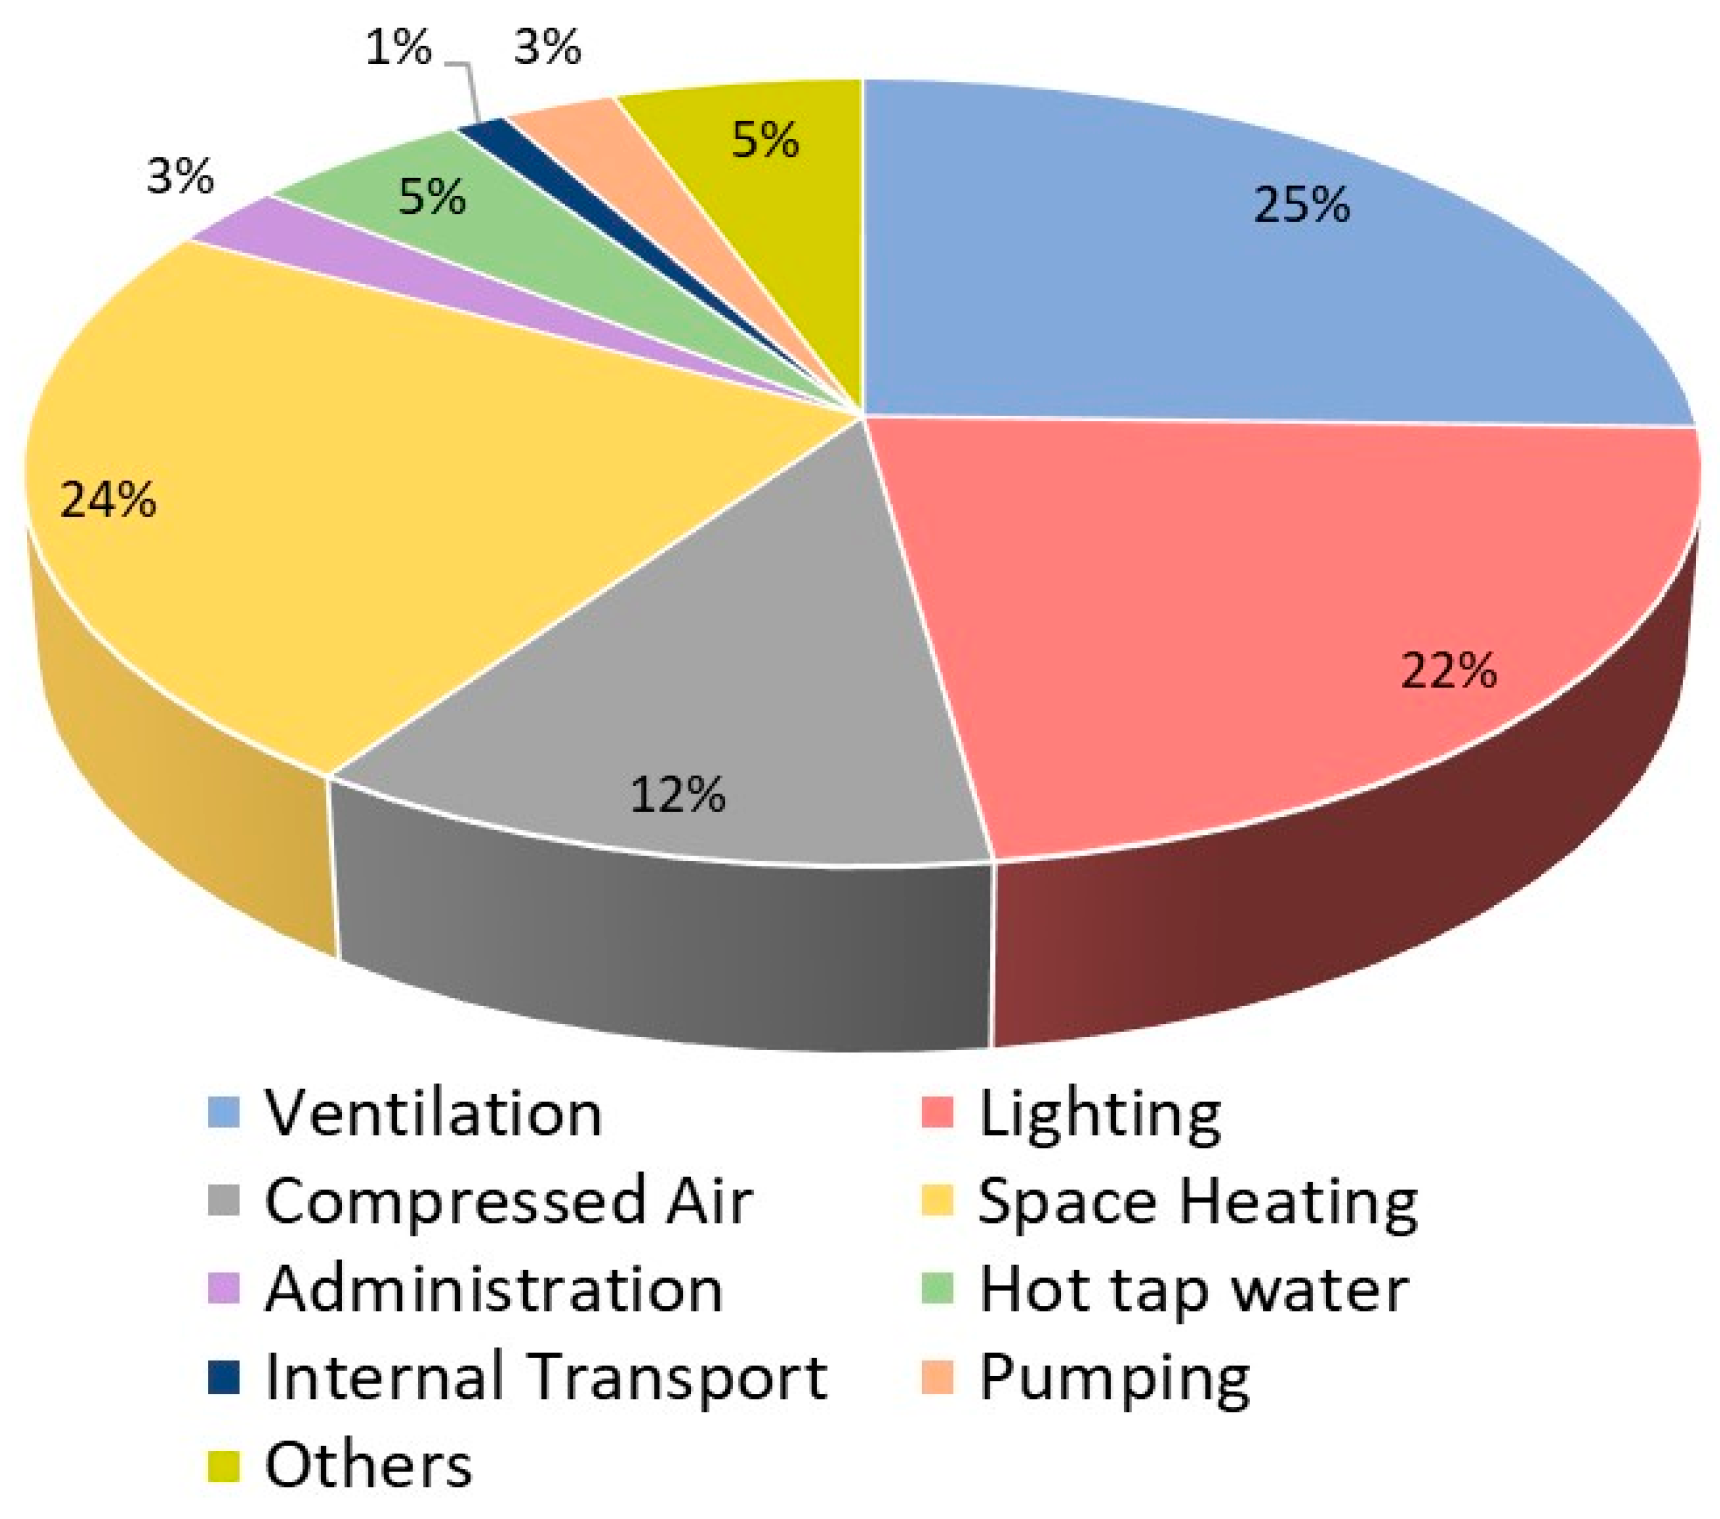
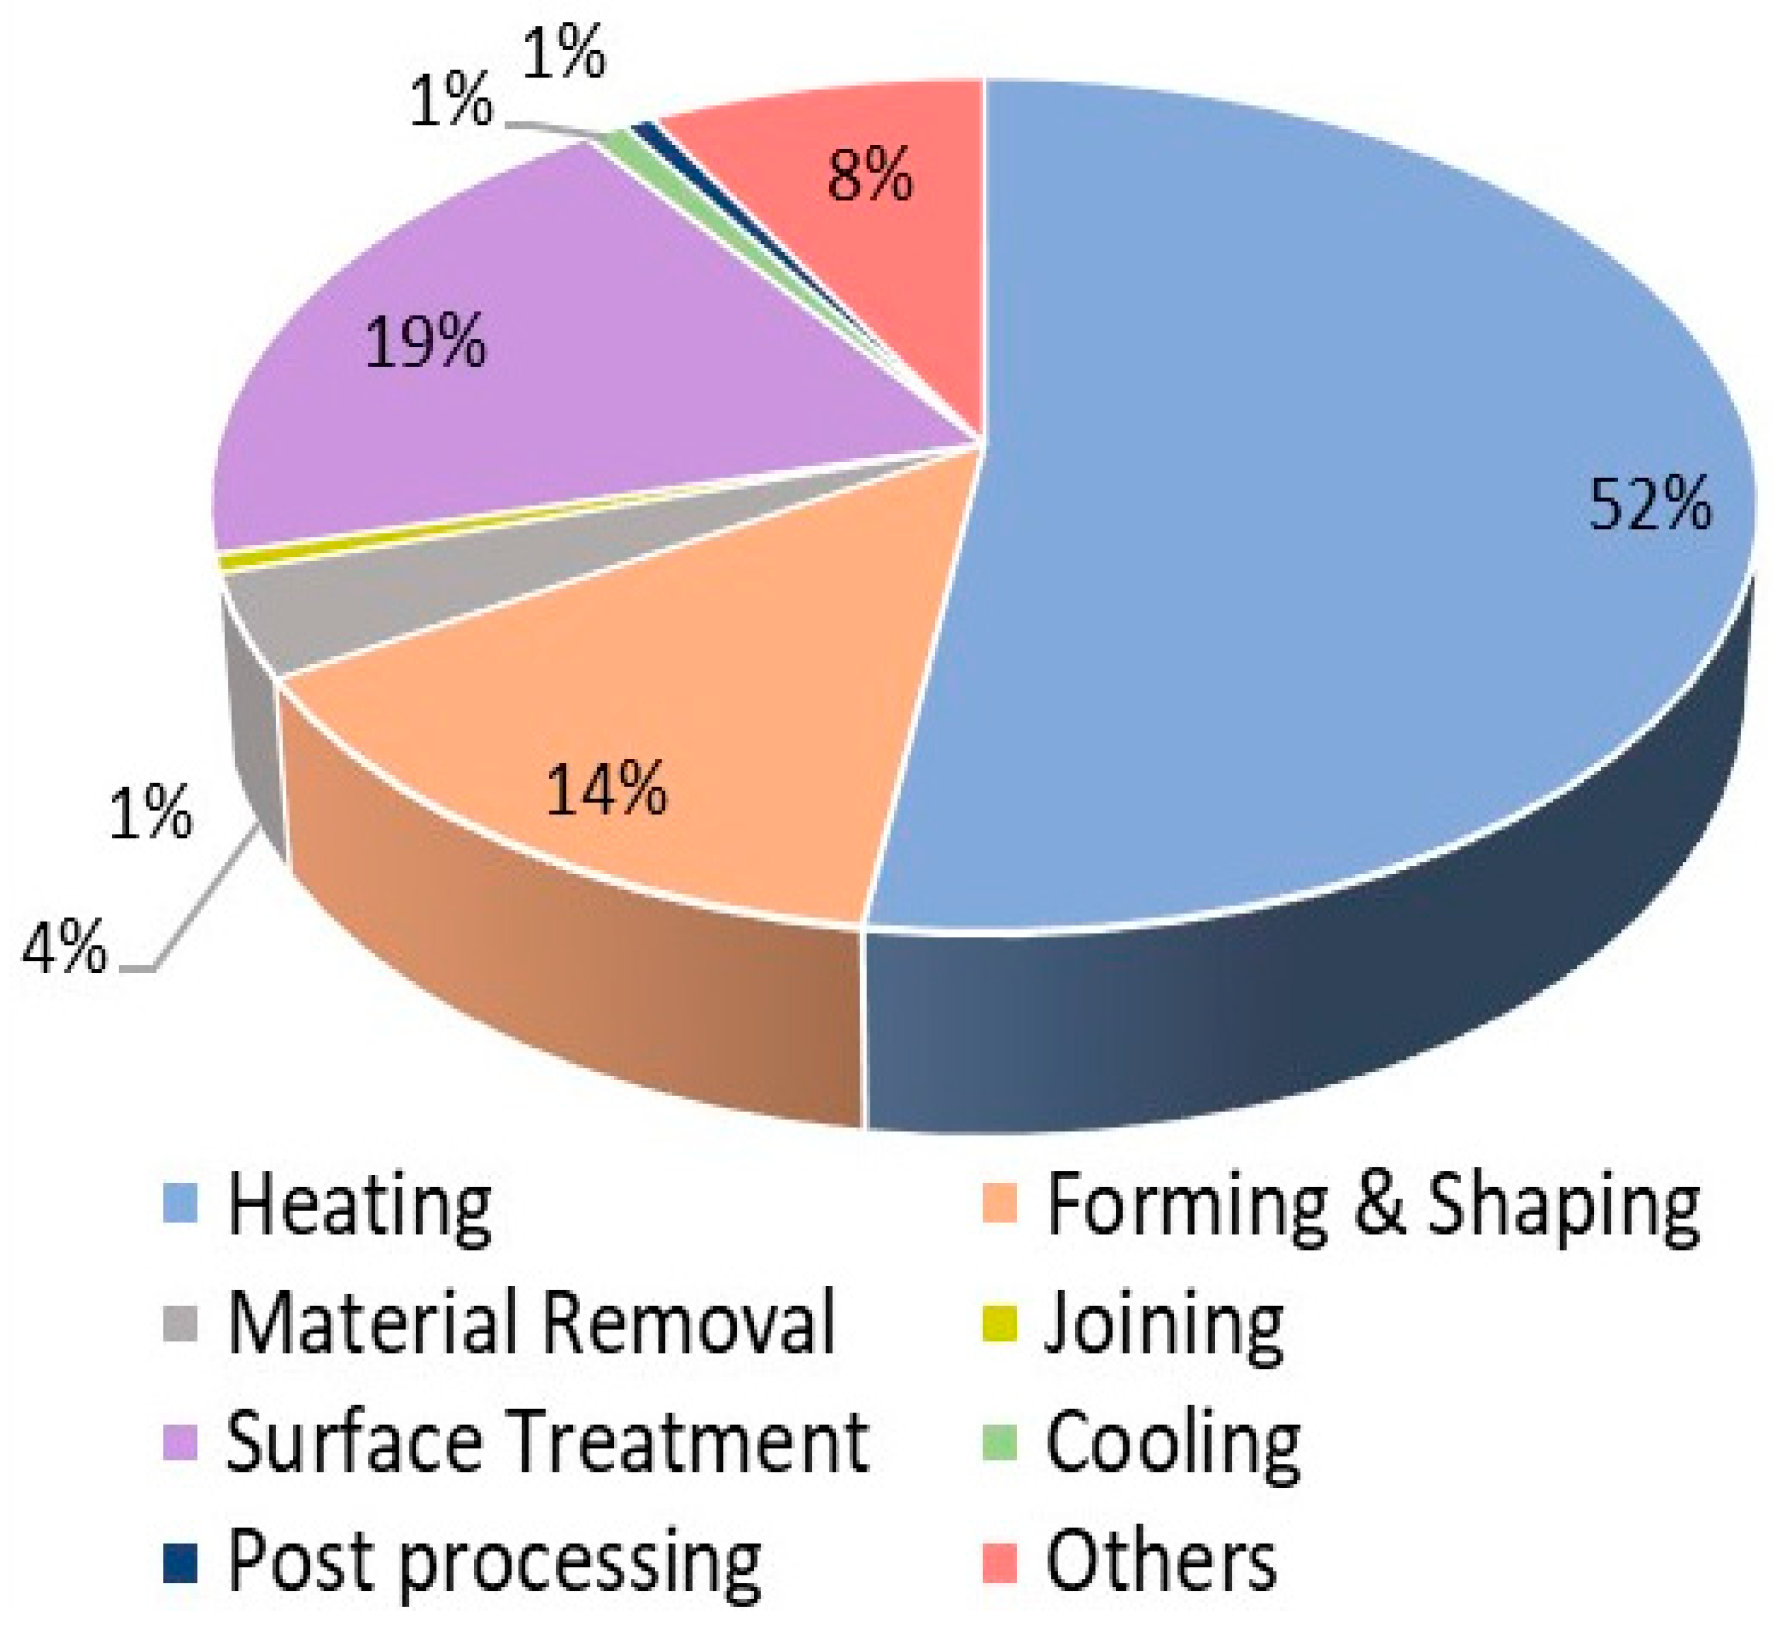
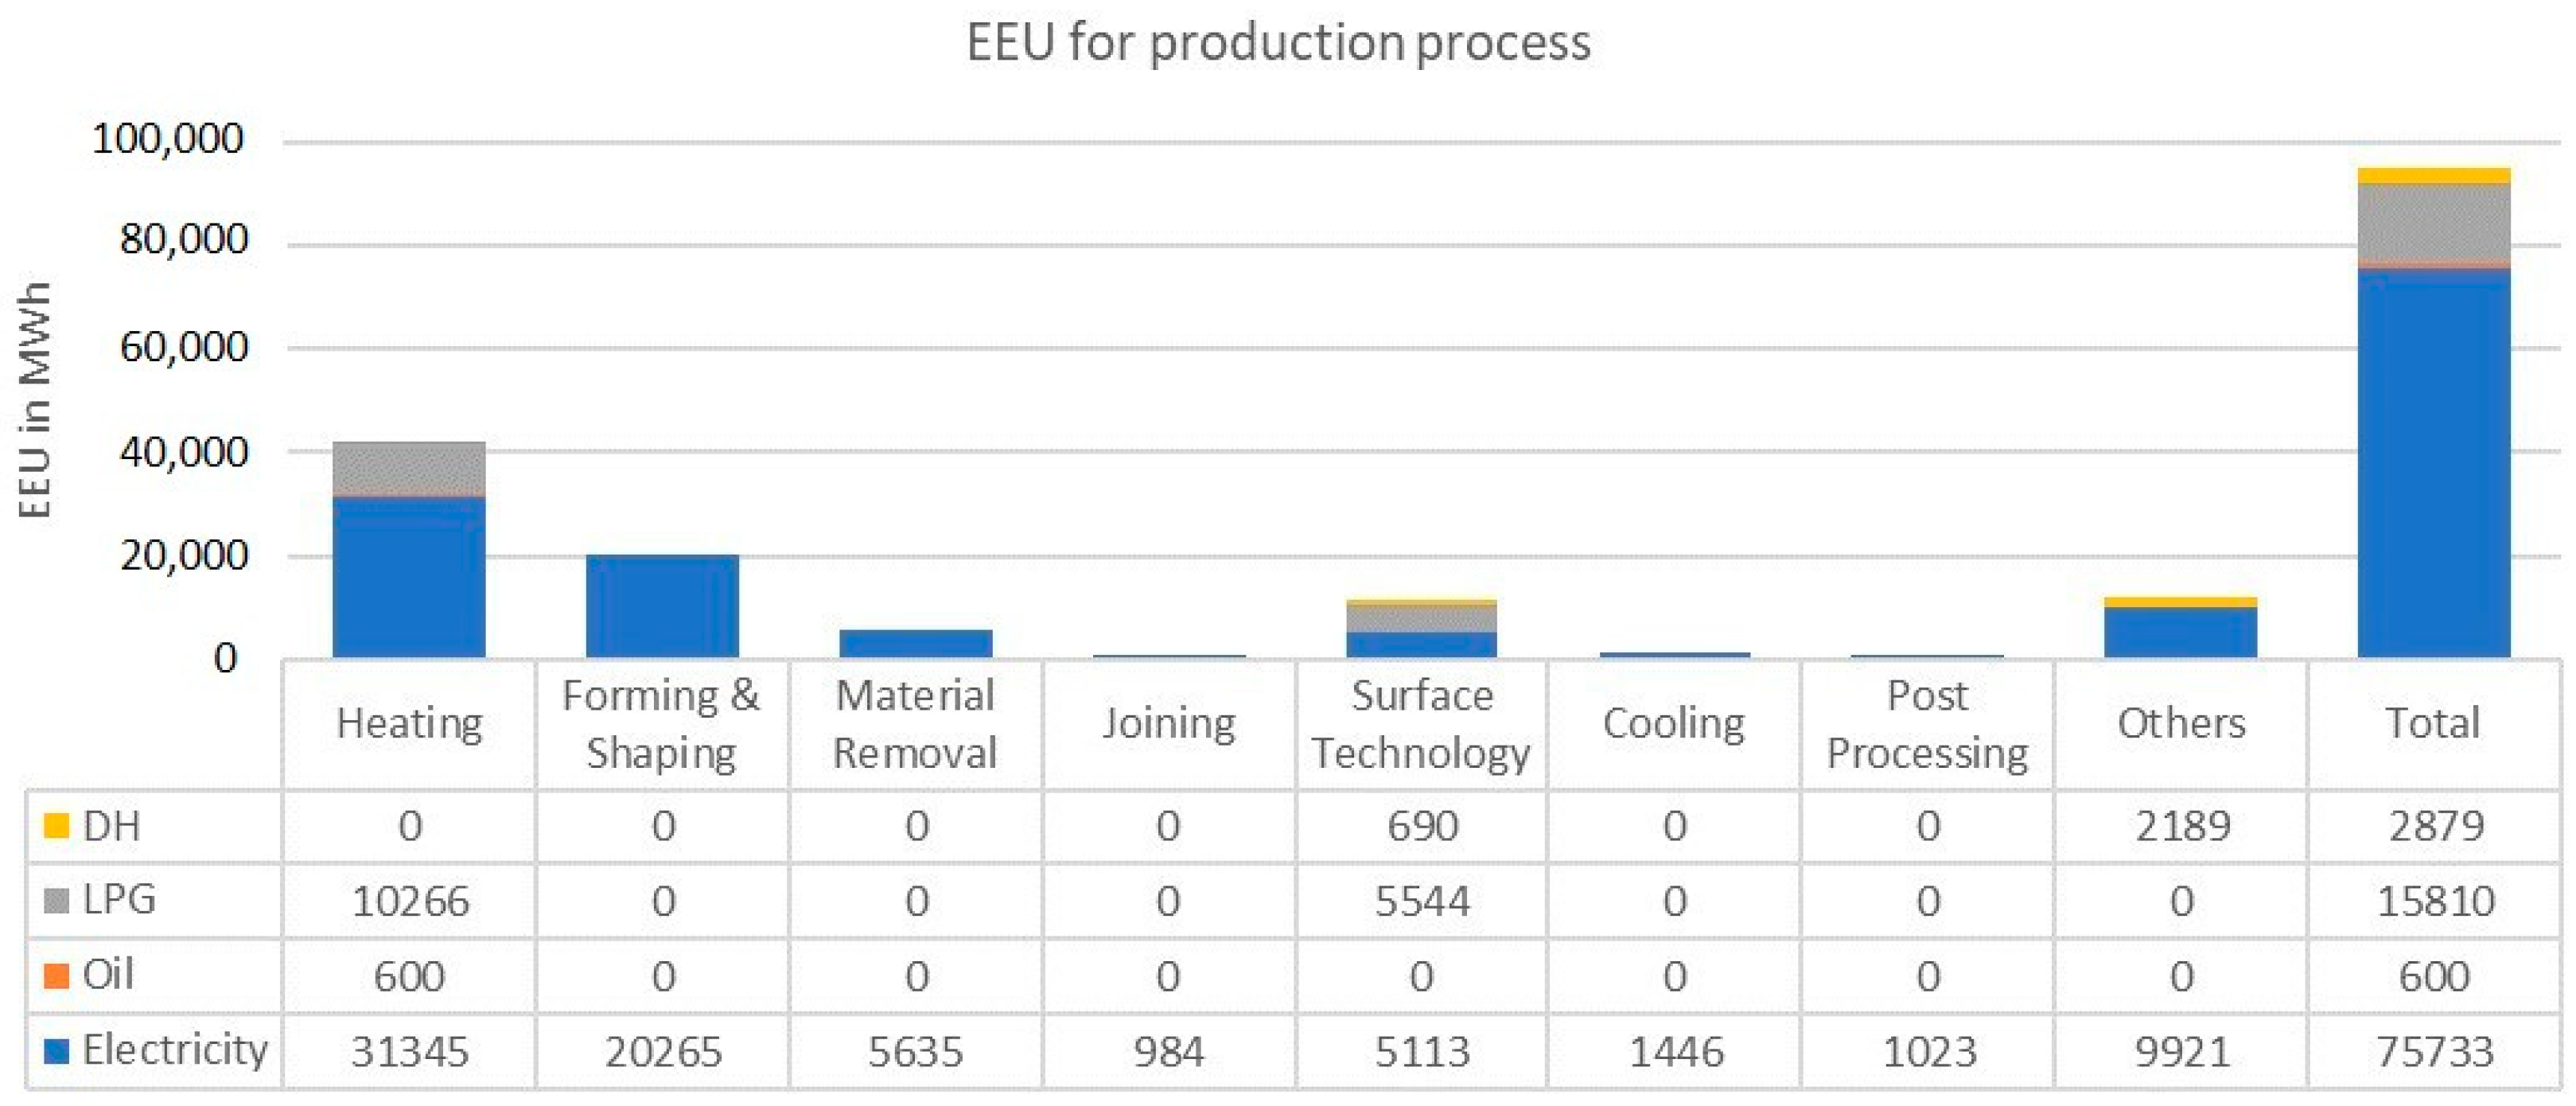
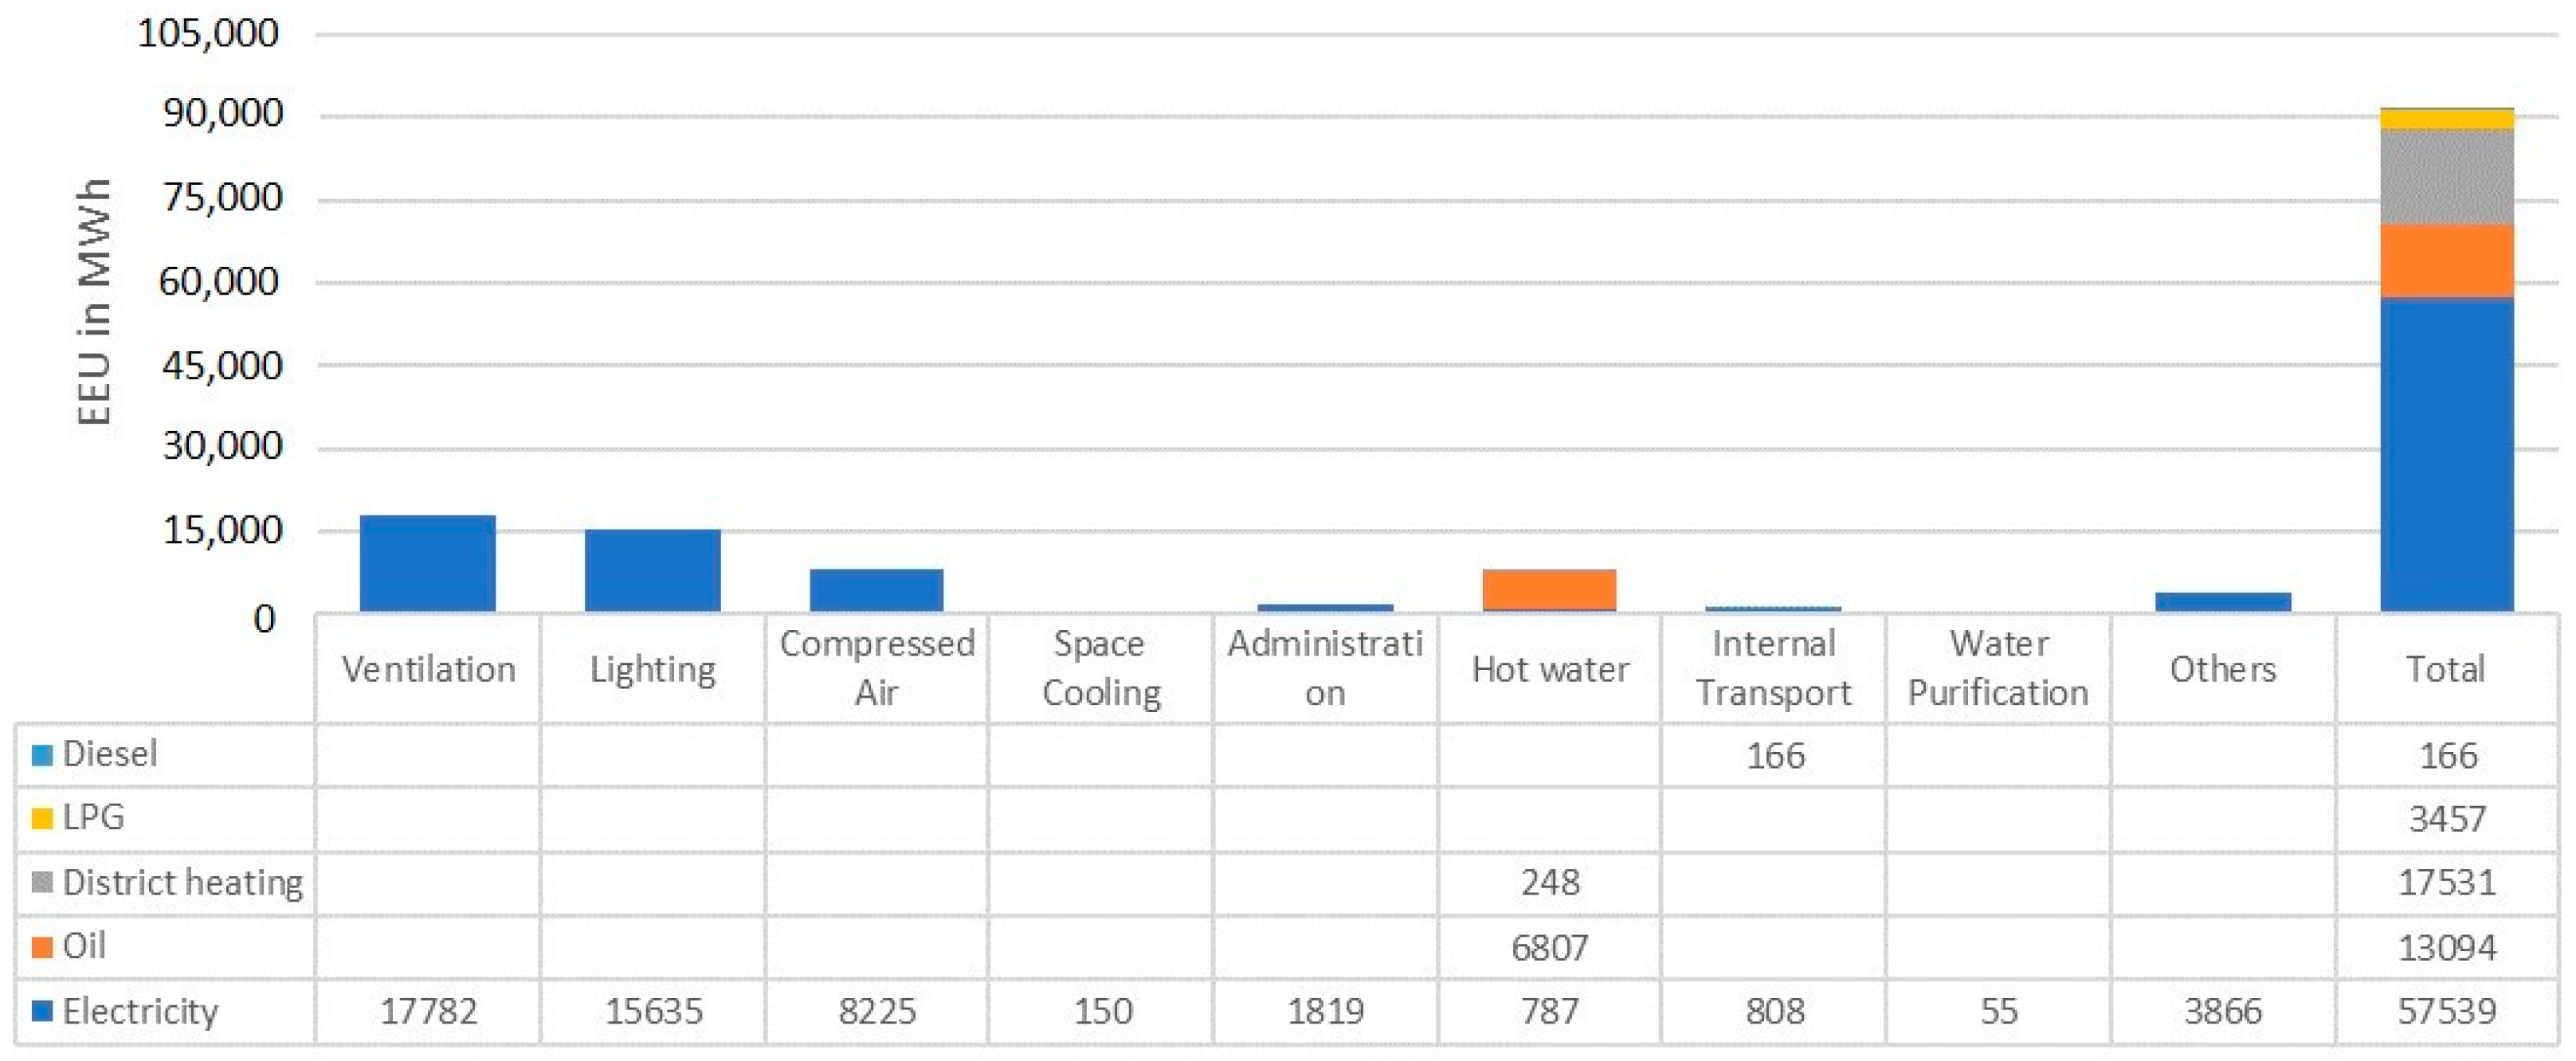
(3) The empirical analysis of energy use: The energy data from the audit reports were analyzed to understand the energy use of different processes by different energy carriers. The data were then structured as per the taxonomy developed in the first step. A bottom-up approach is used, where the energy use of the bottommost level was taken directly from the energy audit reports and then added together into the energy use of next level. The same was done to identify the energy use of higher levels. The unit used for EEU was MWh/year.
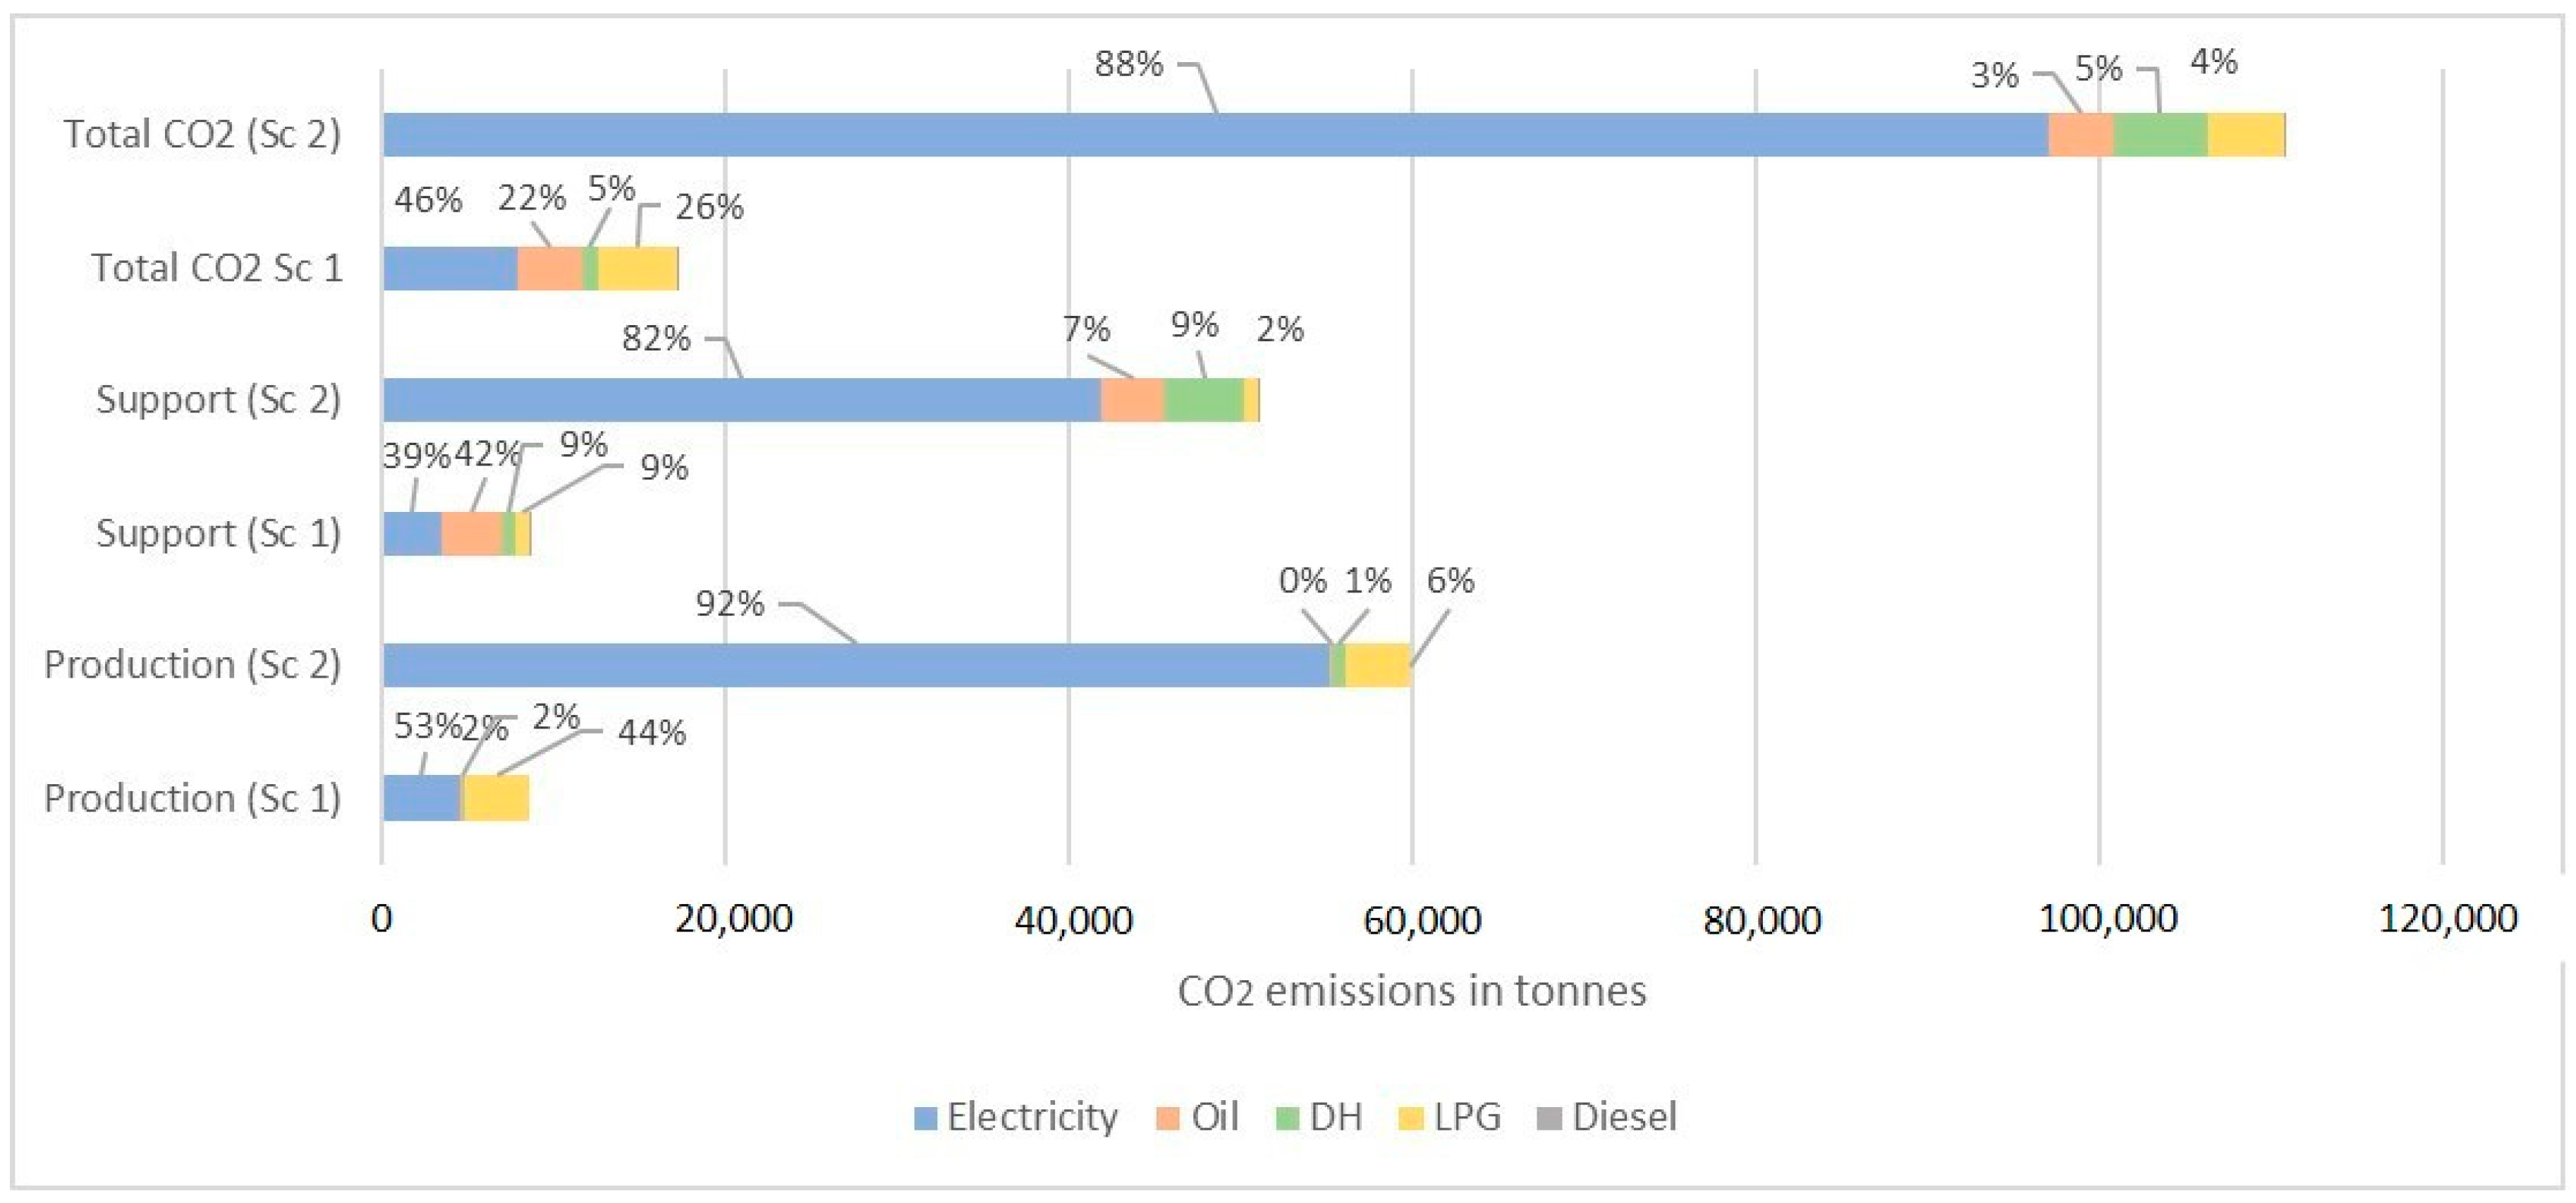
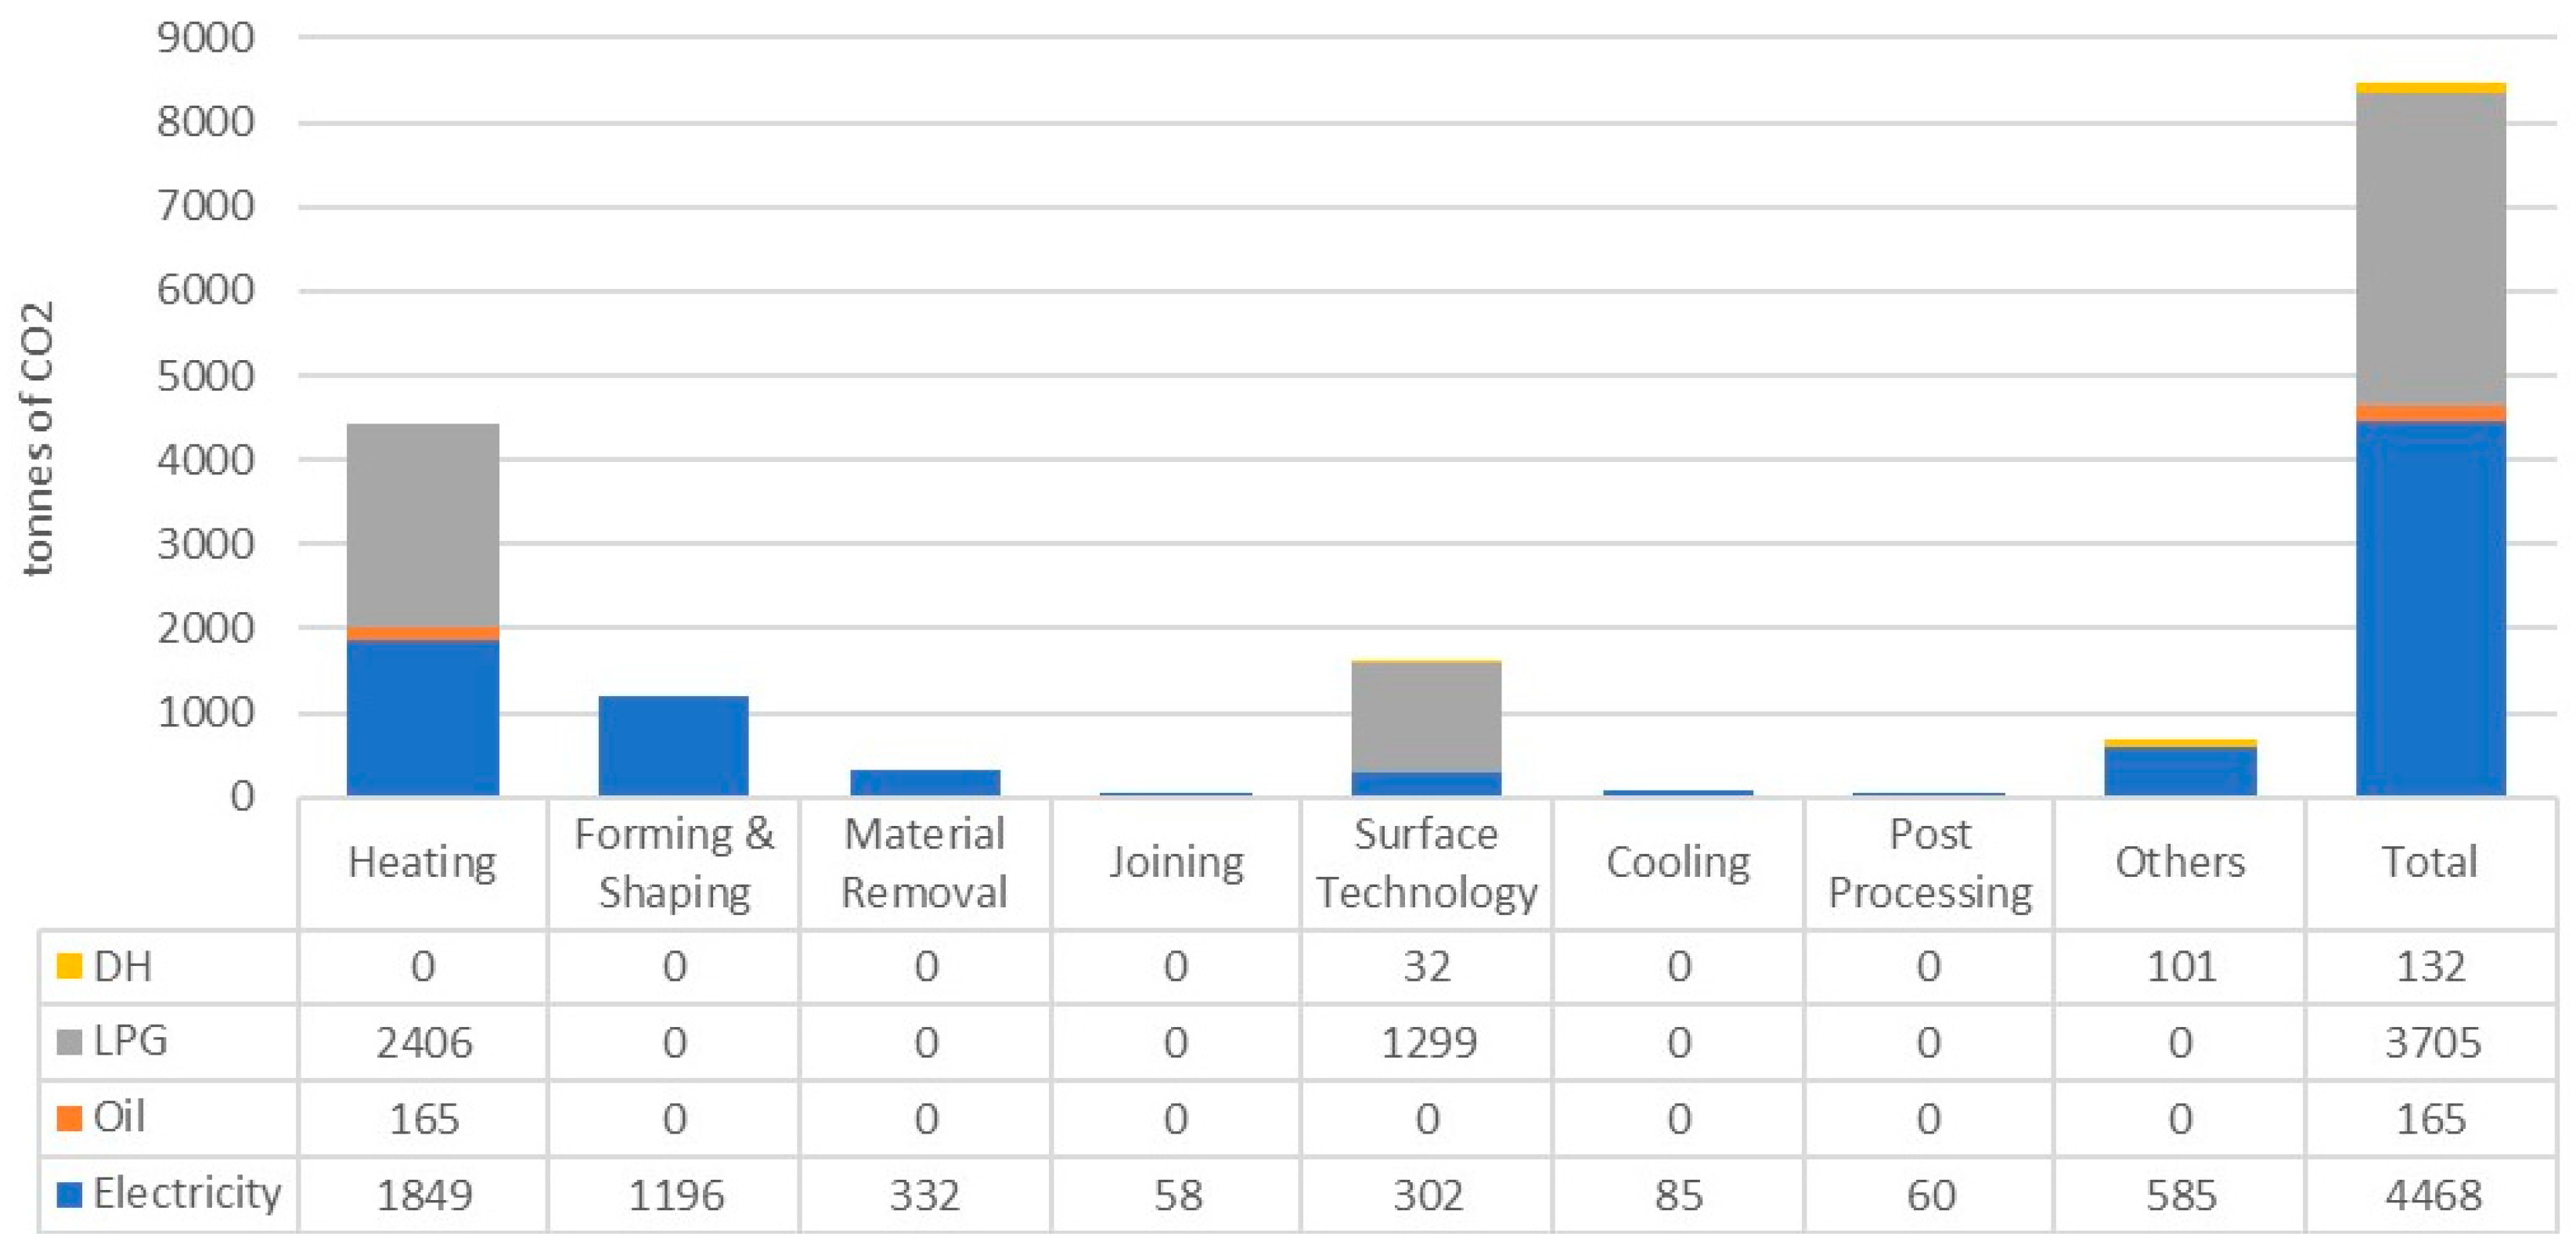
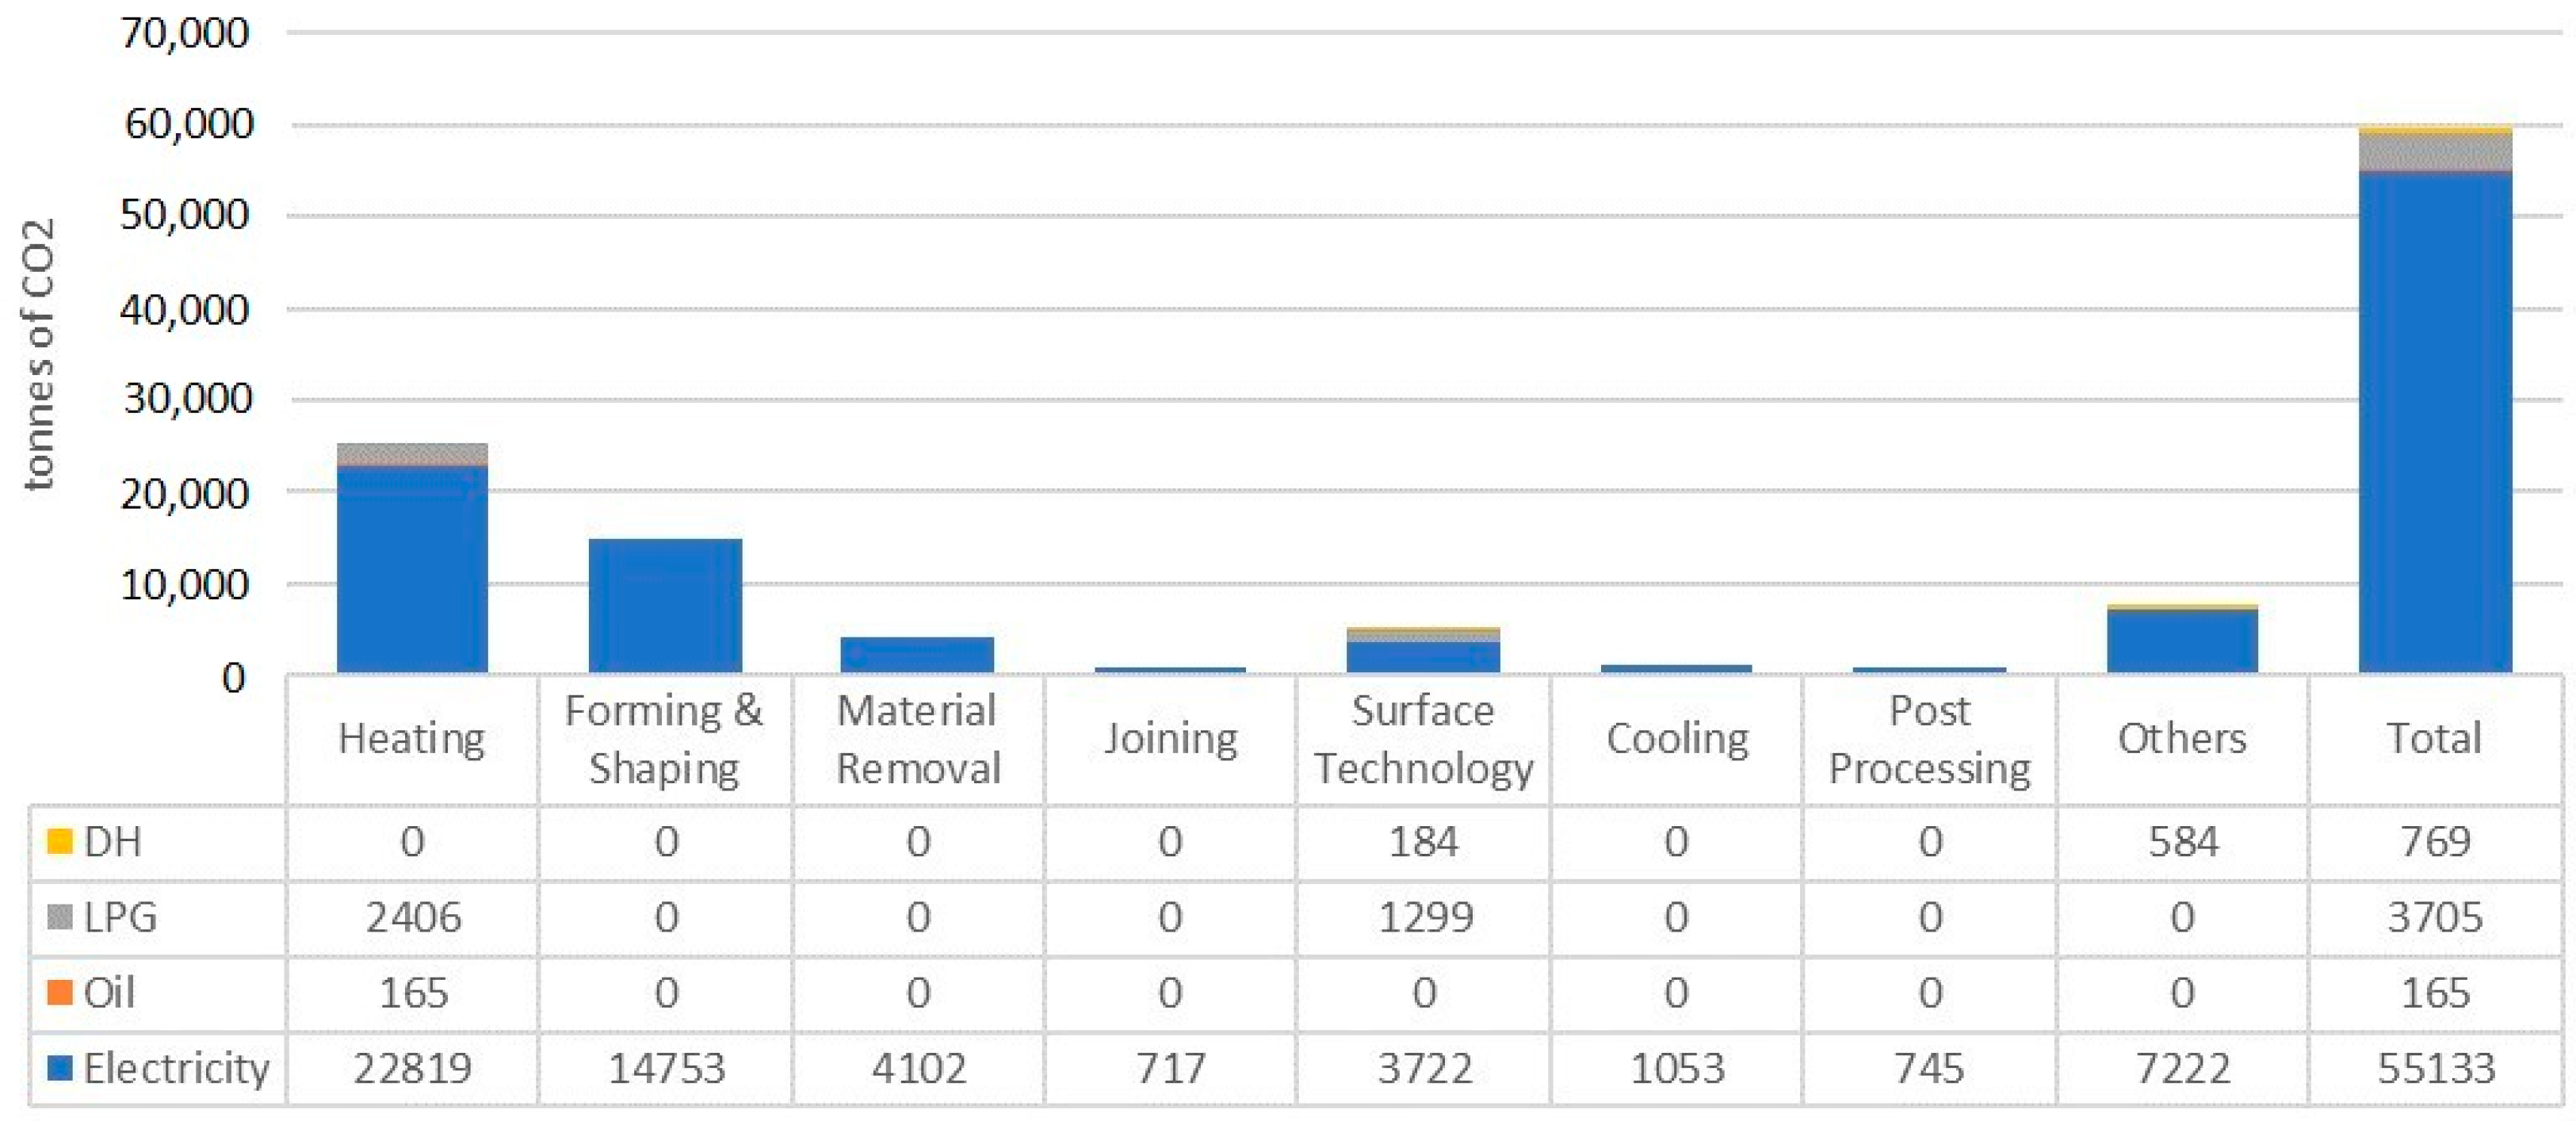
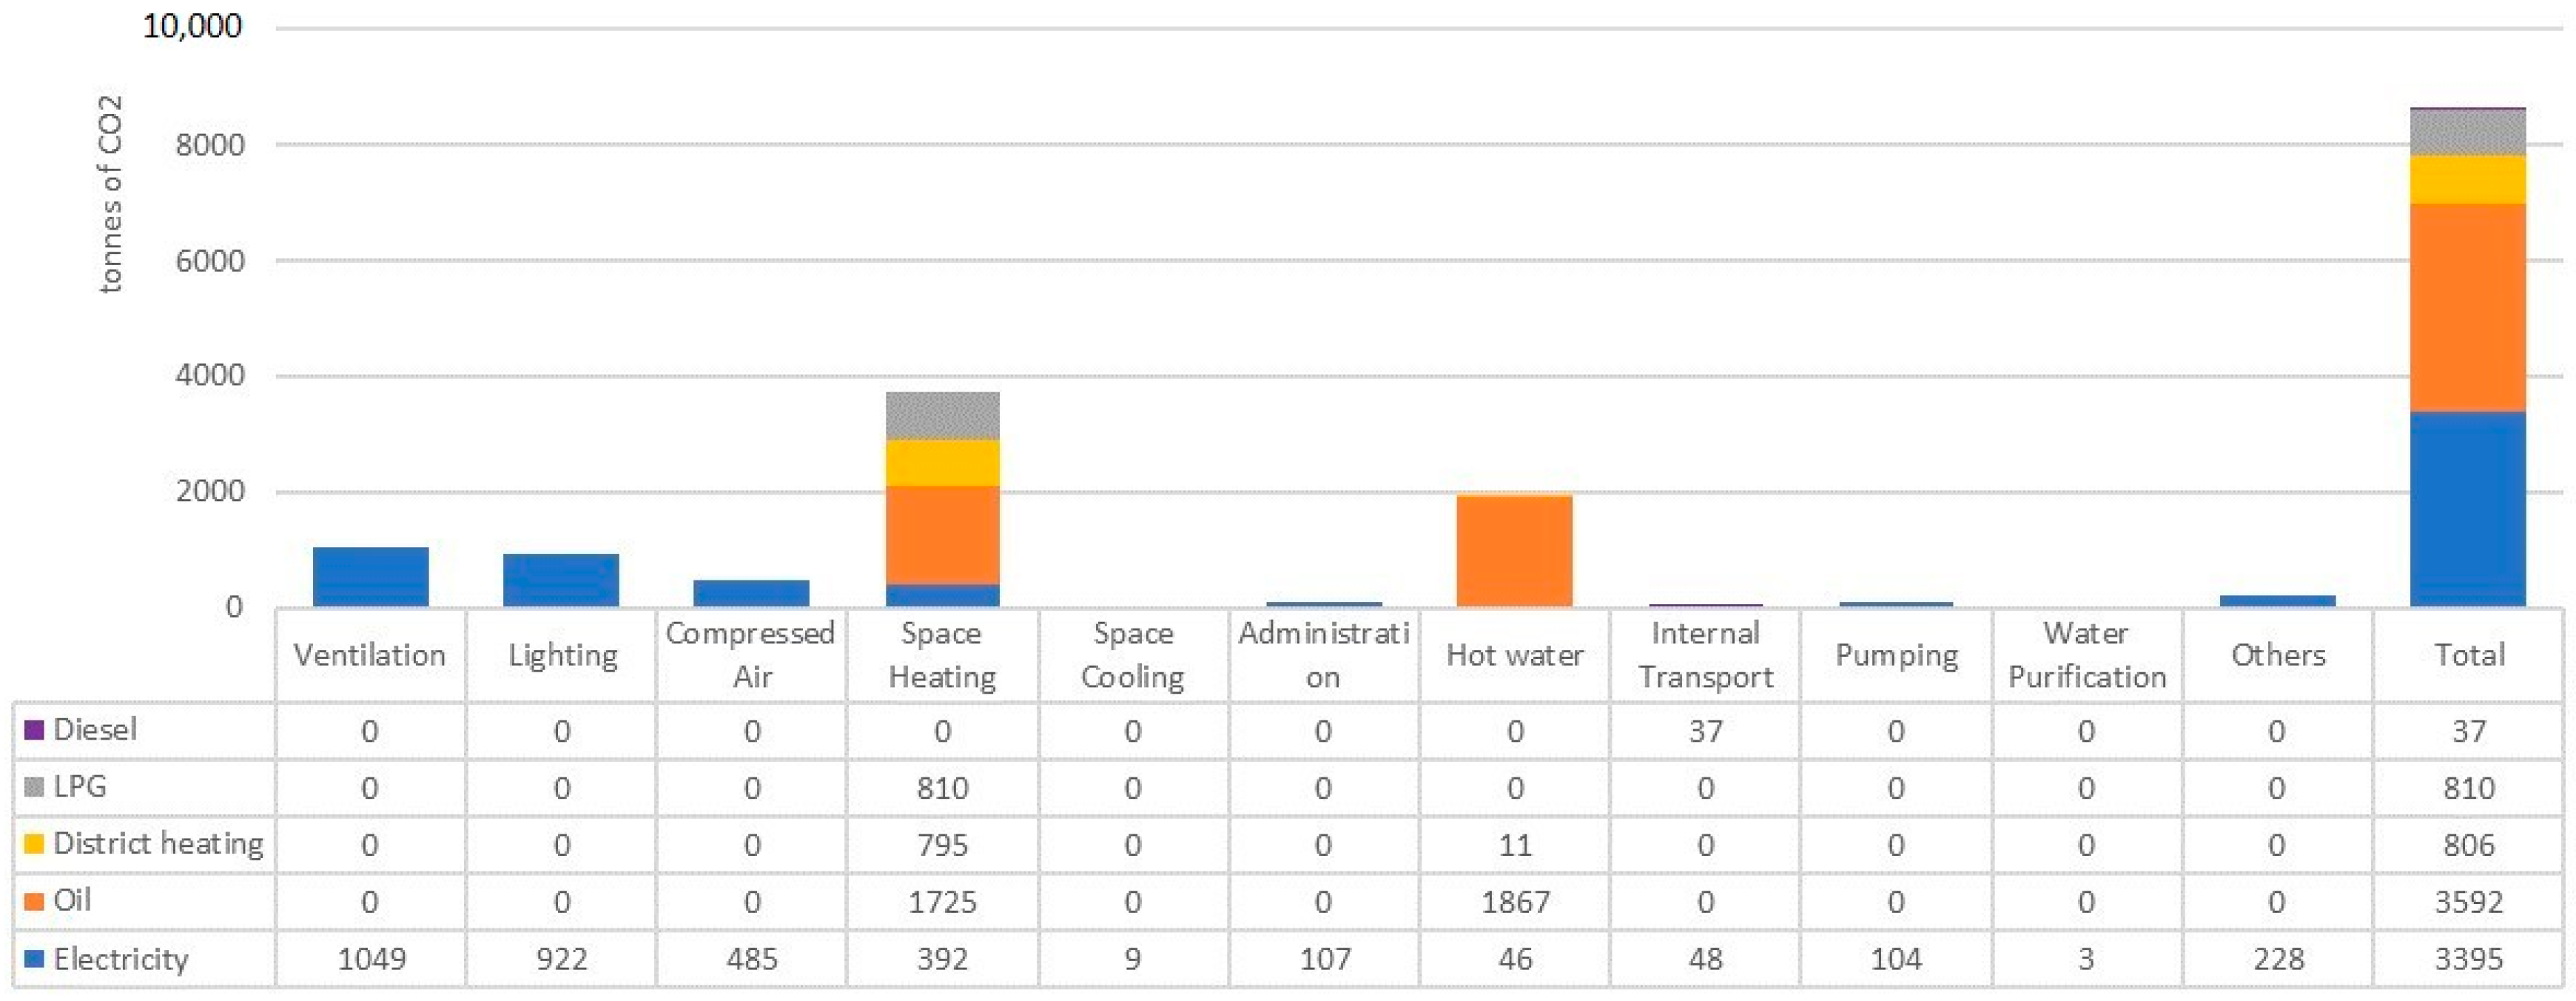
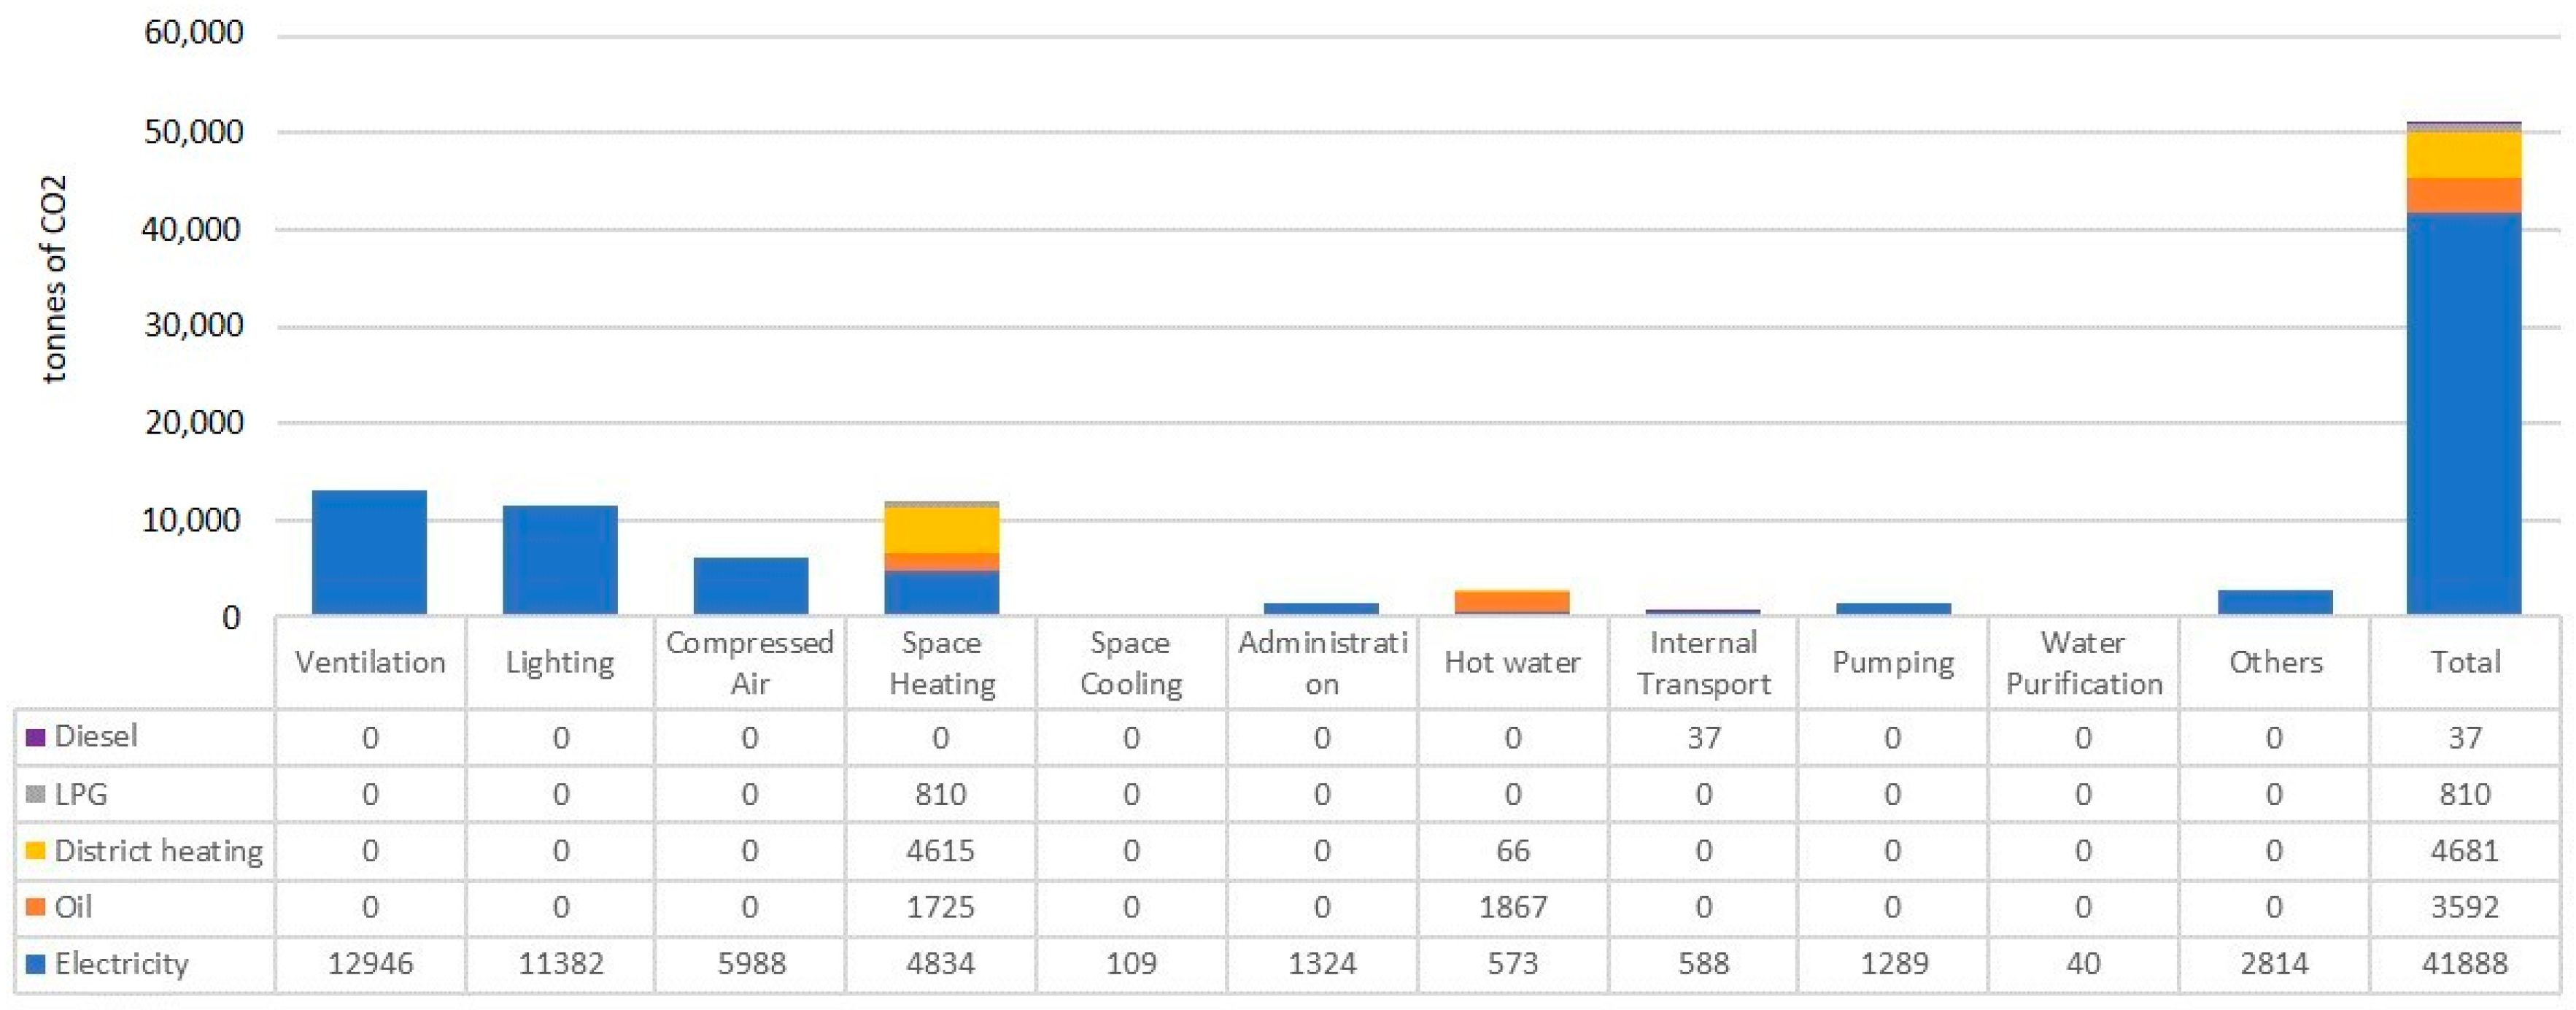
(4) Calculation of CO2 emissions: The CO2 emissions of the processes were calculated by multiplying the EEU of the specific energy carrier for the process with the emission factor (kg/MWh) of the energy carrier and summing up the emissions from each carrier using the Equation (1).
A n n u a l   C O 2   e m i s s i o n = n = 1 x ( E E U n ) E F n
Equation (1). Emission calculation (n: energy carrier, EEUn: energy end-use of carrier n, EFn: emission factor of carrier n).
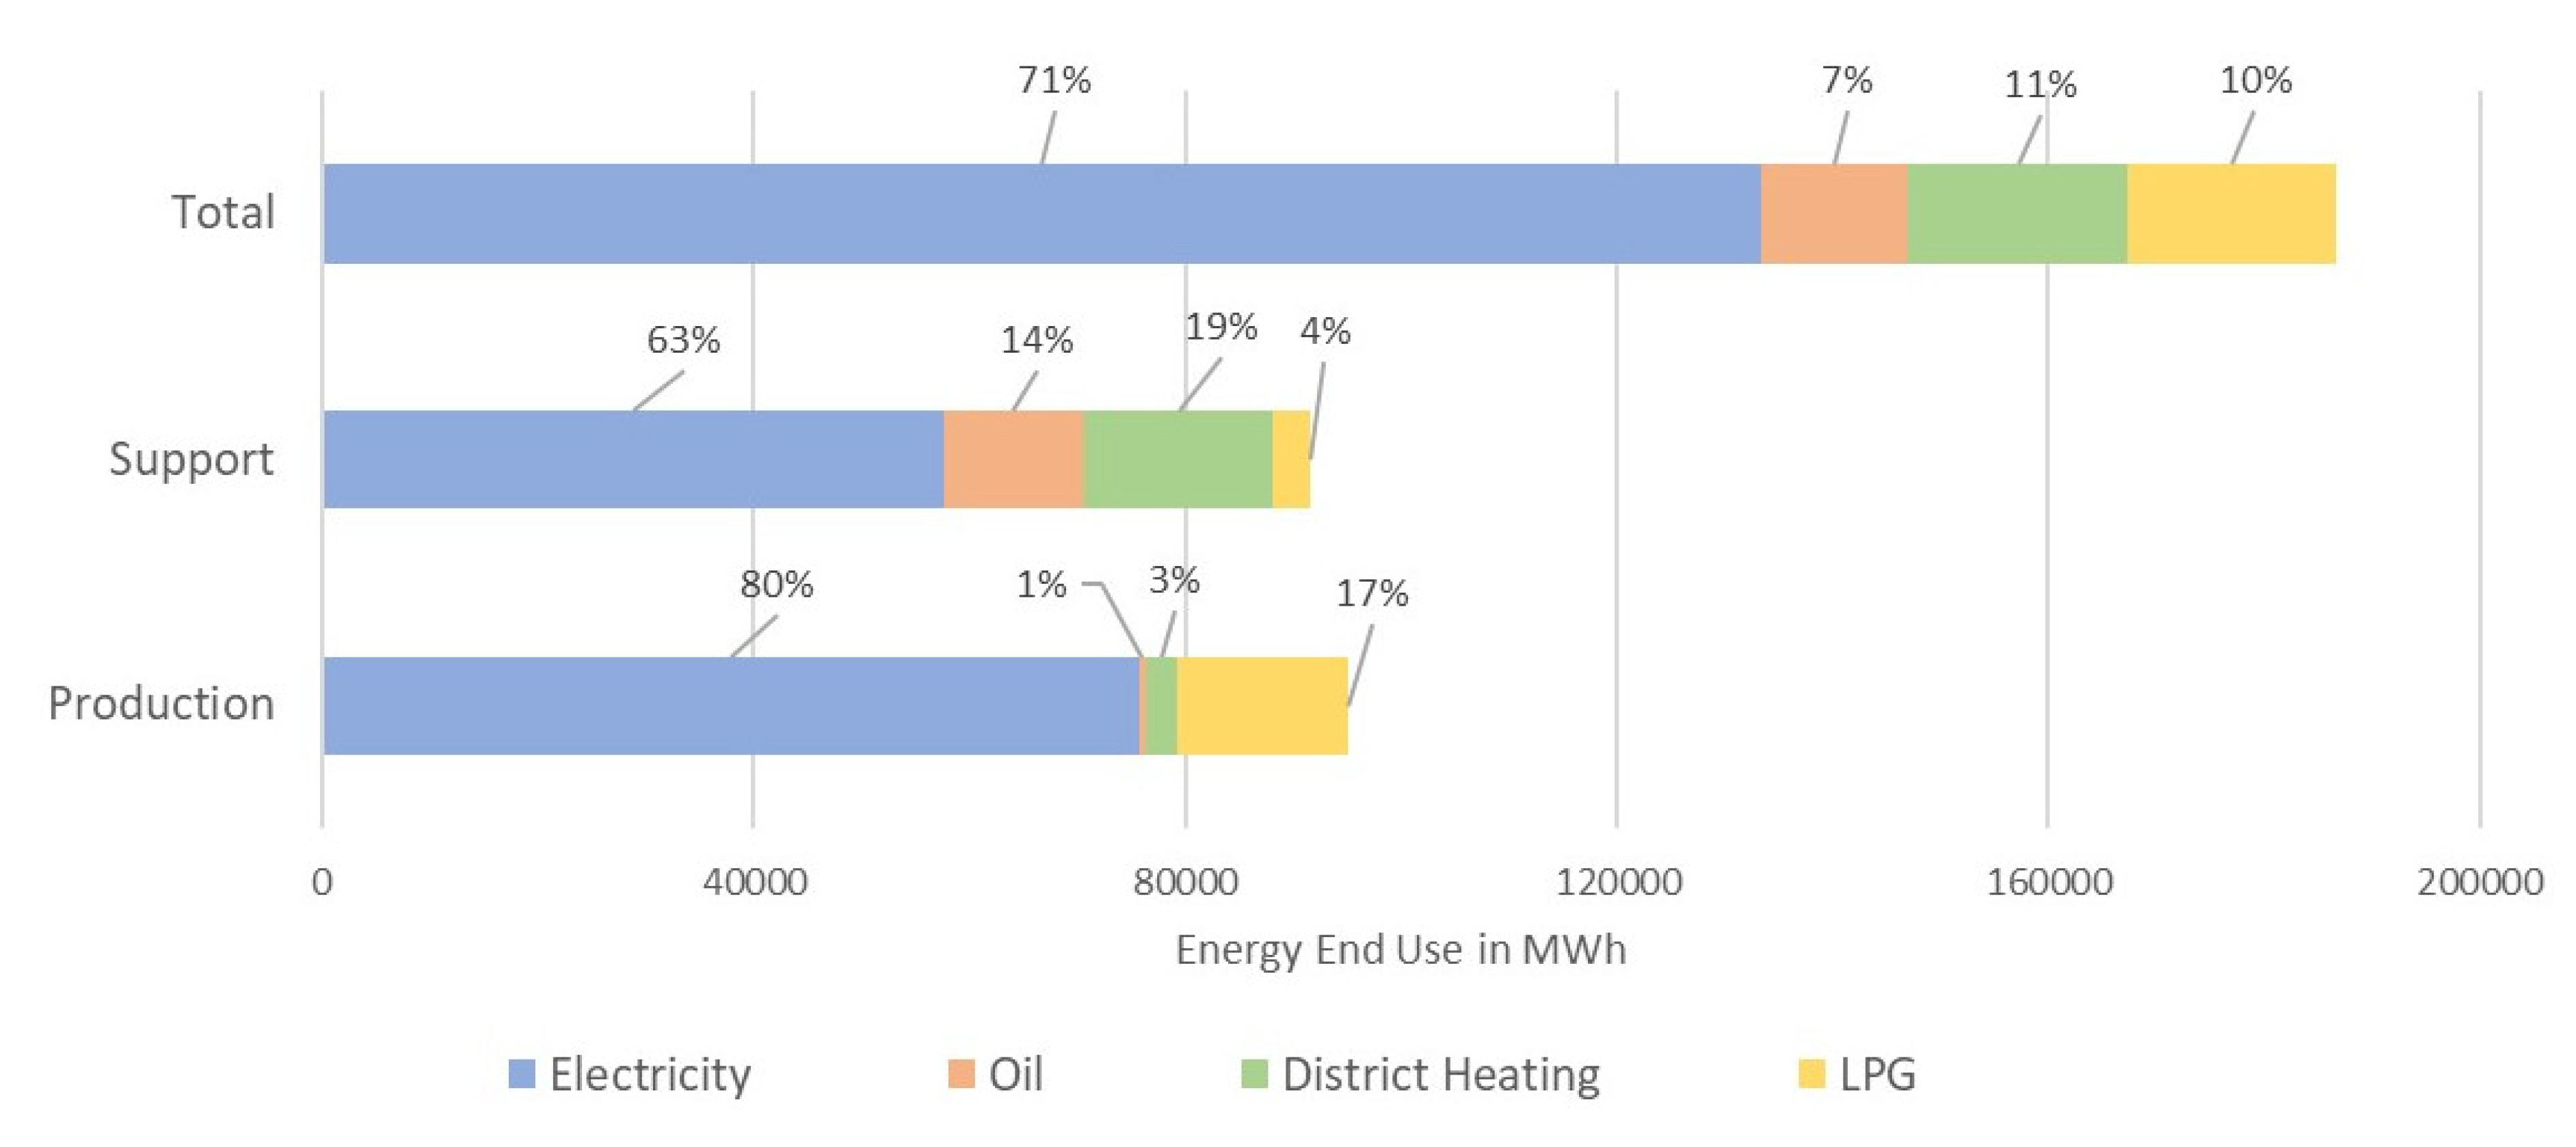
The energy carriers used by the industrial companies in the case study were diesel, liquified petroleum gas (LPG), heavy oil, district heating, and electricity. Different energy carriers have different emission factors, which may also vary with the region and seasons especially for electricity and district heating [38]. The CO2 emission factors used for the study are mentioned in Table 2.
There are different sources for selecting emission factors. Emission factors for fossil fuels in this study are taken from the Swedish Environmental Protection Agency [40]. Electricity is considered to be the Nordic electricity mix, as the supply comes through Nordpool, and the emission factor for district heating is taken from the Swedish mix, as district heating markets are more local [38]. Additionally, the CO2 emission factors for electricity and district heating vary throughout the year, so two scenarios were considered for the study. For the first scenario, the emission factors were taken according to the average Nordic electricity mix [39] and the average Swedish district heating mix [41]. In the second scenario, the marginal electricity for the Nordic mix and the marginal district heating are considered for calculating the CO2 emissions. Marginal electricity describes the emission of increased electricity generation by 1 MWh and average electricity describes the emission of generating 1 MWh of electricity [42]. Studies show that coal power plants at times produce marginal electricity in the Nordic region and oil-fired CHPs produce marginal district heating [43].
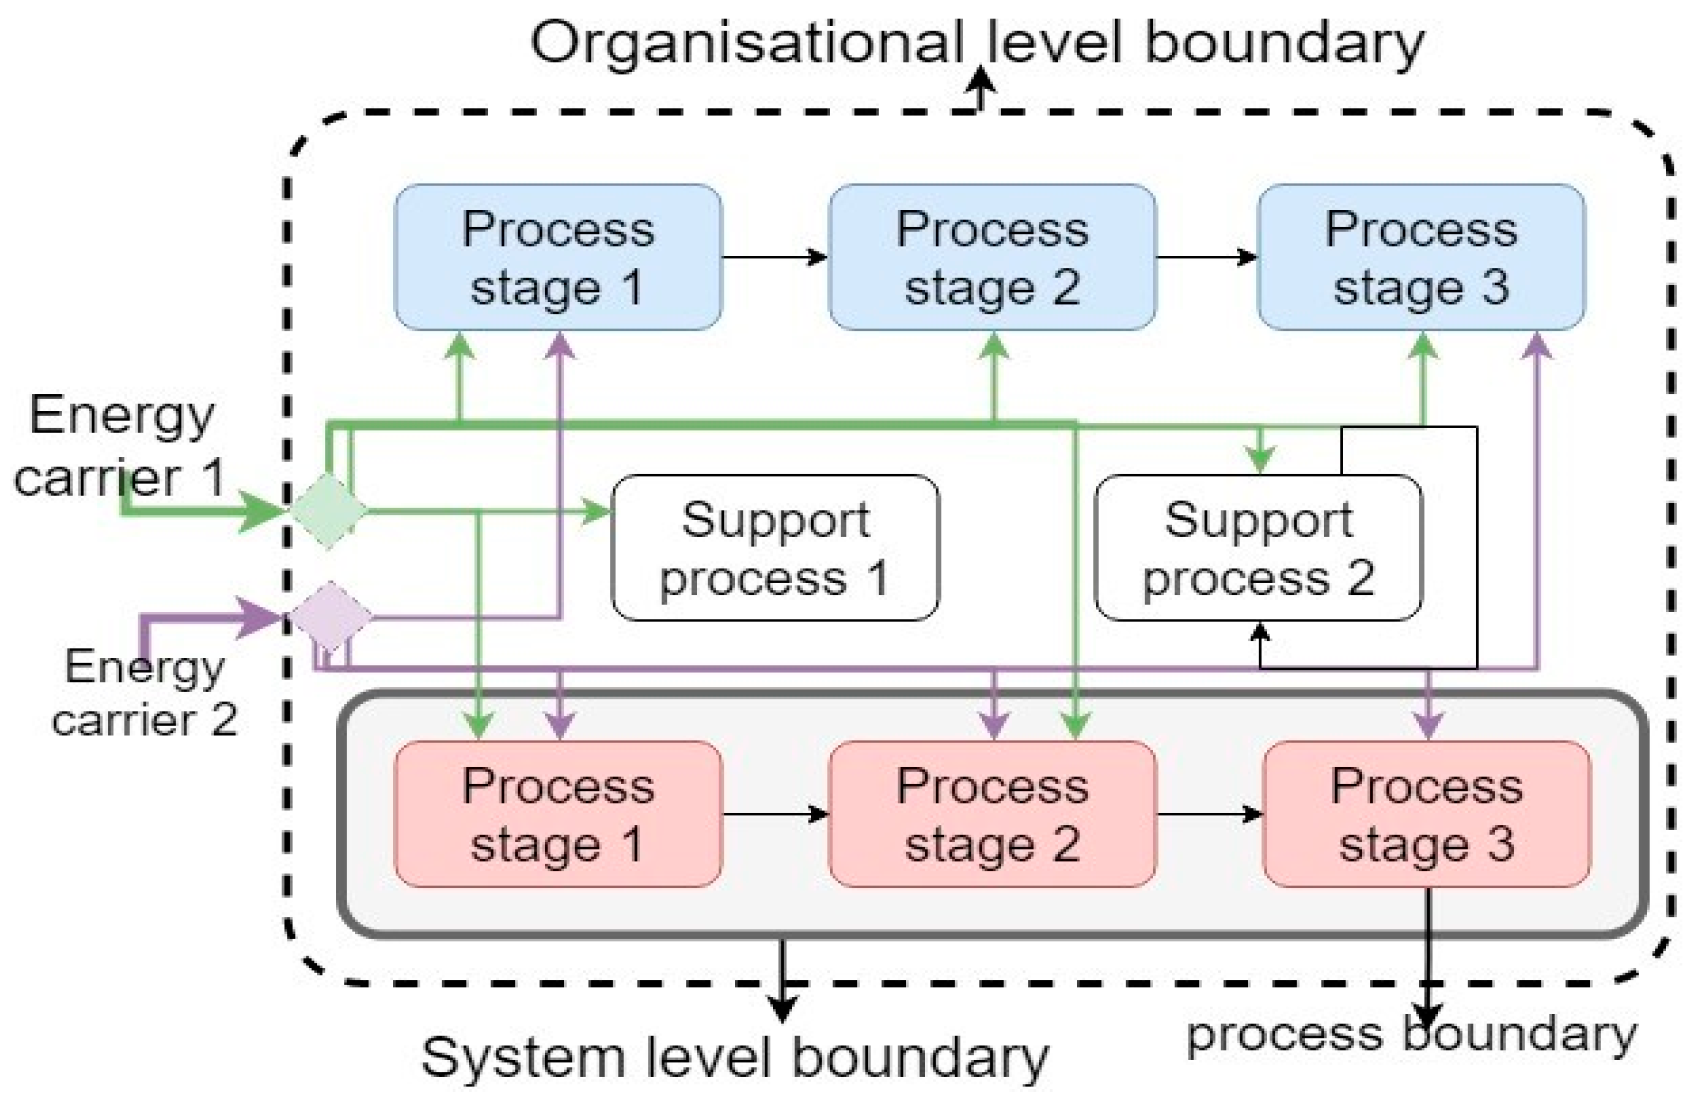
(5) Establish potential EnPIs: In line with the third research question, EnPIs currently applied in the industry were collected through the third part of the questionnaire, as mentioned in step 2. Additionally, the EnPIs addressed in different literature were also evaluated. The EnPIs were developed considering the relevant variables associated with energy performance and its characteristics. EnPIs were developed for the organizational level, system level, and process level.
(6) Feedback interview for EnPIs: A feedback interview was carried out with an energy expert representing an engineering company with the support of the questionnaire. The questionnaire was prepared for validating the EnPIs developed for the industries. This questionnaire consists of two parts, the first in order to check whether developed EnPIs are applicable for their factory and the second part consists of an open question for suggesting any other EnPIs that should be added to the study.
A limitation of this study is the lack of disaggregated EEU audit data based on bottom-up data collection. Different sized companies have different production volumes, and this results in data heterogeneity. The external transportation, e.g., from the factory to the customers, is not considered in this study. There are limitations to developing EnPIs, due to the absence of historical data to build a baseline period and the difficulty of distinguishing relevant variables from non-relevant ones.

4. Result and Analysis

4.1. Taxonomy

The hierarchical levels are differentiated by conditions such as level of complexity, energy flow direction, the purpose of energy in manufacturing processes and technologies. Adopting the principles listed by McCarthy [18] and translated then into an energy use context, using energy flow as the core attribute, a hierarchical structure of taxonomy has been developed (Figure 4).
The Level 1 taxon is energy carriers, which characterizes the supply side of the energy flow, and the complexity is low, e.g., it only involves measuring and monitoring at the supply point. It gives an overall picture of the dependence of industry on different carriers. The Level 2 taxon is major processes, i.e., support or production processes. This characterizes the purpose of energy use, i.e., whether it directly contributes to the product’s value added or it contributes to support services. The Level 3 taxon showcases the unit process, which is based on the purpose of a given industrial process. Both Level 2 and Level 3 are derived from Söderström [20]. In this characterization, the unit process is based on the purpose of a given industrial process. The Level 4 taxon is sub-unit process, which characterizes the different technologies used for the unit processes. The Level 5 taxon is equipment/tool, which refers to the individual machinery or equipment that uses energy for its operation, in which different technologies have different types of equipment.
Based on the hierarchy, a novel taxonomy for EEU in the engineering industry is developed, which serves to answer the first research question of this study (Figure 5 and Figure 6). The process tree of the taxonomy is derived from the literature study and energy audit reports collected. It was then validated by five companies. Due to a lack of accurate data and the highly complex nature of the equipment, it is difficult to generalize Level 5, hence for this study the taxonomy was defined only to the Level 4 taxon.
Figure 5 shows, at Level 1, that there are eight varieties of prominent energy carriers, excluding “other”, used in the engineering industry. At Level 2, only two categories are defined, which are support and production. At Level 3, there are separate varieties for the support category and production category. The support category has ten prominent processes, excluding “other”, and the production category has seven prominent unit processes, excluding “other”. Each of the processes has a different role in manufacturing methods or support functions. As shown in Figure 6, each of the unit processes pertaining to the production process has further ranges of sub-unit processes depending on the technology. The reason for not having sub-unit classification is that these processes can directly be classified to Level 5 (equipment level) which, as outlined previously, is only applicable for individual companies, i.e., not generalizable.

4.2. Energy Use

Identifying EEU serves to answer the second research question presented in Section 1 and therefore, the case study has to be used due to the fact that no energy analysis can rely on using literature, requiring categorization instead. Therefore, the energy use of the case study on the Swedish engineering industry is analyzed by adopting the suggested taxonomy in Section 4.1. Figure 7 shows the flow of energy through different hierarchy to each unit process. It should be noted that the energy intensity varies widely between processes. The case study shows that the total EEU is 186,800 MWh annually, in which production process EEU is about 95,000 MWh/year, which is 51% of total EEU, and support process EEU is 91,800 MWh/year, which is 49% of total EEU.
Figure 8 shows the EEU of the energy carriers for the total, the production, and the support categories. Figure 9 and Figure 10 show EEU for each support unit process and production unit process at Level 3 respectively. Appendix A shows the detailed values of each carrier in Figure A1 and Figure A4. It is interesting to note that electricity is the main carrier used for both support and production processes. For the support processes, there is significant use of district heating and oil due to the intensive use of both carriers in space heating and hot tap water. Meanwhile, in production, the significant use of LPG in heating and surface treatment is due to its application in painting. In terms of unit processes, heating is the most energy end-using process among production processes and space heating is the most energy end-using support process.

4.3. CO2 Emissions

The CO2 emissions analysis is also performed by adopting the developed taxonomy in Section 4.1. The CO2 emissions for scenario 1 are calculated from the EEU, considering emission factors according to the average Nordic electricity mix and average Swedish district heating mix. CO2 emissions are presented in Figure 11. It can be noticed that the carbon emissions in different categories and at different levels of taxon vary widely. The emission pattern is different from the EEU pattern. From the case study, the total contribution of emissions from the engineering industry is 17 100 tonnes of CO2, of which 8600 tonnes relates to support while 8500 tonnes of CO2 relate to production annually. Appendix A shows the detailed emission values for each carrier at unit process level for scenario 1 in Figure A2 and Figure A5.
The calculation of CO2 emissions based on scenario 2 uses the marginal Nordic electricity mix and marginal Swedish district heating mix. The CO2 emissions are as presented in Figure 12. It can be noted that the CO2 emission pattern in the second scenario is different from the first pattern. In the second scenario, the total contribution of emissions from the engineering industry is 11,100 tonnes of CO2 emissions/year, of which 51,000 tonnes/year is the share of support while 59,800 tonnes/year is the share of production annually. Appendix A shows the detailed emission values for each carrier at unit process level for scenario 2 in Figure A3 and Figure A6.
Figure 13 shows the comparison of both scenarios for total emissions, production process and support process. It can be noted that there is a wide gap between CO2 emission values for both scenarios as the marginal emission factor is high. The share from different carriers is also different. For scenario 1 and scenario 2, the major emission intensive carrier is electricity, but for scenario 1 only 46% is from electricity, whereas in scenario 2, 88% of emissions come from electricity. For production, in scenario 1, the major emission contribution is from electricity but only 53%, whereas in scenario 2, the electricity emission is about 92%. For support processes, in scenario 1, major emissions come from oil, at 42%, while in scenario 2, electricity use causes major emissions, amounting to 82%. District heating is the second highest emitter overall and for the support process in scenario 2, whereas LPG takes that position for the production process. In scenario 2, LPG is the second highest emitter overall and for the production process, whereas for the support process it is oil.
Figure 14 and Figure 15 represent CO2 emissions for support unit processes for scenario 1 and scenario 2 respectively. In scenario 1, space heating is the most emission intensive support unit process, followed by hot tap water, because of the influence of oil as an energy carrier. In scenario 2, ventilation is the most intensive support unit process, followed by space heating and lighting respectively, in which the ranking is very different compared to scenario 1. This difference is mainly because the marginal electricity emission factor is very close to fossil fuels.
Figure 16 and Figure 17 show CO2 emissions for production unit processes for scenario 1 and scenario 2 respectively. In scenario 1 and scenario 2 heating is the most emission intensive production unit process, since it involves the use of oil and LPG besides electricity. For scenario 1, surface treatment is the second most emission intensive production process, whereas for scenario 2 the second most emission intensive process is forming and shaping.

4.4. Energy Performance Indicators

Five companies responded to the EnPI-questionnaire that was sent out. The responding companies have different product ranges (shown in Table 3).
Together with the collected data from the companies, and adopting the EnPIs discussed in various literature ([16,26,33,44,45]), EnPIs were studied to investigate their same suitability in the engineering sector. EnPIs are adopted and developed by considering two parameters, which are different boundaries for the classification: (organizational level, system level, and process level), and the characteristics of each EnPI (absolute, ratio, statistical, or simulation). The organizational level is given in Table 4, the system-level EnPIs are given in Table 5.
For this study, the top five intensive unit processes of each production and support categories are considered for the development of EnPIs based on the case study. The five top EEU unit processes for support used in this study based on energy use are space heating, hot tap water, lighting, ventilation, and compressed air. In production, the top EEU unit processes are heating, forming and shaping, surface treatment, material removal, and other. It can be noted that these processes together account for more than 80% of the energy used in the engineering industry.
It may be noted that there are general EnPIs mentioned in Table 6 and Table 7 that can be used for most of the support processes and most of the production processes respectively. These EnPIs have common characteristics and variables pertaining to energy performance. In production, due to the different nature of industries, different production techniques, and different raw materials, the variables affecting energy performance are also different. A Feedback interview from the energy manager of a construction equipment company suggested that the above EnPIs are feasible to implement in their organization.

5. Discussion

5.1. Importance of Taxonomy to Industry

The developed taxonomy presents EEU classification in the engineering industry with a different hierarchy involving both energy flow and manufacturing attributes. This is one of the first reported research studies to adopt hierarchical classification. The study adopted the guidelines on production classification by McCarthy [18] and came up with a novel framework for EEU similar to the framework used in biological taxonomy. It provides a classification methodology that is transferrable to EEU in other industries. This taxonomy further allows an extension of the categories based on an evolutionary change in the process because, according to taxonomy science, it should allow for continuous development and refinement [14].
Based on the above classification methodology, the process tree of EEU in engineering industry was developed in this study. It provides a structured way to compare and classify EEU. Level 1 (energy carrier) classification enhances knowledge of the supply side in terms of quantity and quality. For quantity, it is through identifying the amount of energy, while for quality it is through identifying the type of energy carriers. This helps in the energy transition improvements as a step towards decarbonization of industry [46]. At Level 2, the classification into production and support categories, as addressed in various studies [13,20,25], increases knowledge with regard to investigating the improvement actions in terms of productivity. One example of this is a simple aix + bj equation, where ai represents the various production processes and bj represents the various support processes [47].
Level 3 (unit processes) classification serves as a building block enabling comparison and identification of the potential. This study is different from Söderström classification [20] as this process tree is developed by setting the attributes at the hierarchical level and thus avoids overlapping of the attributes. For e.g., unit processes such as disintegrating and disjointing, these have been included in the material removal unit processes, since the purpose of the energy in two processes is to separate material. Similarly, heating, melting, and drying are combined under heating in this study, as the purpose of all these processes is to increase the heat energy of a material. This classification helps in identifying improvement measures such as process integration. For example, improvement in heating can be obtained by using pinch technology. Level 4 (sub-unit processes) classification serves as the basis for benchmarking the technology by identifying total potential and deployment level and best practices. Classifications to Level 5 would have been an advantage in increasing the comprehensiveness of EEU closer to the equipment level. However, it is difficult to generalize this as equipment varies with the organization in the same industrial sector.

5.2. Significance of EEU and CO2 Emissions in Processes

When analyzing EEU and CO2 emissions, the categorization of EEU provides more knowledge on where and how energy is used. This enhances the identification of improvement actions, as also recommended by Sommarin et al. [26]. The data on EEU and CO2 emissions for each process and energy carrier help in targeting the improvement measures for intensive processes. In this case study, 91% of support energy use is from five support processes, which are space heating, lighting, ventilation, compressed air, and hot tap water. These processes are also responsible for most CO2 emissions in support, 94% in the case of scenario 1 and 88% in the case of scenario 2. For the production category, 83% of energy use is from four production processes, which are heating, forming and shaping, surface treatment, and material removal. These processes are also responsible for 83% of the CO2 emissions in both scenario 1 and scenario 2. This result is in contrast with the results in the study by Thollander et al. [13], in which the production processes are not classified. The results in this study are well classified in terms of support and production specifically for engineering industry. Another key detail to be discussed is the difference in CO2 emissions while considering different scenarios. The emissions in scenario 2 are very high compared to the emissions in scenario 1, due to the fact that the energy used at the marginal level is electricity produced in coal power plants and district heating produced in the oil-fired CHPs [38,42].
One of the limitations in the input audit data is the lack of aggregated EEU for production processes. So, it not always clear to which process some of EEU should be allocated. Considering this, only 26 out of the 41 audit reports collected were used for this study, ensuring that the majority of data could be allocated to the processes. If all the audit reports had been used, the majority of production process would have been left unallocated, reducing the quality of result. Still, it can be noted that 13% of EEU in the production category is identified as “other” compared to 4% in support processes. This lack of aggregated data for the production process in audit reports is also noted in a study by Sommarin et al. [26]. Another uncertainty in this paper is that the result for the studied companies might not exemplify the entire engineering industry. Therefore, the figures should be interpreted with caution when aggregated to national sector level.

5.3. Application of Energy Performance Indicators in Industry

The results of this study show that EnPIs used in the industries are very basic and are not classified. This is mainly because of the gap in applying the EnPIs mentioned in the research to the industrial needs [21]. The studies show that the comparison of EnPIs in the industry is complicated due to different EEU, undefined boundaries, and heterogeneity of products [37]. The proposed EnPIs for this study are unique as they have been formulated by considering significant variables and system boundaries for energy use, as recommended by ISO 50006 [16]. As these EnPIs have been developed for all boundary conditions, including major intensive processes, system level, and organizational level, monitoring and control of energy performance is possible at all levels, before and after implementation. This study has been validated with the case company to ensure the suitability of the proposed EnPIs in the engineering industry. This ensures that the practical feasibility of the proposed EnPIs matches the industrial needs. The limitation of this study is that the wide range of engineered products makes it difficult for more detailed EnPIs. Future research can be conducted to develop EnPIs especially at sub-unit process level.

5.4. Policy Implications

These proposed data on EEU and CO2 emissions have important implications for energy managers and policymakers [13], as they help to target major policies towards emission and energy intensive processes. Coupled with EEU data and EnPIs, the taxonomy can easily identify deployment levels for each process at various levels. This helps to target improvement measures and policy guidelines in order to tap the full potential of energy efficiency.
For EU members, there are Best Available Technology Reference Documents (BREF) developed under the Integrated Pollution Prevention and Control (IPPC) Directive and the Industrial Emission Directive (IED) [48] for several industries. However, there is no specific BREF document for the engineering industry; processes identified for this industry are covered in BREF documents for other industrial sectors. This study fills the knowledge gap with a classification system to identify relevant processes and EEMs. The classification, along with the EnPIs, can form a basis for a sector-specific benchmarking tool that enables the identification of the EEM applicable to the industry. Such a benchmarking tool would help individual companies and policymakers to estimate energy efficiency potential.
The taxonomy can be generalized to the engineering industries around the world as the nature of the operations involved in manufacturing will be the same regardless of location and this study has considered literature to include all operations. However, the energy and emission intensities of different processes will vary drastically from region to region as the energy performance variables associated with the energy use will change. For example, the energy used for space heating will be very less for tropical regions whereas the energy used for space cooling will be very high. As the data used in this study is from Swedish industries, the policymakers of other regions should study how intensive energy use in the region using the same taxonomy for targeting improvement action. For other industries, the hierarchical levels developed in the study can be adopted as the basis for EEU categorizations.

6. Conclusions

This paper has introduced a taxonomy for EEU and CO2 emissions on a process level applicable to the engineering industry. The taxonomy can contribute to enhanced knowledge of EEU and assists in benchmarking and comparison. This study contributes to scientific knowledge in the engineering industry and has the following novel features:
  • A taxonomy for the categorization of EEU and emissions for the processes in the engineering industry.
  • Identified intensive processes by analysis of EEU and CO2 emissions in the engineering industry.
  • List of potential EnPIs at organizational level, system level, and process level for the engineering industry.
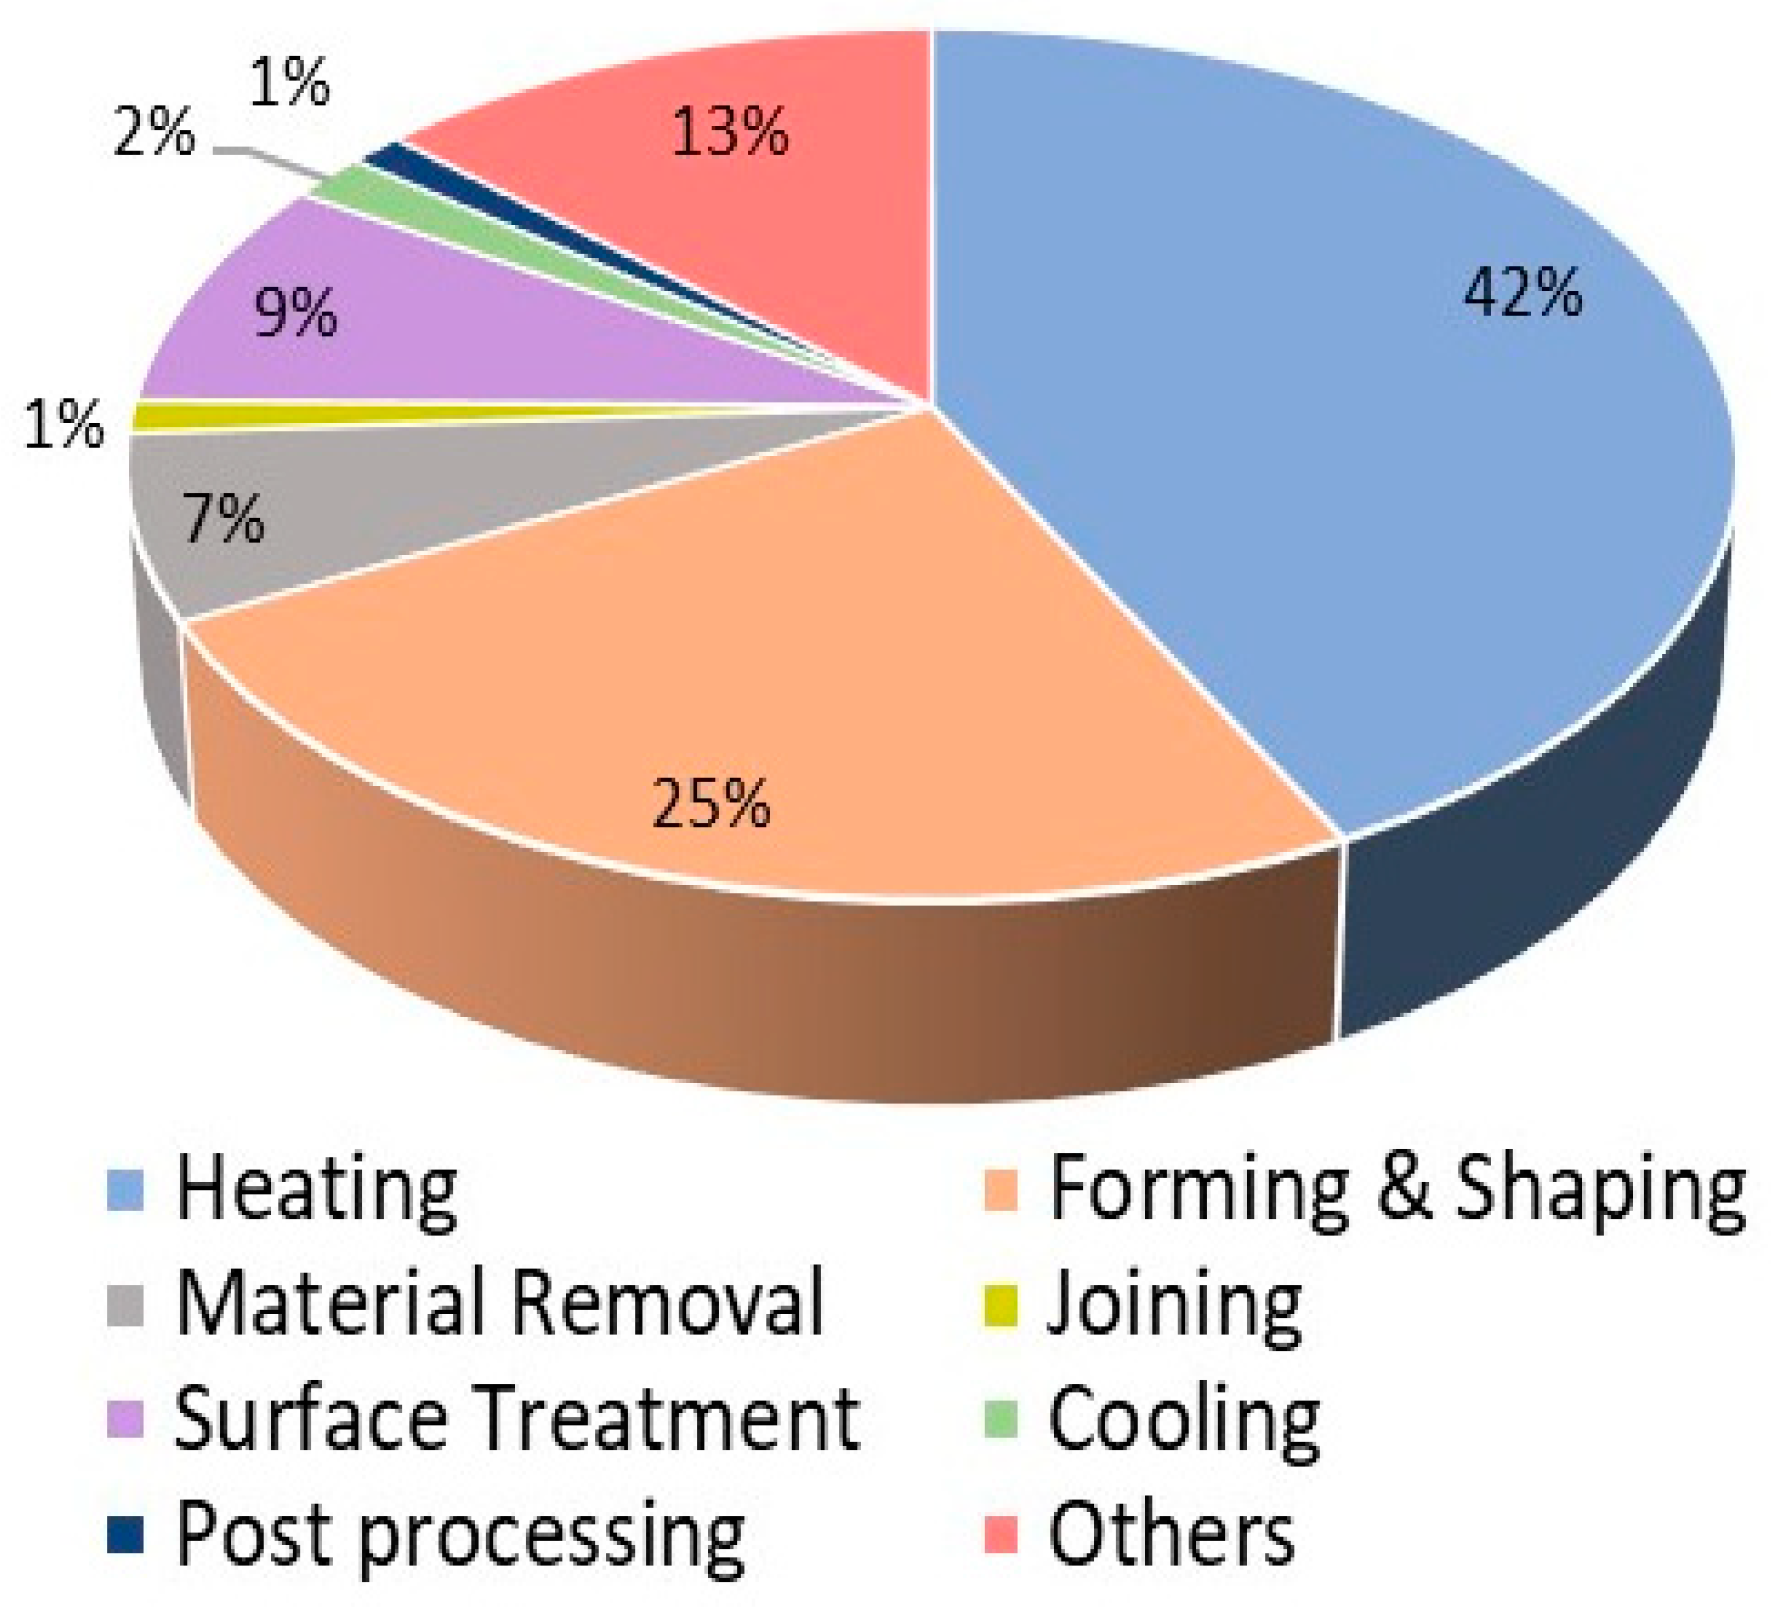
The study shows that the EEU and emissions intensity of certain unit processes are very high. Currently there are no programs that can target these processes to tap energy efficiency potential. The study also highlights the potential for the energy transition in the industry through identifying the share of fossil carriers. It is suggested that further research should be done to develop new effective policies to tap potential and energy transition opportunity.
A general finding from this study is that categorizing EEU processes can be generalizable to the 4th level in the developed taxonomy. However, on the 5th level, this can only be done for individual companies. This provides further evidence that public authorities governing the EEU, e.g., national EPAs, should strive to develop a general taxonomy for each industry. Such a level of categorization can, of course, serve very well in terms of energy control and energy management, as well as for an EPA analyzing one single company, but it cannot be easily generalizable.
It is suggested that the classification and EnPIs can be used to build a diagnostic benchmarking tool for energy efficiency improvements. This will be useful for both individual companies and governing agencies, allowing more credible comparison and simpler data compilation. Future research can be done to develop a framework for developing and establishing energy EnPIs and standard classification for fair benchmarking and monitoring of energy performance in industry.
In conclusion, the paper, apart from presenting results from the engineering industry, also presents a general methodology for developing sector-specific taxonomies. This is one general finding from the paper which, to the authors’ knowledge, is new scientific knowledge in relation to taxonomy development for EEU in industry.

Author Contributions

Conceptualization, F.M.K., and N.J.; methodology, F.M.K.; validation, F.M.K., N.J., S.J., P.T., and M.A.; formal analysis, F.M.K., and N.J.; investigation, F.M.K., and N.J.; resources, F.M.K., N.J., and S.J.; writing—original draft preparation, F.M.K, and N.J.; writing—review and editing, F.M.K., S.J., P.T., and M.A.; supervision, S.J., P.T., and M.A. All authors have read and agreed to the published version of the manuscript.

Funding

This study was funded by the Swedish Environmental Protection Agency and the Swedish Agency for Marine and Water Management, research project Carbonstruct, project no. 802-0082-17.

Acknowledgments

The authors would like to thank Elias Andersson for relevant insights on the paper.

Conflicts of Interest

The authors declare no conflict of interest.

Appendix A

Figure A1. Energy use for the unit processes in the production category based on the case study of the Swedish engineering industry.
Energies 13 00369 g0a1
Figure A2. CO2 emissions for the unit processes in the production category based on the case study of the Swedish engineering industry (Scenario 1).
Energies 13 00369 g0a2
Figure A3. CO2 emissions for the unit processes in the production category based on the case study of the Swedish engineering industry (Scenario 2).
Energies 13 00369 g0a3
Figure A4. Energy use for the unit processes in the support category based on the case study of the Swedish engineering industry.
Energies 13 00369 g0a4
Figure A5. CO2 emissions for the unit processes in the support category based on the case study of the engineering industry (Scenario 1).
Energies 13 00369 g0a5
Figure A6. CO2 emissions for the unit processes in the support category based on the case study of the engineering industry (Scenario 2).
Energies 13 00369 g0a6

References

  1. International Energy Agency. World Energy Balances; IEA: Paris, France, 2018. [Google Scholar]
  2. International Energy Agency. CO2 Emissions from Fuel Combustion; IEA: Paris, France, 2018. [Google Scholar]
  3. Energimyndigheten. Energiläget. Available online: http://www.energimyndigheten.se/globalassets/statistik/energilaget/energilaget-i-siffror-2019.xlsx (accessed on 5 October 2019).
  4. International Energy Agency. Perspectives for the Energy Transition: The Role of Energy Efficicency; IEA: Paris, France, 2018. [Google Scholar]
  5. International Energy Agency. Global Energy and CO2 Status Report; IEA: Paris, France, 2019. [Google Scholar]
  6. Anderson, S.T.; Newell, R.G. Information programs for technology adoption: The case of energy-efficiency audits. Resour. Energy Econ. 2004, 26, 27–50. [Google Scholar] [CrossRef] [Green Version]
  7. Cagno, E.; Trianni, A. Analysis of the Most Effective Energy Efficiency Opportunities in Manufacturing Primary Metals, Plastics, and Textiles Small- and Medium-Sized Enterprises. Energy Resour. Technol. 2012, 134, 021005–021005-9. [Google Scholar] [CrossRef]
  8. Trianni, A.; Cagno, E.; De Donatis, A. A framework to characterize energy efficiency measures. Appl. Energy 2014, 118, 207–220. [Google Scholar] [CrossRef]
  9. Steve, S.; O’Malley, E.; Schleich, J.; Scott, S. The economics of energy. Edw. Elgar 2004, 14, 349. [Google Scholar]
  10. Cagno, E.; Worrell, E.; Trianni, A.; Pugliese, G. A novel approach for barriers to industrial energy efficiency. Renew. Sustain. Energy Rev. 2013, 19, 290–308. [Google Scholar] [CrossRef]
  11. Trianni, A.; Cagno, E.; Worrell, E.; Pugliese, G. Empirical investigation of energy efficiency barriers in Italian manufacturing SMEs. Energy 2013, 49, 444–458. [Google Scholar] [CrossRef]
  12. Andersson, E.; Arfwidsson, O.; Bergstrand, V.; Thollander, P. A study of the comparability of energy audit program evaluations. J. Clean. Prod. 2017, 142, 2133–2139. [Google Scholar] [CrossRef] [Green Version]
  13. Thollander, P.; Paramonova, S.; Cornelis, E.; Kimura, O.; Trianni, A.; Karlsson, M.; Cagno, E.; Morales, I.; Navarro, J.P.J. International study on energy end-use data among industrial SMEs (small and medium-sized enterprises) and energy end-use efficiency improvement opportunities. J. Clean. Prod. 2015, 104, 282–296. [Google Scholar] [CrossRef] [Green Version]
  14. McCarthy, P. Toward a Phylogenetic Reconstruction of Organizational Life. J. Bioecon. 2005, 7, 271–307. [Google Scholar] [CrossRef]
  15. Thollander, P. Industrial Data Categorization and Indexation; Linkoping University: Linkoping, Sweden, 2017. [Google Scholar]
  16. International Organization for Standardization. ISO50006: 2014 Energy Management Systems; Swedish Standards Institute: Stockholm, Sweden, 2014. [Google Scholar]
  17. Avraham, S.; Theodore, K.; Thomas, S.G. Production classification system: Concepts, models and strategies. Int. J. Prod. Res. 1985, 23, 563–578. [Google Scholar]
  18. McCarthy, I. Manufacturing classification: Lessons from organizational systematics and biological taxonomy. Integr. Manuf. Syst. 1995, 6, 37–48. [Google Scholar] [CrossRef]
  19. Kalpakjian, S. Manufacturing Engineering and Technology; Prentice Hall: Englewood Cliffs, NJ, USA, 2001; p. 1148. [Google Scholar]
  20. Soederstrom, M. Industrial electricity use characterised by unit processes—A tool for analysis and forecasting. Book-Inst. Mater. 1996, 642, 77–85. [Google Scholar]
  21. May, G.; Taisch, M.; Prabhu, V.V.; Barletta, I. Energy Related Key Performance Indicators—State of the Art, Gaps and Industrial Needs; Springer: Berlin/Heidelberg, Germany, 2013; pp. 257–267. [Google Scholar]
  22. Arlyn, M.; Moutaz, K.; David, B.E. Towards a production classification system. Bus. Process Manag. J. 2002, 8, 53–79. [Google Scholar]
  23. International Organisation For Standardization. ISO 50001 Energy Management; Swedish Standards Institute: Stockholm, Sweden, 2011. [Google Scholar]
  24. International Energy Agency. Energy Management Programmes for Industry; IEA: Paris, France, 2012. [Google Scholar]
  25. Rosenqvist, P.; Thollander, P.; Rohdin, P.; Söderström, M. Industrial Energy Auditing for Increased Sustainability—Methodology and Measurements. Sustain. Energy Recent Stud. 2012. [Google Scholar] [CrossRef] [Green Version]
  26. Sommarin, P.; Svensson, A.; Thollander, P. A method for bottom-up energy end-use data collection—Results and experience. In Proceedings of the ECEEE 2014, Industrial Summer Study: Retool for a competitive and sustainable industry, Arnhem, The Netherlands, 2–5 June 2014. [Google Scholar]
  27. Andersson, E.; Karlsson, M.; Thollander, P.; Paramonova, S. Energy end-use and efficiency potentials among Swedish industrial small and medium-sized enterprises—A dataset analysis from the national energy audit program. Renew. Sustain. Energy Rev. 2018, 93, 165–177. [Google Scholar] [CrossRef]
  28. Pakbin, B. ISO 50001 Energy Management in food industries. In Proceedings of the 10th International Industrial Engineering Conference, Tehran, Iran, 27–28 January 2014. [Google Scholar]
  29. Biagiotti, D.; Campiotti, C.A.; Giagnacovo, G.; Latini, A.; Scoccianti, M.; Viola, C. Energy Efficiency in Italian Fruit and Vegetables Processing Industries in the EU Agro-Food Sector Context. Riv. Studi Sulla Sostenibilita’ 2014, 159–174. [Google Scholar] [CrossRef]
  30. Dobes, V. New tool for promotion of energy management and cleaner production on no cure, no pay basis. J. Clean. Prod. 2013, 39, 255–264. [Google Scholar] [CrossRef]
  31. Anthony, B.S. Manufacturing Engineering; Nova Science Publishers Inc: New York, NY, USA, 2012. [Google Scholar]
  32. Schmid, S.R.; Kalpakjian, S. Manufacturing Engineering and Technology; Pearson: New York, NY, USA, 2013. [Google Scholar]
  33. Schmidt, C.; Li, W.; Thiede, S.; Kornfeld, B.; Kara, S.; Herrmann, C. Implementing Key Performance Indicators for Energy Efficiency in Manufacturing. Procedia CIRP 2016, 57, 758–763. [Google Scholar] [CrossRef]
  34. Andersson, E.; Thollander, P. Keyperformance indicators for energy management in the Swedish pulp and paper industry. Energy Strategy Rev. 2019, 24, 229–235. [Google Scholar] [CrossRef]
  35. Shim, H.S.; Lee, S.J. A Study of Determination of Energy Performance Indicator for Applying Energy Management System in Industrial Sector. In Proceedings of the 2018 Portland International Conference on Management of Engineering and Technology (PICMET), Honolulu, HI, USA, 19–23 August 2018. [Google Scholar]
  36. Lawrence, A.; Thollander, P.; Andrei, M.; Karlsson, M. Specific Energy Consumption/Use (SEC) in Energy Management for Improving Energy Efficiency in Industry: Meaning, Usage and Differences. Energies 2019, 12, 247. [Google Scholar] [CrossRef] [Green Version]
  37. Bunse, K.; Vodicka, M.; Schönsleben, P.; Brülhart, M.; Ernst, F.O. Integrating energy efficiency performance in production management—Gap analysis between industrial needs and scientific literature. J. Clean. Prod. 2011, 19, 667–679. [Google Scholar] [CrossRef]
  38. Nordenstam, L.; Ilic, D.D.; Ödlund, L. Corporate greenhouse gas inventories, guarantees of origin and combined heat and power production—Analysis of impacts on total carbon dioxide emissions. J. Clean. Prod. 2018, 186, 203–214. [Google Scholar] [CrossRef]
  39. Nordic Energy Research. Nordic Energy Technology Perspectives 2016, Cities, Flexibility and Pathways to Carbon-Neutrality. Available online: www.nordicetp.org (accessed on 15 October 2019).
  40. Naturvardsverket. Naturvardsverket. Available online: https://www.naturvardsverket.se/Stod-i-miljoarbetet/Vagledningar/Luft-och-klimat/Berakna-dina-klimatutslapp/ (accessed on 2 March 2019).
  41. Energiforetagen. Energiforetagen. Available online: https://www.energiforetagen.se/sa-fungerar-det/fjarrvarme/fjarrvarmeproduktion/ (accessed on 25 February 2019).
  42. Garcia, R.; Freire, F. Marginal Life-Cycle Greenhouse Gas Emissions of Electricity Generation in Portugal and Implications for Electric Vehicles. Resources 2016, 5, 41. [Google Scholar] [CrossRef]
  43. Werner, S. District heating and cooling in Sweden. Energy 2017, 126, 419–429. [Google Scholar] [CrossRef]
  44. LJ Energy Pte Ltd. Assessment Framework for Energy Efficiency Benchmarking Study of Food Manufacturing Plants; The National Environment Agency: Singapore, 2016.
  45. Abel, E.; Elmroth, A. Buildings and Energy—A Systematic Approach; Lund University Publications: Lund, Sweden, 2007. [Google Scholar]
  46. Lechtenböhmer, S.; Nilsson, L.J.; Åhman, M.; Schneider, C. Decarbonising the energy intensive basic materials industry through electrification—Implications for future EU electricity demand. Energy 2016, 115, 1623–1631. [Google Scholar] [CrossRef] [Green Version]
  47. Thollander, P.; Rohdin, P.; Moshfegh, B.; Kalrsson, M.; Söderström, M.; Trygg, L. Energy in Swedish industry 2020—Current status, policy instruments, and policy implications. J. Clean. Prod. 2013, 51, 109–117. [Google Scholar] [CrossRef] [Green Version]
  48. European Commission. europa.eu. Available online: http://eippcb.jrc.ec.europa.eu/reference/BREF/FDM/FDM_02-10-2018BW.pdf (accessed on 30 April 2019).
Figure 1. Concept of energy performance indicators (EnPI) in baseline period and implemented period.
Energies 13 00369 g001
Figure 2. Different boundaries for monitoring energy performance.
Energies 13 00369 g002
Figure 3. Outline of the methodology used for developing taxonomy and EnPI.
Energies 13 00369 g003
Figure 4. Hierarchical classification of the taxon for energy use.
Energies 13 00369 g004
Figure 5. Tree showing Level 1, Level 2, and Level 3 categories of EEU taxonomy in the engineering industry.
Energies 13 00369 g005
Figure 6. Process tree showing Level 4 production categories of energy use taxonomy in the engineering industry.
Energies 13 00369 g006
Figure 7. Energy flow through different taxons and categories of EEU taxonomy for the Swedish engineering industry (values are rounded to nearest 50 or 100).
Energies 13 00369 g007
Figure 8. The share of energy end-use (EEU) from different energy carriers for the Swedish engineering industry based on case study. Percentage in order of electricity, oil, district heating (DH), and liquid petroleum gas (LPG).
Energies 13 00369 g008
Figure 9. The share of EEU for support unit processes in the Swedish engineering industry.
Energies 13 00369 g009
Figure 10. The share of EEU for production unit processes in the Swedish engineering industry.
Energies 13 00369 g010
Figure 11. CO2 emissions for each category at different levels of taxon in the Swedish engineering industry based on scenario 1, where average electricity mix and average district heating mix are considered (values are rounded to nearest 50 or 100).
Energies 13 00369 g011
Figure 12. CO2 emissions for each category at different levels of taxon in the Swedish engineering industry based on scenario 2, where marginal electricity and marginal district heating are considered (values are rounded to nearest 50 or 100).
Energies 13 00369 g012
Figure 13. Share of CO2 emissions from different energy carriers for the production and support processes of the Swedish engineering industry. Sc1—Scenario 1, Sc2—Scenario 2. Percentage in order of electricity, oil, district heating (DH), LPG.
Energies 13 00369 g013
Figure 14. The share of CO2 emissions for support unit processes in the Swedish engineering industry (Scenario 1).
Energies 13 00369 g014
Figure 15. The share of CO2 emissions for support unit processes in the Swedish engineering industry (Scenario 2).
Energies 13 00369 g015
Figure 16. The share of CO2 emissions for the production unit processes in the Swedish engineering industry (Scenario 1).
Energies 13 00369 g016
Figure 17. The share of CO2 emissions for the production unit processes in the Swedish engineering industry (Scenario 2).
Energies 13 00369 g017
Table 1. Details of audit reports in the case study.
No of audit reports collected41
No of audit report selected26
Year of the audit reports2013–2017
Description of products manufactured in the companies considered.Machined tools and parts, automotive parts, springs, heaters, hardware items, rubber products, protective equipment, fasteners, and sheet metal products.
Table 2. Emission factors for different energy carriers considered for this study.
Energy CarrierEmission Factor (kg CO2/MWh)Year of Data and Source
Nordic Electricity (average mix)592013 [39]
Nordic Electricity (marginal)7282017 [38]
Heavy Oil2742017 [40]
Swedish District Heating (average mix)462015 [41]
Swedish District Heating (marginal)2672017 [38]
LPG2342017 [40]
Diesel2222017 [40]
Table 3. Collected EnPIs for the engineering industry.
CompanyProduct RangeEnPIs
Company AClimate Solutions, Radiators, and StovesEnergy use/turnover (MWh/SEK million sales)
Lighting energy use (W)/floor area (m2)
Space Heating (kWh/m2. year)
Company BAluminum ComponentsElectricity/working time (kWh/unit hour)
Company CCables, Electrical and Electronic ComponentsElectricity/working time (kWh/unit hour)
Company DSheet Metal ProductsElectricity/working time (kWh/unit hour)
Company EConstruction EquipmentIdle electricity (kWh)/production electricity (kWh)
Total energy use (MWh)
Total energy use (MWh/type of energy carrier)
Energy costs per carrier (million SEK)
Peak demand in a month (kW)
Total energy savings (MWh) from EEM
CO2 emissions (kg)/total energy use (MWh)
Total energy use (kWh)/production hours
Total energy use (kWh)/employees 
Recovered energy (MWh)/total energy use (MWh)
% of total energy use in idle (kWh) vs. total energy use (kWh)
Compressed air: Energy used (kWh)/air supply (Nm3)
Table 4. EnPIs identified for organizational level for the engineering industry.
Organizational Level
EnPIsCharacteristic
Total energy use (MWh)Absolute
Total energy use (MWh/type of energy carrier)Absolute
Energy costs per carrier (million SEK)Absolute
Peak demand in a month (kW)Absolute
Electricity use (kWh) during peak hoursAbsolute
Total energy savings (MWh) from EEM/yearAbsolute
CO2 emissions (kg)/total energy use (MWh)Ratio
Total energy use (kWh)/tonne of productionRatio
Total energy use (kWh)/unit of productRatio
Total energy use (kWh)/turnover (million SEK)Ratio
Total energy use (kWh)/production hoursRatio
Total energy use (kWh)/employeesRatio
Recovered energy (kWh)/total energy use (kWh)Ratio
% of total energy use at idle (kWh) vs. total energy use (kWh)Ratio
Table 5. EnPIs identified for system level for the engineering industry.
System Level
EnPIsCharacteristic
Energy use (kWh) of building with variable outside temperatureStatistical
Total energy use (MWh)Absolute
Total energy use (MWh/type of energy carrier)Absolute
CO2 emissions (kg)/total energy use (MWh)Ratio
Electricity use (kWh) during peak hoursAbsolute
Total energy savings (MWh) from EEM/yearAbsolute
Total energy use (kWh)/tonne of productionRatio
Total energy use (kWh)/unit of productRatio
Recovered energy (kWh)/total energy use (kWh)Ratio
% of total energy use at idle (kWh) vs. total energy use (kWh)Ratio
Table 6. Identified EnPIs for support processes for the engineering industry.
Support Process Level
Unit ProcessEnPIsCharacteristic
General for SupportEnergy use (kWh) during peak hoursAbsolute
Total energy savings (MWh) from EEM/yearAbsolute
Total energy use (MWh/type of energy carrier)Absolute
CO2 emissions (kg)/Energy use in process (MWh)Ratio
Total energy use (MWh)Absolute
Space HeatingTotal energy (kWh)/Atemp (m2) yearRatio
Electricity (kWh)/Atemp (m2) yearRatio
Fossil fuel used (kWh)Absolute
Peak demand in a month (kW)Absolute
Coefficient of Performance (COP) for heat pumpsRatio
Hot Tap WaterTotal energy use (kWh)/production hours (h)Ratio
Total energy use (kWh)/employeesRatio
Fossil fuel used kWhAbsolute
Peak demand in a month (kW)Absolute
LightingEnergy use (MWh)/floor area (m2) in a yearRatio
Total energy use (kWh)/production hours (h)Ratio
Specific power—Power (W)/floor area (m2)Ratio
VentilationSpecific power—Power (kW)/flow rate (m3/s)Ratio
Energy use (MWh)/building volume (m3)Ratio
Energy use kWh/Atemp (m2)Ratio
Compressed AirEnergy used (kWh)/air supply (Nm3)Ratio
Leakage rate (Compressor Free Air Delivery (m3/h) × avg load time/total operation time (h))Statistical
Table 7. Identified EnPIs for production processes for the engineering industry.
Production Process Level
Unit ProcessEnPIsCharacteristic
General for all Production processCO2 emissions (kg)/energy use in process (MWh)Ratio
Fossil fuel consumption kWhAbsolute
Total energy use (kWh/type of energy carrier)Absolute
Total energy savings (MWh) from EEM/yearAbsolute
Total energy use (kWh)/production (hours)Absolute
Energy use (kWh) during peak hoursAbsolute
Peak demand in a month (kW)Absolute
Total electricity use (kWh)Absolute
Actual energy use to actual output/rated energy use to rated outputStatistical
% of total energy use at idle vs. total energy use of processRatio
HeatingConversion efficiency of a boiler (%)Ratio
Heat loss in (kWh)Absolute
Energy (kWh)/tonne of materialRatio
Forming and ShapingEnergy (kWh)/cross-section (m2) of materialRatio
Energy (kWh)/volume (m3) of materialRatio
Surface TreatmentEnergy (kWh)/total surface area (m2)Ratio
Energy (kWh)/coating material deposited (kg)Ratio
Material RemovalEnergy (kWh)/material removed (kg).Ratio
Energy (kWh)/cutting cross-section (m2) of materialRatio
Energy (kWh)/volume (m3) of material removedRatio

