Article

Investigation of the Design and Fault Prediction Method for an Abrasive Particle Sensor Used in Wind Turbine Gearbox

Jiangsu Key Construction Laboratory of IoT Application Technology, Wuxi Taihu University, Wuxi 214000, China
*
Author to whom correspondence should be addressed.
Energies 2020, 13(2), 365; https://doi.org/10.3390/en13020365
Submission received: 7 December 2019 / Revised: 8 January 2020 / Accepted: 9 January 2020 / Published: 11 January 2020

Abstract

:
The gearbox is a key sub-component of a wind power generation system with high failure rate leading to shutdowns. By monitoring the abrasive particles in the lubricating oil when the gearbox is running, any abnormal condition of the gearbox can be found in advance. This information may be used to improve the operational safety of the wind turbine and reduce losses because of shutdowns and maintenance. In this paper, a three-coil induction abrasive particle sensor is designed based on the application of high-power wind turbine gearbox. The performance of the sensor and the design method of the detection circuit are described in detail, and the sensor operation performance used in the 2 MW wind turbine is verified. The results show that the sensor has superior performance in identifying ferromagnetic abrasive particles above 200 μm and plays a good role in status monitoring and fault prediction for the gearbox.

1. Introduction

Wind power is the fastest growing form of new energy, and its power generation cost has reached close to that of conventional power generation systems [1]. By the end of 2018, the world’s total wind power capacity was 593 GW, out of which 53.9 GW was generated that year. China has very rich wind energy resources. In 2018, China’s installed wind power capacity increased by 21 GW, bringing the total to 210 GW. China has the largest installed and fastest growing wind power generation in the world. However, the reliability issue of wind power generation seriously affects the operating cost of the wind turbines. Research shows that the gearbox is the sub-component having a relatively higher failure rate and is a major cause of shutdown in a wind power generation system [2,3,4,5]. Therefore, research on how to timely and effectively monitor gearbox faults to reduce potential losses is very important [6].
At present, there are mainly three methods used for monitoring wind power gearboxes: vibration state monitoring, oil quality sampling analysis, and oil abrasive particle number monitoring [7,8,9,10]. The vibration state monitoring system identifies the working state of the gearbox by installing vibration sensors in different positions of the gearbox to constantly monitor the vibration amplitude and frequency signals of the sensors [11,12,13,14,15,16,17]. The oil quality sampling analysis judges the wear state of the gearbox and predicts the fault through periodic inspection of the variation degree of the indicators of the quality of the oil in the gearbox, such as moisture, ph, cleanliness, viscosity, and metal ingredient [18]. The oil abrasive particle number monitoring system judges the wear state of the gearbox and predicts the performance development of the gearbox by detecting information such as number, size, and growth rate of the wear particles in the lubricating oil of the gearbox in order to provide the basis for decision on maintenance or replacement and to avoid accidents. The abrasive testing technology is highly reliable with no need to disassemble the gearbox. The monitoring system is also small in volume and light in weight with no limit in space and weight, and thus the technology is suitable for gearbox status detection. The oil metal abrasive particle monitoring can accurately distinguish the wear materials in the system, judge the degree of wear, type and specific wear positions, and further predict the lifetime of the machinery according to the property classification and the statistics of the metal abrasive particles. Therefore, the metal abrasive testing of gearbox oil in wind turbine has a broad application prospects in engineering. By testing the metal abrasive particles in the oil, the following targets can be achieved:
(1)
Detection of and distinction between ferromagnetic and non-ferromagnetic metal abrasive particles;
(2)
Measurement of the size of metal abrasive particles;
(3)
Statistics of the expected growth of metal abrasive particles.
Based on the above information of metal abrasive particles in the oil, the wear degree of the gearbox can be judged. The source of the wear can be determined by the type of metal abrasive particles, the degree of the wear can be judged by the size of metal abrasive particles, and the failure time can be predicted by the change in the size and number of different types of metal abrasive particles. In most designs, abrasive particles were collected by trapping magnets and passed through a single sensing coil, which causes the frequency of a connected oscillator to change [19]. This kind of sensor is simple in structure, but low in sensitivity and suitable for large particle detection. The other two coils design was proposed to sense the small individual abrasive particle [20], a solenoid coil produces a uniform magnetic field through which the particle pass, and the other planar sensing coil response the uniform magnetic, which is independent of the particle’s position. This kind of sensor has high precision, but its structure is unique, it is suitable for the application of small size oil pipeline.
In this paper, a three-coil induction abrasive particle sensor is designed for on-line abrasive particle monitoring. It is constructed by wrapping three separate coils around a single oil pipeline. Two of the coil act as excited coil and the third coil acts as a sense coil to detect the particle as they pass through the pipeline. This sensor combines the advantages of simple structure, sensitive sensing. The designed performance of the sensor and the design method for the detection circuit are described in detail. The results show that the designed performance of the sensor is superior, the detection accuracy for multi-particles is high, and the sensor has a good on-line monitoring and protection of the gear box. The manuscript is organized as follows: the working principle of the three-coil induction abrasive particle sensor is introduced in Section 2, and the design method of the detection circuit of the abrasive particle sensor is proposed in Section 3. In Section 4, the experimental verification and data analysis are presented. Finally, conclusions from the study are drawn in Section 5.

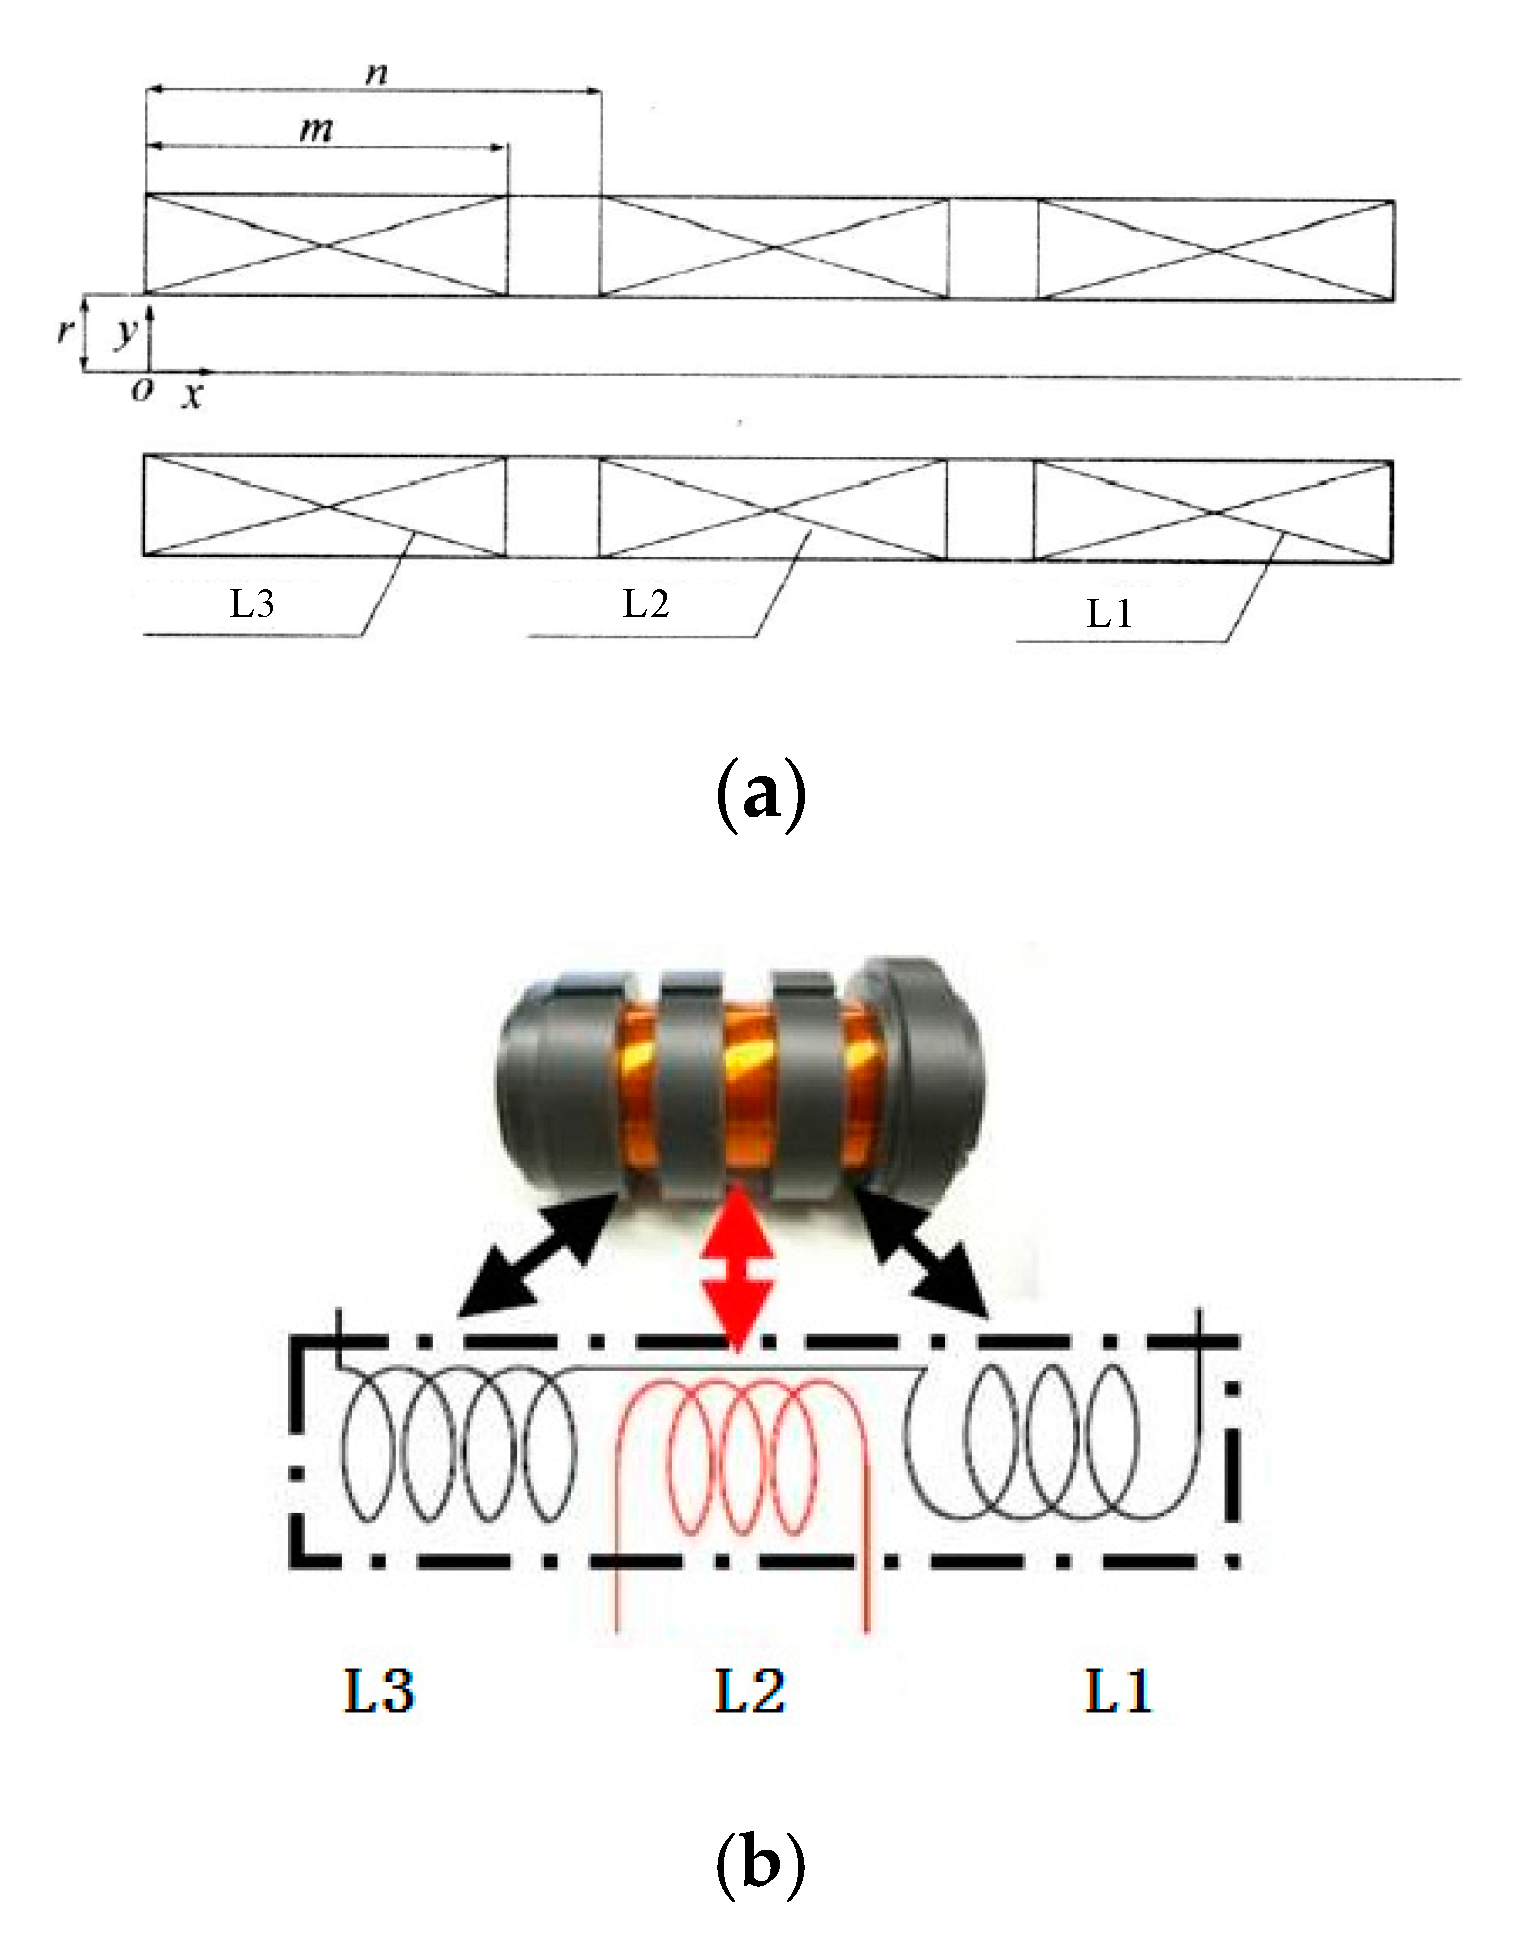
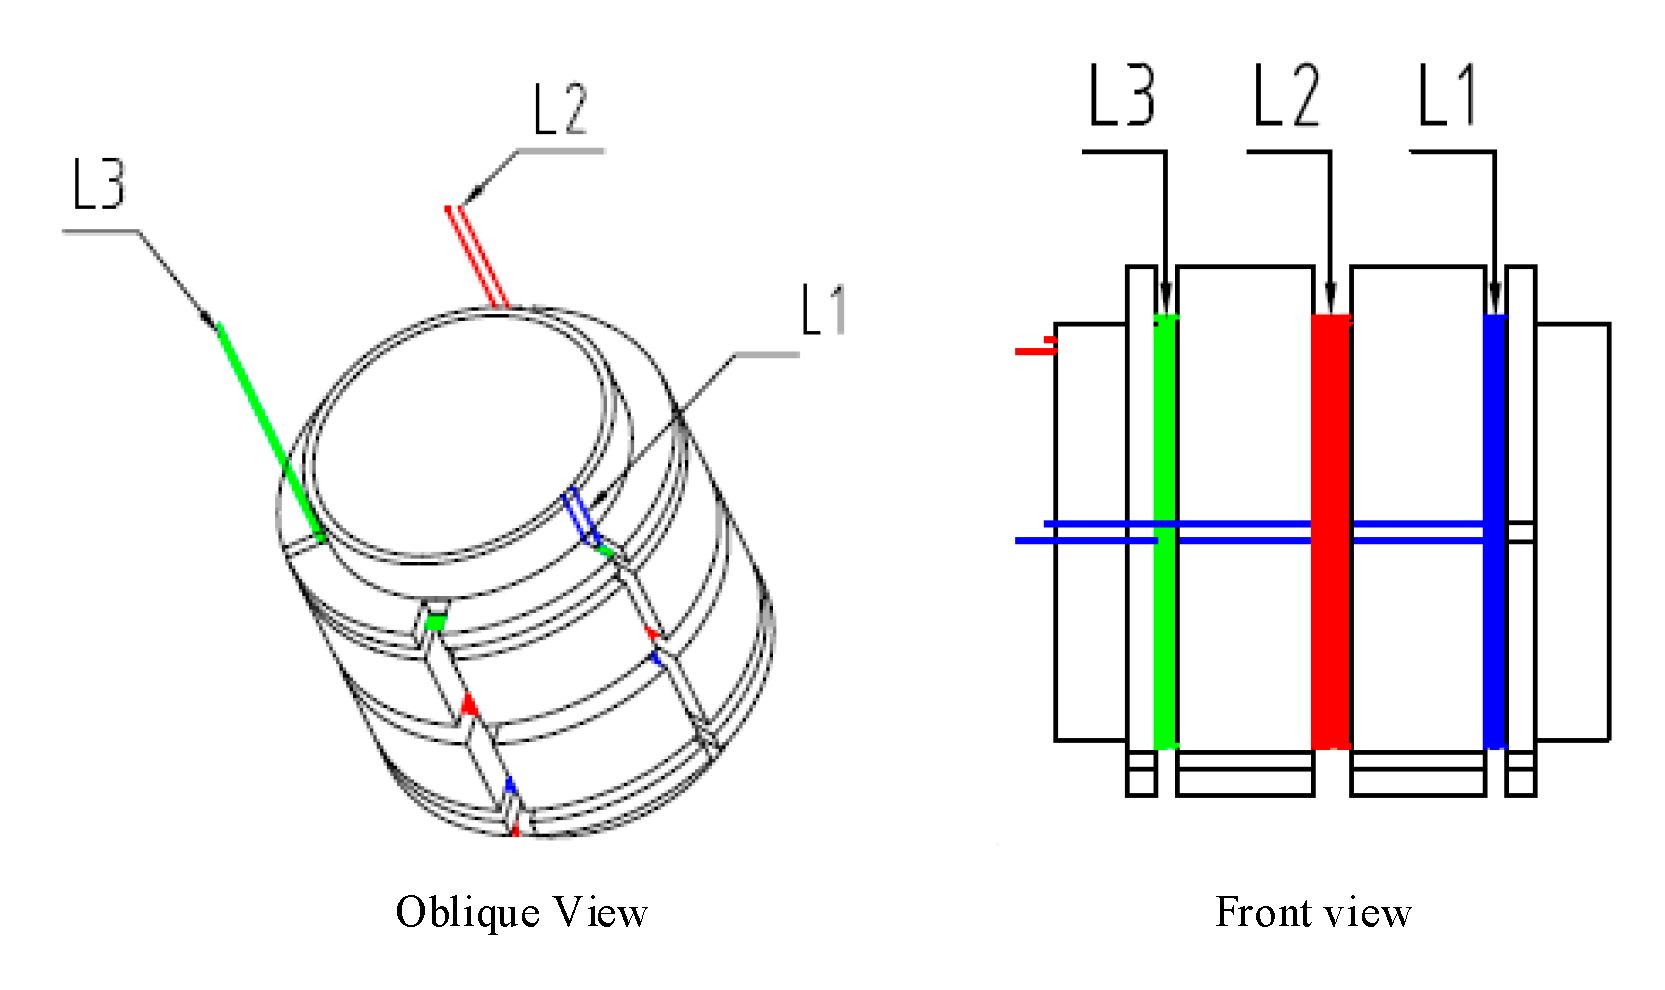
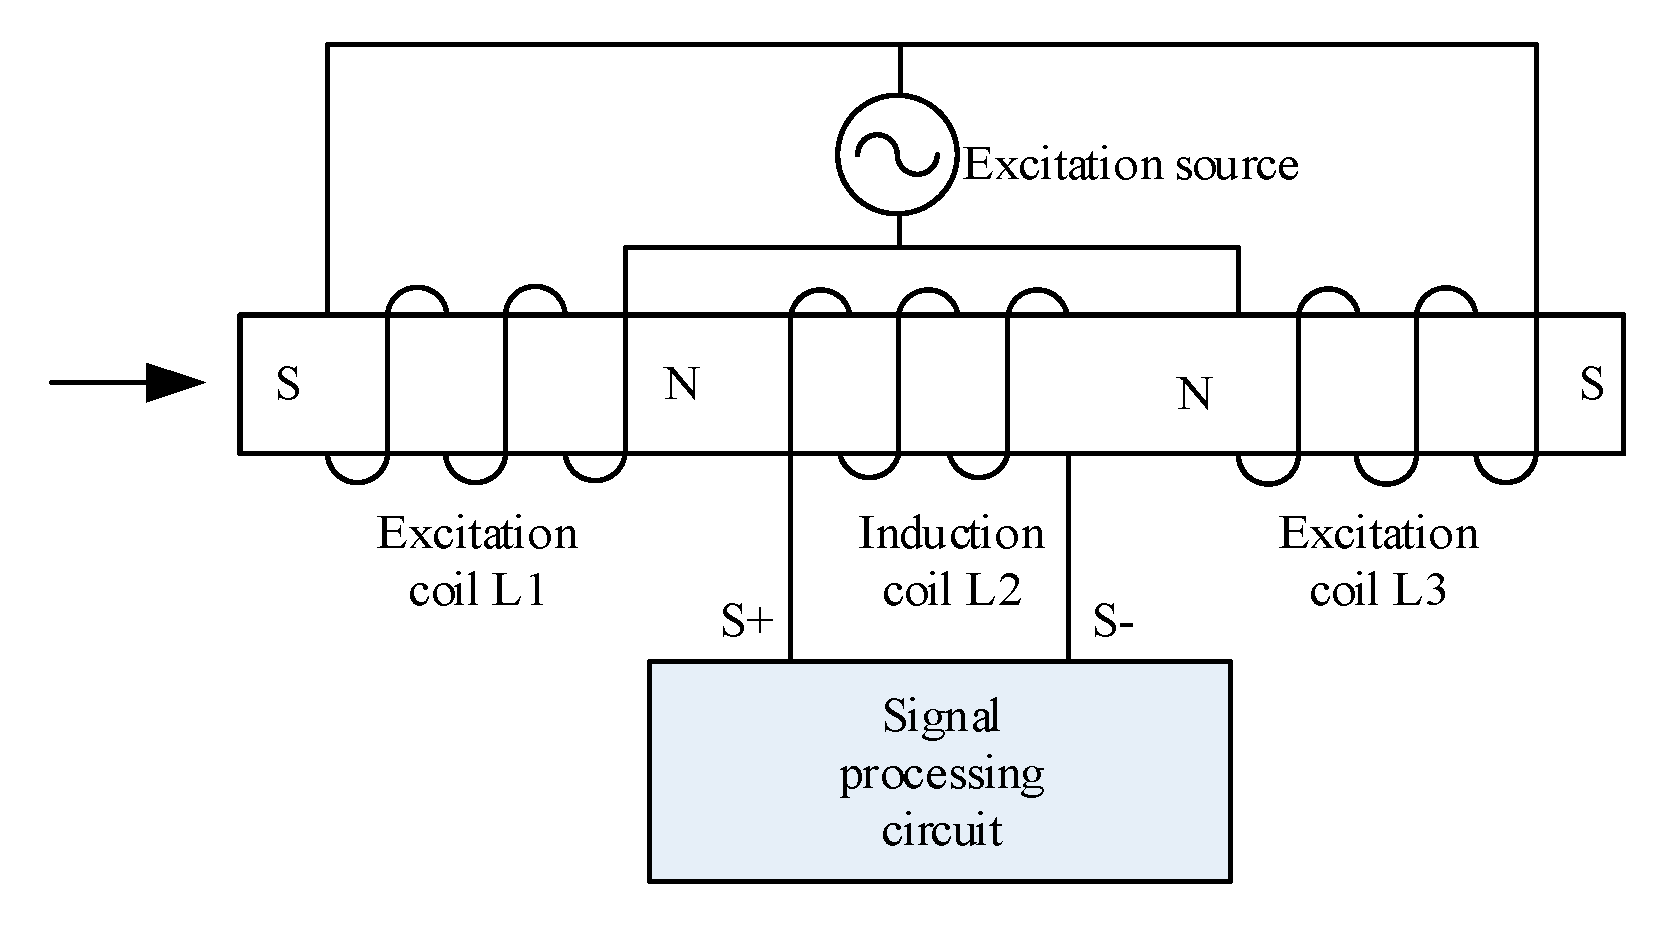
2. The Principle of Operation of the Three-Coil Induction Abrasive Particle Sensor

2.1. Measurement Principle of the Three-Coil Induction Abrasive Particle Senor

According to Faraday’s principle of electromagnetic induction, the magnitude of induced electromotive force is proportional to the rate of change of the magnetic flux passing through the conductor circuit. There are three groups of induction coils wound on the same magnetically inert pipe, two of which are driven by the excitation AC power and generate opposite magnetic fields. The magnetic fields at the induction coil in the central position of the pipe counteract each other with a net of approximately zero. The sensor coil is followed by an amplification sampling circuit. As the tiny particles in the oil in the pipe pass through, the asymmetry of the magnetic field is induced leading to the generation of the induction electromotive force in the induction coil [21]. The opposite effects of ferromagnetic and antimagnetic materials on the magnetic field lead to the opposite phases of the output signal of the induction coil, which can be used to distinguish the type of the abrasive particles in the oil. The magnitude of the induced electromotive force and waveform frequency can be used to discern the size of the particles, the flow velocity, etc. The working principle of the coils is shown in Figure 1.
The induced electromotive force output from an induction coil can be mathematically expressed as:
E max = K μ m r a 3 v 2 r 2 + 1.236 μ m r a 2
where μm is the relative magnetic permeability of the abrasive particles, ra is the equivalent radius of the spherical metal abrasive particle, v is the moving velocity of the abrasive particle in the oil pipe (can be approximately replaced by the flow velocity of the lubricating oil), r is the radius of the oil pipe, K is a parameter relating to the coil parameters and the relative position of the abrasive particles in the pipe, expressed as:
K = 3.708 π r 4 μ 0 N 1 ( n m ) I m [ r 2 + ( n m ) 2 ] 5 / 2
where μ0 is the vacuum permeability, n is the distance from the excitation coil to the induction coil, m and N1 are the length and number of the excitation coil, respectively. I is the electric current passing by.
The winding inductance is schematically shown in Figure 2. The skeleton of the induction coils is made of polyether ether ketone (PEEK) resin which has high resistance to elevated temperature, chemical corrosion, flame, peel, and impact.

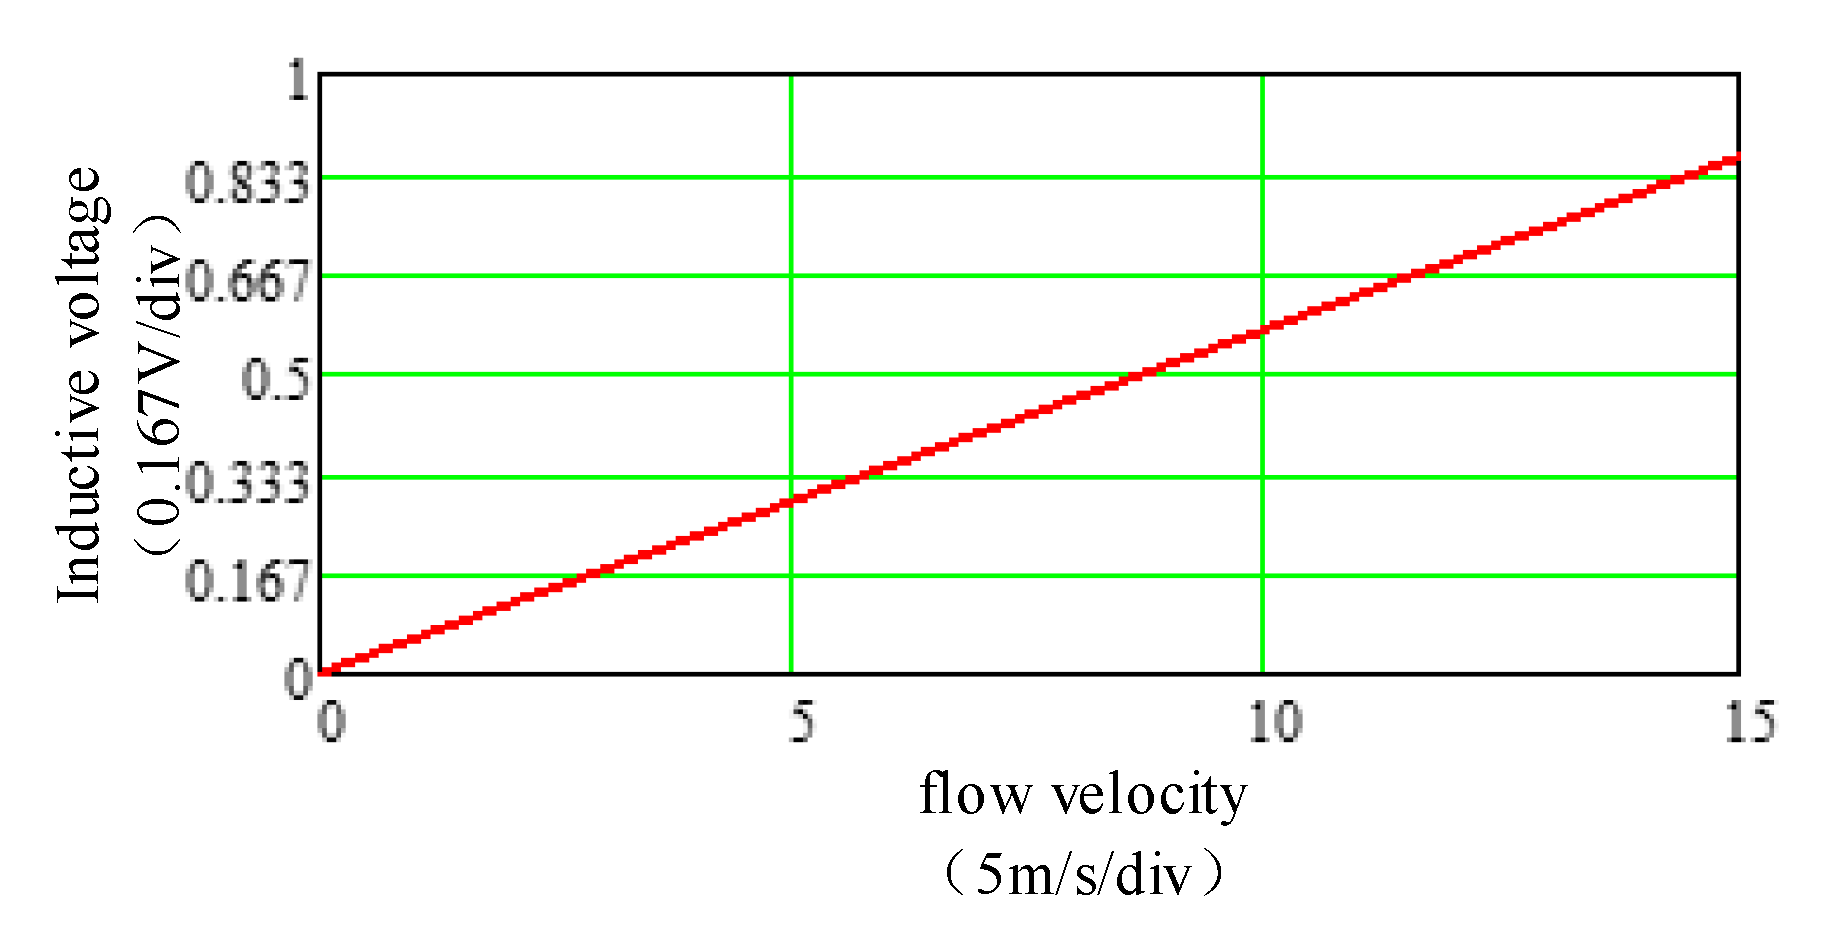
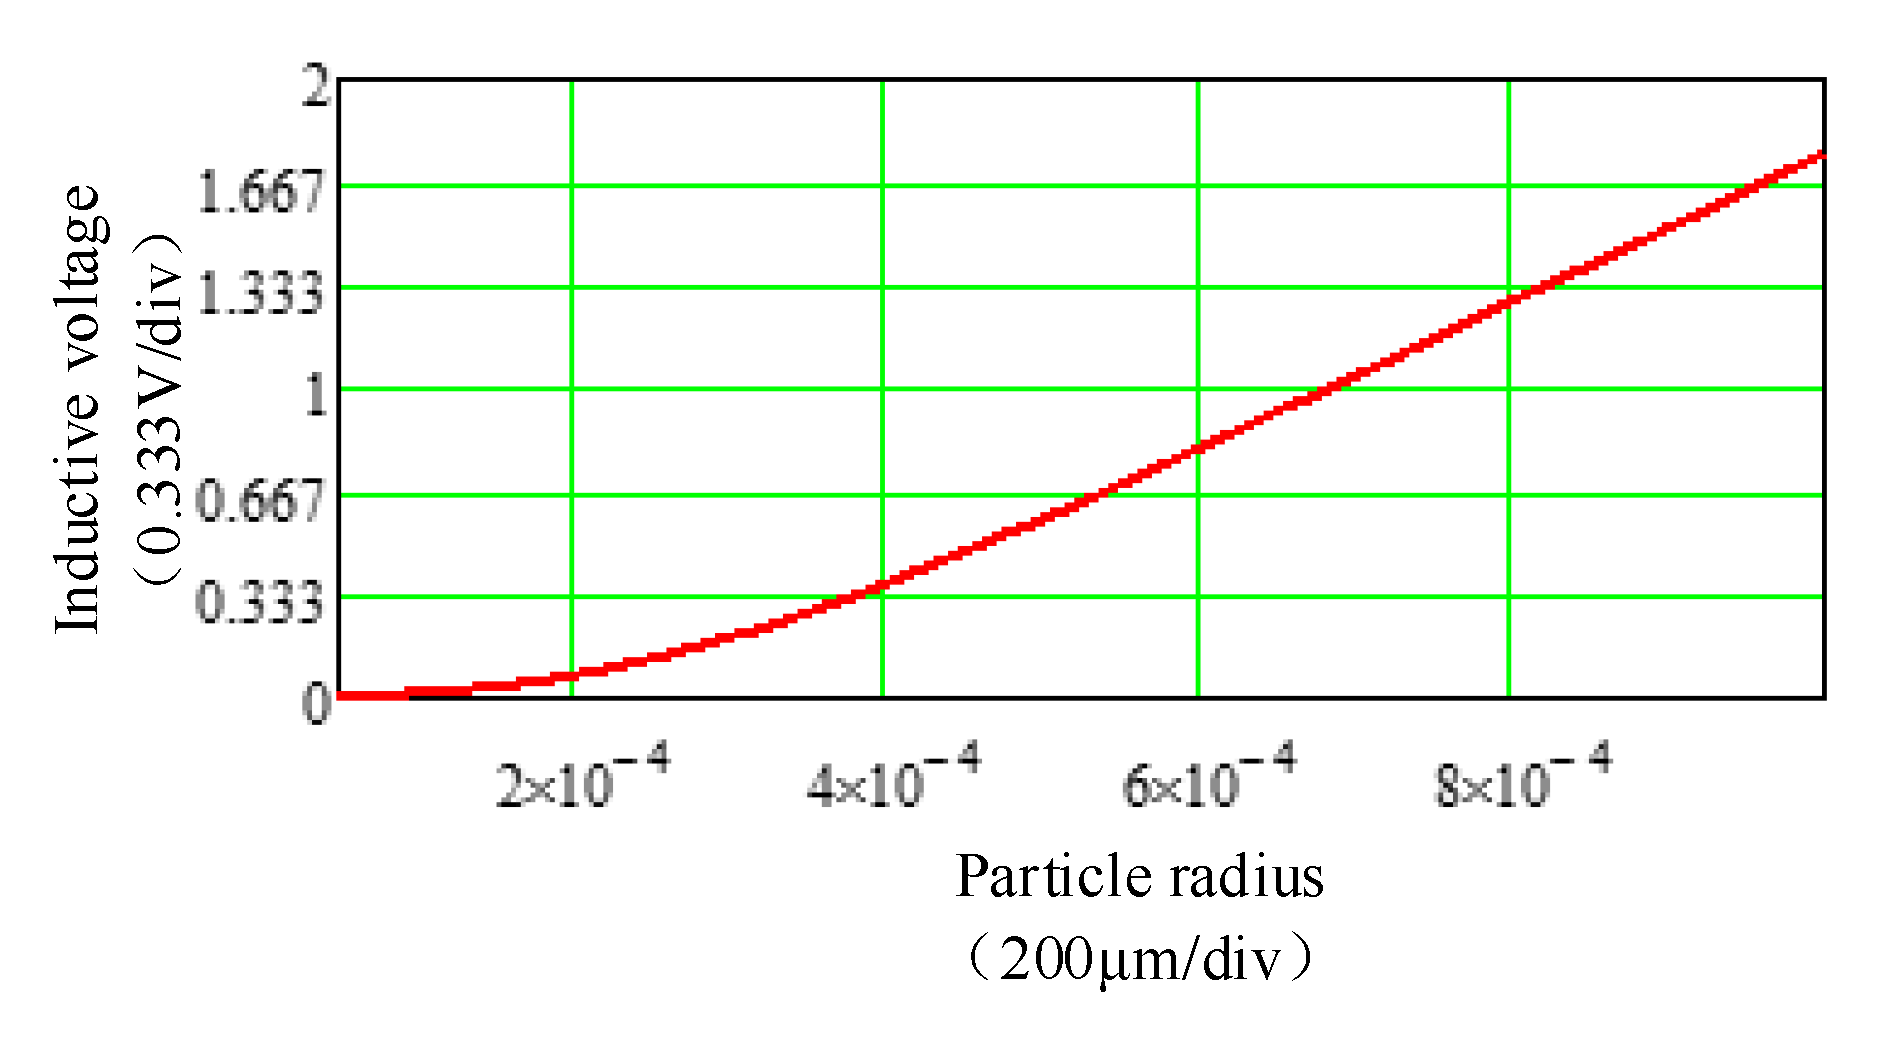
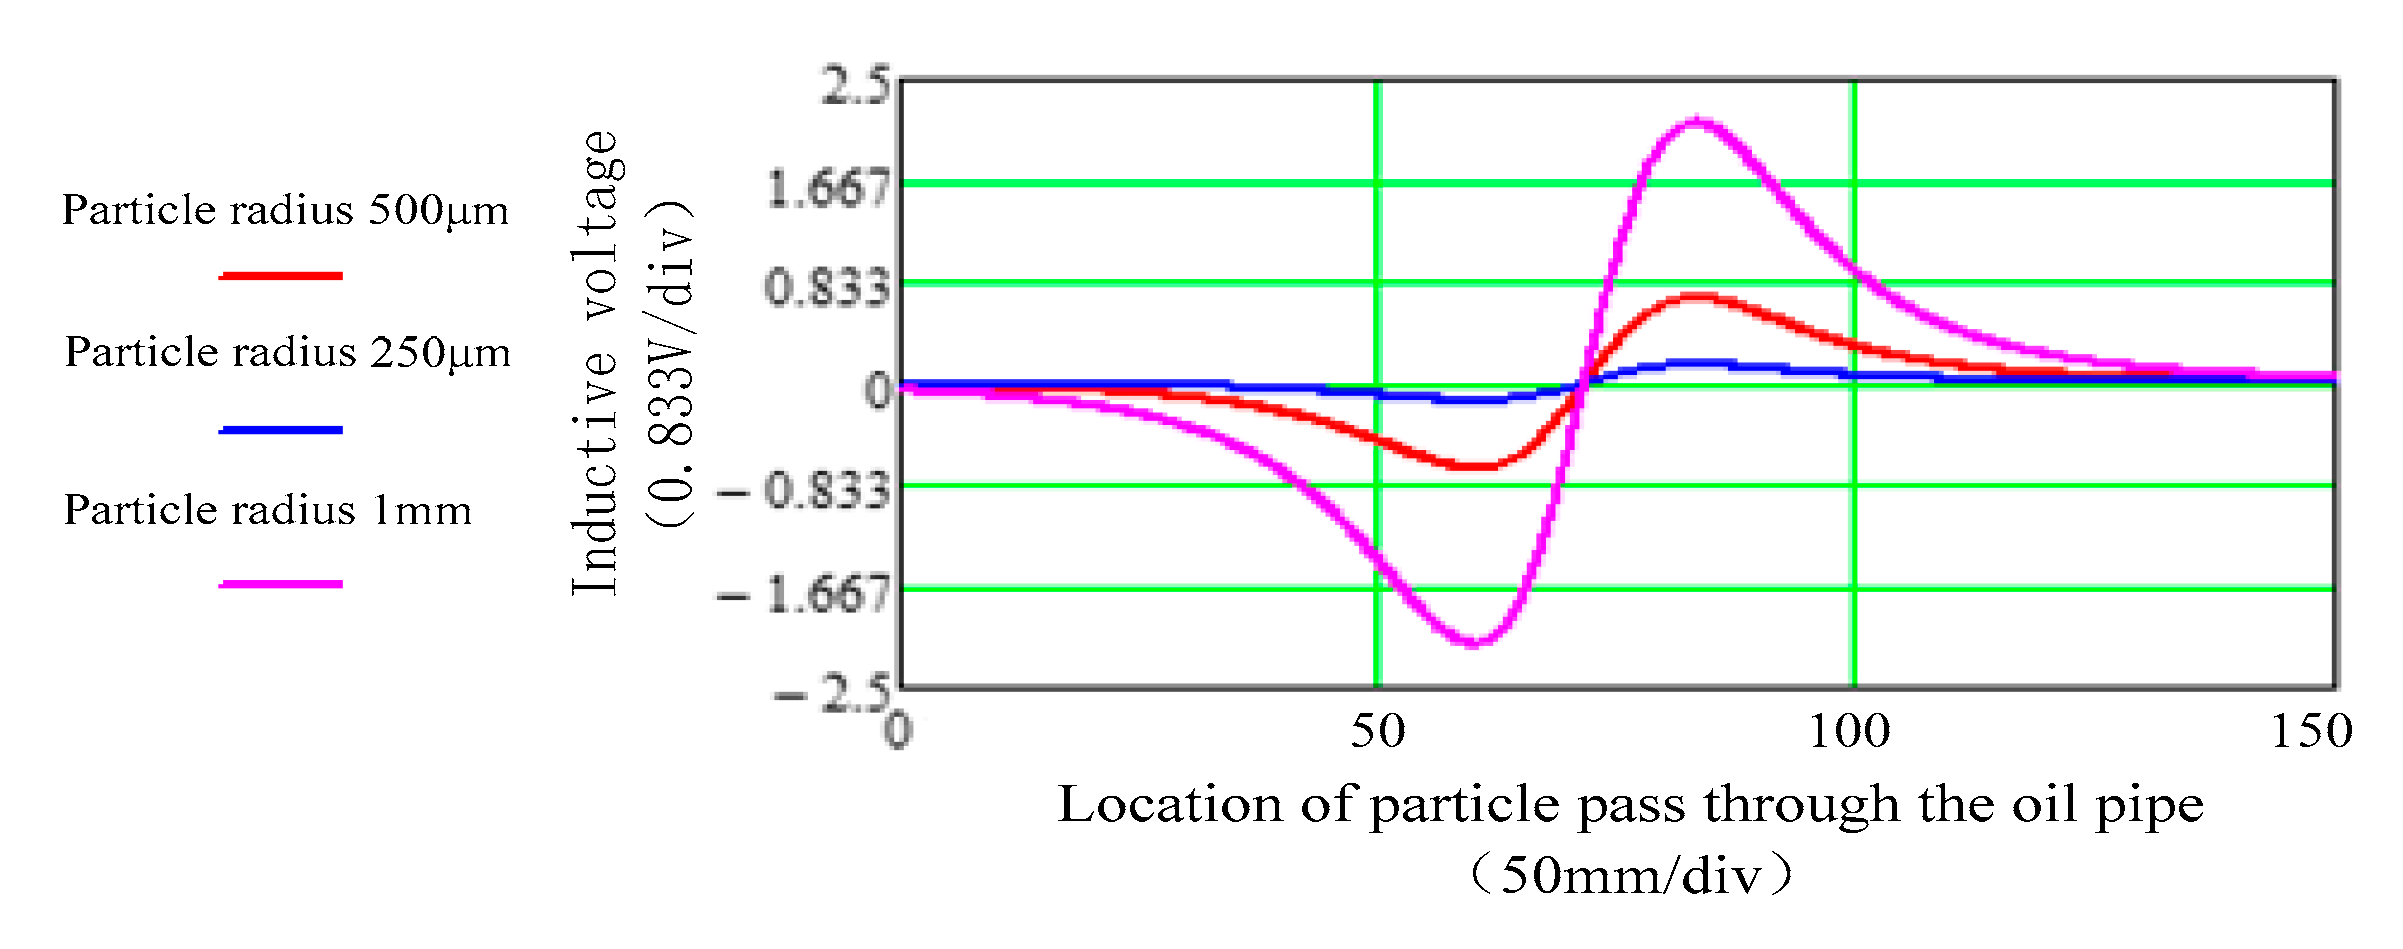
2.2. Analysis of Sensor Output Characteristics

Substituting the values of the parameters in Figure 3 and Table 1 into Equations (1) and (2) gives the actual characteristic curves of the winding pipe.
Because the abrasive particles are relatively small (several hundred microns in diameter), the velocity of the abrasive particles in the oil pipe is approximately equal to the oil flow velocity. It can be seen from Equation (1) that the output voltage is proportional to the oil flow velocity (Figure 4).
The relationship between the output voltage of the sensor and the radius of the abrasive particles for a constant flow velocity v is shown in Figure 5. When the particles are less than 300 μm in radius, it is strongly non-linear; when the radius of the particle is larger than 300 μm, it is basically linear. Overall, the output voltage increases with the increase in the radius of the abrasive particles.
For a given flow velocity, the waveform of the induced electromotive force of different-sized metal particles passing through different positions of the pipe is shown in Figure 6. Three kinds of metal particles with diameters of 250 μm, 500 μm, and 1mm were selected for simulation. When the particles pass through the first half of the pipe, the magnetic flux increases, E < 0; when they are in the middle position, the increase in magnetic flux is 0, E = 0; when they are in the second half of the pipe, the magnetic flux decreases, E > 0.

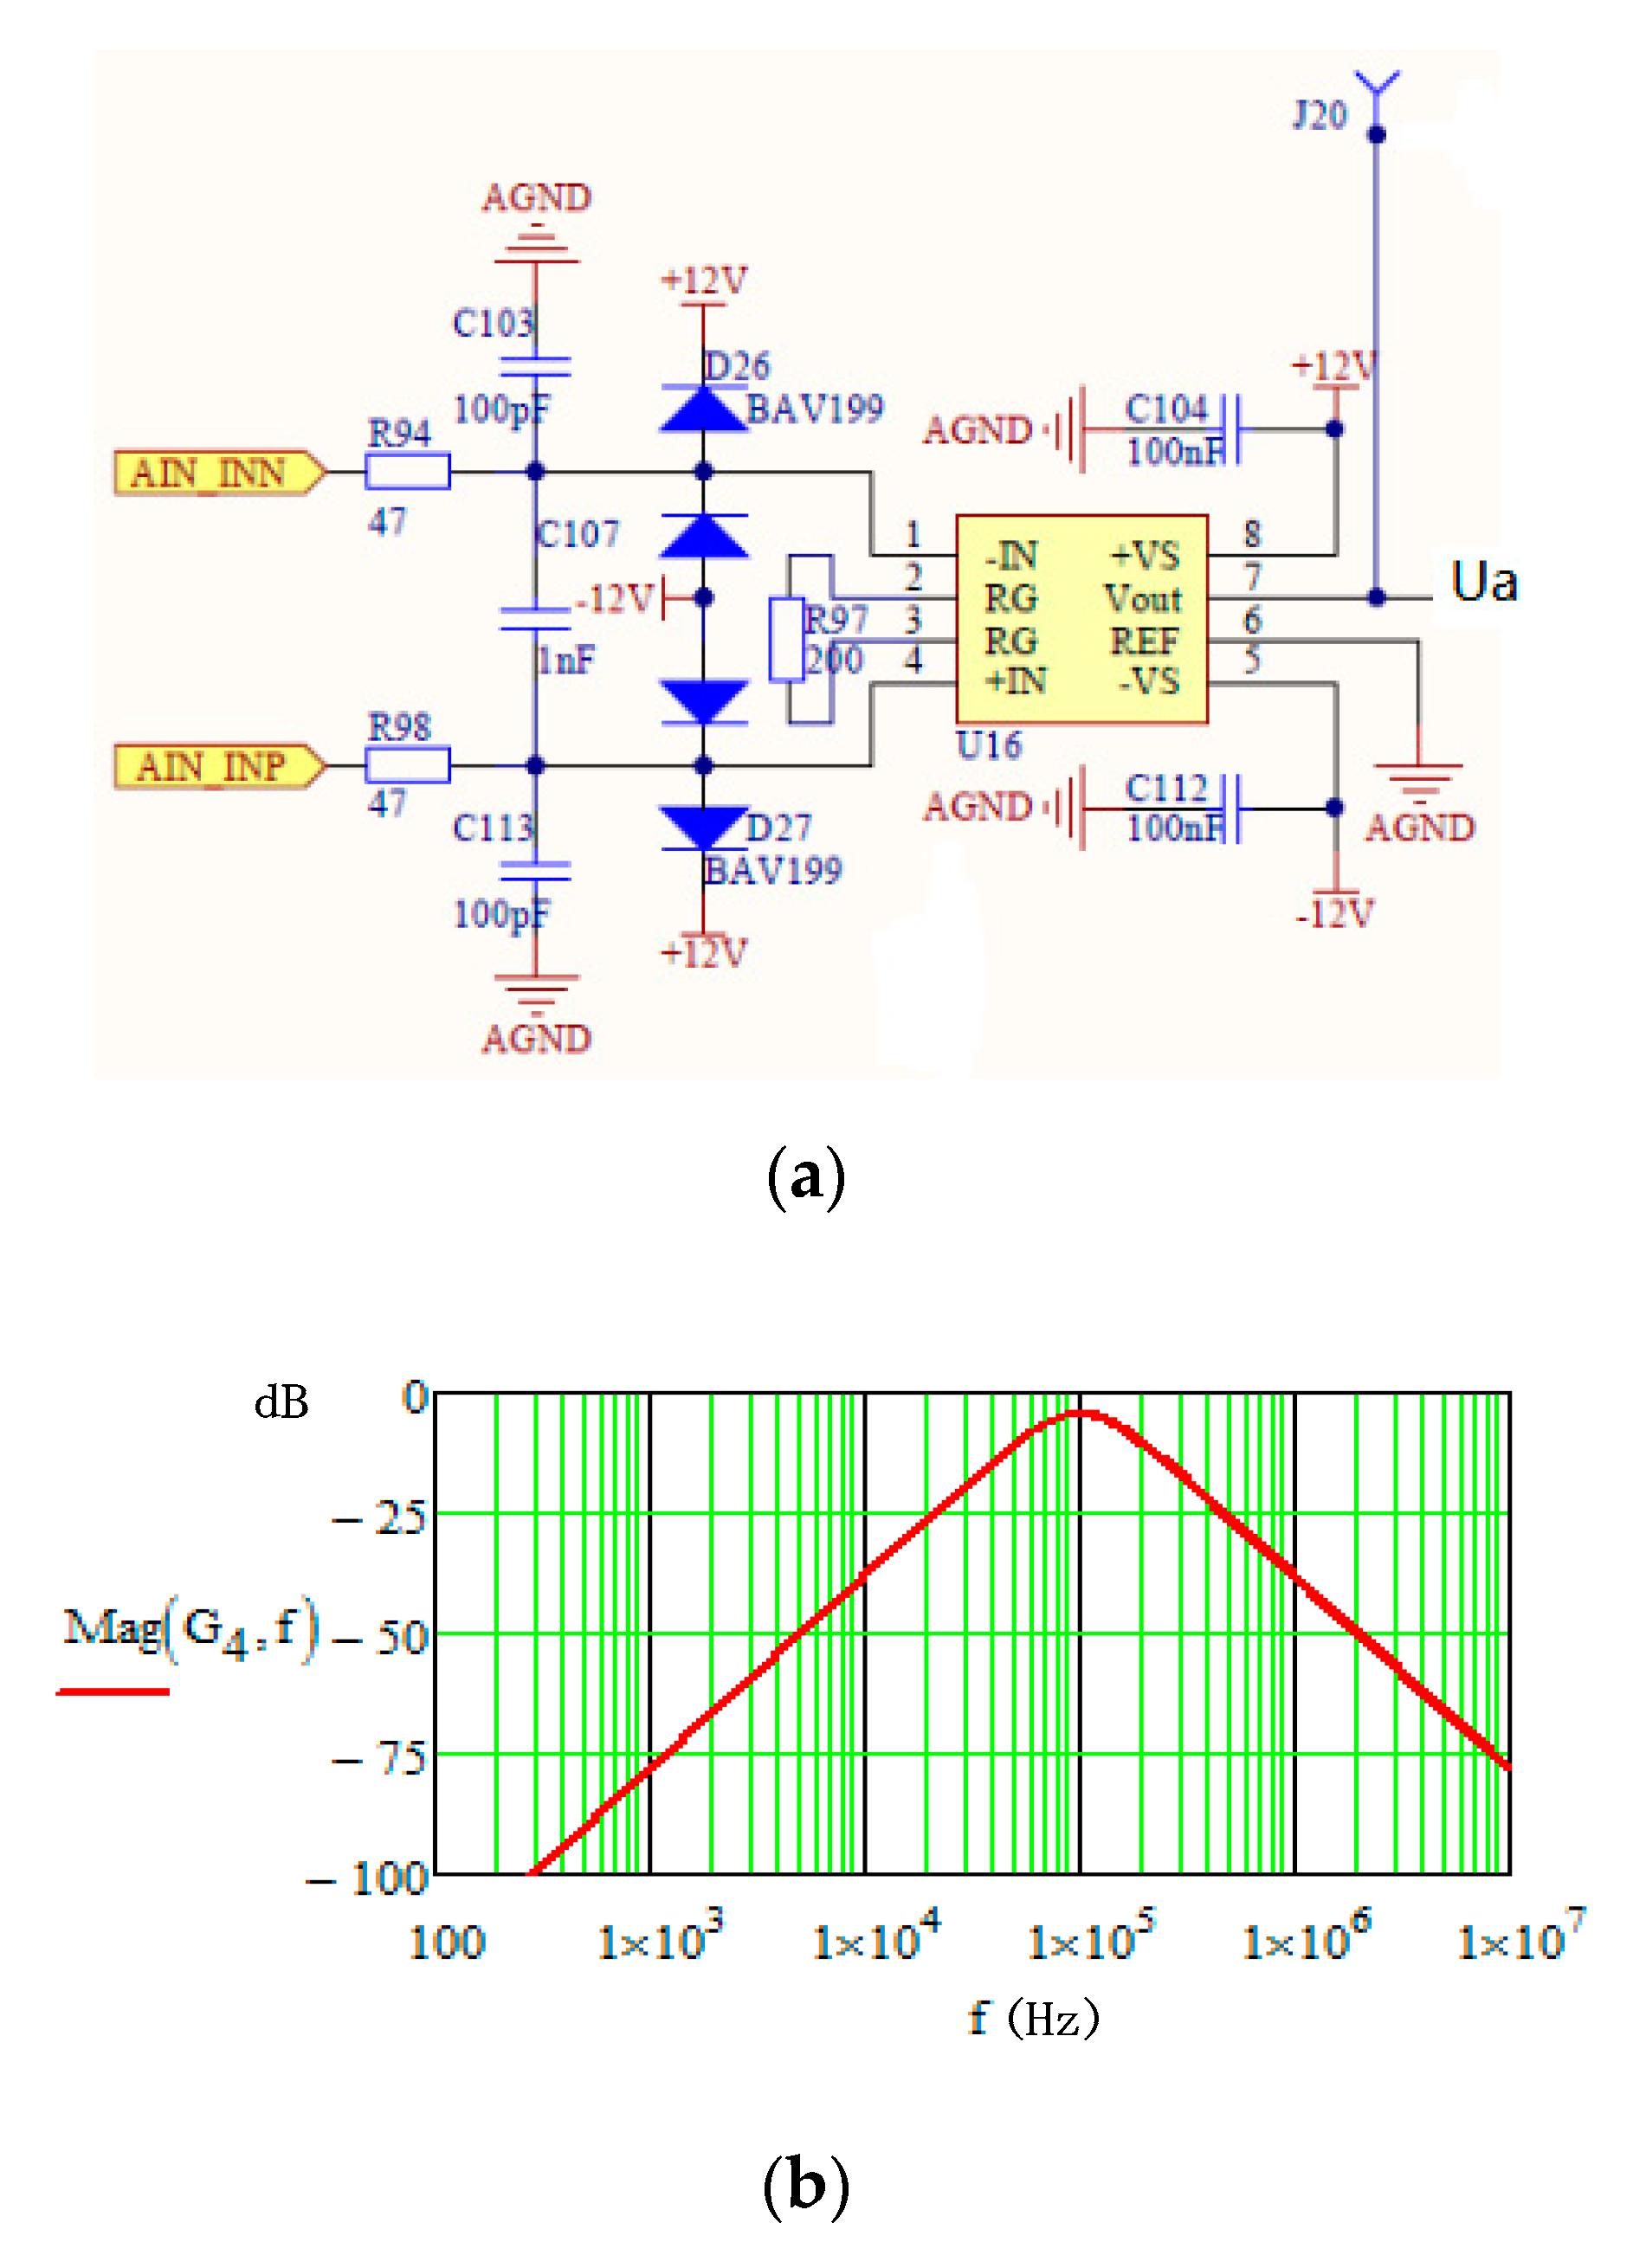
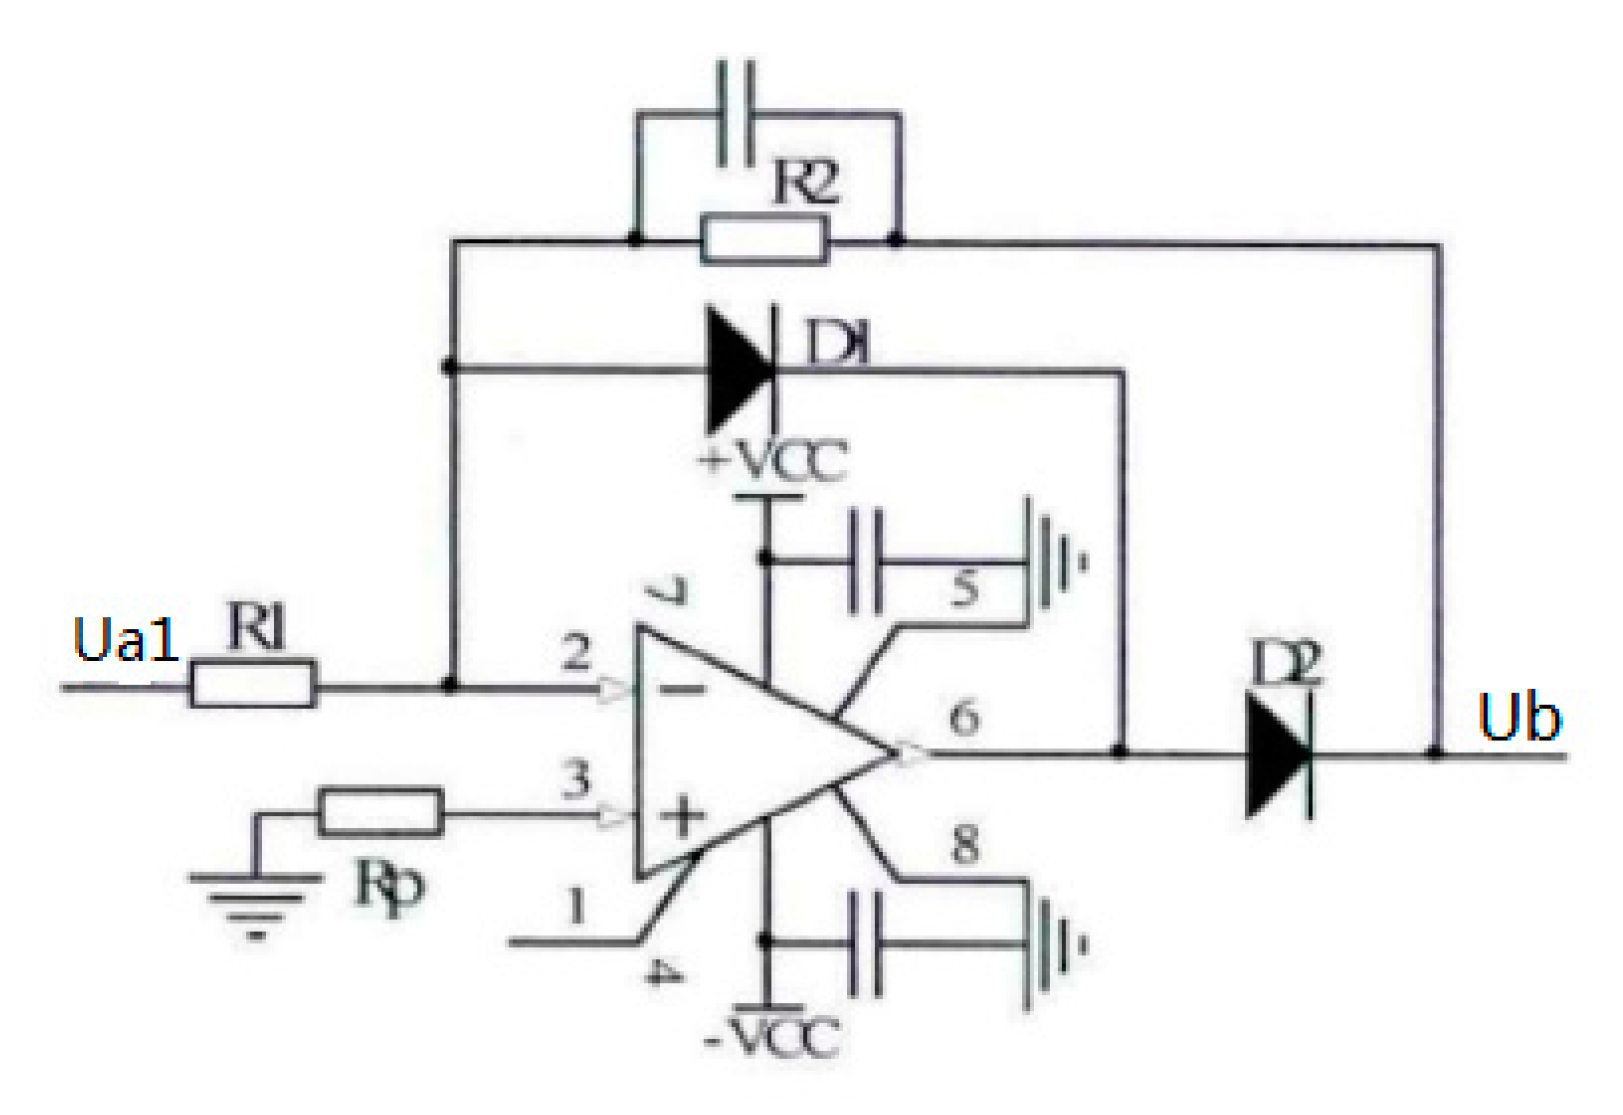
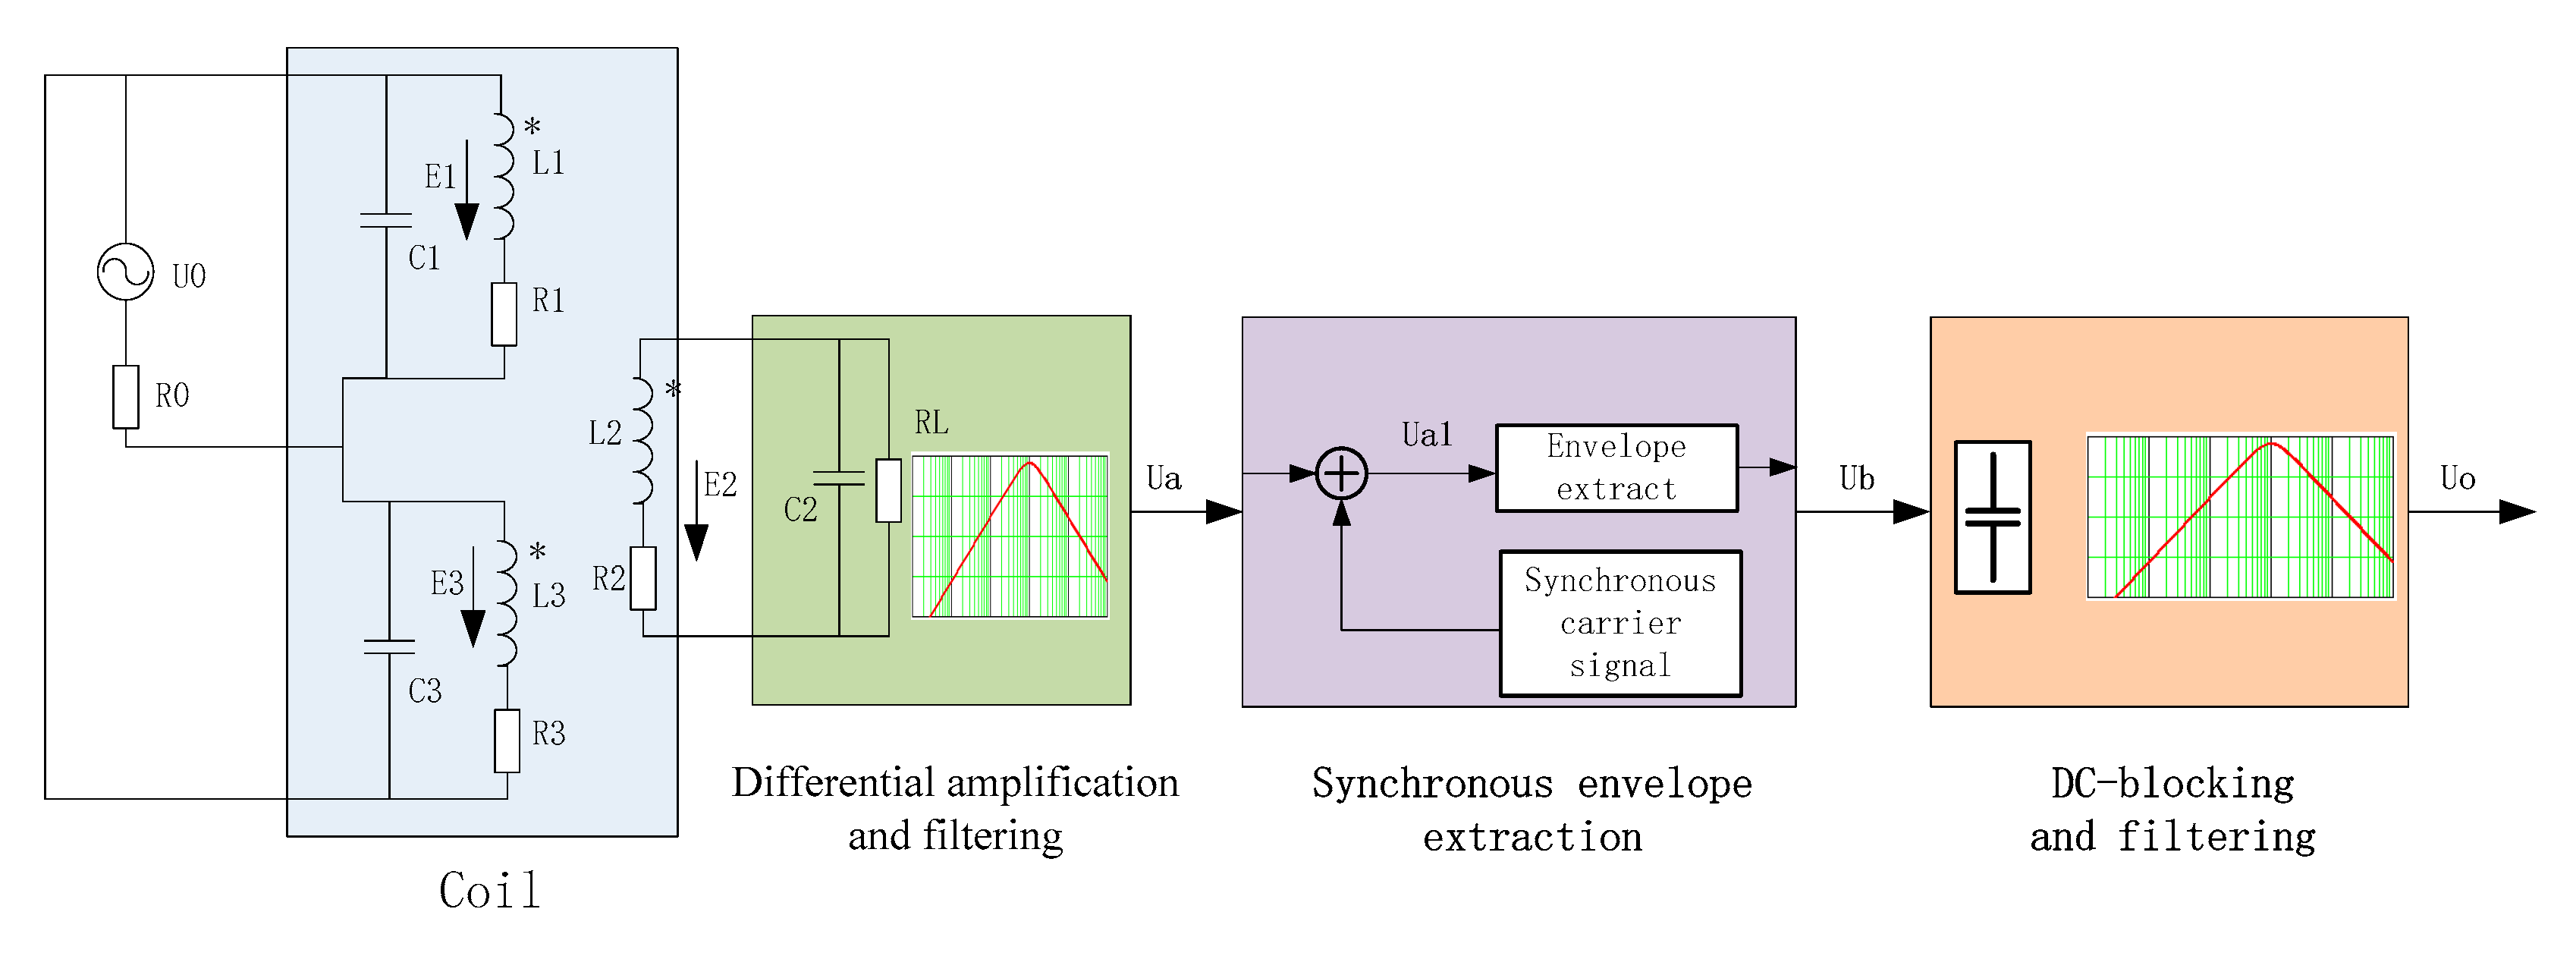
3. Design Method of the Detection Circuit of the Abrasive Particle Senor

Measurement Method

In Figure 1, the excitation source provides a stable sinusoidal signal to the excitation coil and generates a weak voltage signal through the sensor coil, as shown in Figure 6. The detection of the metal particle signal is then completed through the pre-stage differential amplification and filtering (output Ua), the synchronous envelope extraction circuit (output Ub) and the post-stage amplification, DC-blocking, and filtering circuit. The filtered signal Uo was sent to the DSP processor for data analysis. The schematic diagram is shown in Figure 7.
Since the coil output induced electromotive force is a μV ~ mV voltage, the preamplifier filter circuit plays a key role in the extraction of the whole signal. In order to avoid amplifying the noise of the front stage, the amplification gain of the front stage is relatively small (<100 times), and the rear stage amplifier is required to coordinate and adjust the required magnification factor. The system adopts a differential amplifier with low temperature drift and low noise, and uses the symmetry of the circuit parameters and negative feedback of the differential amplifier to effectively stabilize the static operating point, which has a strong suppression effect on the signal of the common mode input state. In addition, under the symmetry condition of the three-coil inductance sensor, the differential preamplifier circuit has a strong ability to suppress zero drift and reduce noise interference. The prefilter adopts a bandpass filter whose central frequency is designed to be close to the frequency of the excitation source. The bandwidth is set as 20% of the central frequency in order to filter the clutters. In this example, the frequency of the excitation source is 100 kHz, the bandwidth of the bandpass filter is 20 kHz, the low-frequency cut-off frequency is 90 kHz, and the high-frequency cut-off frequency is 110 kHz. The front-stage differential amplification filter circuit is shown in Figure 8.
The signal output through the preamplifier is an AC signal. The weak AC voltage signal Ua is converted into a 100-kHz high frequency voltage, which first added the 100 kHz synchronous carrier offset voltage to get the modulated signal Ua1, then pass the through the synchronous envelope rectifier circuit to extract the envelope of the low-frequency particle signal Ub. The synchronized envelope rectifier circuit is shown in Figure 9. The rectifier circuit is composed of operational amplifier and diode. Because of the high open-loop gain of the operational amplifier, the dead region voltage of the detection diode can be overcome with a small input voltage to achieve synchronous rectification.
The output signal of the synchronous rectifier Ub is then processed by the DC blocking circuits and low-pass filter circuit successively to obtain the low-frequency pulsation signal Uo. The voltage waveforms of Ua, Ua1, Ub, and Uo are respectively shown in Figure 10 where the key waveforms are locally amplified.

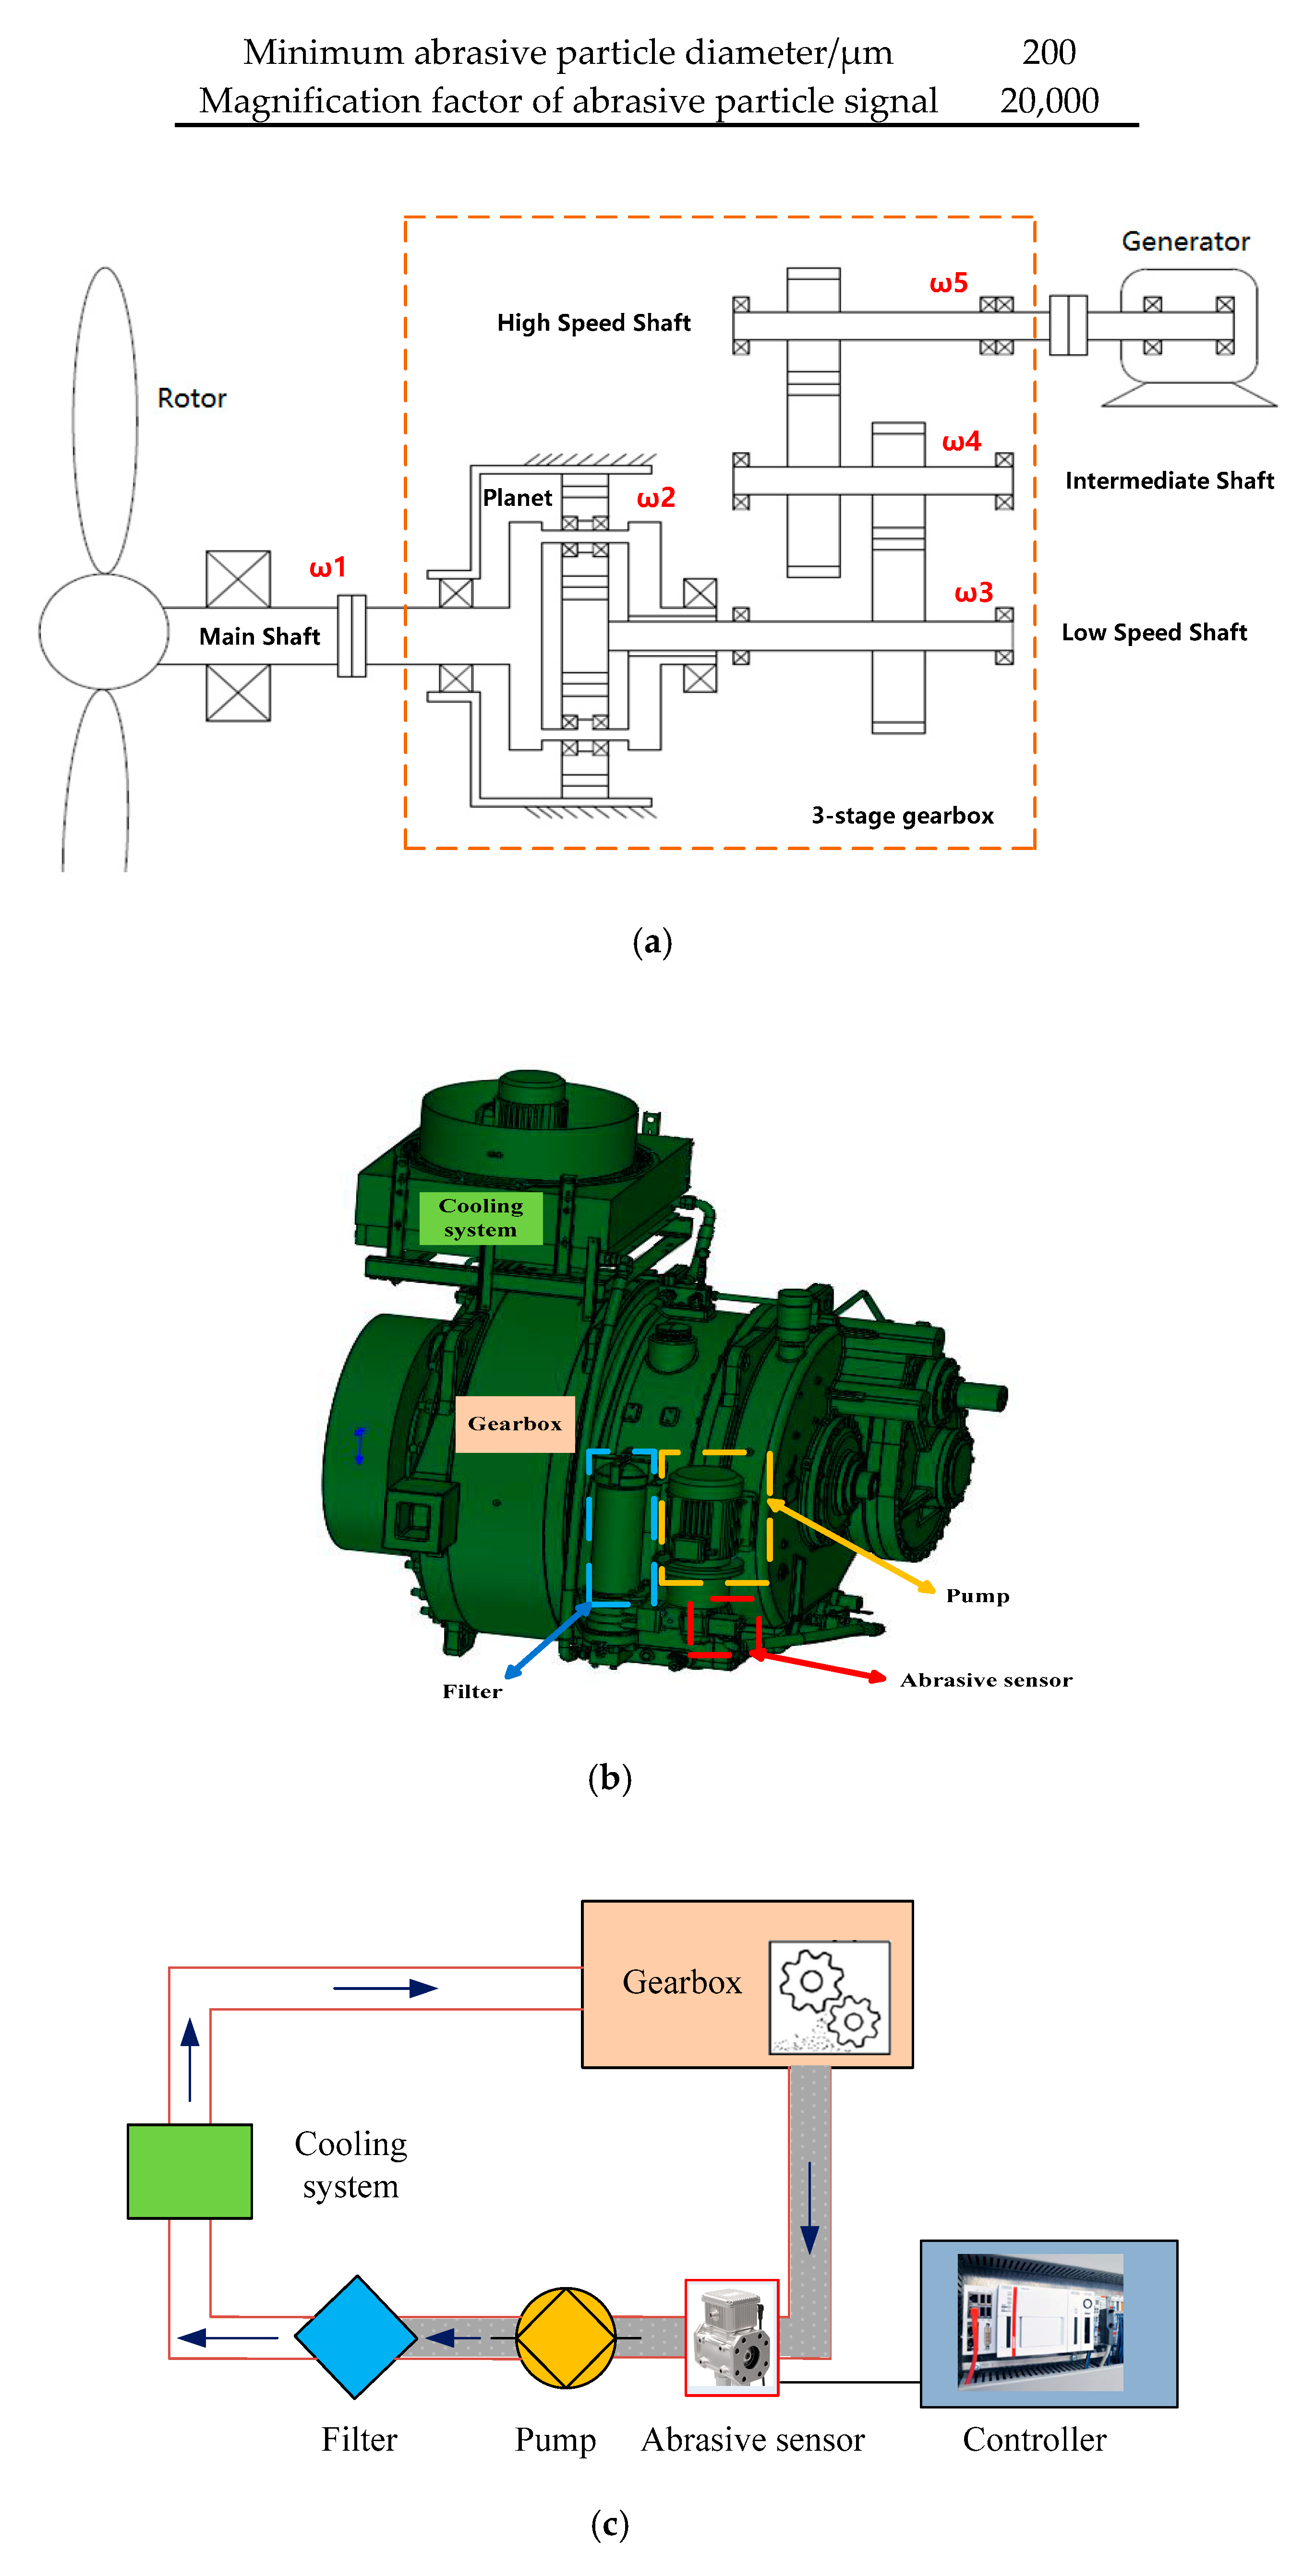
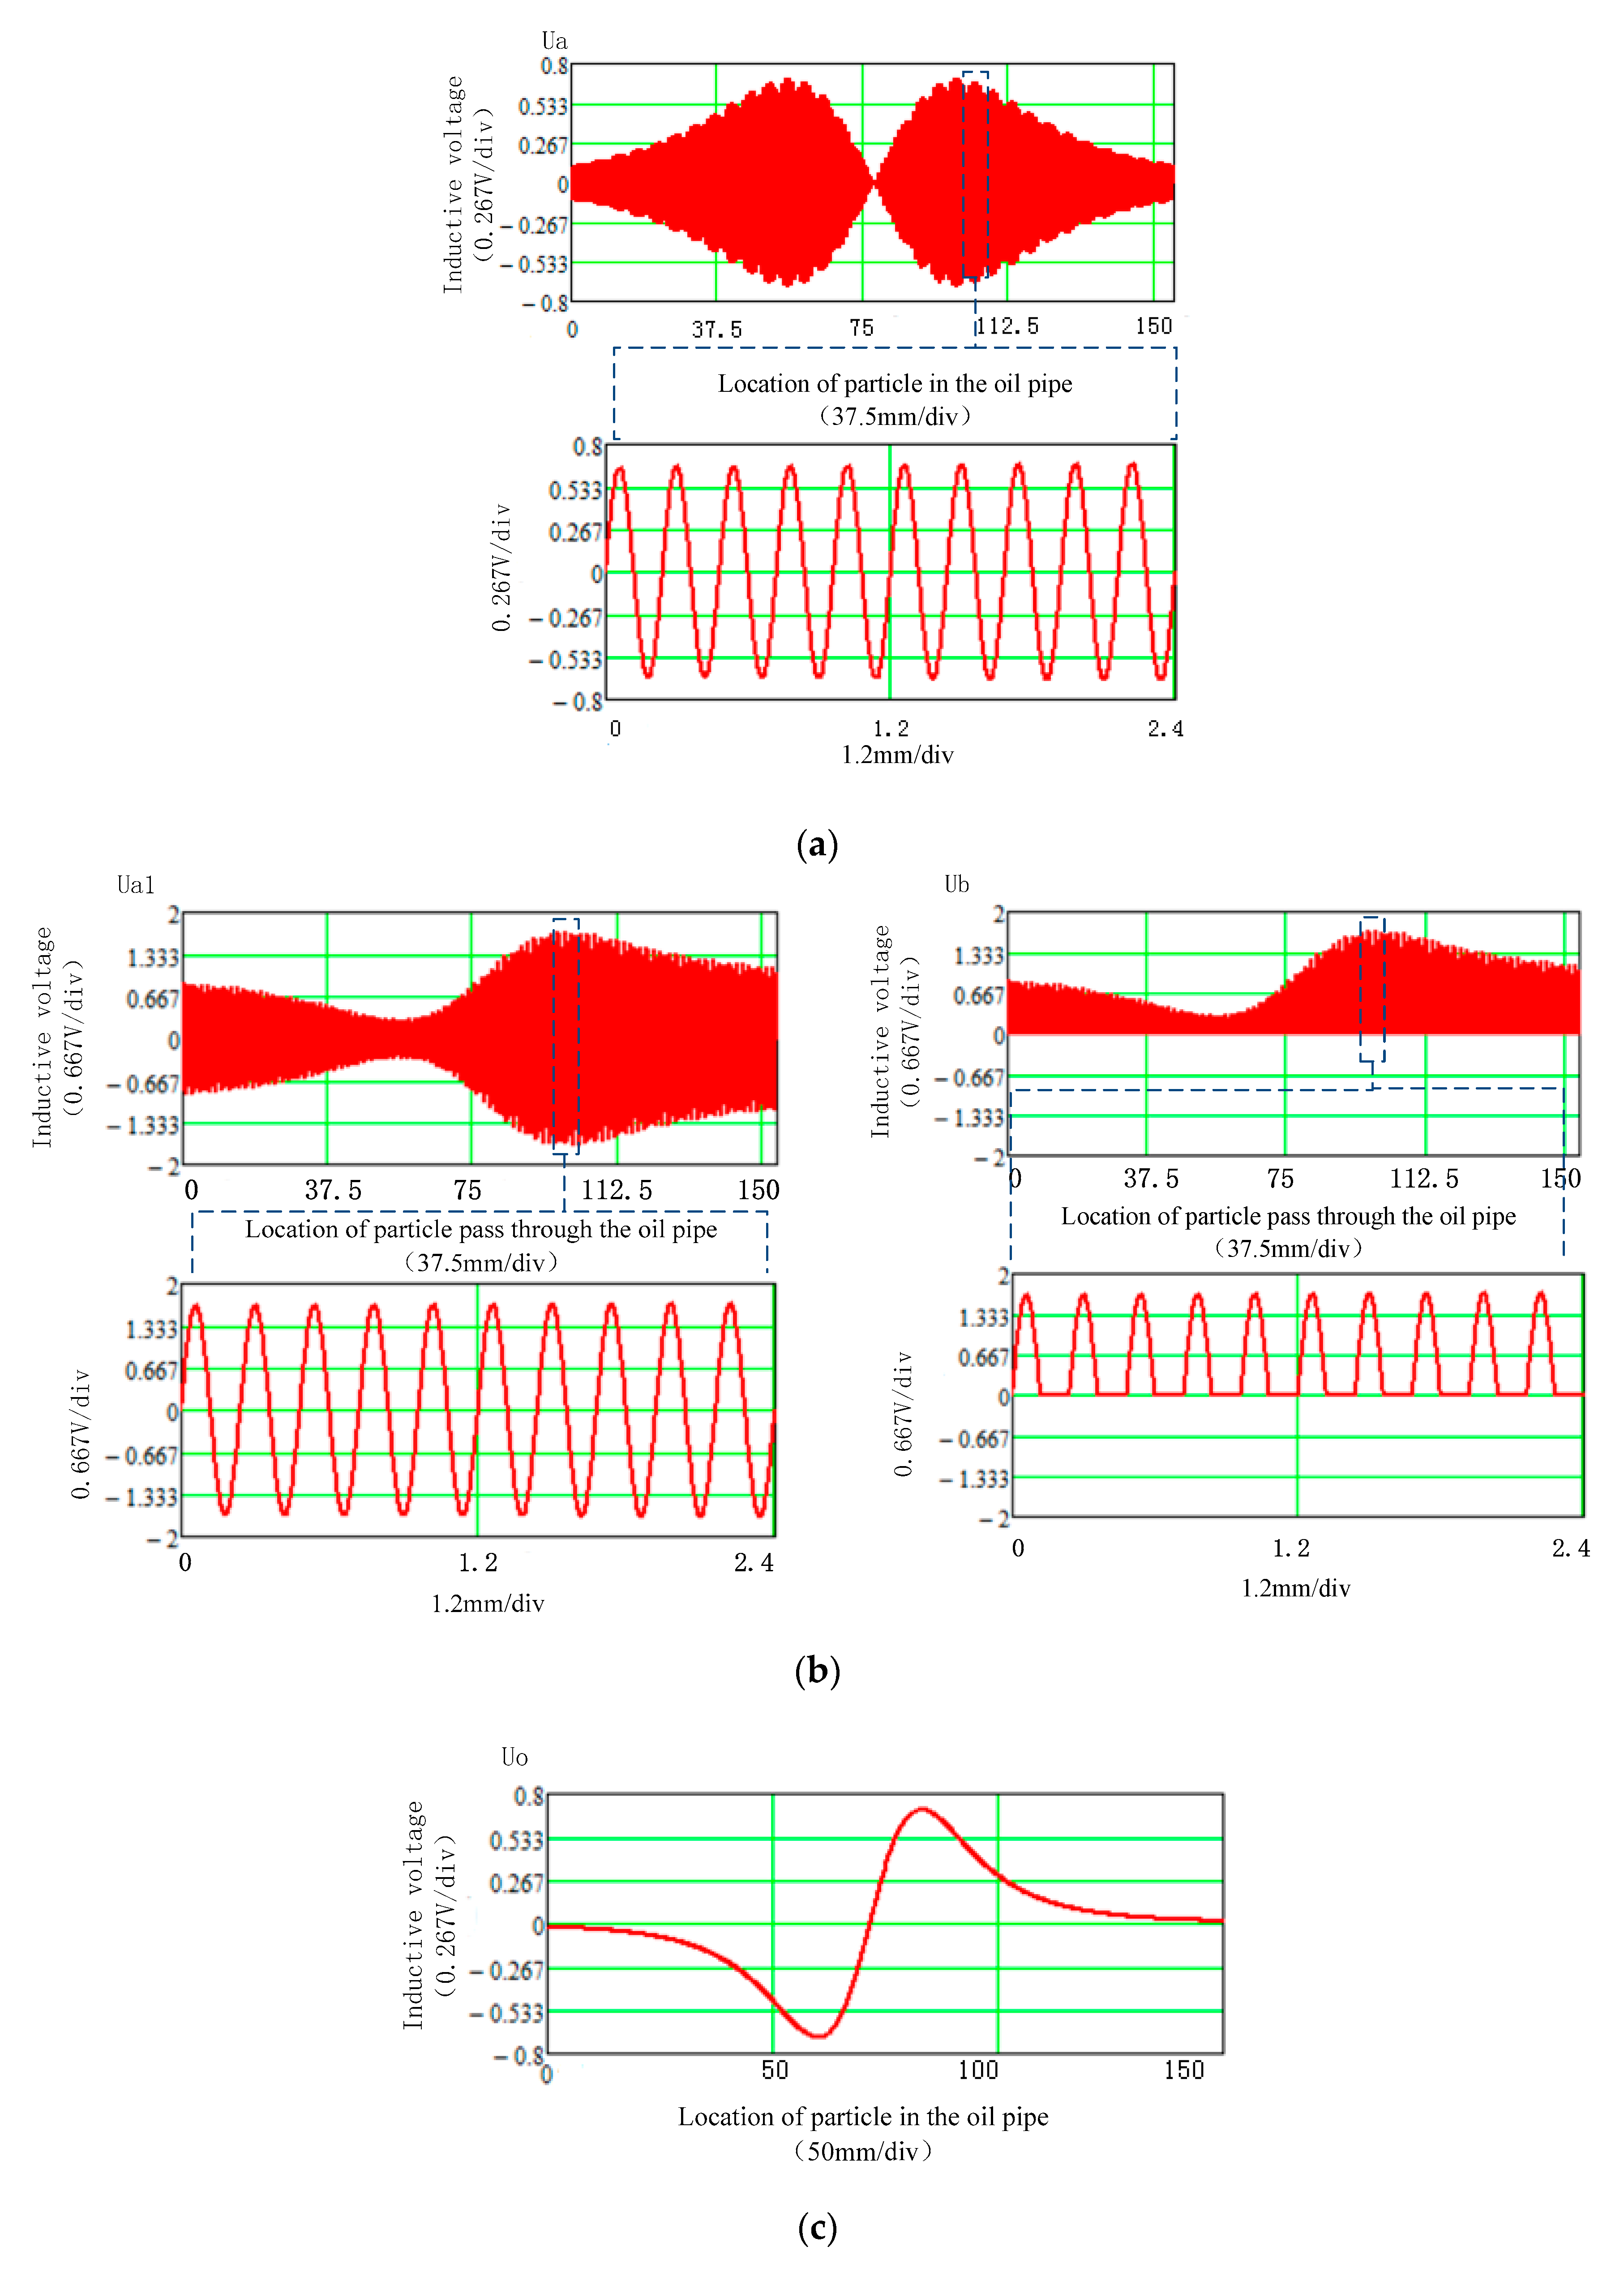
4. Experimental Verification and Data Analysis

In order to conduct a field operation test and further verify the effectiveness of the proposed design method for the abrasive sensor, a newly designed abrasive sensor was installed in the gearbox of a grid-connected 2 MW wind turbine to conduct field operation test and verification. The test wind turbine drivetrain structure layout and installation position of the abrasive sensor are illustrated in Figure 11. The test gearbox uses three stages to obtain an overall gear ratio of 1:131. As shown in Figure 11a, it is composed of one low-speed planetary stage and two parallel shaft stage. The planetary stage accommodates three planet gears, and parallel shaft (i.e., low speed, intermediate, high speed) in the gearbox which are supported by a cylindrical roller bearing. The abrasive sensor was installed between the outlet pipe of the gearbox and the circulating pump. The abrasive particles generated during the operation of the gearbox circulated in the oil path and were detected by the sensor, and the information was then transmitted to the main controller of the wind turbine. The abrasive particles were filtered by the filter in the pump and the clean oil cooled by the cooling system and then returned to the gearbox oil circuit for further circulation.
The abrasive sensor was connected to the main controller of the wind turbine using RS485 bus communication mode. Data relating to the number and size of the abrasive particles detected in the oil path of the gearbox were constantly transmitted to the main controller. By monitoring the increment in the number and size of the abrasive particles, the working status of the gearbox could be predicted. When the wind turbine main controller received the early warning signal from the abrasive sensor, it was necessary to operate the wind turbine with limited power. In serious cases, it is necessary to stop the wind turbine immediately for a comprehensive inspection of the gearbox to eliminate the risks of pitting corrosion, tooth crack, tooth collapse, etc., and to carry out corresponding maintenance.
According to the operation experience, the fault warning and judgment condition of the abrasive sensor can be divided into two stages. The first stage is when the cumulative number of abrasive particles within 24 h is more than 80 and less than 150 as well as the number of abrasive particles within 1 h is less than 40. The second stage is when the cumulative number of abrasive particles within 24 h is more than 150 or the number of abrasive particles within 1 h is more than 40. The machine will be shut down and the gearbox will be opened for inspection.
Table 2 lists the parameters of the experimental wind turbine and related parameters of the gearbox and the abrasive sensor. The test generator set has been running for 5 years, and the gearbox has fully experienced the run-in period and entered the wear period. Thus, it is necessary to monitor the running state of the gearbox for the whole life cycle through the addition of the abrasive particle sensors. The diameter of the oil pipe in the system is 40 mm, the rated oil speed in the pipe is 2.3 m/s, and the maximum oil temperature is 75 °C.
Figure 12 shows the result of the abrasive sensor in the early warning process. Figure 12a records the cumulative increase curve of the number and volume of abrasive particles within 10 days including the alarm time. Figure 12b shows the statistical figure of the number and volume of abrasive particles per 8 h within 10 days. It can be seen from Figure 12 that on the tenth day, the number of abrasive particles increased rapidly from 330 to 650, and both the total number of abrasive particles and the number of abrasive particles within the last 1 h reached the alarm threshold, triggering two downtime alarm faults of excessive abrasive particles and growth. Within the previous 9 days, there was also a rapid increase in the number of abrasive particles. There was also an unexpected increase in the volume of abrasive particles on the fourth day.
Figure 13 shows the actual waveform of some abrasive particles in the early warning process. The waveforms of 280 μm and 1-mm-diameter abrasive particles and the two different sized abrasive particles passing through the sensor are respectively shown in Figure 13a–c. In order to avoid the false judgment of particles caused by noise, the original signals of particles were transformed by wavelet to get the filtered waveform [22]. According to the shape of the waveform peaks, it can be accurately determined that the abrasive particles are composed of metal paramagnetic materials. The bottom noise level and the time width of the abrasive particle waveforms are consistent with the system parameters, indicating that the sensor is operating well with accurate detection.
Figure 14 shows the results of the gearbox unpacking inspection. It was found that obvious cracks were generated on the high speed shaft pinion. The ratio of this gear is 1:5.23 and the nominal rotation speed of the shaft is 1800 rpm. Since no other fault points were found, and considering that the wind turbine has been in operation for 5 years, the possible failure cause was fatigue fracture according to the fault phenomenon. If the gearbox continued to run without timely shutdown, there would be a risk of sudden tooth breakage and then the whole gearbox would be scrapped, leading to heavy losses.
It can be seen that the design method of the abrasive particle sensor is correct and has good performance and application value.

5. Conclusions

In this paper, an on-line monitoring sensor of abrasive particles based on three-coil inductance was studied. By analyzing the working principle of the sensor, explaining the design method of the detection circuit, and testing and verification of the wind turbine, it was manifested that the number and cumulative volume of abrasive particles would increase substantially before the occurrence of the gearbox faults. By setting the corresponding monitoring logic and algorithm of abrasive particle, warning on gearbox faults can be obtained in advance, this can greatly reduce the maintenance and shutdown costs for wind turbines caused by gearbox faults, and thus improve the annual power generation of the wind turbine.

Author Contributions

Conceptualization, L.Z. and Q.Y.; methodology, L.Z.; software, L.Z.; validation, L.Z.; formal analysis, Q.Y.; investigation, L.Z.; resources, L.Z.; data curation, Q.Y.; writing—original draft preparation, L.Z. and Q.Y.; writing—review and editing, L.Z. and Q.Y.; visualization, L.Z.; supervision, L.Z.; project administration, L.Z.; funding acquisition, L.Z. All authors have read and agreed to the published version of the manuscript.

Funding

This research was funded by The Natural Science Foundation of the Jiangsu Higher Education Institutions of China, grant number 19KJB470033 and Wuxi Soft Topic of science and Technology, grant number KX-19-C95.

Conflicts of Interest

We declare that we do not have any commercial or associative interest that represents a conflict of interest in connection with the work submitted.

References

  1. Razavieh, A.; Sedaghat, A.; Ayodele, R.; Mostafaeipour, A. Worldwide Wind Energy Status and the Characteristics of Wind Energy in Iran Case Study: The Province of Sistan and Baluchestan. Int. J. Sustain. Energy 2014, 36, 103–123. [Google Scholar] [CrossRef]
  2. Sheng, S. Gearbox Typical Failure Modes Detection and Mitigation Methods; National Renewable Energy Laboratory: Golden, CO, USA, 2014. [Google Scholar]
  3. Jin, X.H.Z.; Cheng, F.; Peng, Y.Y.; Qiao, W.; Qu, L.Y. A comparative study on Vibration- and current-based approaches for drivetrain gearbox fault diagnosis. In Proceedings of the 51st IEEE Industry Applications Society Annual Meeting, Portland, OR, USA, 2–6 October 2016; pp. 1–8. [Google Scholar]
  4. Salameh, J.P.; Cauet, S.; Etien, E.; Sakout, A.; Rambault, L. Gearbox condition monitoring in wind turbines: A review. Mech. Syst. Signal Process. 2018, 111, 251–264. [Google Scholar] [CrossRef]
  5. Sanchez, P.; Mendizabal, D.; Gonzalez, K.; Zamarreño, C.R.; Hernaez, M.; Matias, I.R.; Arregui, F.J. Wind turbines lubricant gearbox degradation detection by means of a lossy mode resonance based optical fiber refractometer. Microsyst. Technol. 2016, 22, 1619–1625. [Google Scholar] [CrossRef]
  6. Cheng, F.Z.; Qu, L.Y.; Qiao, W. A case-based data-driven prediction framework for machine fault prognostics. In Proceedings of the 2015 IEEE Energy Conversion Congress and Exposition (ECCE), Montreal, QC, Canada, 20–24 September 2015; pp. 3957–3963. [Google Scholar]
  7. Sheng, S.; Veers, P. Wind Turbine Drivetrain Condition Monitoring—An Overview; National Renewable Energy Laboratory (NREL): Golden, CO, USA, 2011. [Google Scholar]
  8. Hameed, Z.; Hong, Y.S.; Cho, Y.M.; Ahn, S.H.; Song, C.K. Condition monitoring and fault detection of wind turbines and related algorithms: A review. Renew. Sustain. Energy Rev. 2009, 13, 1–39. [Google Scholar] [CrossRef]
  9. Lei, Y.; Lin, J.; Zuo, M.J.; He, Z. Condition monitoring and fault diagnosis of planetary gearboxes: A review. Measurement 2014, 48, 292–305. [Google Scholar] [CrossRef]
  10. Tang, X.N.; Xie, Z.M.; Wu, J.Q. Wind turbine gearbox fault diagnosis. J. Noise Vib. Control 2007, 27, 120–124. [Google Scholar]
  11. Feng, Y.; Qiu, Y.; Crabtree, C.J.; Long, H.; Tavner, P.J. Monitoring wind turbine gearboxes. Wind Energy 2013, 16, 728–740. [Google Scholar] [CrossRef]
  12. Zhang, Z.; Verma, A.; Kusiak, A. Fault analysis of the wind turbine gearbox. IEEE Trans. Energy Convers. 2012, 27, 526–535. [Google Scholar] [CrossRef]
  13. Zhang, X.K. Wind Turbine Vibration On-Line Monitoring and Fault Diagnosis; Baoding North China Electric Power University: Baoding, China, 2011. [Google Scholar]
  14. Sheng, S.; Herguth, W.; Drake, T. Investigation of image-based particle shape and size analysis techniques for wind turbine gearbox lubricants. Presented at the Society of Tribologists and Lubrication Engineers(STLE) 66th Annual Meeting and Exhibition, Atlanta, GA, USA, 15–19 May 2011. [Google Scholar]
  15. Bravo-Imaz, I.; Ardakani, H.D.; Liu, Z.; Garcia-Arribas, A.; Arnaiz, A.; Lee, J. Motor current signature analysis for gearbox condition monitoring under transient speeds using wavelet analysis and dual-level time synchronous averaging. Mech. Syst. Signal Process. 2017, 94, 73–84. [Google Scholar] [CrossRef]
  16. Lu, D.; Qiao, W.; Gong, X. Current-based gear fault detection for wind turbine gearboxes. IEEE Trans. Sustain. Energy 2017, 8, 1453–1462. [Google Scholar] [CrossRef]
  17. Ha, J.M.; Youn, B.D.; Oh, H.; Han, B.; Jung, Y.; Park, J. Autocorrelation-based time synchronous averaging for condition monitoring of planetary gearboxes in wind turbines. Mech. Syst. Signal Process. 2016, 70, 161–175. [Google Scholar] [CrossRef]
  18. Zhu, J.; Yoon, J.M.; He, D.; Bechhoefer, E. Online particle-contaminated lubrication oil condition monitoring and remaining useful life prediction for wind turbines. Wind Energy 2015, 18, 1131–1149. [Google Scholar] [CrossRef]
  19. Chambers, K.W.; Areneson, M.C.; Waggoner, C.A. An on-line ferromagnetic wear debris sensor for machinery condition monitoring and failure detection. Wear 1988, 128, 325–337. [Google Scholar] [CrossRef]
  20. Du, L.; Zhe, J. A high throughput inductive pulse sensor for online oil debris monitoring. Tribol. Int. 2011, 44, 175–179. [Google Scholar] [CrossRef]
  21. Yin, Y.H.; Yan, X.P.; Xiao, H.L. Hanliang Study on the Magnetic Field Homogeneity of Wear Debris Detector. Tribology 2001, 21, 228–231. [Google Scholar]
  22. Antoniadis, A.; Pham, D.T. Wavelets regression for random or irregular design. Comput. Stat. Data Anal. 1998, 28, 353–369. [Google Scholar] [CrossRef]
Figure 1. Schematic of the three-coil induction abrasive particle sensor.
Energies 13 00365 g001
Figure 2. Illustration of the three-coil winding inductance. (a) Relative position indication of the winding. (b) Skeleton picture of the three-coil winding.
Energies 13 00365 g002
Figure 3. Size of the three-coil winding inductance.
Energies 13 00365 g003
Figure 4. Induced voltage of the different size particles passing through the coils.
Energies 13 00365 g004
Figure 5. Relationship between the induced voltage and abrasive particle radius.
Energies 13 00365 g005
Figure 6. Induced voltage of the different size particles passing through the coils.
Energies 13 00365 g006
Figure 7. The detective circuit schematic.
Energies 13 00365 g007
Figure 8. Front-stage differential amplification filter circuit. (a) Differential amplifier circuit. (b) Bode diagram of filter transfer function.
Energies 13 00365 g008
Figure 9. Synchronized envelope rectifier circuit.
Energies 13 00365 g009
Figure 10. Voltage waveforms of Ua, Ua1, Ub, and Uo. (a) Voltage waveform of Ua and local amplification waveform. (b) Voltage waveform of Ua1, Ub and local zoom in waveform. (c) Voltage waveform of Uo.
Energies 13 00365 g010
Figure 11. The wind turbine drivetrain and installation position of the abrasive particle sensor. (a) The test wind turbine drivetrain and 3-stage gearbox layout. (b) The sensor installation location model. (c) The abrasive sensor installation position diagram.
Energies 13 00365 g011
Figure 12. Record data of the abrasive particles within 10 days before the faults. (a) Line diagram showing the increase in the quantity and volume of the abrasive particles. (b) Bar chart showing the increase in the quantity and volume of the abrasive particles in every 8 h.
Energies 13 00365 g012
Figure 13. Abrasive particle waveforms in the early warning. (a) The waveform of 280 μm diameter abrasive. (b) The waveform of 1 mm diameter abrasive. (c) The waveform of two abrasive pass through the sensor successively.
Energies 13 00365 g013
Figure 14. The photo of the gearbox fault.
Energies 13 00365 g014
Table 1. Parameters of the three-coil winding.
ParametersValue
Vacuum permeability μ04π × 10−7 Wb/(A *m)
Radius of the oil pipe r25 mm
Length of the excitation coil m2.5 mm
Distance from the excitation coil to the Induction coil n17.5 mm
InductanceL1L2L3
Number of the excitation coil (N)427642
Initial inductance value (L)159.7 μH520 μH159.7 μH
Table 2. Parameters of experimented wind turbine.
ParametersValue
Wind turbine rated power/kW2000
Rated generator speed/(r/min)1800
Gearbox rated power/kW2250
Gearbox transmission ratio131
Main shaft speed ω1/(r/min)13.74
Low speed shaft planet speed ω2/(r/min)−32.872
Low speed shaft speed ω3/(r/min)75.378
Intermediate shaft speed ω4/(r/min)−344.118
High speed shaft speed ω5/(r/min)1800
Diameter of the abrasive sensor pipe/mm40
Rated oil speed/(m/s)2.3
Minimum abrasive particle diameter/µm200
Magnification factor of abrasive particle signal20,000

