Article

Multi-Scale Analysis and Pattern Recognition of Ultrasonic Signals of PD in a Liquid/Solid Composite of an Oil-Filled Terminal

1
Key Laboratory of Engineering Dielectrics and its Application, Ministry of Education, Harbin University of Science and Technology, Harbin 150080, China
2
College of Rongcheng, Harbin University of Science and Technology, Rongcheng 264300, China
3
State Grid Corporation of Yantai, Yantai 264001, China
*
Author to whom correspondence should be addressed.
Energies 2020, 13(2), 366; https://doi.org/10.3390/en13020366
Submission received: 9 December 2019 / Revised: 3 January 2020 / Accepted: 9 January 2020 / Published: 11 January 2020

Abstract

:
In order to analyze the partial discharge (PD) characteristics of a liquid/solid composite medium in an oil-filled submarine cable terminal; we have designed five discharge models including needle-plate, plate-to-plate air gap, surface, slide-flash and suspension potential. At the same time, the ultrasonic signals of PD have been extracted through the typical fault model research platform of oil-filled submarine cable equipment. First, we use SureShrink threshold wavelet denoising to suppress the ultrasonic signal noise. Secondly, through the multi-scale analysis of the signal, the energy distribution maps of five different types of PD are obtained; the analysis found that needle-plate discharge, suspension discharge, and slide-flash discharge have better resolution; and plate-to-plate air gap discharge and creeping discharge have similar characteristics and are not easy to distinguish. Finally, we designed six characteristic parameters of the ultrasound signal, and screened three feature quantities by a back propagation (BP) neural network to distinguish between plate-to-plate air gap discharge and surface discharge. In summary, the method of combining multi-scale analysis and neural networks is used to distinguish the five discharge types by extracting the characteristic values of the characteristic signals.

Graphical Abstract

1. Introduction

The high-voltage cable terminal is an indispensable accessory for connecting other electrical equipment when laying high-voltage cables. It is widely used in cable lines with voltage levels of 110 KV and above. Among them, oil-filled terminals occupy a relatively large proportion in high-voltage terminals [1]. The main structure of the oil-filled terminal is to install a stress cone at the end of the cable insulation shield to improve the electric field distribution, and then install it into a ceramic or composite material sleeve [2]. Normally, insulating oil is filled between the stress cone of the cable terminal and the sleeve as insulation. Silicone oil and polyisobutylene are the commonly used insulating oils at present, and the selection principle is based on their compatibility with the stress cone material of the cable terminal. Insulating oil is affected by external factors such as oxygen, humidity, high temperature, strong electric fields and impurities [3,4,5]. With the increase of the cable terminal use time, the aging of the insulating oil will gradually increase, leading to a significant reduction in the terminal’s insulation performance, which will cause the cable terminal to heat, discharge, and even cause insulation breakdown failure. Whether it is the cracking of the insulating oil or the decomposition of the solid insulating material, a local, repetitive discharge will first occur in the local area of the defect. The cable terminal has a complicated internal structure, and the internal electric field distortion is also very serious, and its manufacturing and installation processes often bring some damage or defects. We monitor PD signals to determine the type of insulation defects and the degree of aging [6]. Ultrasonic detection of PD signals (because this method can be conveniently installed on the site) is not affected by electromagnetic interference, and is relatively easy to implement. Many scholars at home and abroad have done a lot of research on ultrasonic detection of PD.
Rizza et al. [7] studied the pattern recognition of PD in cable accessories, and used a combination of genetic algorithms and neural networks to classify the signals of PD at different voltages.
R.M. Sharwa et al. [8] used an ultrasonic method to detect the PD of suspended particles in transformer oil, and classified the PD signals of suspended particles of different sizes by combining SVM and wavelet transform.
P. Kundu et al. [9] carried out a pattern recognition study on multiple PD sources in oil-paper insulation by using the ultrasonic method. By using two different methods of wavelet analysis and fractal analysis, the ultrasound of different types of PD were classified.
Sebastian B et al. [10] used clustering methods to identify acoustic emission signals of oil-paper-insulated PD, and analyzed the elements of clusters. They are most similar to each other, and they are the largest in terms of specific characteristics or standards used in other groups to varying degrees. PD assessment and identification of typical defects of oil-paper insulation systems of power transformers are thus performed.
Mustafa Harbaji et al. [11] have classified common PD under different acoustic emission measurement conditions. The measurement conditions include the effect of different PD locations and oil temperature, and the collected acoustic emission signals are processed using pattern classification technology to identify the corresponding acoustic emission type.
Mehrdad Majidi et al. [12] used a pre-processing method based on signal specifications to extract the appropriate characteristics of various samples. The primal-dual interior point (PDIP) algorithm and base tracking de-noising (BPDN) algorithm are adopted. A new sparse representation classifier (SRC) was calculated using l and stable t-norm minimization algorithms, respectively. The artificial neural network is used for pattern recognition and compared with the sparse method.
In this paper, ultrasonic sensors are used to detect PDs, and a new combination method is proposed to identify the types of PDs. First, according to the characteristics of the PD ultrasound signal and the interference encountered in the experiment, a reasonable filtering method is proposed. Then, the multi-scale analysis of the signal and the BP neural network are used to classify different types of PD models to determine the pattern recognition method suitable for PD ultrasound signals.

2. Methods

2.1. Threshold Wavelet Denoising

In this paper, we use orthogonal discrete wavelet transform (DWT) [13,14]. The specific implementation process of the DWT wavelet threshold denoising method is as follows: Firstly, the original signal is decomposed by wavelet on each scale; and, after the decomposition is completed, the wavelet coefficients at large scale and low resolution are retained. Secondly, for wavelet coefficients at high scale and high resolution, the method often used is to set an appropriate threshold and achieve the desired effect by setting the threshold; then, the specific method is to set all wavelet coefficients whose amplitude is lower than the threshold to 0; conversely, the wavelet coefficients whose amplitude is higher than the threshold are completely retained or contracted. In the last step, the wavelet coefficients obtained after processing are used to perform wavelet inversion to achieve the purpose of reconstruction, and to recover an effective signal.
According to the actual experimental conditions, we selected the SureShrink method for threshold selection to achieve threshold wavelet denoising [15,16,17,18]. This method for determining the threshold is an adaptive threshold selection based on Stein’s unbiased likelihood estimation principle. This method for determining the threshold is an adaptive threshold selection based on Stein’s unbiased likelihood estimation principle. For a given threshold T, first obtain its likelihood estimate, and then minimize the non-likelihood T to obtain the selected threshold.
The calculation process of this method is: first take the length N of the signal, and get a new vector X = [ x 1 , , x N ] at the jth layer, where x k = W 2 ( j , k ) , k = 1, 2, …, N; x 1 x N ; Finally, the risk vector R = [ r 1 , , r N ] is calculated, where ri is shown in Formula (1).
r i = N 2 i + ( N i ) x i + k = 1 i x k N i = 1 , , N ,
Then, take the smallest element in R as the risk value, and find the corresponding x M from its corresponding position M. Finally, the threshold of SureShrink was determined to be T S u r e S h r i n k = σ n x M .

2.2. Multiresolution Analysis

Multi-resolution analysis is often referred to as multi-scale analysis [19,20,21]. This method is a theory based on the concept of function space, and the idea comes from practical engineering. After the orthogonal wavelet basis was proposed by Meyer, Mallat [22] proposed whether the method of orthogonal wavelet basis can be considered to expand the multi-scale characteristic image to obtain the information between different scales of the image. It is astonishing that this bold idea promotes the establishment of the theory of multiresolution analysis. It also promoted the establishment of multi-resolution analysis theory. From the above analysis, we can see that it is the scaling of the wavelet function that forms the closure of some columns W j , however, consider the following closed subspace. The specific form is shown in Formula (2).
V j = W 0 + W j 1 ,
This set of subspaces satisfies the following conditions:
  • Monotonicity: V j V j 1 , j Z
  • Approximation: j z V j = { 0 } , j z V j = L 2 ( R )
  • Scalability: f ( x ) V j f ( 2 x ) V j 1
  • Translation invariance: f ( x ) V 0 f ( x k ) V 0 f ( 2 j k ) V j
  • Rizesz base existence: φ ( x ) V 0 makes | φ ( x n ) | n z constitute the Rizesz basis of V 0
Subspace A constitutes a multiresolution analysis of B. W j is the orthogonal complement space of V j in V j + 1 , that is, V j + 1 = W j V j . W j is the wavelet space, and the corresponding wavelet function is ϕ j , k ( x ) . Using the same method as the scaling and translation of the wavelet function generates sequence space. W j , we can also form a new subspace V j by scaling and translation of the scale function φ ( x ) . That is Formula (3):
V j = s p a n ( φ j , k ( x ) ) k Z ,
In the above formula: V j is the scale space; the corresponding φ j , k ( x ) is called the scale function; f(x) can be infinitely approximated on V j , and the remaining terms can be given in W j . Often the question we have to consider is whether any function f can be decomposed into details and approximations; after it is decomposed, the approximation part is further decomposed. In this way, the approximation part and the detail part of any function on any scale can be obtained.

2.3. Principle of the BP Neural Network

The BP neural network is the application of BP algorithm to the learning of neural network, it is an error back propagation algorithm [23,24]. The mapping relationship between input and output can be obtained through the BP network without describing this mapping relationship in advance. The BP network is powerful, and it can represent any kind of Boolean function and continuous function that approximates arbitrary precision through two layers of networks. A three-layer network structure of BP network can approximate any function with arbitrary precision. A simple three-layer network structure of the BP neural network [25] is shown in Figure 1.
The algorithm of BP network [26,27] is described as follows: When applying an untrained network for data classification and pattern recognition, first of all, it is necessary to determine the data of the input layer and the desired target value. Then, the value is input to the network through the input layer and then trained through the network to obtain the output value. The difference between the output value and the target value can be used to obtain the corresponding error. The specific implementation method is shown in Equations (4) and (5).
J ( w ) = 1 2 k = 1 n ( t k z k ) 2 = 1 2 t z 2 ,
In Equation (4): tk is the target value; Zk is the output value of the network; the expression of Zk is shown in Equation (5); n is the length of the input data; w represents the weight of the network. Finally, the error function can be expressed by weights. By changing the weights, the error between the target value and the network output value can be changed, and finally the desired result is obtained.
z k = g ( j = 1 n w k j f ( i = 1 d w j i x i + w j 0 ) + w k 0 ) ,
In Equation (5): wkj and wji are the weights from the hidden layer to the output layer and the input layer to the hidden layer, respectively; n is the length of the input data; d is the number of hidden layer network nodes. The weight of the network is first randomly assigned a value, and then the weight is adjusted in the direction of reducing the error. This is shown in Formula (6).
Δ w = η J w ,
In Equation (6) is the speed of learning, which shows how much the weight changes each time.
w ( m + 1 ) = w ( m ) + Δ w ( m ) ,
In Equation (7), m represents the number of trainings. The above is the algorithm of the BP neural network. The first problem that needs to be solved before using neural network for classification is the problem of selecting input data, because the characteristics of input data are directly related to the accuracy of classification.

3. Test

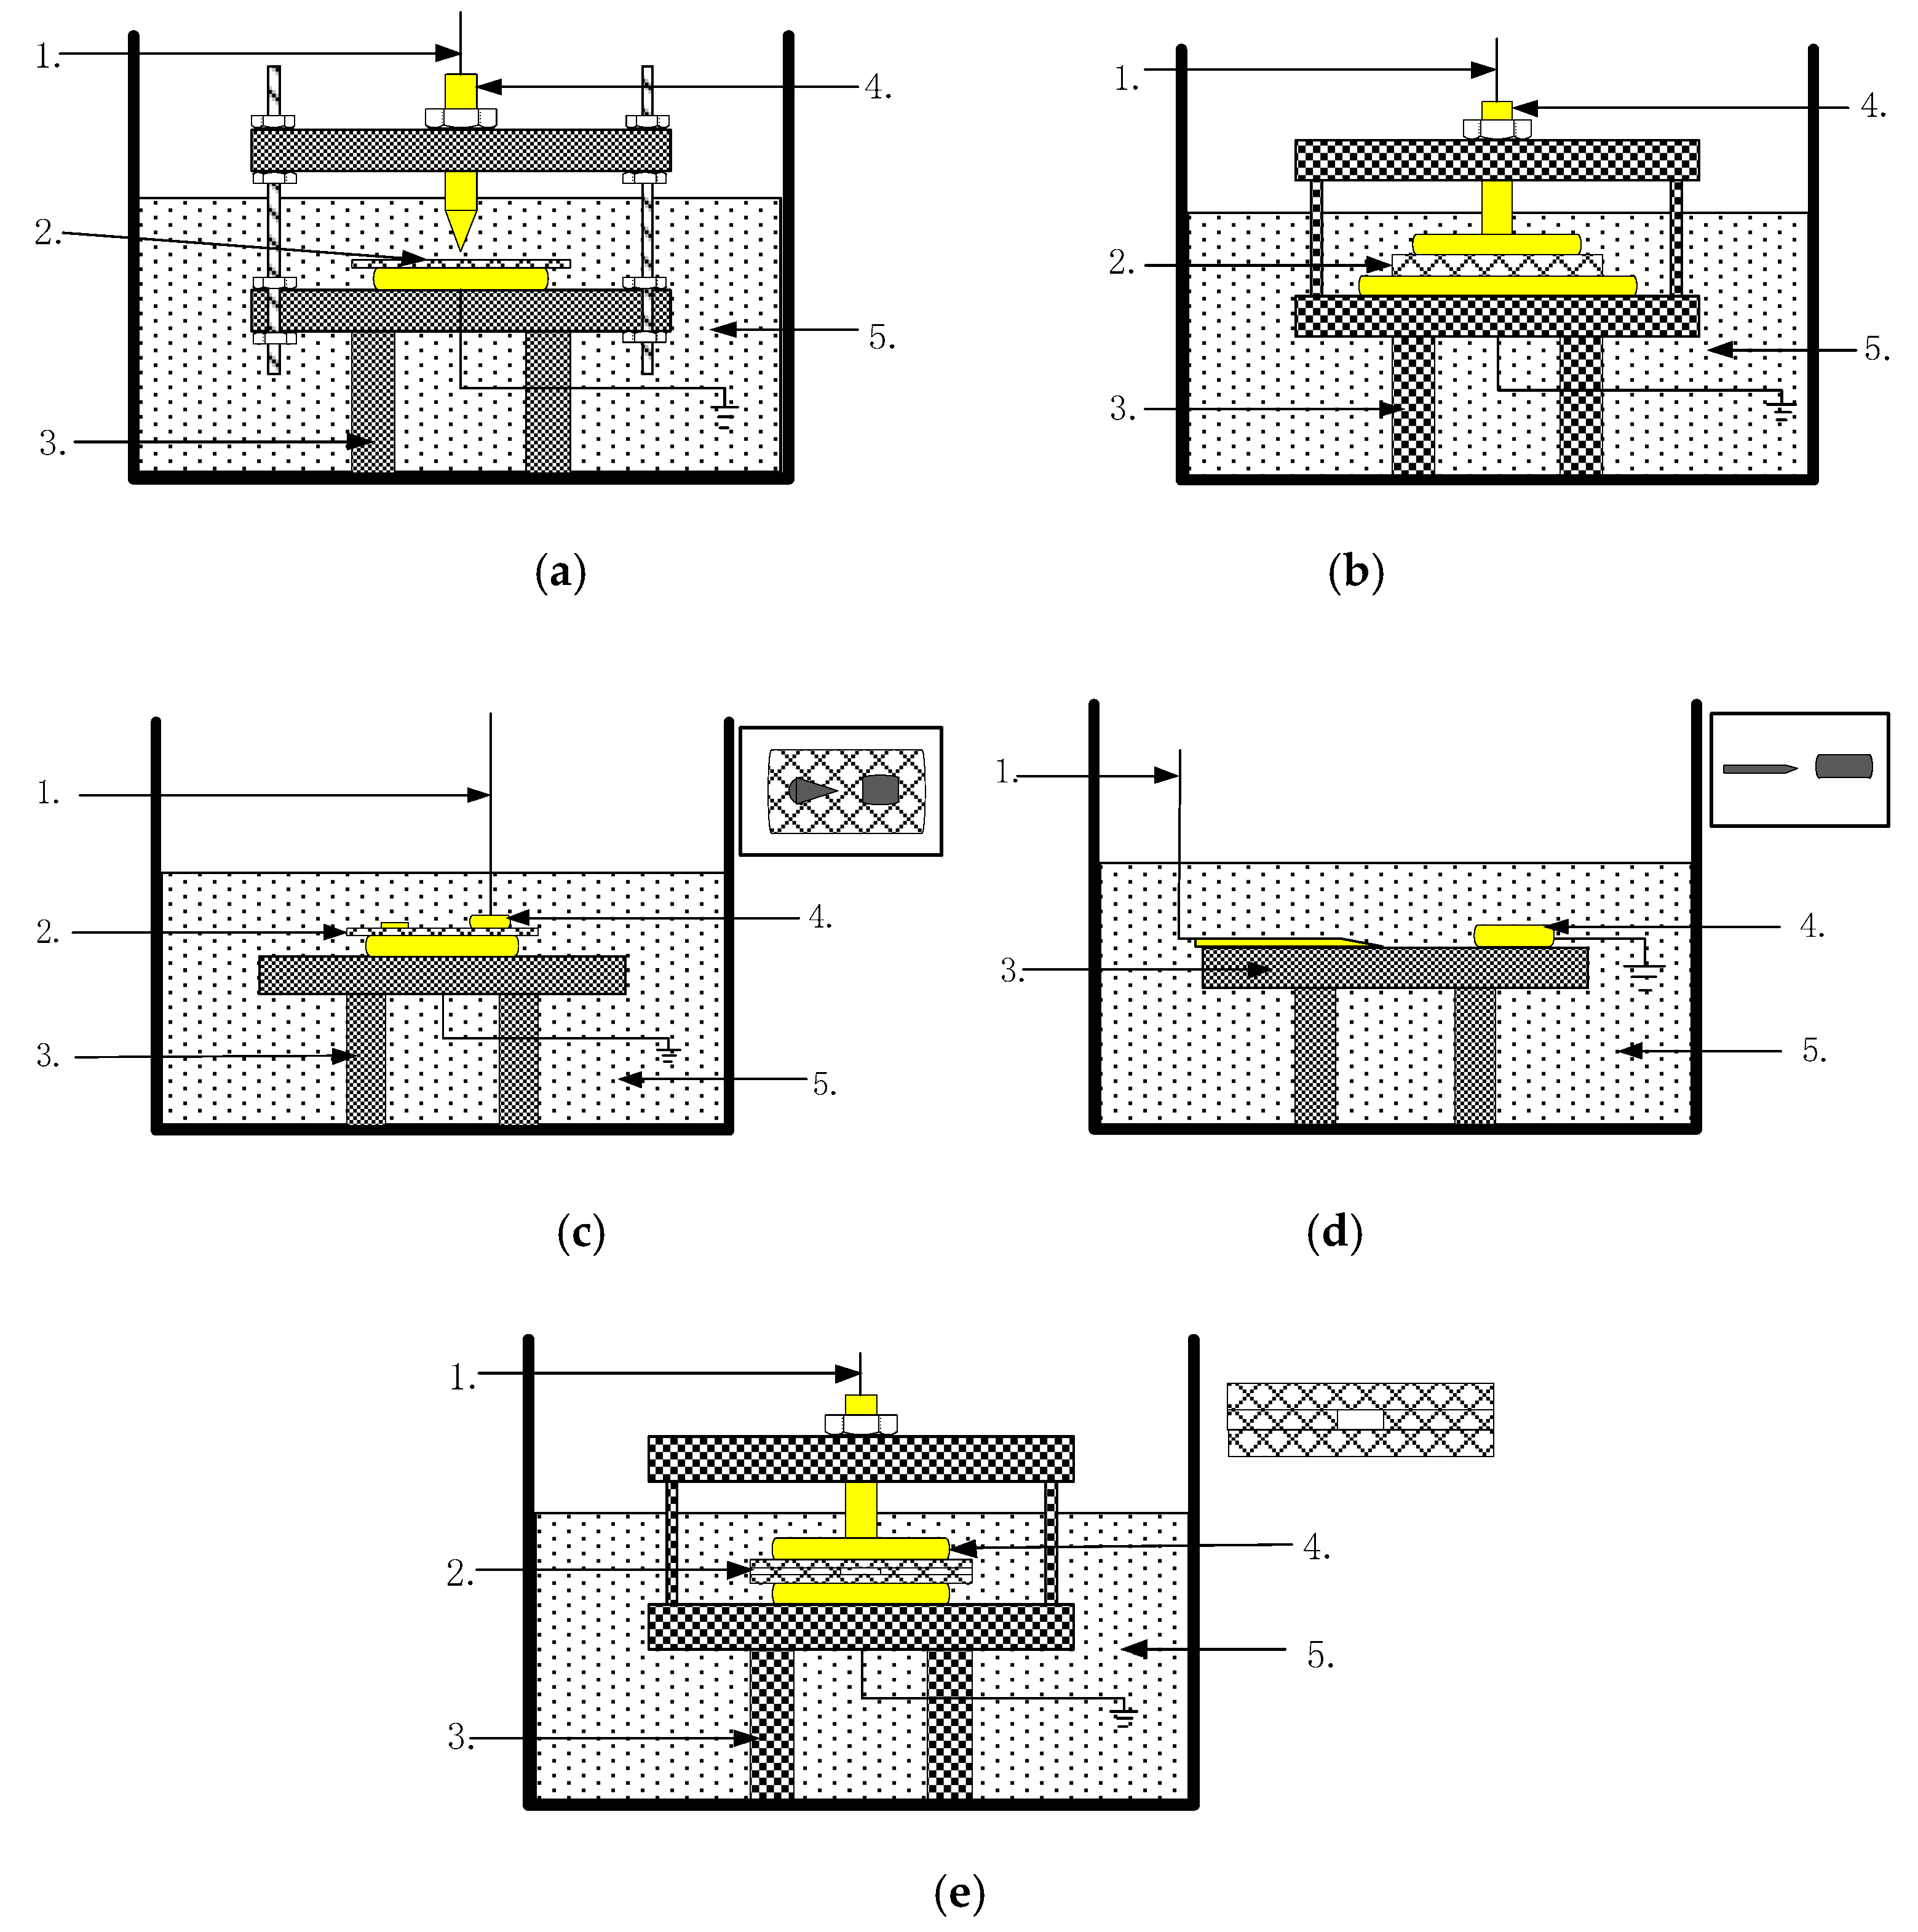
According to the theory of PD and common discharge phenomena, for the case of PD inside the cable terminal: Five discharge models were established in the laboratory, they are the needle-plate discharge model, the slide-flash discharge model, the suspension discharge model, the creeping discharge model, and the plate-to-plate air gap discharge model. The structures of these five discharge models are shown in Figure 2.
Due to the complexity and variability of the internal structure of the cable termination, there are various types of defects. In this paper, five kinds of discharge models are used to simulate the representative defects in power equipment.
  • Needle-plate discharge model. This model is used to simulate PD generated by the development of electric branches resulting from the presence of sharp conductors in the cable terminal.
  • Sliding-flash discharge model. This model is used to simulate PD caused by pollution on the surface of the cable terminal.
  • Suspended electrode model. This model is used to simulate PD caused by the presence of carbon particles, metal particles, or other impurities in the cable terminal insulation oil.
  • Creeping discharge model. This model is used to simulate PD when the electric field intensity at the liquid–solid interface inside the cable terminal exceeds the initial discharge field intensity.
  • Plate-to-plate air gap discharge model. This model is used to simulate PD caused by an air gap or an air bubble in the cable terminal.
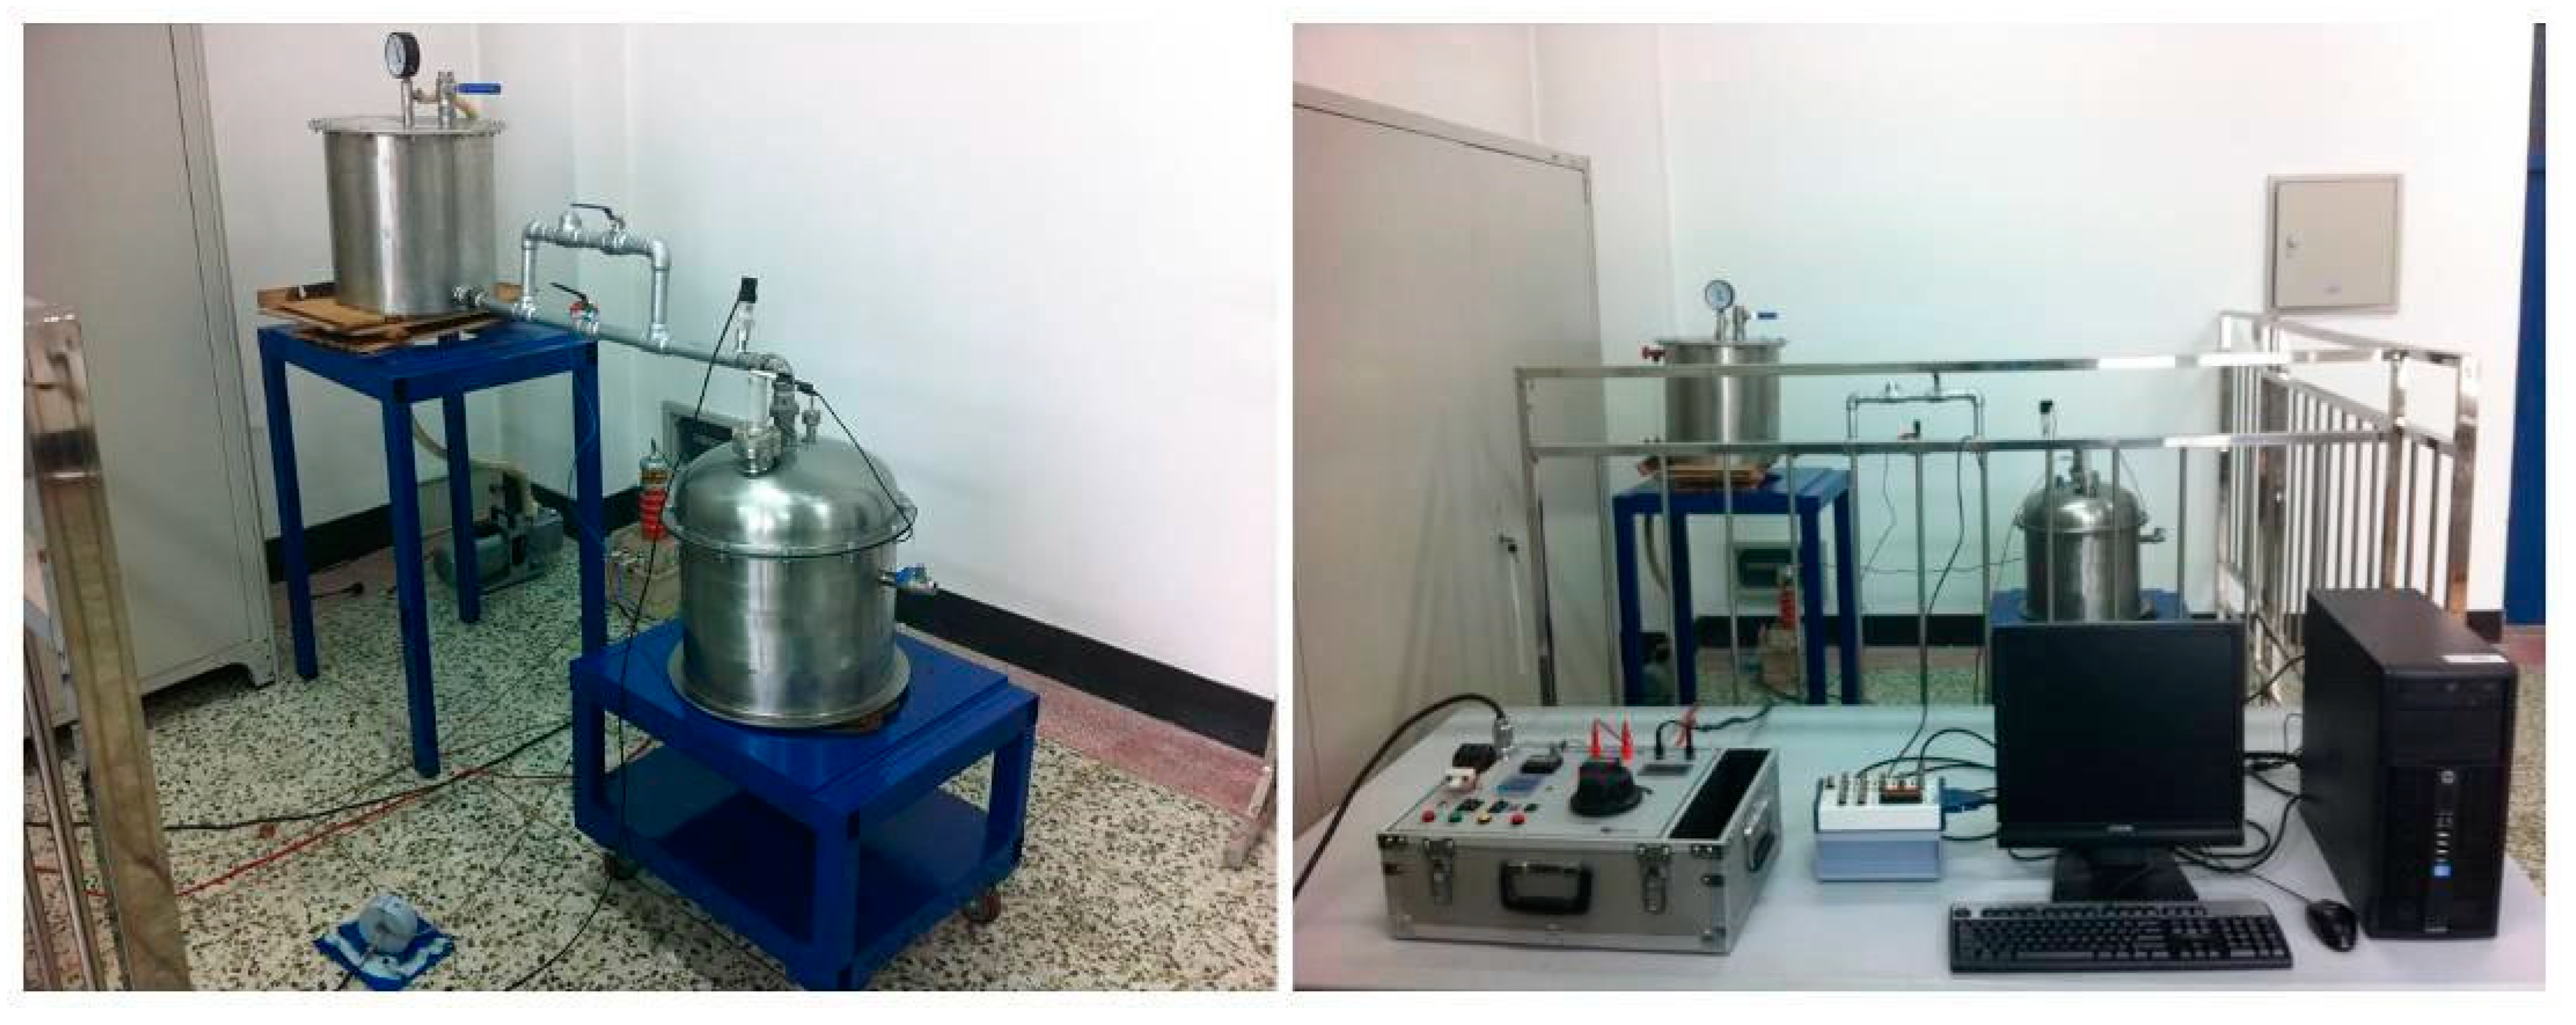
In order to conduct an in-depth analysis of the different types of PD inside the cable termination, we built a simulation system for PD faults in cable terminals based on ultrasonic testing. The circuit schematic of the PD ultrasonic test system is shown in Figure 3. The cable terminal PD fault simulation system and operating platform are shown in Figure 4.
In actual measurement, the sound waves generated when a PD occurs are emitted outward in the form of spherical waves in the tank T, and refraction and reflection occur when they propagate between interfaces. At the same time, the sound wave has a faster propagation speed in the solid, and the sound wave will propagate to the side wall of the fuel tank. In addition, when the acoustic wave propagates along the side wall to the sensor, the reflected wave from the sensor coupled to the box wall will also affect the normal acquisition of the waveform.
Therefore, the sound absorption material M is laid on the three tank walls and the bottom of the tank wall except the sensor coupling surface. Most of the sound-absorbing materials are loose and porous materials. The material selected in this paper is polyester fiber. Install a piezoelectric sensor S on the outer wall of the fuel tank without the sound absorbing material M to detect the PD source D of the discharge model; The ultrasonic signals are converted into electrical signals at the sensor, and then passed through the amplifier AMP, and the data acquisition card (DAQ) collects the data to the PC for calculation and processing.

4. Signal Processing

4.1. Results of Wavelet Denoising

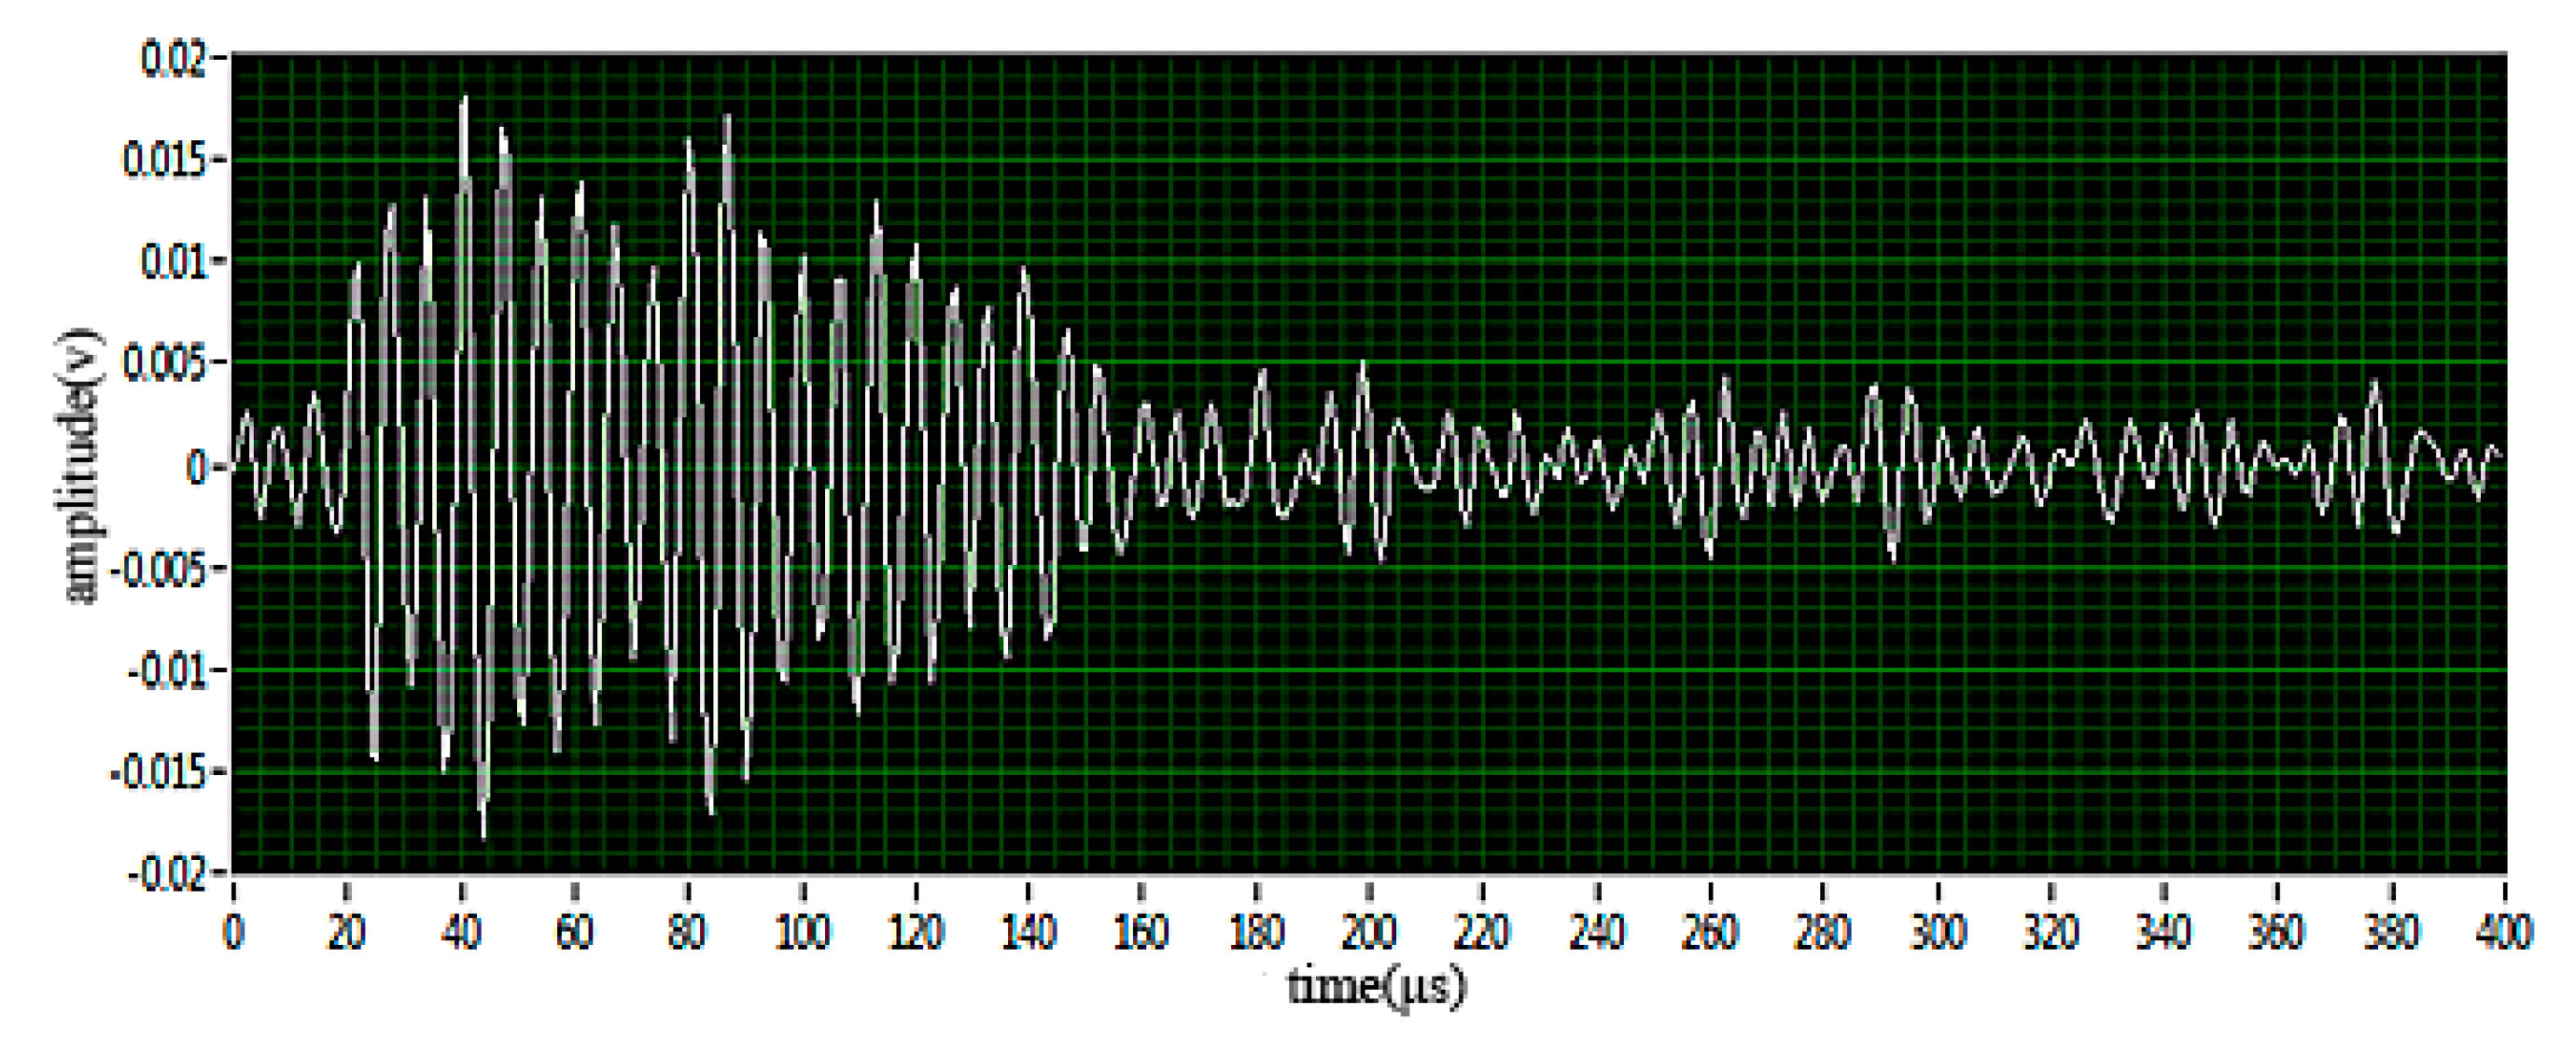
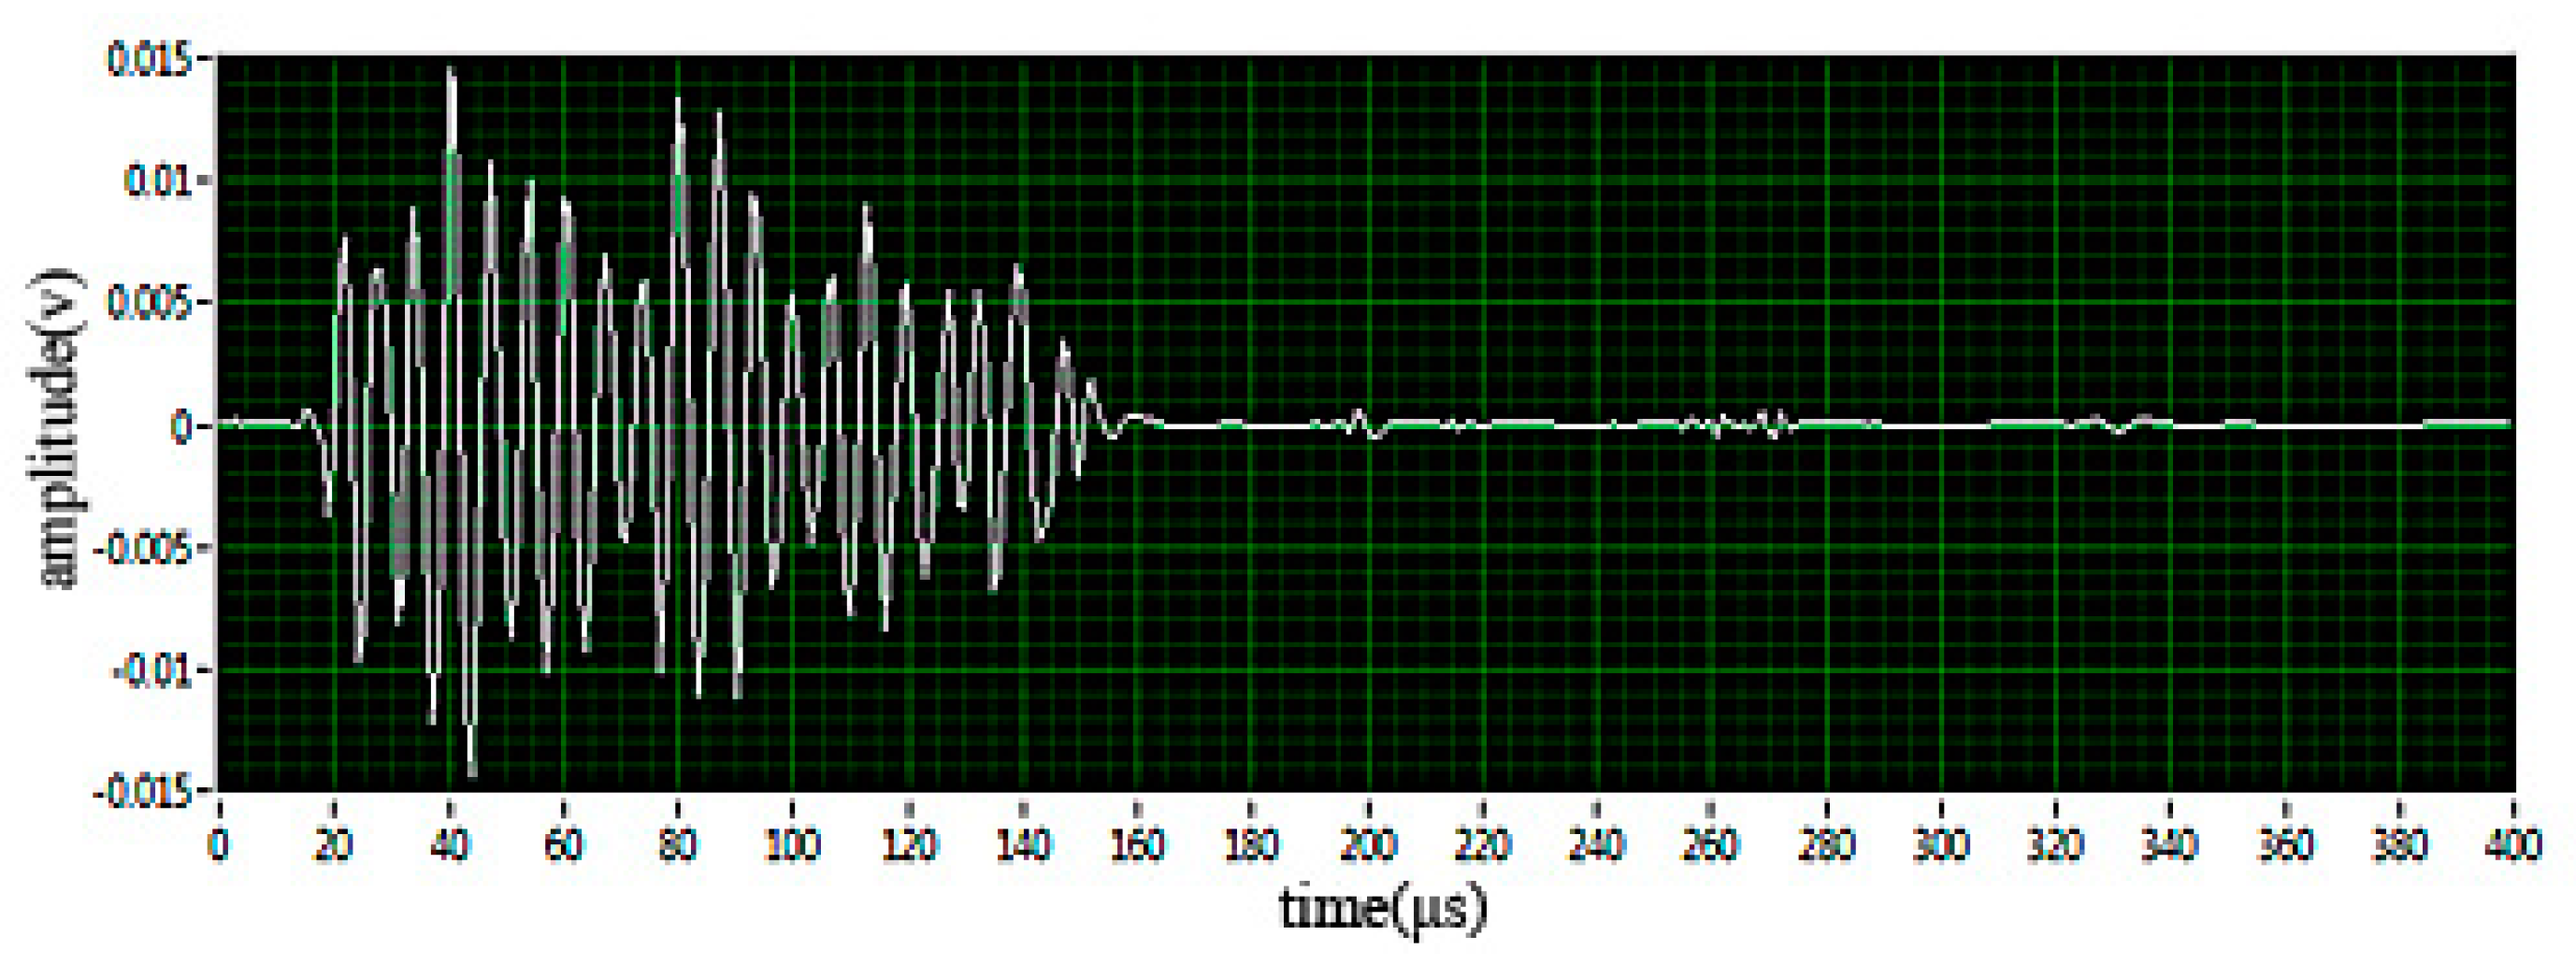
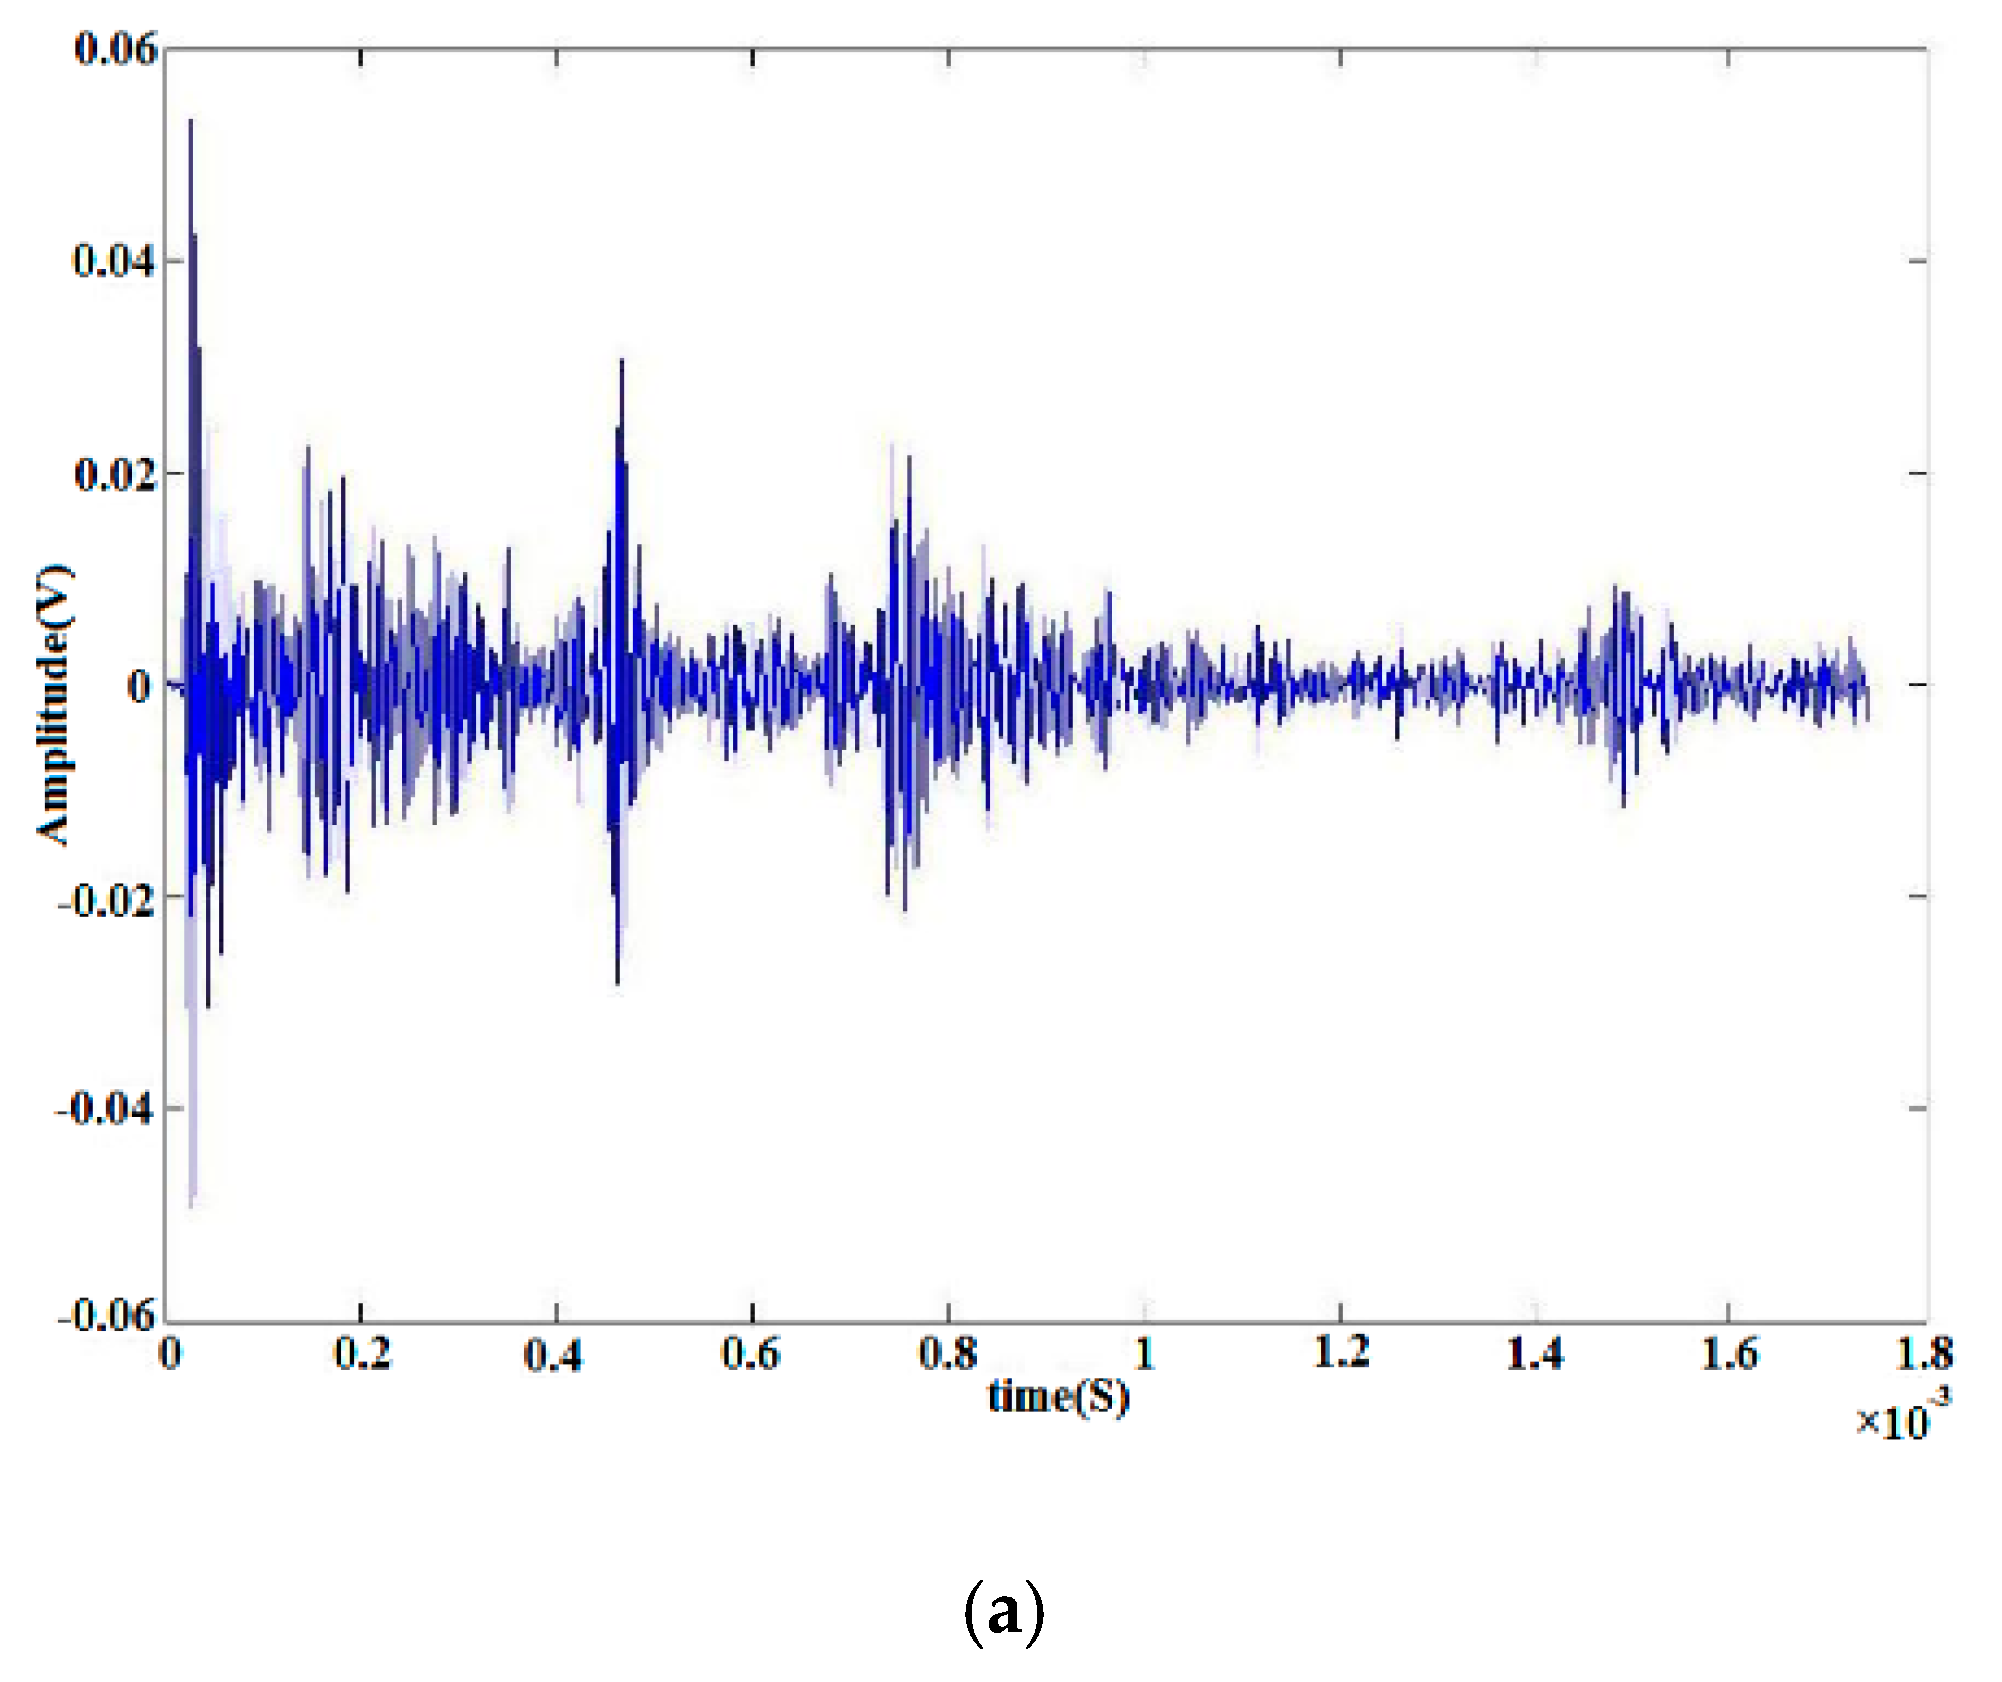
The waveform comparison before and after wavelet denoising using the SureShrink threshold is shown in Figure 5 and Figure 6.

4.2. Results of Multi-Scale Analysis

Due to the internal defects of the insulation and the propagation characteristics of the PD ultrasonic signal, the ultrasonic signal is a non-linear signal. For PD ultrasonic signals, such as small-amplitude, fast-fading signals, we use wavelet transform to extract the characteristics of the signals is a very effective method. The process of wavelet transform [28,29] can be understood as the generation of detailed coefficients through a high-pass filter and the average coefficients through a low-pass filter, and due to the characteristics of multi-resolution in the wavelet transform process, the wavelet transform can adjust the resolution according to the characteristics of the signal. The wavelet transform for non-stationary signals is shown in Equation (8):
f ( t ) = k c j 0 , k ϕ j 0 , k ( t ) + j > j 0 k w j , k 2 j / 2 Ψ ( 2 j t k )
Ψ is mother wavelet function, j is the dimensions of the wavelet decomposition, k is the coefficient of wavelet translation, ϕj0,k is the detail coefficient of wavelet, and cj0,k and wj,k are the weights of wavelet detail coefficient and average coefficient.
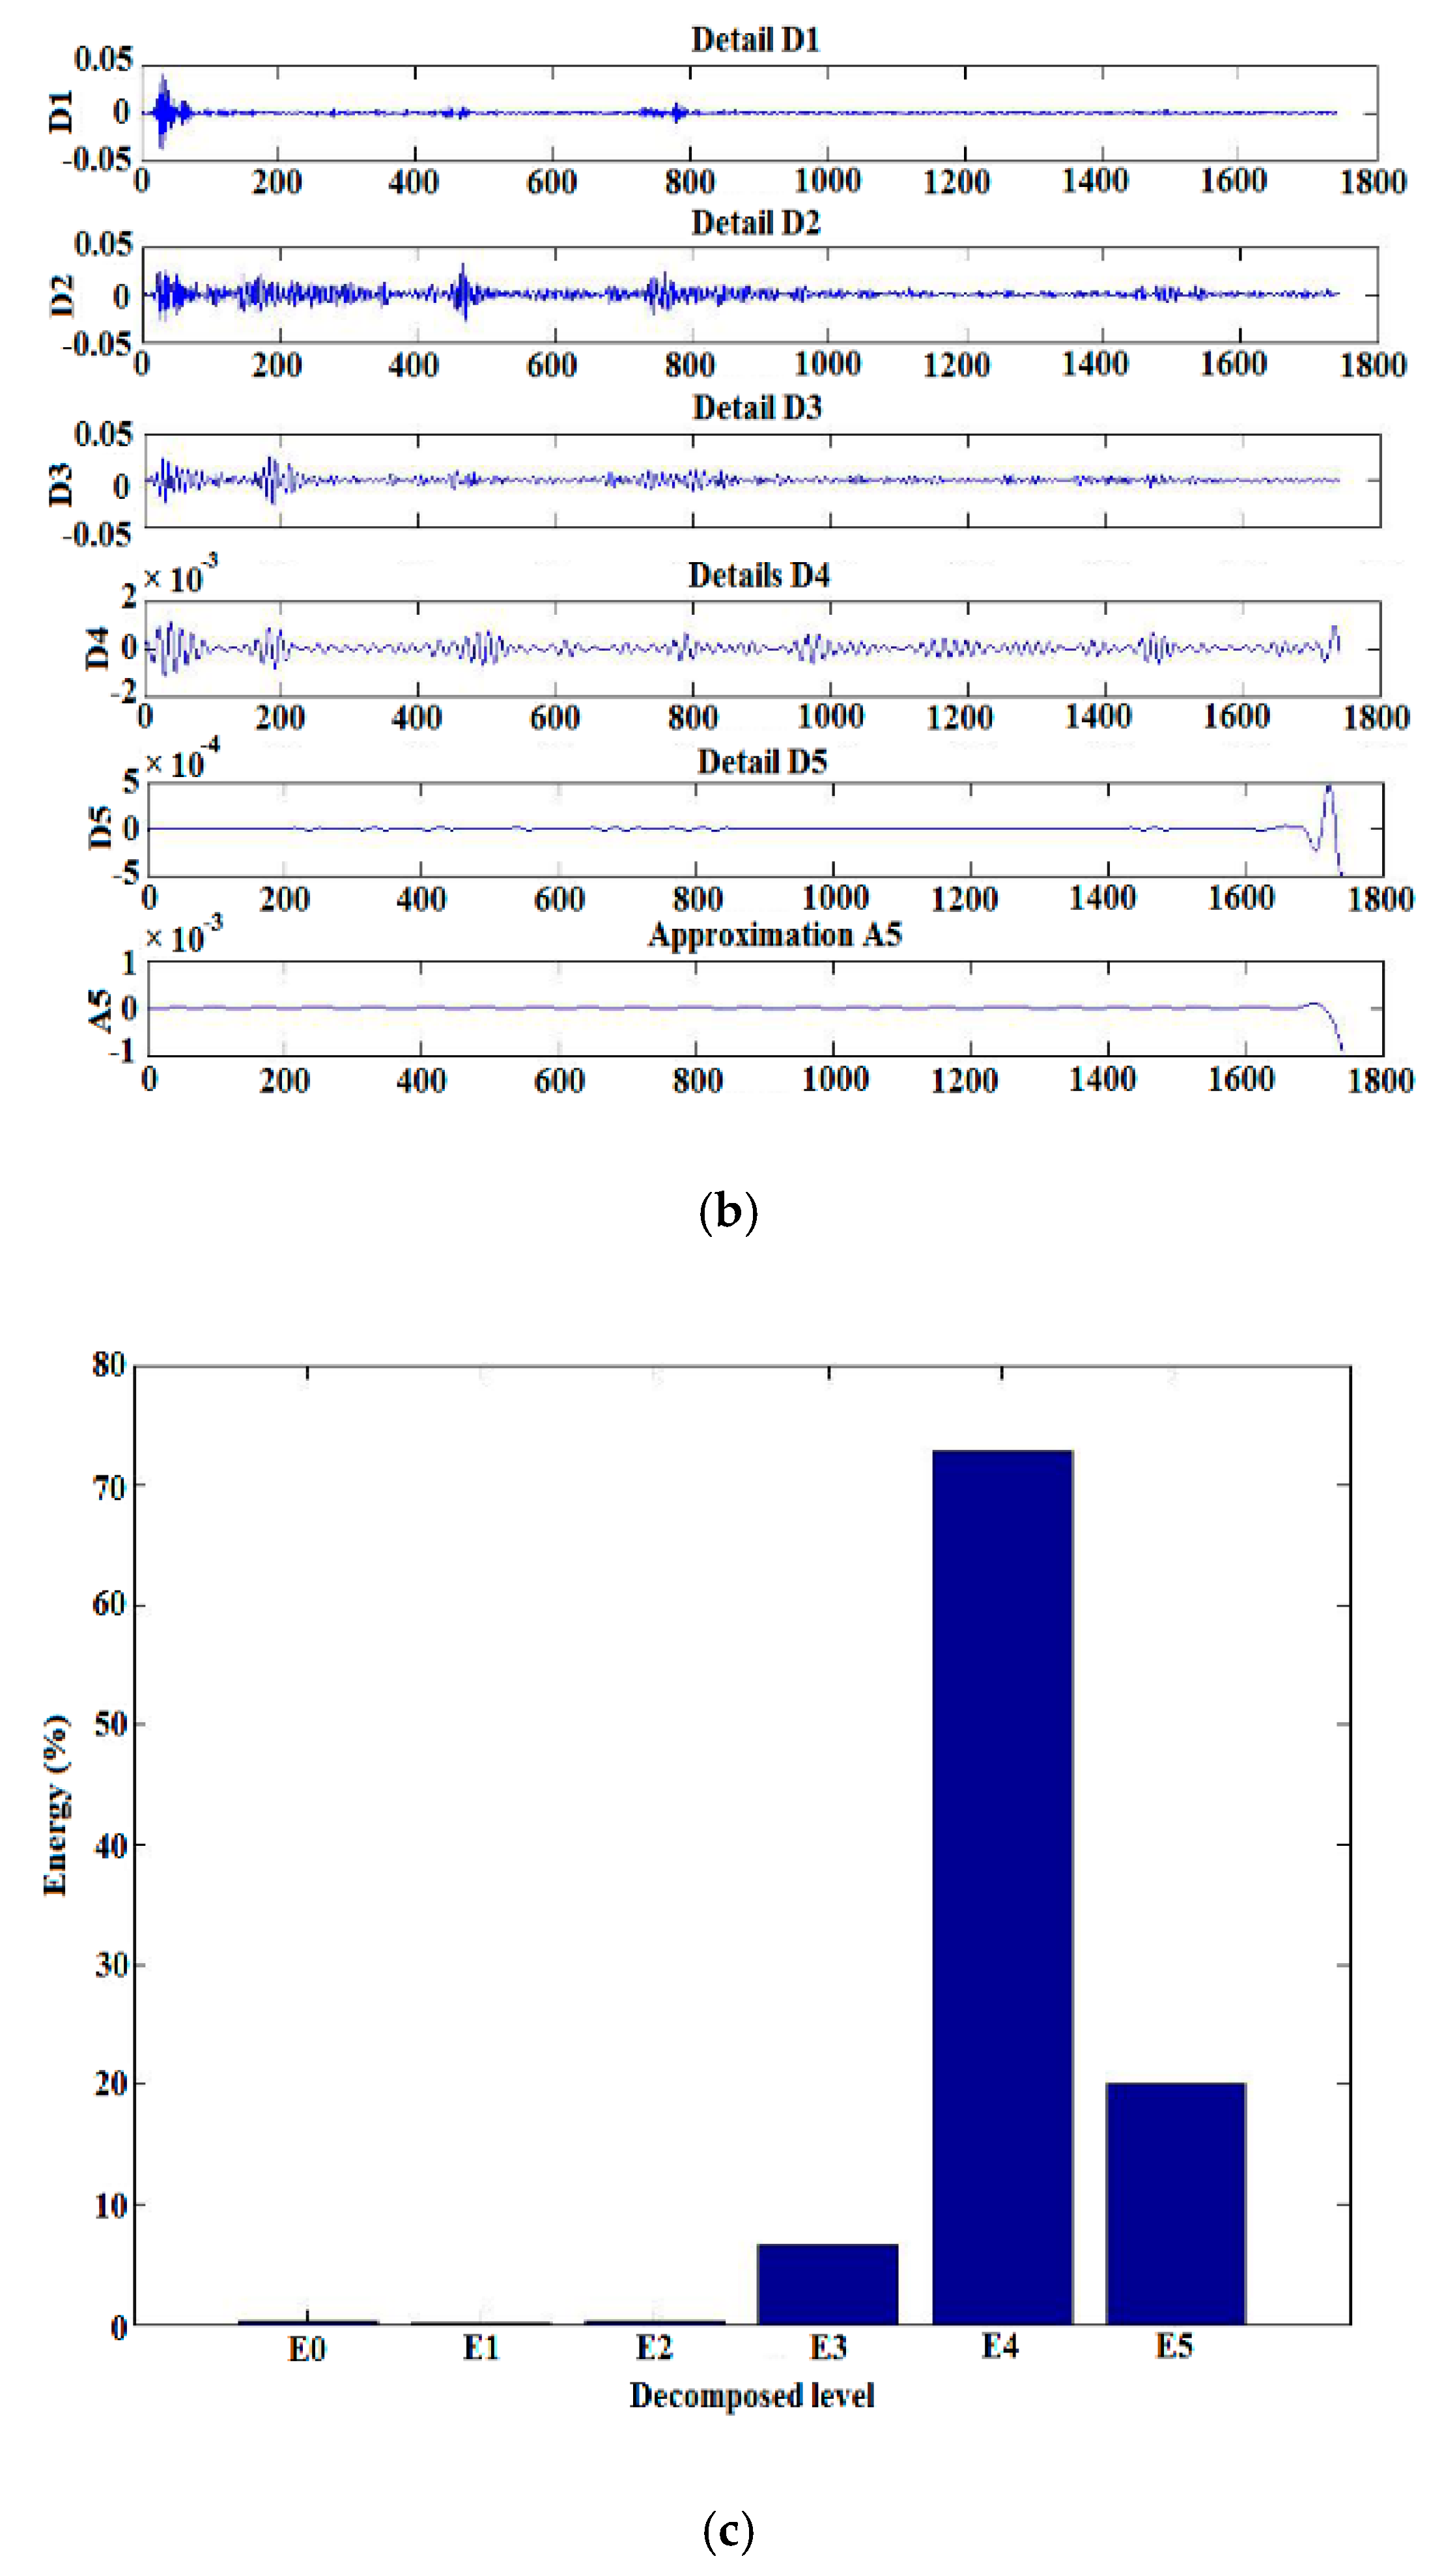
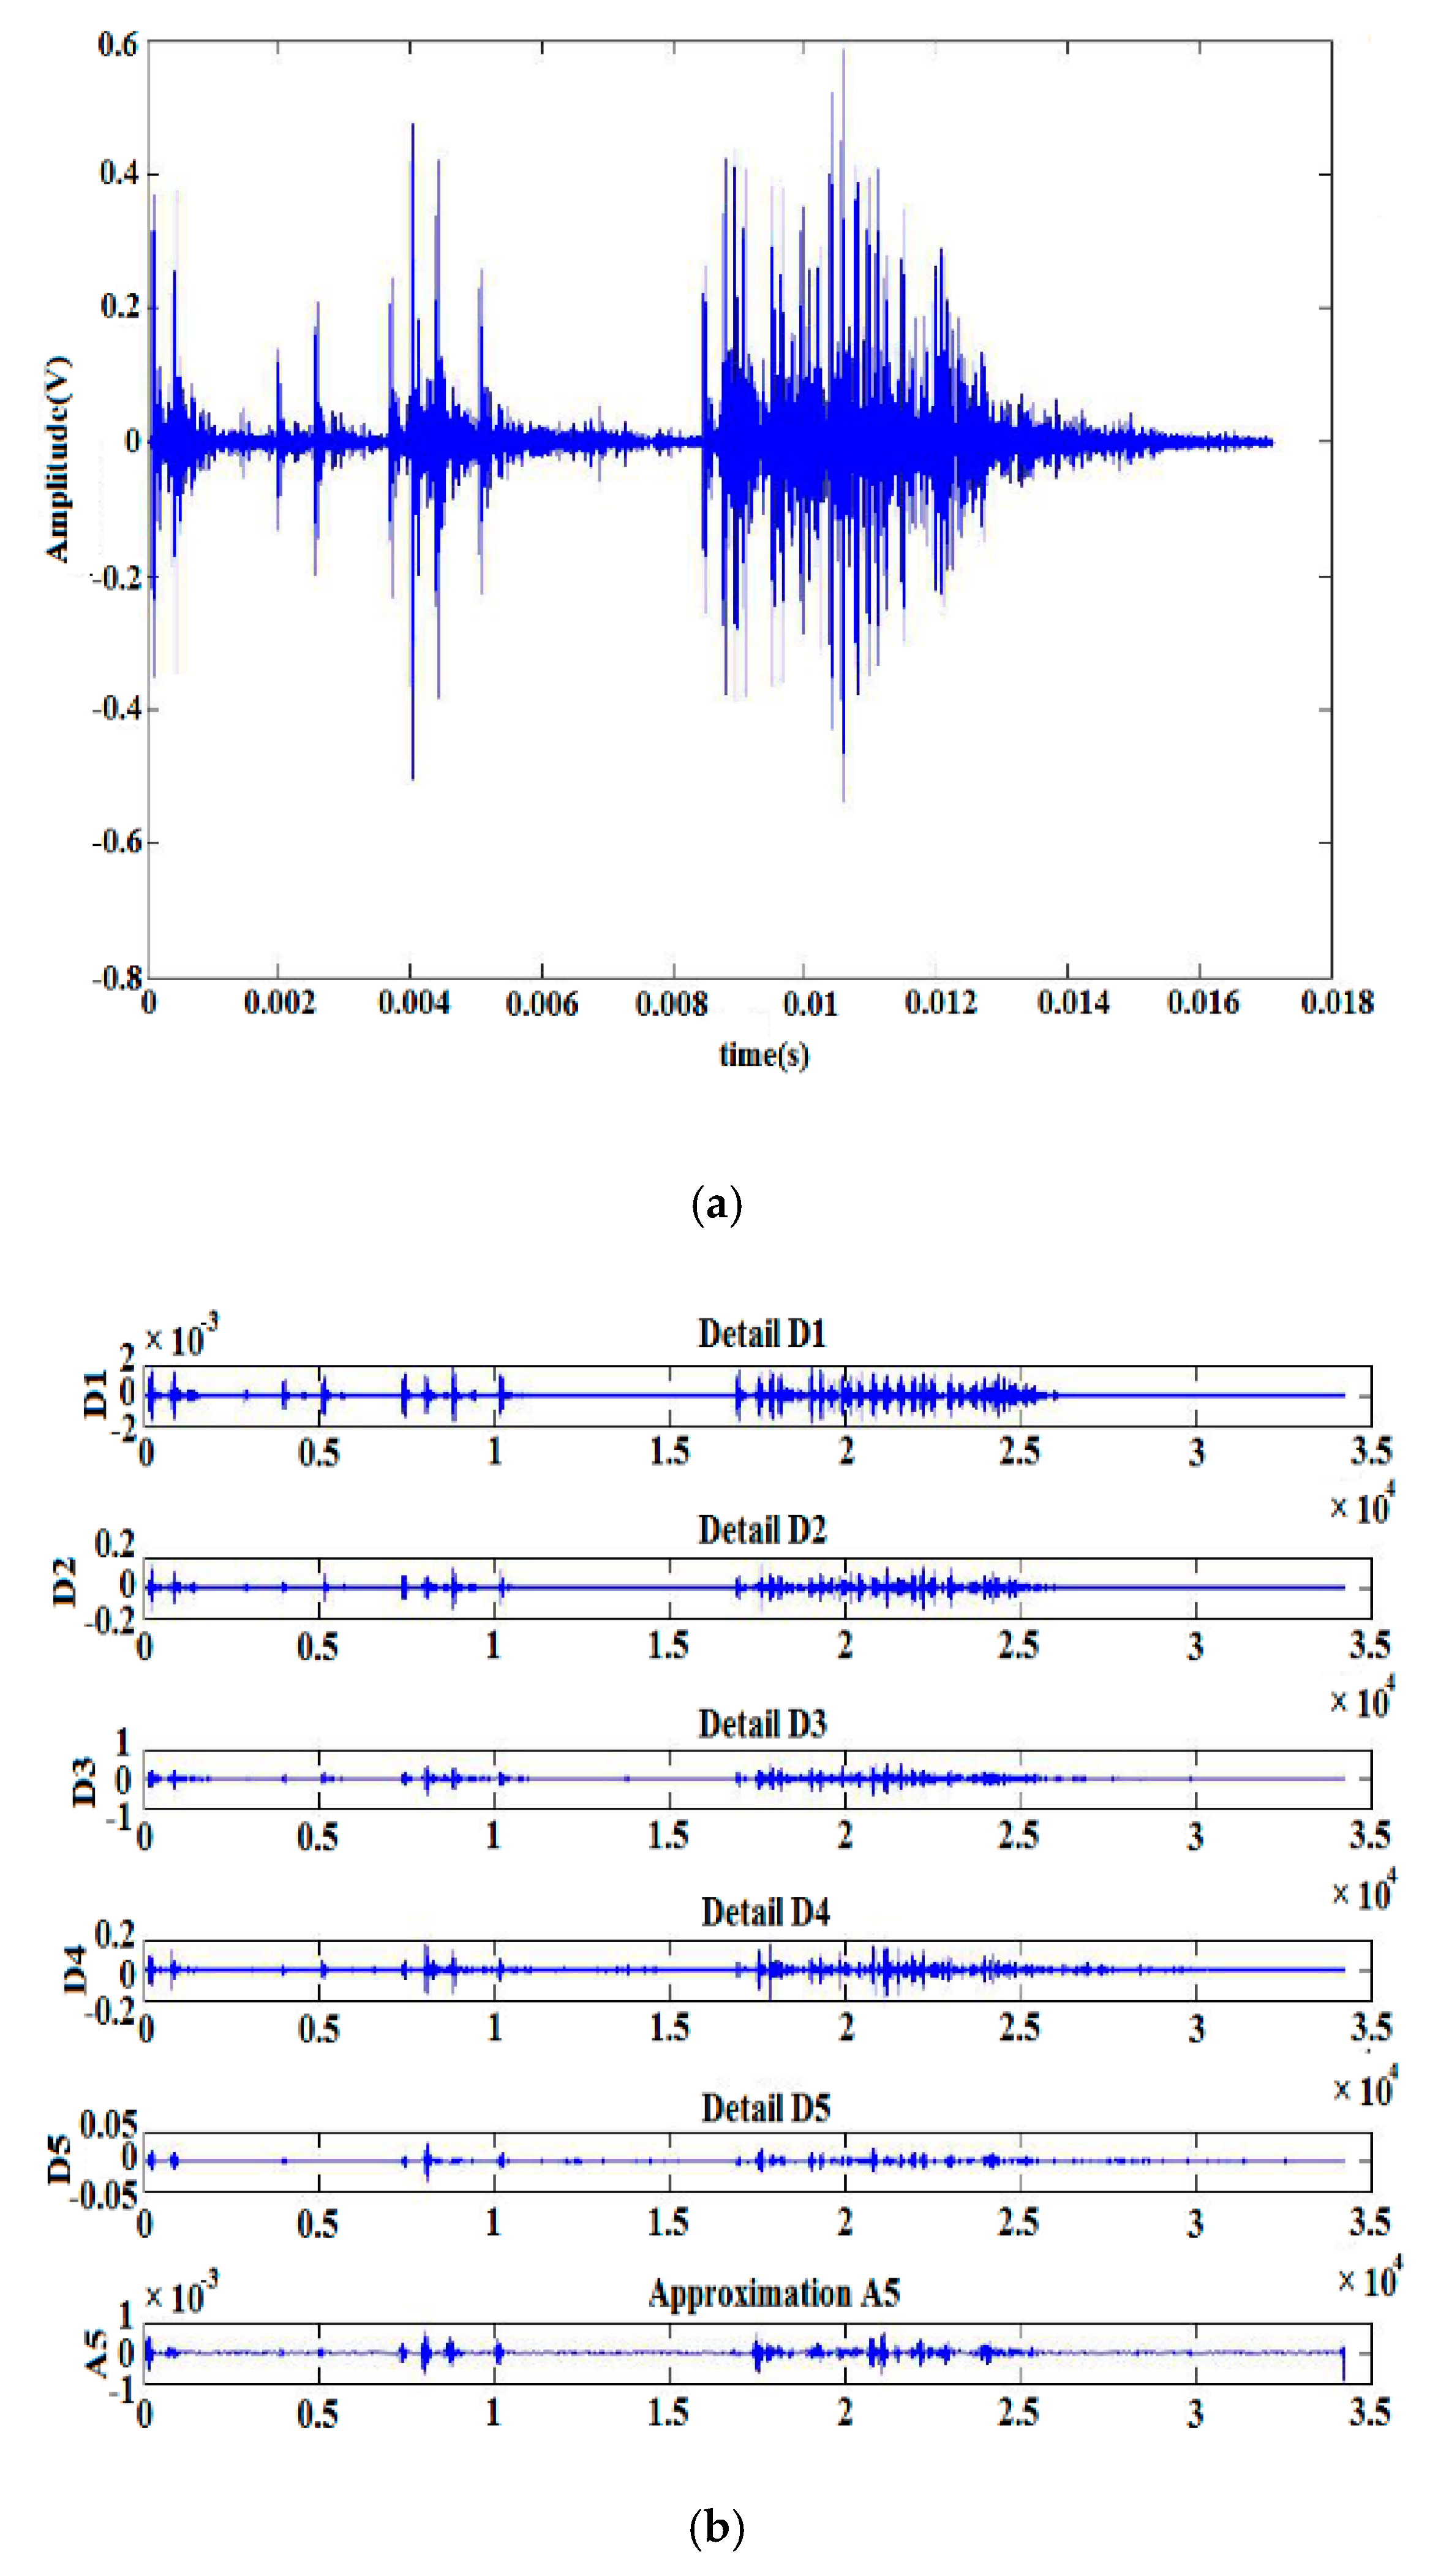
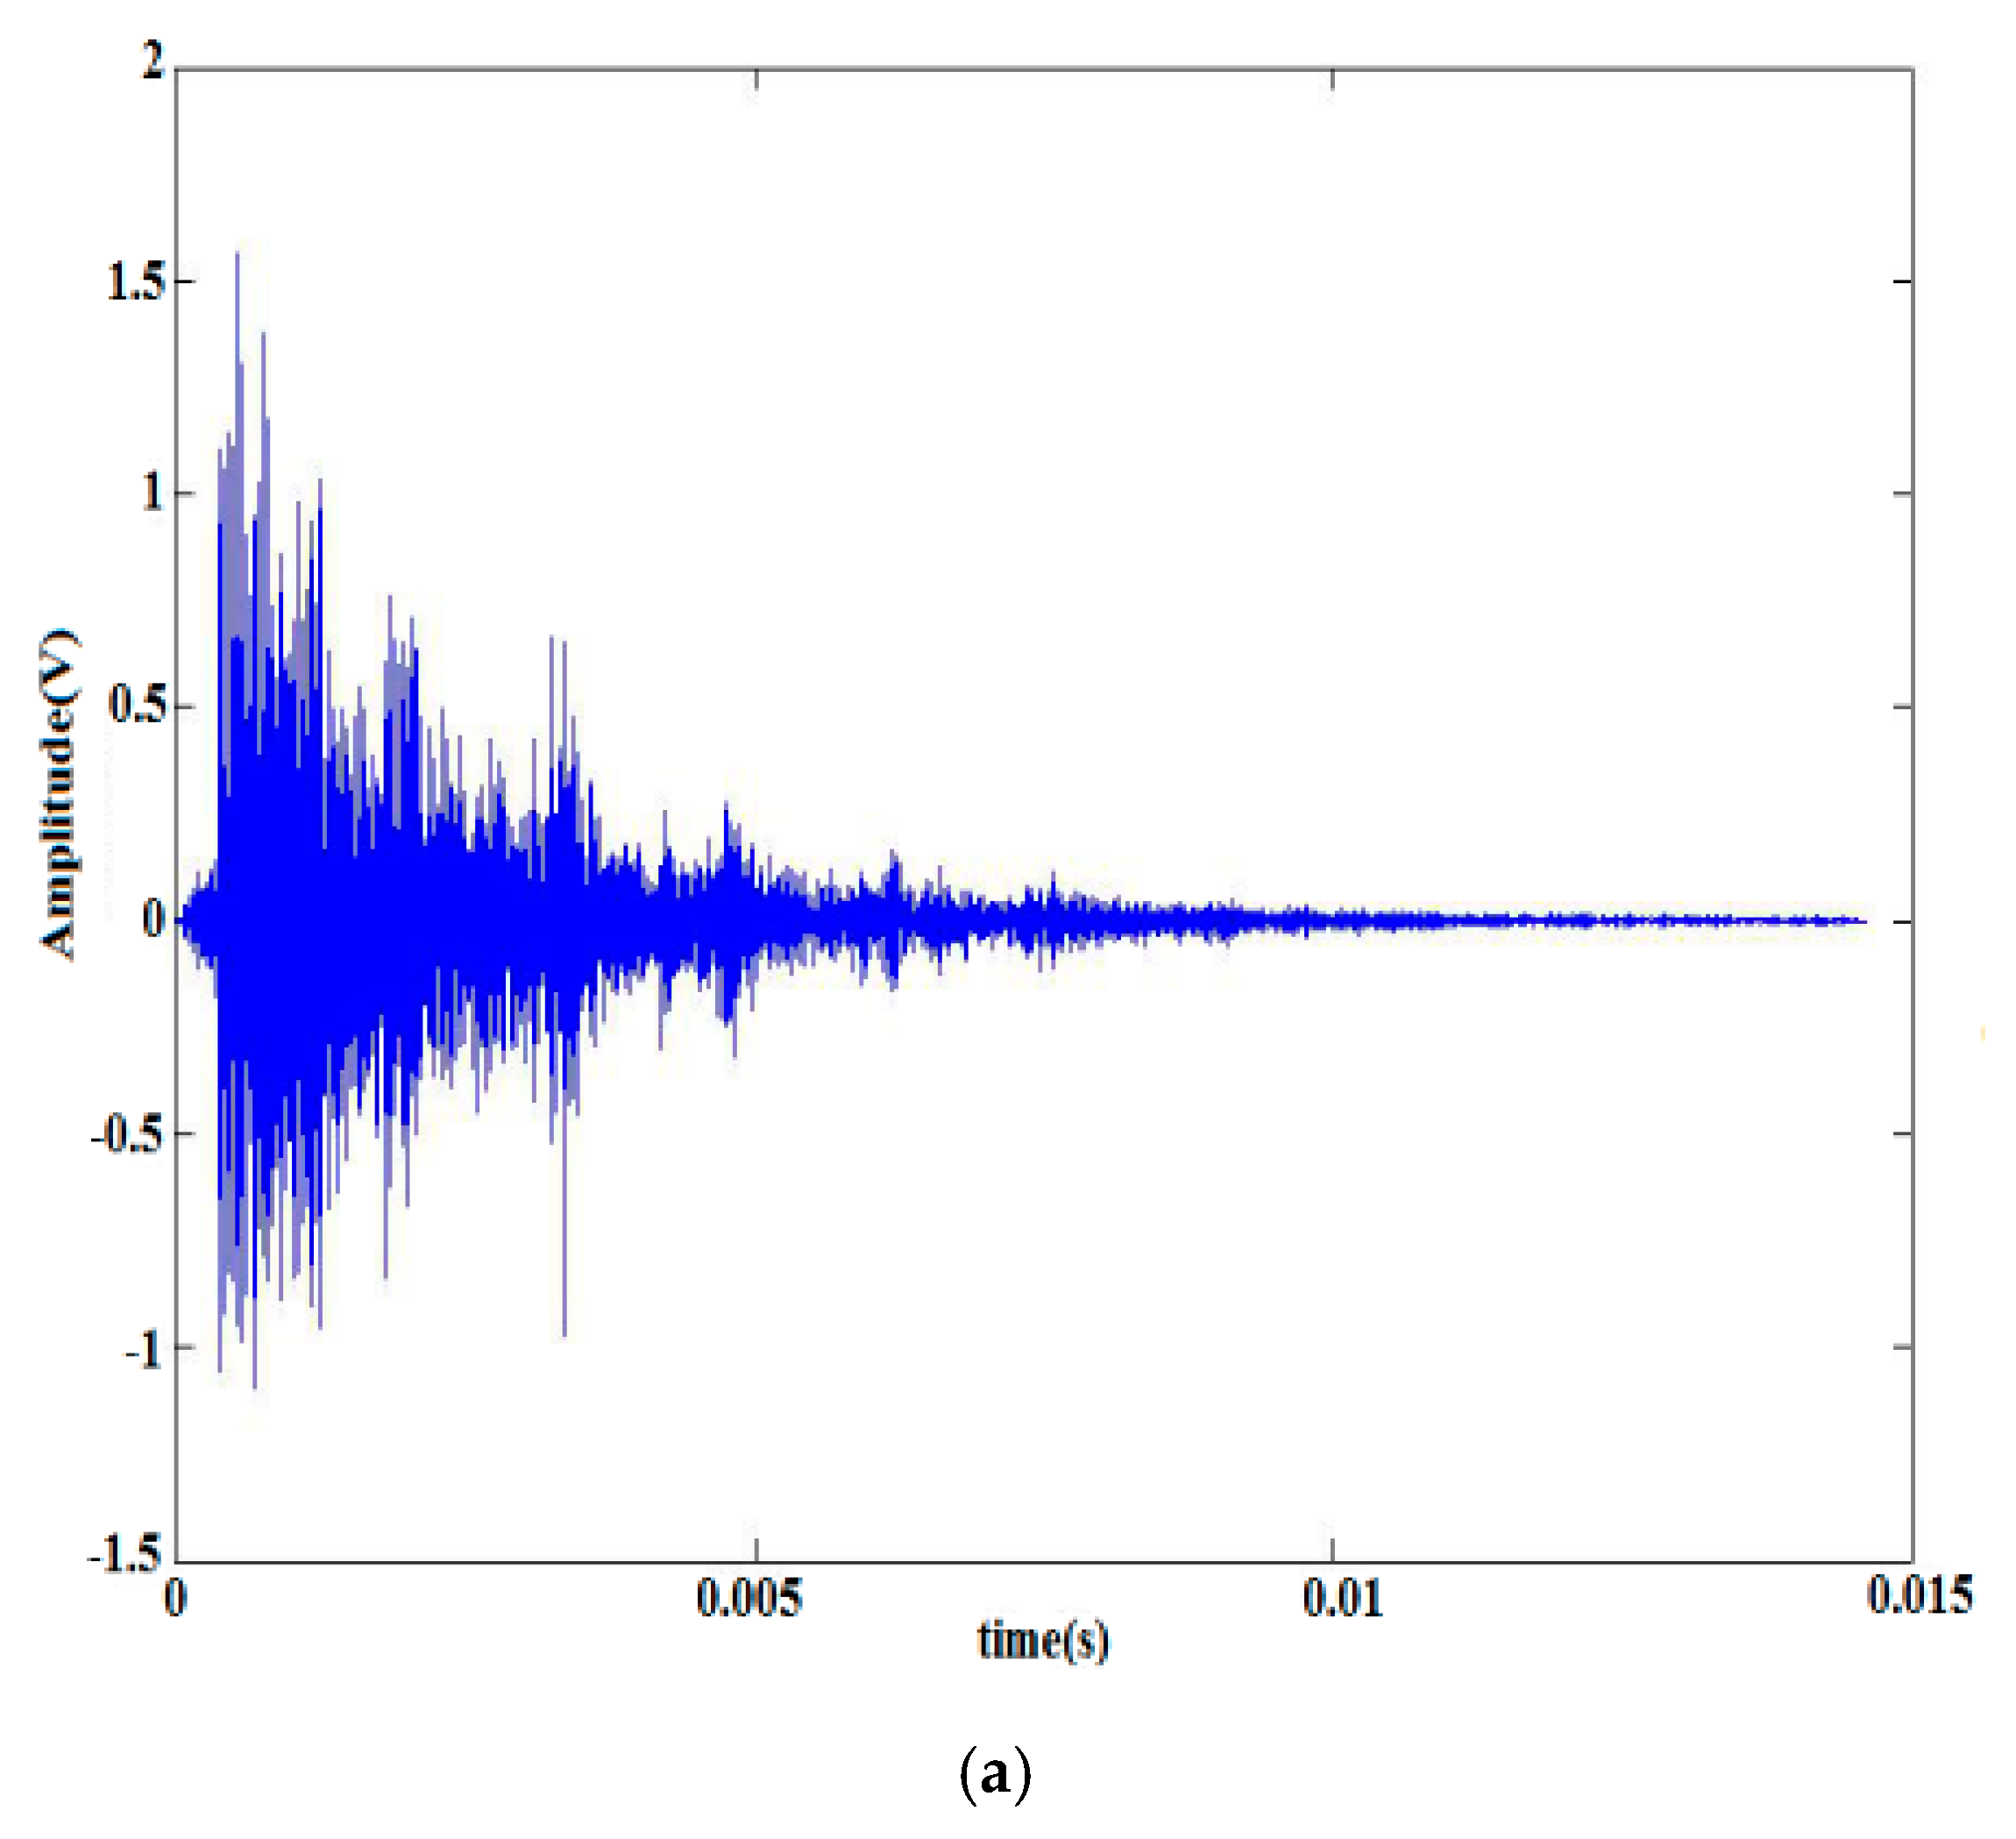
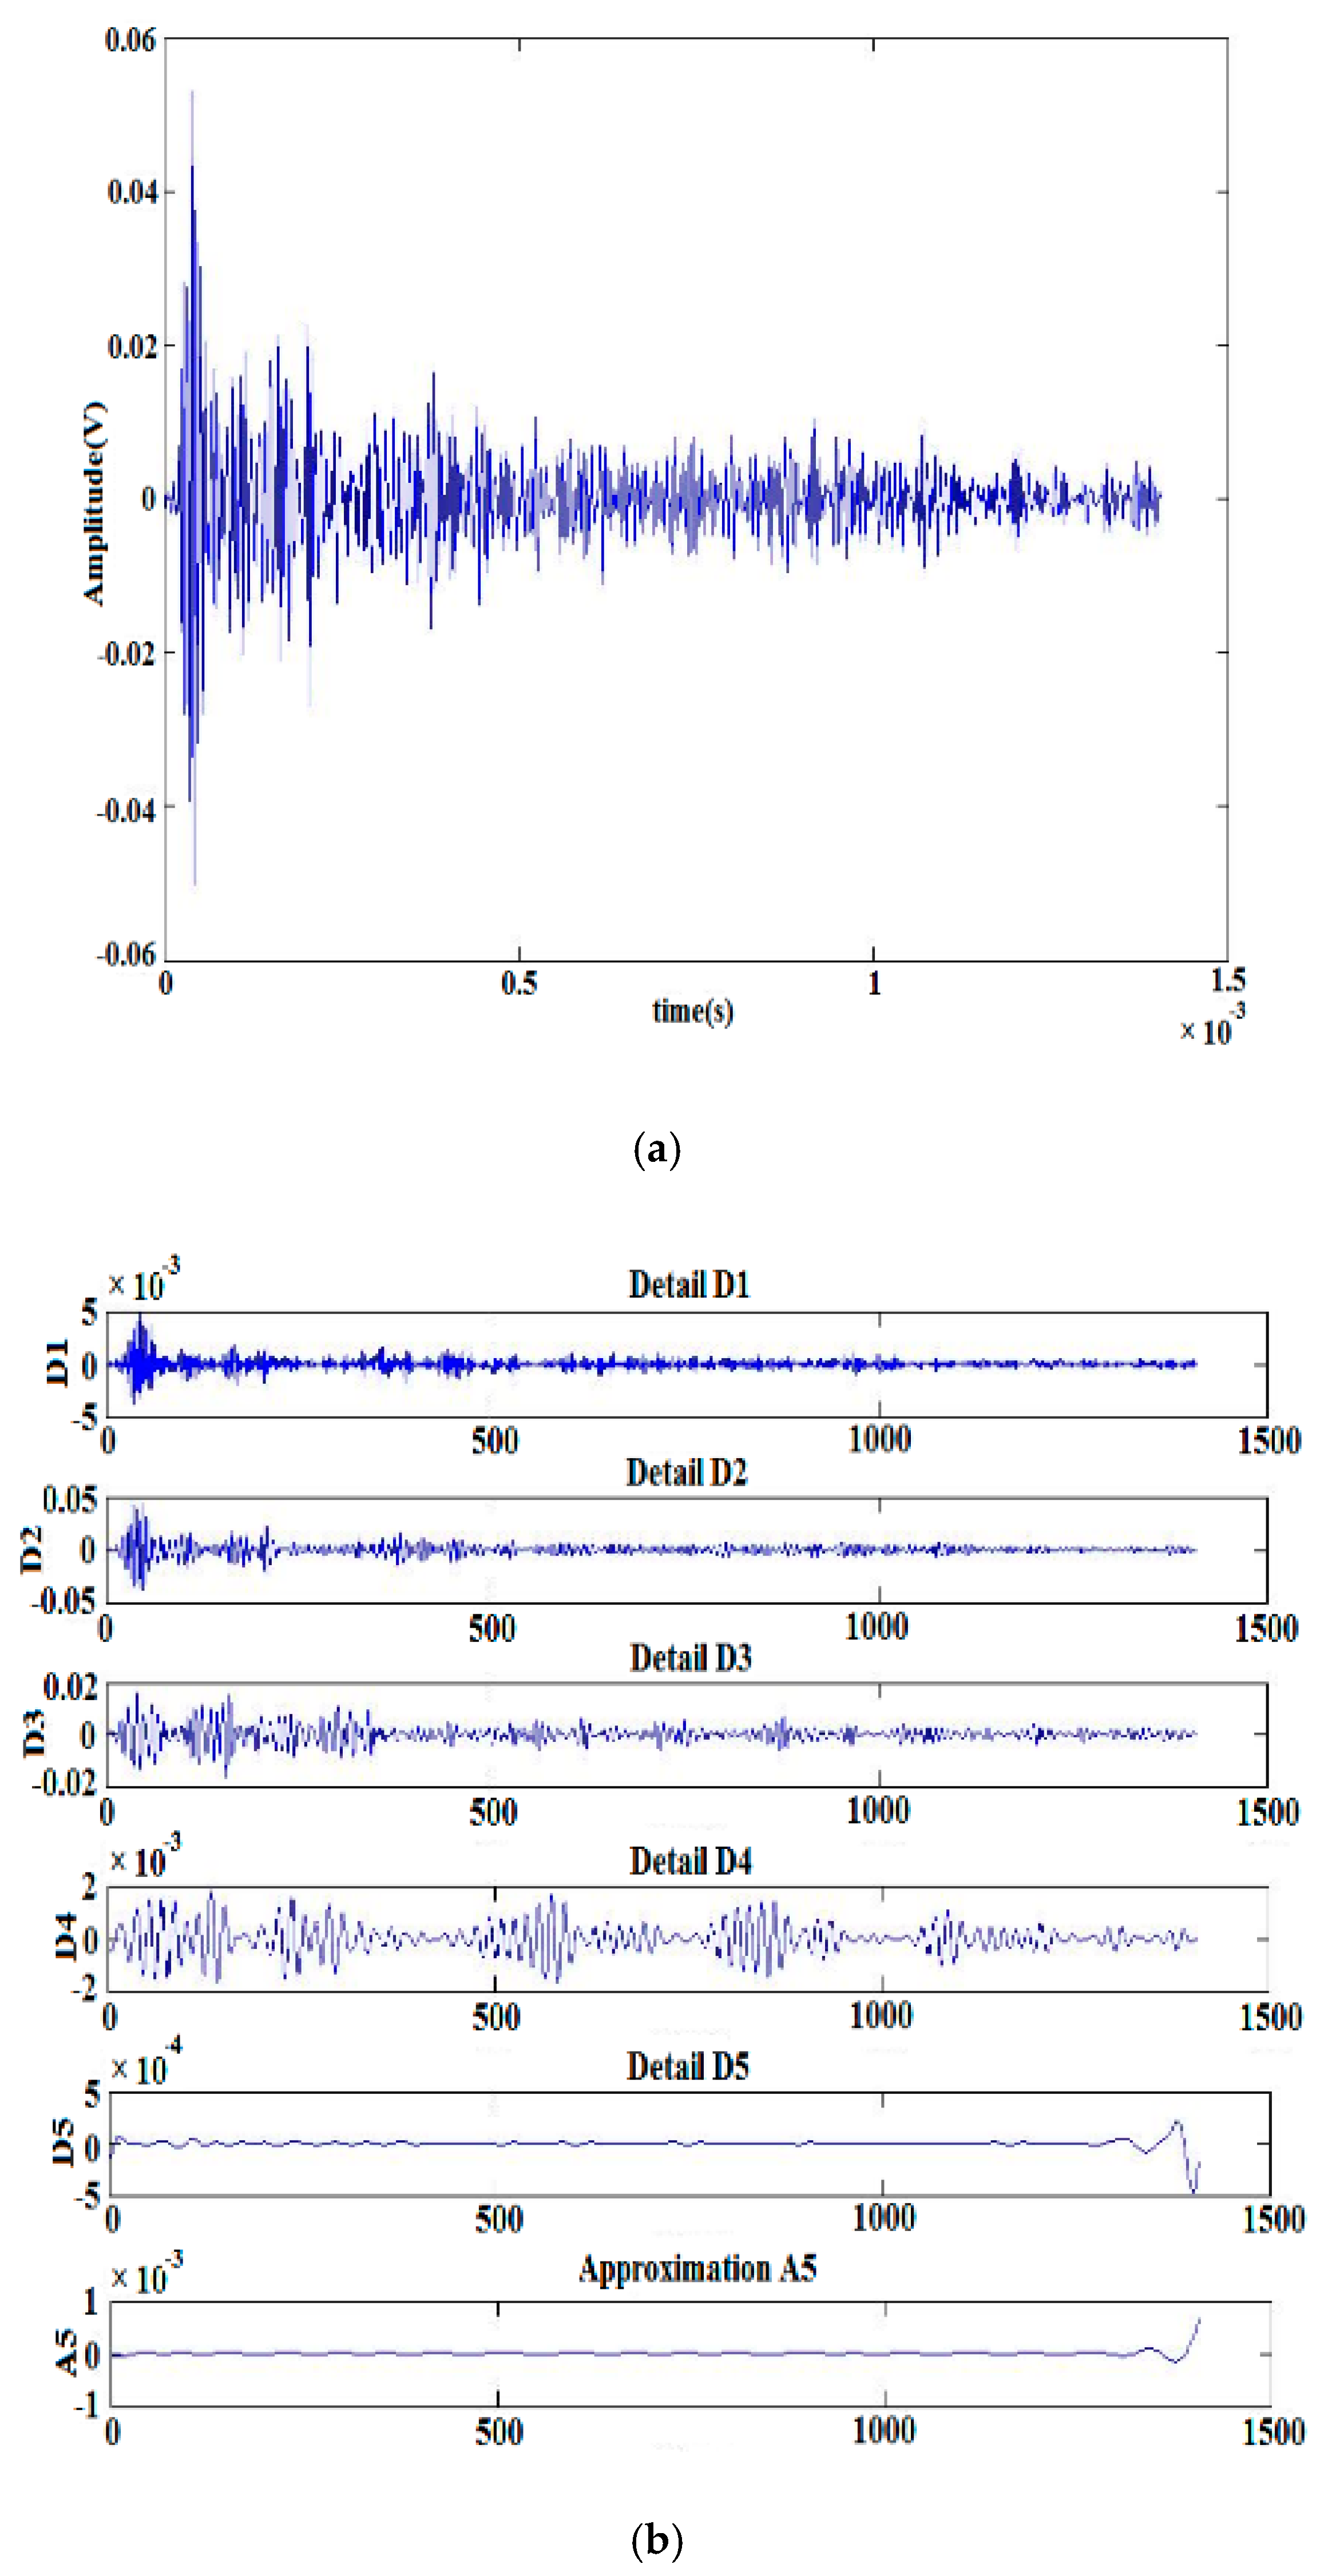
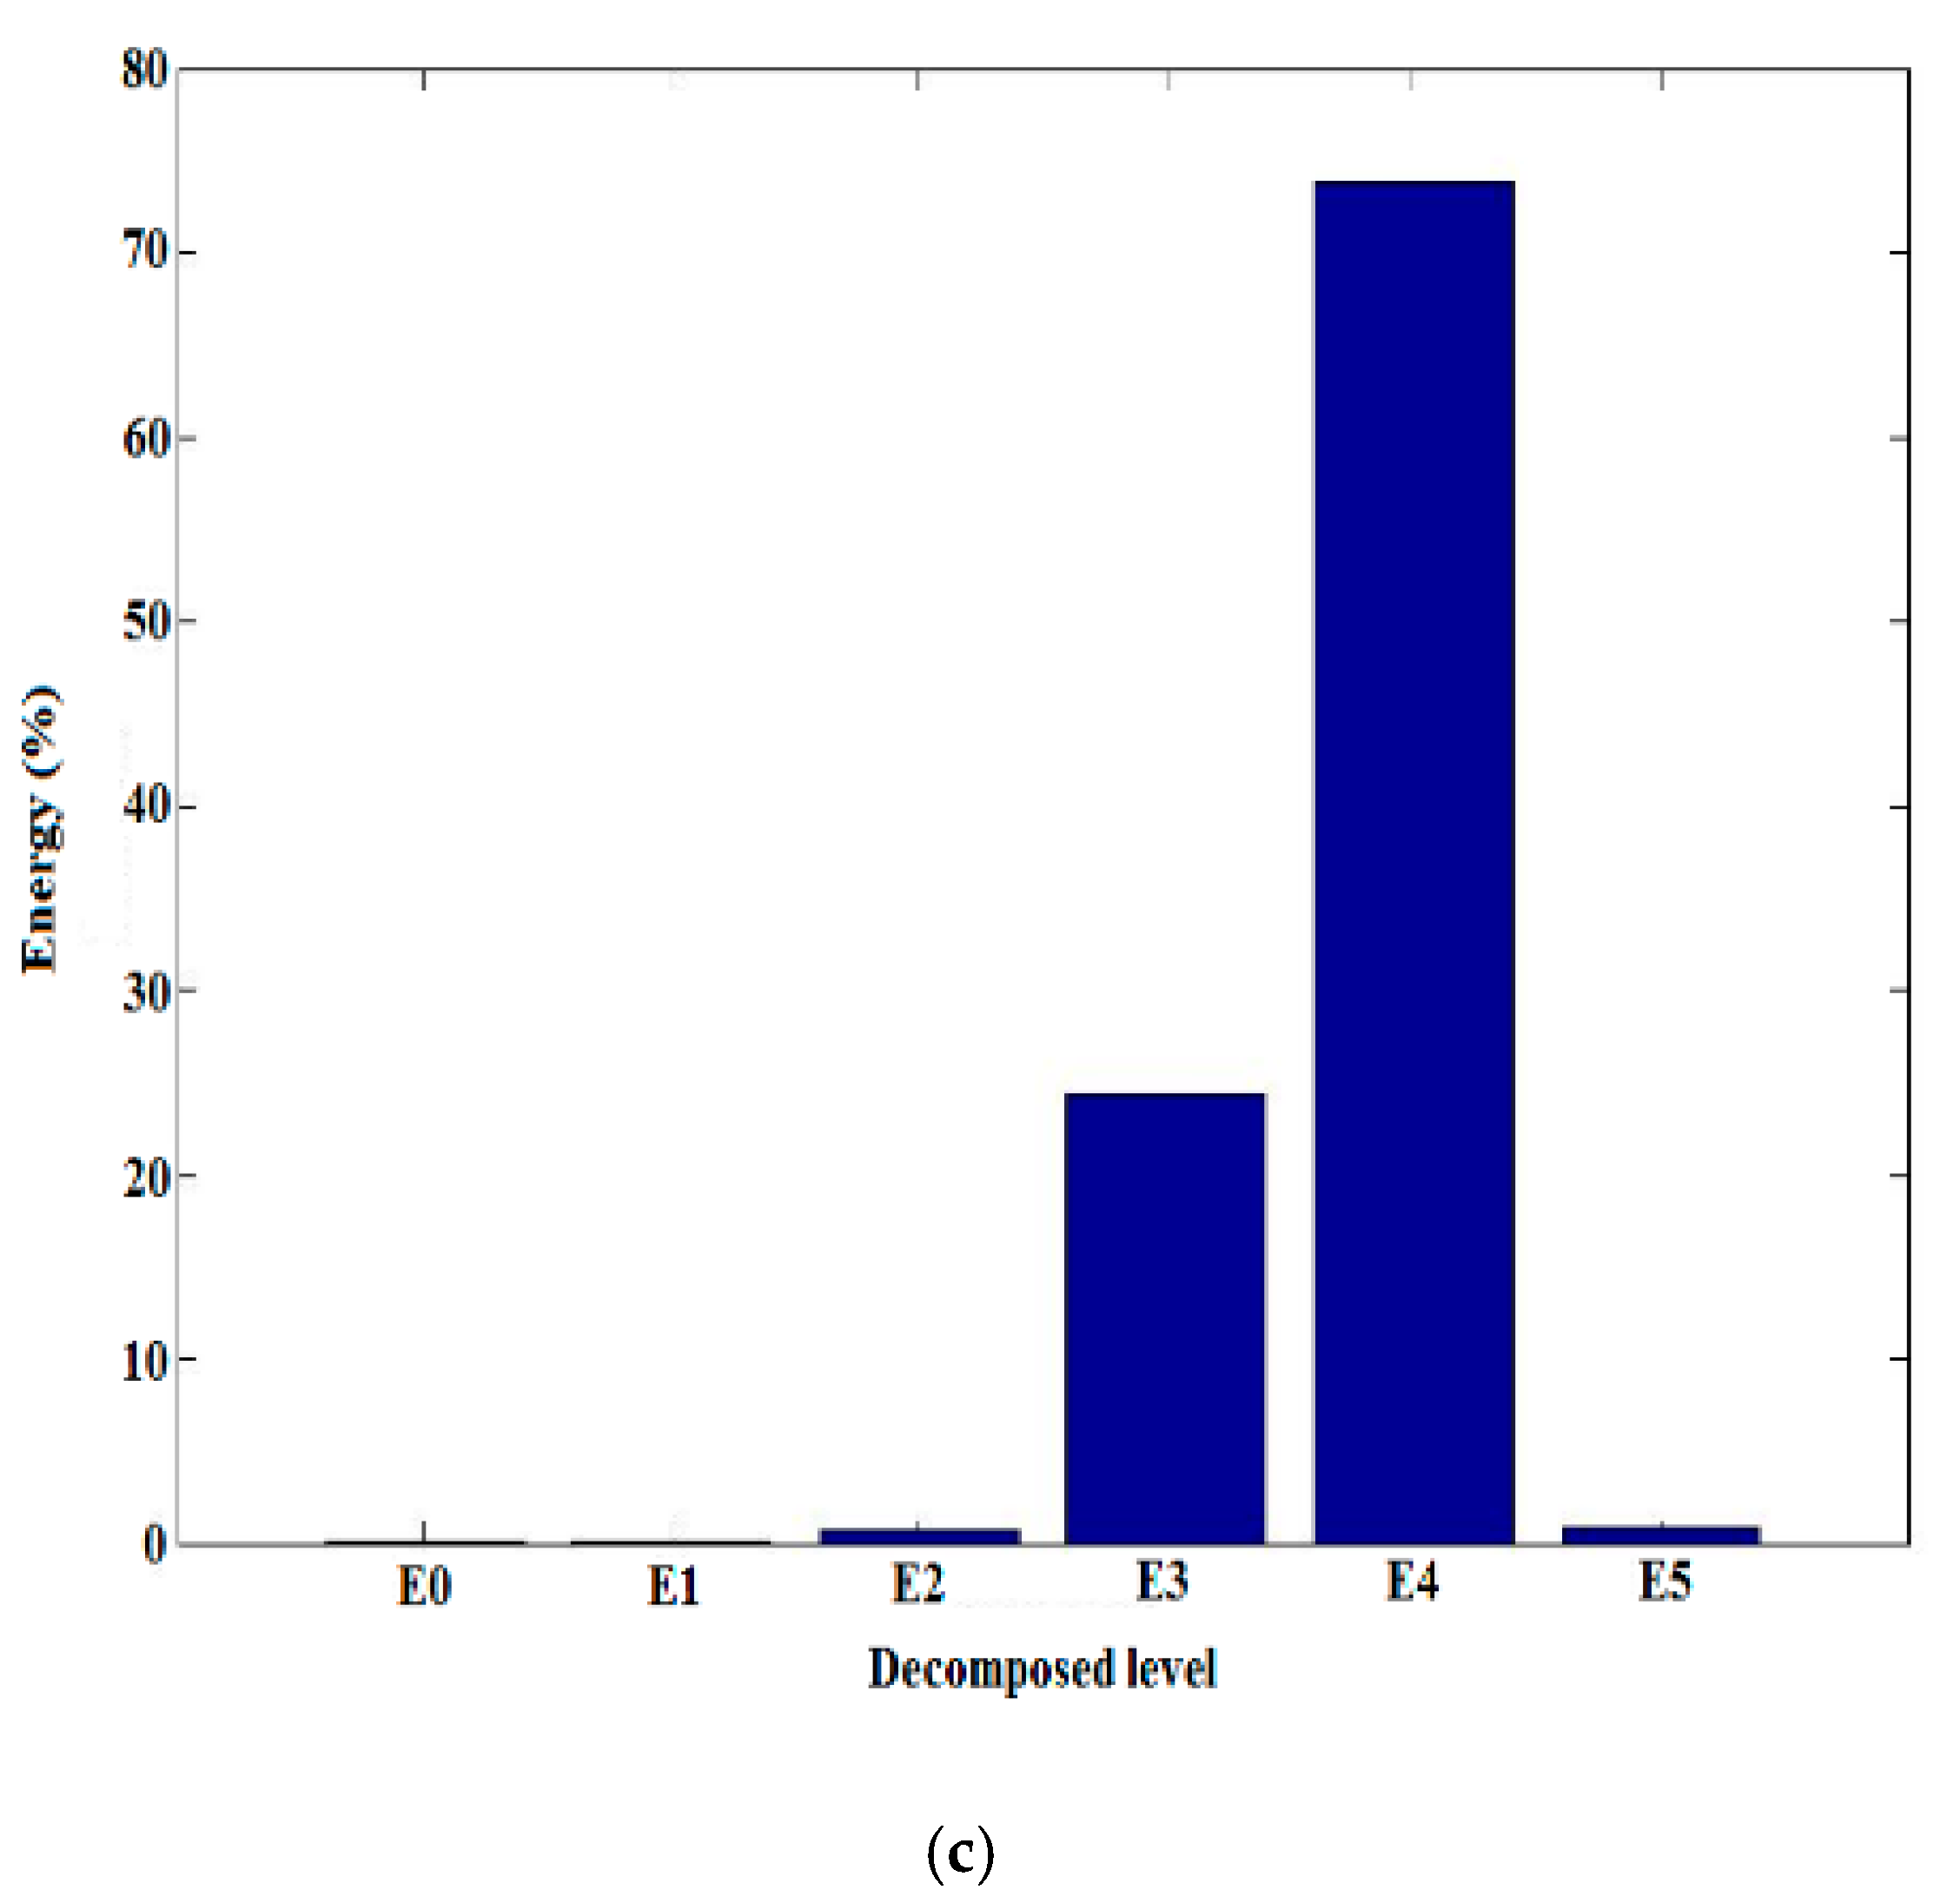
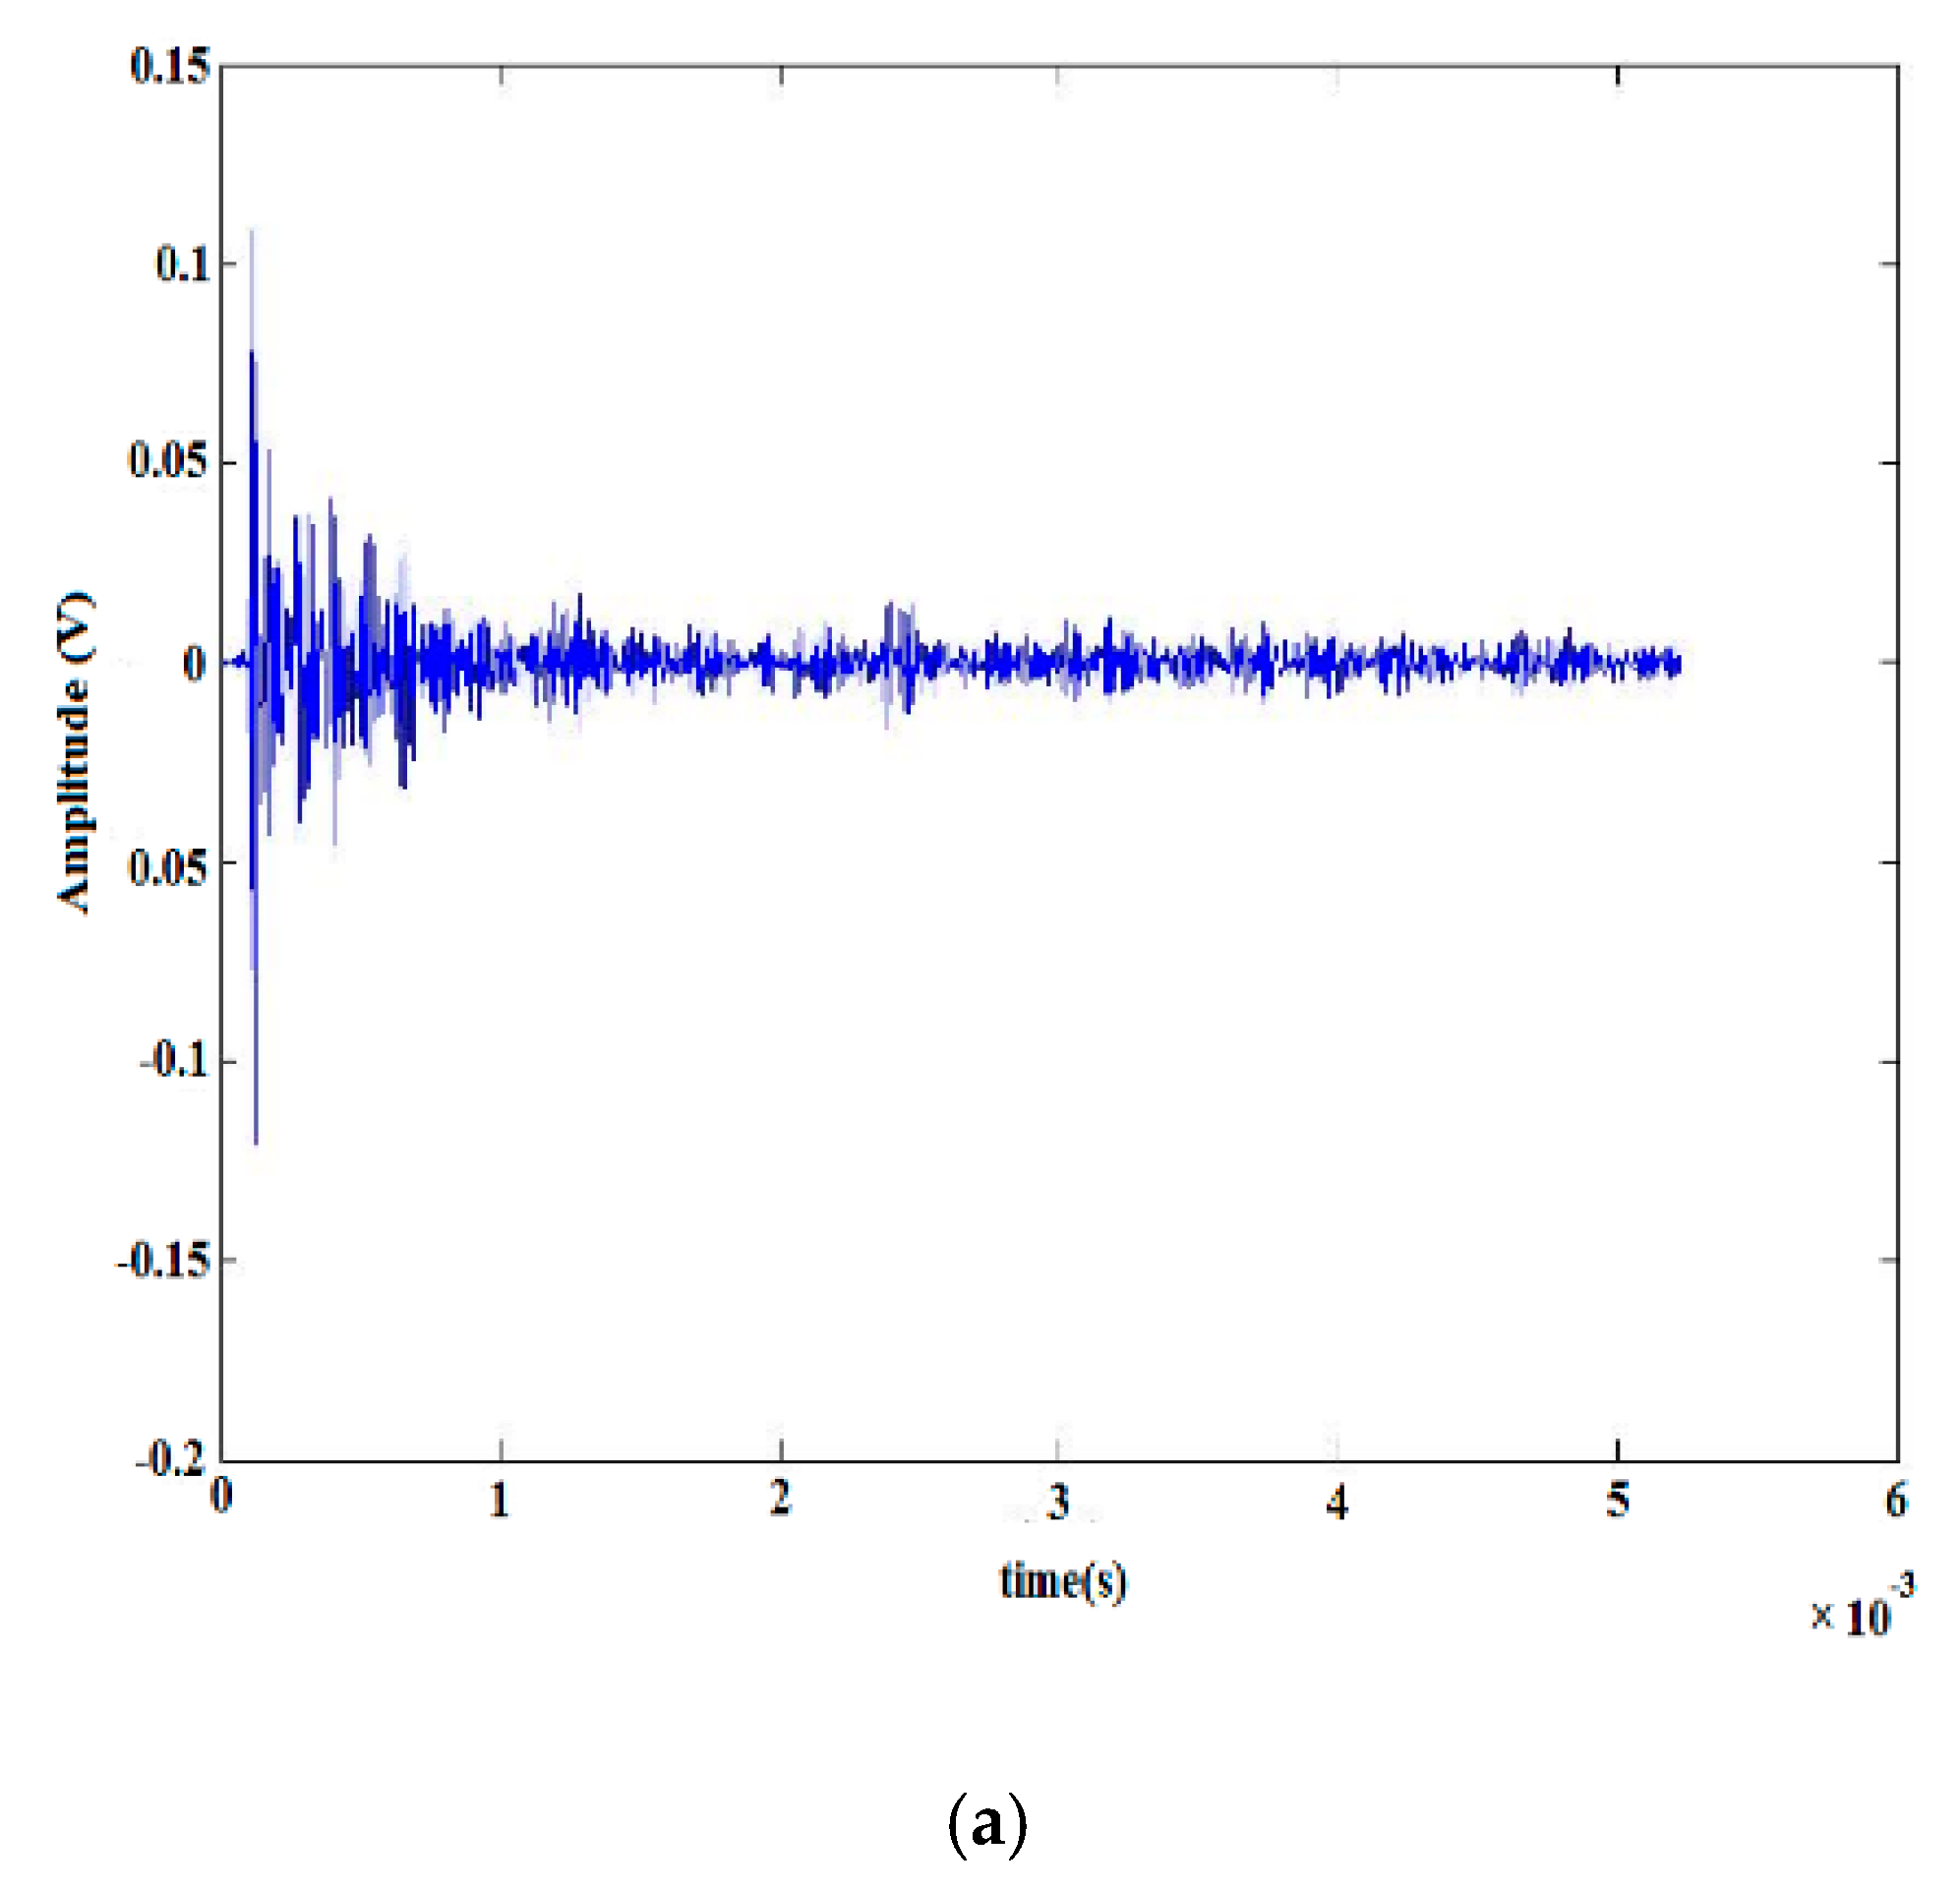
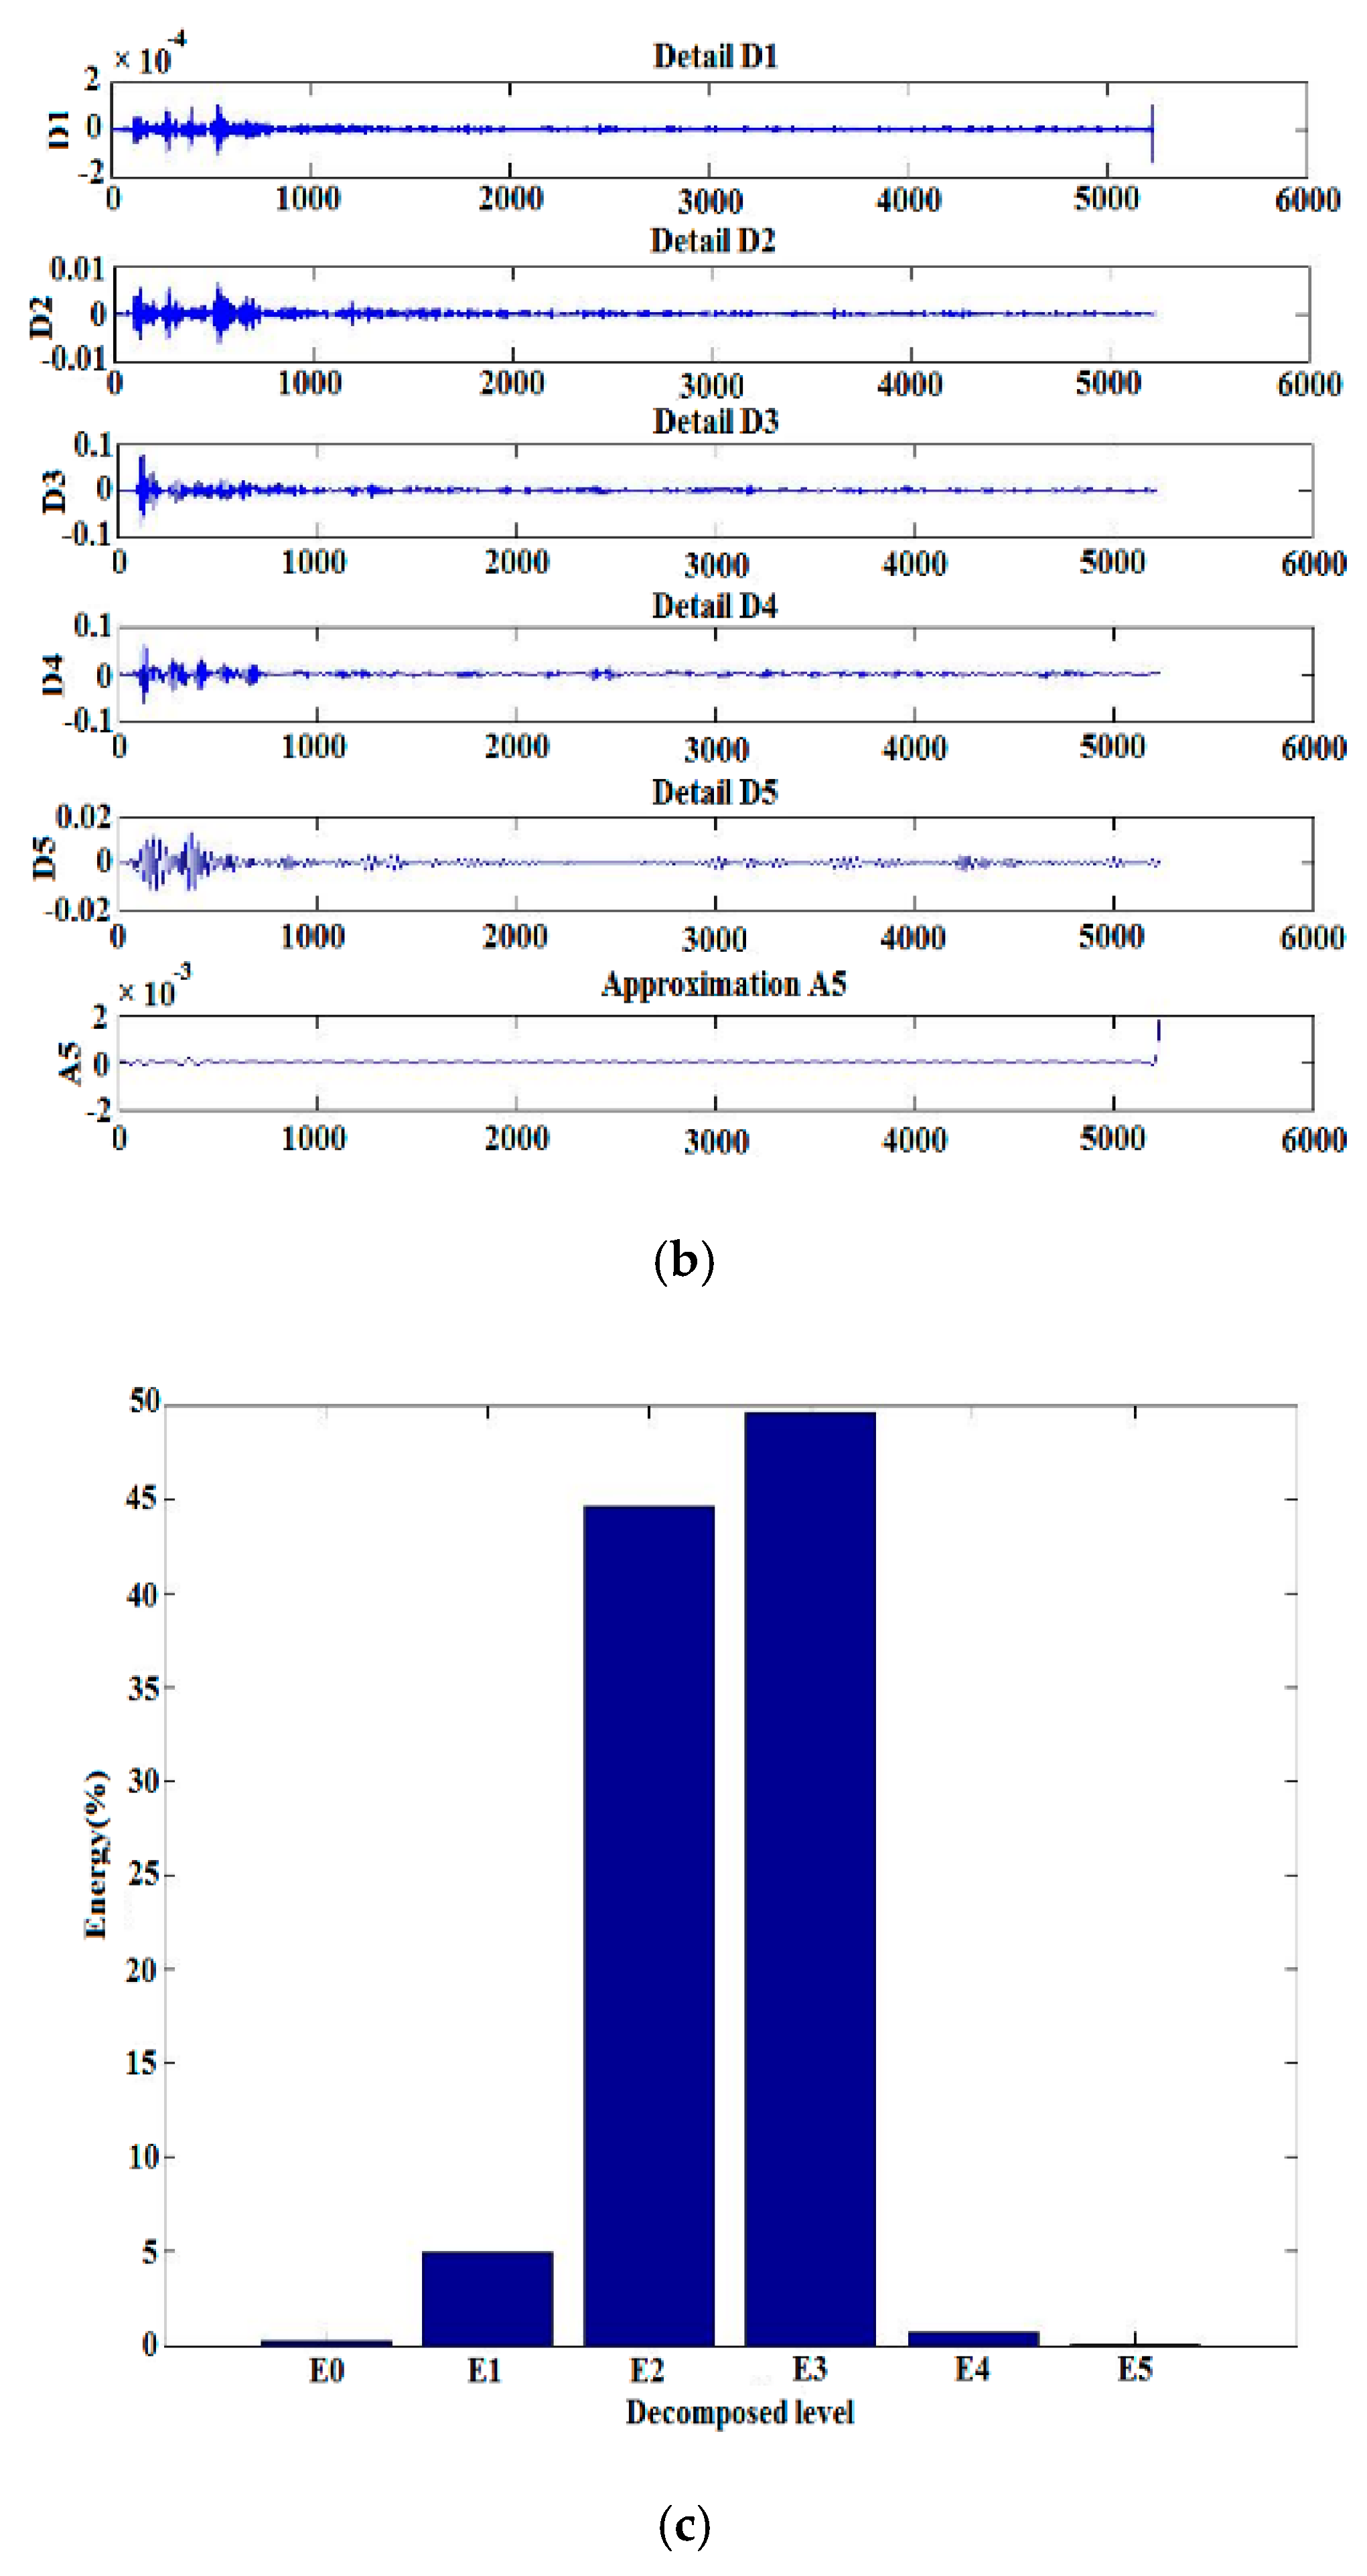
This paper uses Matlab wavelet analysis toolbox [30] to realize wavelet analysis of signals. The most important work before performing wavelet analysis is to first select a suitable wavelet function. The selected criteria are: the accuracy of distinguishing different types of PD according to different wavelet functions. After selecting the appropriate wavelet function, another important task is to determine the number of decomposition layers of the signal. According to the characteristics of PD ultrasound signals, five-layer wavelet decomposition of the signals is the best choice; this is mainly based on the low-frequency information of the signal, because the most important information for the sound signal is kept in the low-frequency part. The time-domain waveform of the needle-plate discharge model, the wavelet analysis graph, and the proportion of energy in each layer of wavelet decomposition are shown in Figure 7, respectively. The time-domain waveforms, wavelet analysis plots of the plate-to-plate air gap, suspension, slide-flash, and creeping discharge model, and the proportion of energy in each layer of wavelet decomposition are shown in Figure 8, Figure 9, Figure 10 and Figure 11.
In our experimental research, we can get the size of the sum of the squares of the wavelet coefficients. The standard for choosing the wavelet coefficients is the best. This time we use Db10 as the mother wavelet function for wavelet decomposition, the number of wavelet decomposition layers is 5. The frequency corresponding to the number of decomposition layers of each energy spectrum is shown in Table 1.
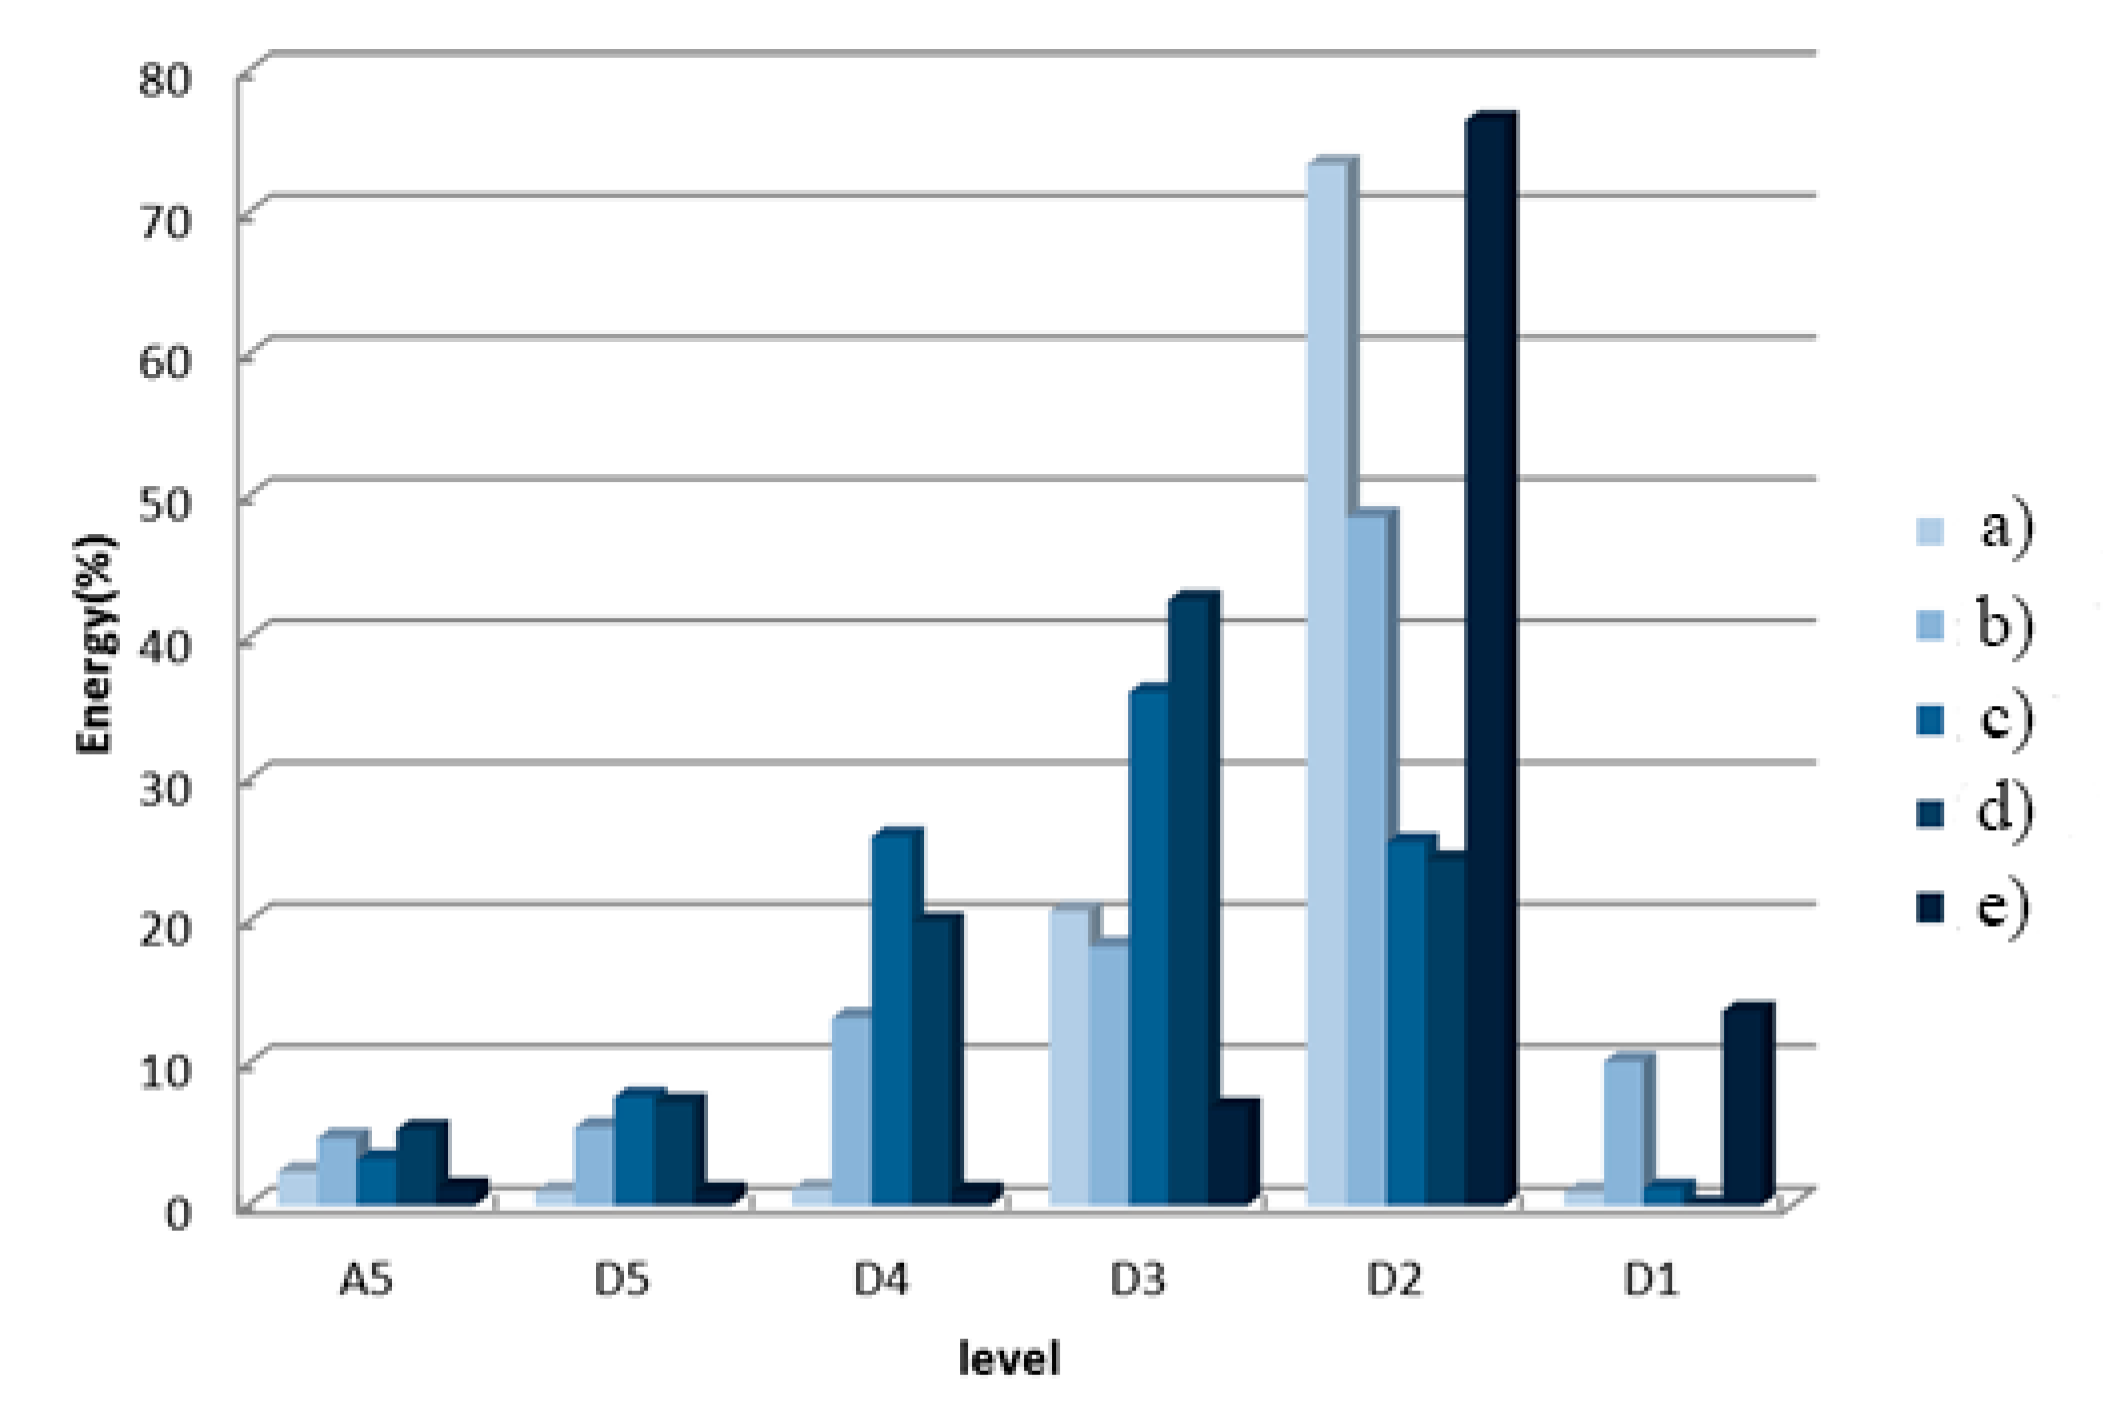
From the energy spectrum of wavelet decomposition above, it can be seen that for different types of PD signals, the characteristics of the signals in the time domain are oscillating and decaying. In the energy spectrum distribution of each signal, it can be found that the energy spectrum distribution of different types of PD signals is different. However, since only a typical signal of each discharge model is selected, such analysis will be more one-sided. In order to obtain the characteristics of the signal energy distribution of each type of discharge, we selected 100 sets of data for each type of signal and analyzed them, and obtained the distribution law of the energy spectrum of various signals. The distribution law of each signal energy spectrum is shown in Figure 12.

5. Pattern Recognition Analysis

5.1. Identification by Energy Distribution

In order to distinguish these five different discharge types, we compare the discharge signal of each different model with the average value of the energy distribution of 100 sets of data through Figure 4, Figure 5, Figure 6, Figure 7, Figure 8 and Figure 9. It can be found:
First, the proportion of the total energy of the signals in the A5 and D5 regions is less than 10%, and the five PD signals are not highly distinguishable.
Secondly, the energy of the needle-plate discharge is mainly distributed in the D3 and D2 areas, distributed at 19.9% and 72.6%, with obvious characteristics and easy to distinguish; The energy D4, D3, and D2 of the suspension discharge are distributed at 12.2%, 18.3%, and 48.5%, with a gradient ascent relationship and discrimination; The energy of the slide-flash discharge is mainly distributed in the D2 and D1 regions, with 74.5% and 12.6% distribution, the characteristics are also quite obvious, and the discrimination is good.
However, the energy of the creeping discharge is mainly at D4, D3, and D2, which are distributed at 24.2%, 36.1%, and 22.2%, which are approximately parabolic peaks; The energy of the plate-to-plate air-gap discharge is mainly distributed at D4, D3, and D2, distributed at 19.4%, 41.5%, and 21.3%, which are very close to the form of creeping discharge. The data of the two are also close to each other, and it is difficult to distinguish them separately.
Finally, three kinds of discharge models of needle-plate, creeping and slide-flash can be classified by the change of amplitude in different decomposition layers. For the two discharge models of creeping discharge and plate-to-plate air gap discharge, although there are certain differences in the energy amplitude of different decomposition layers, the difference is small, within 6%; it is difficult to distinguish between the two types of discharge in practical applications, so a more reasonable method is needed to classify the two discharge models. In this paper, the neural network method is selected to classify the creeping discharge and plate-to-plate air-gap discharge models.

5.2. Recognition Using BP Neural Network

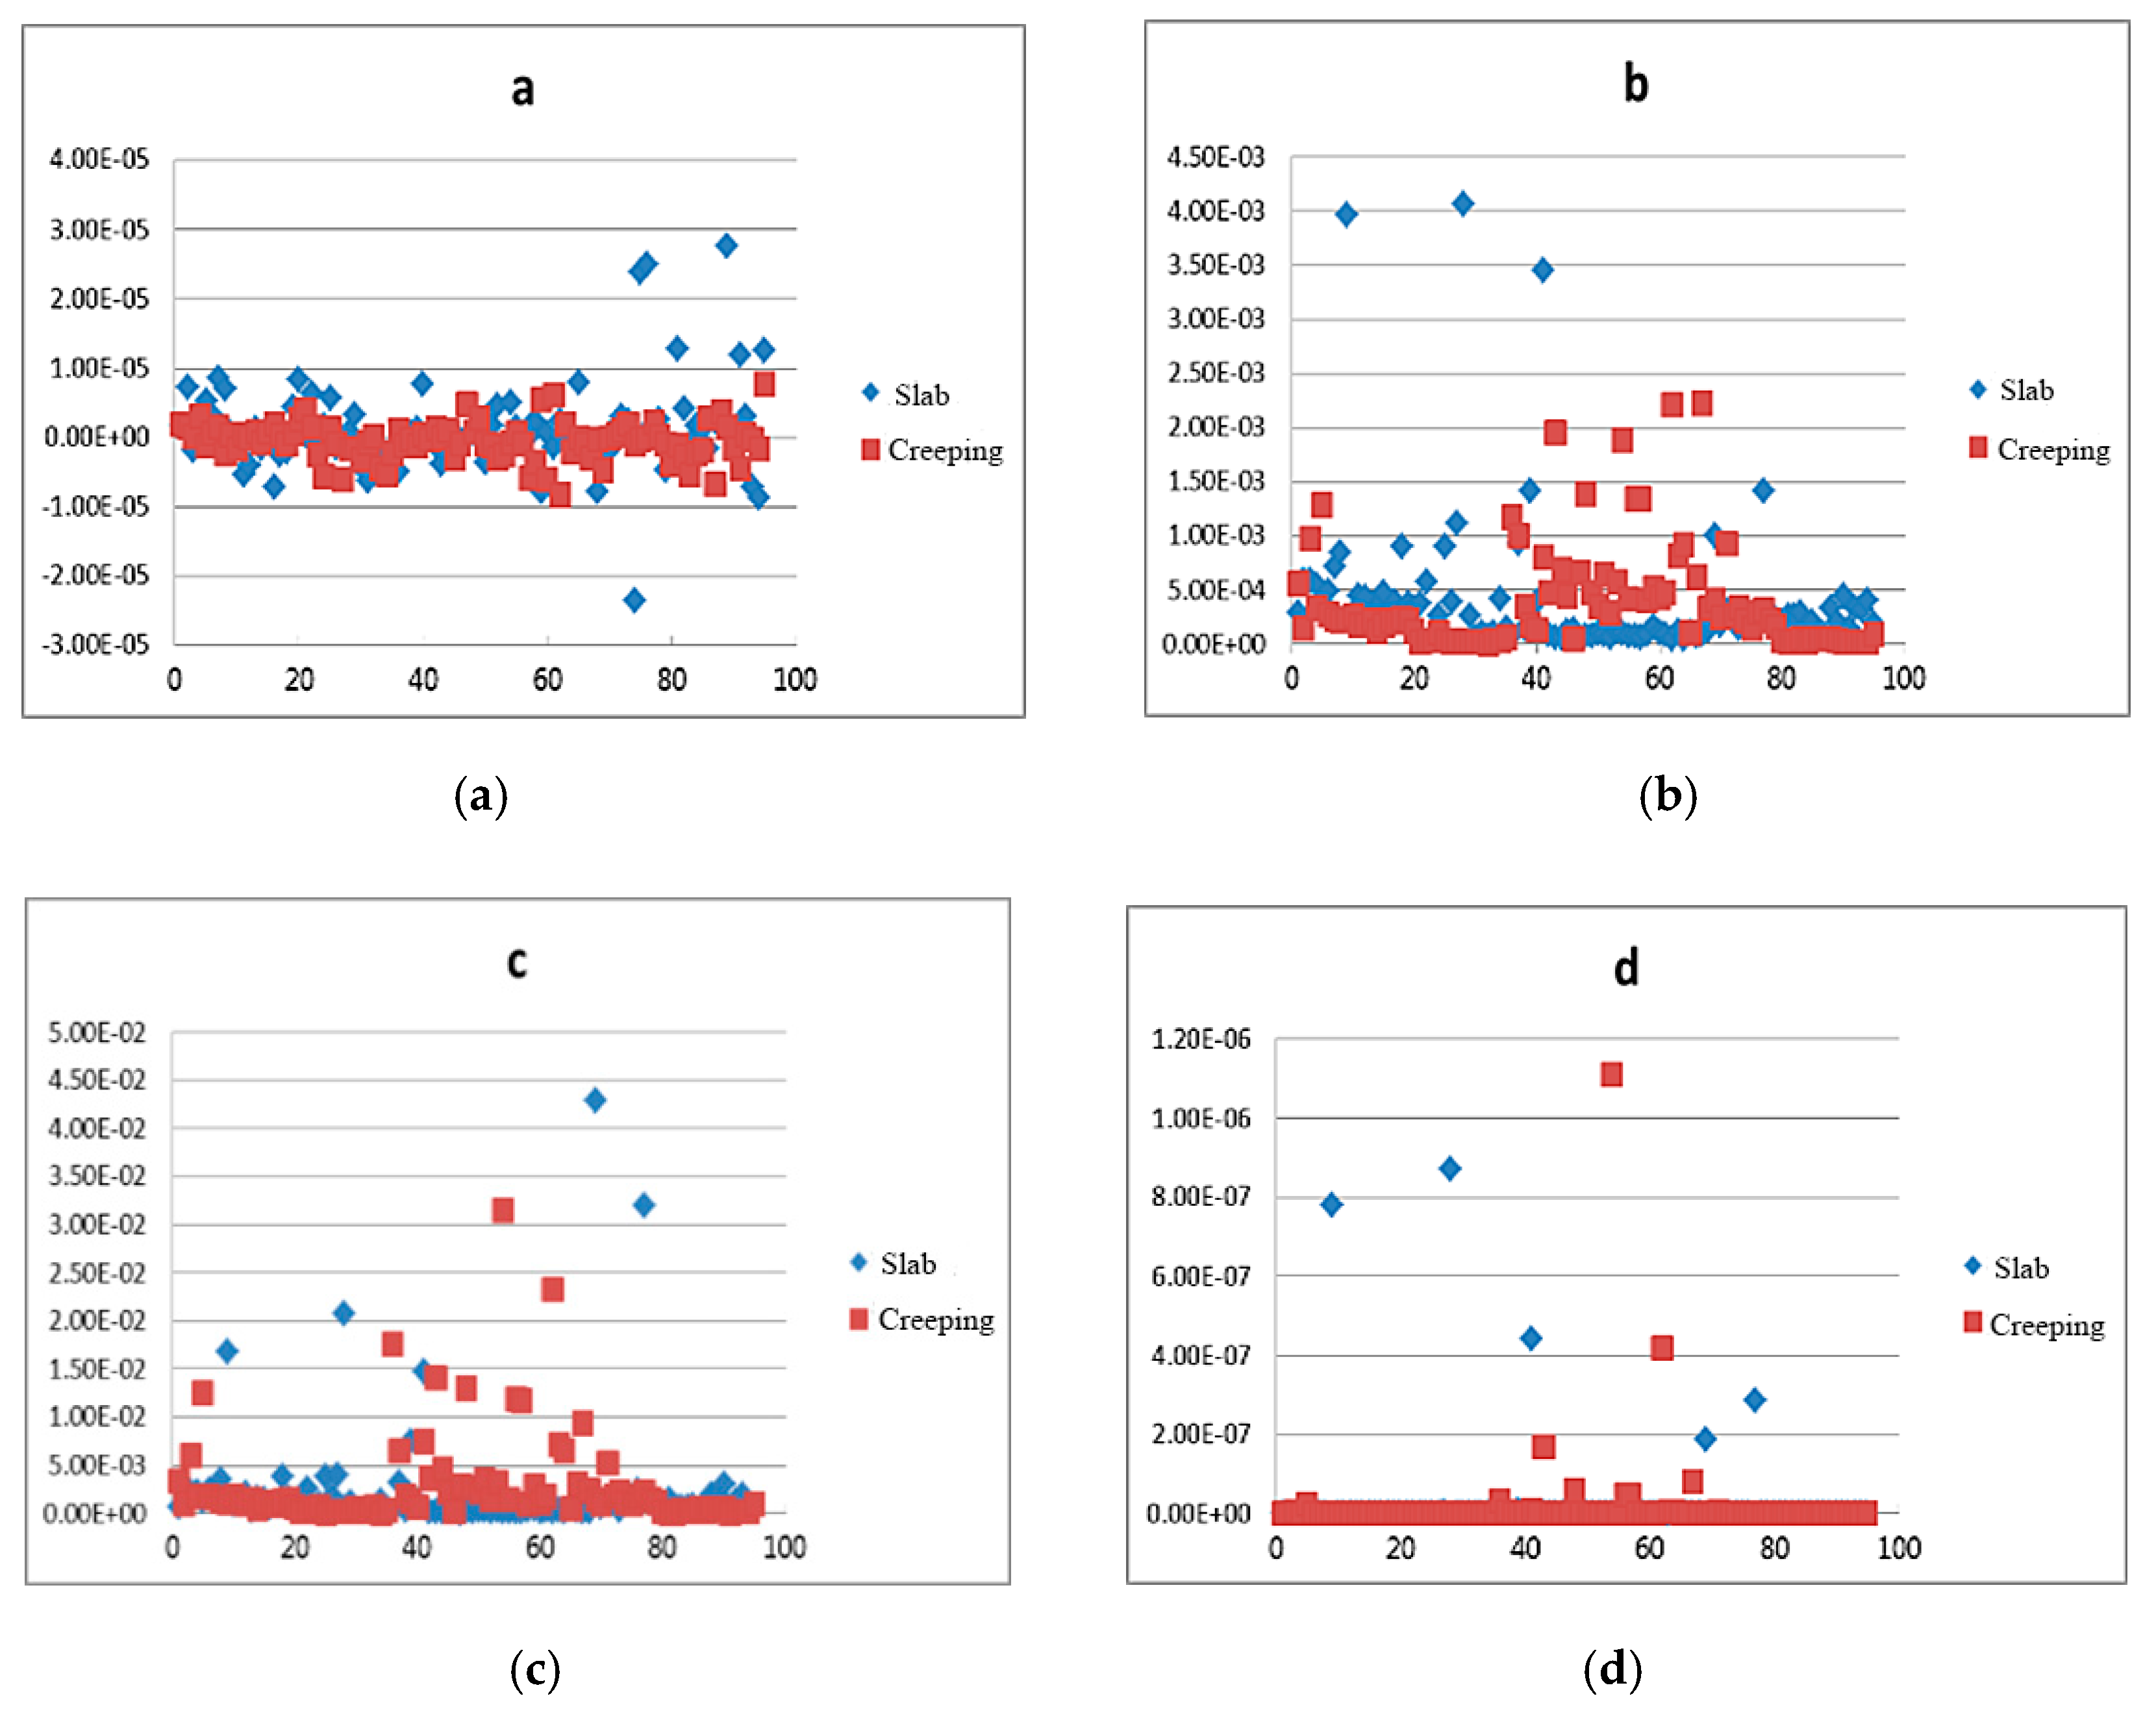
The BP neural network is used to identify creeping discharges and plate-to-plate air-gap discharges. Wavelet analysis is needed to analyze the PD ultrasonic signals to obtain the characteristic quantities of PD signal characteristics. A total of 6 feature quantities are proposed in this paper, as shown in Formula (9).
{ a = 1 N n = 1 N x [ n ] b = ( 1 N n = 1 N ( x [ n ] a ) 2 ) 1 2 c = 1 b a 3 ( x [ n ] a ) 4 d = 1 N a 4 n = 1 N ( x [ n ] a ) 4 e = a b f = b d 4 , d 3 a d 4 , d 3 ,
In Formula (9): x[n] is the wavelet coefficient of the nth layer wavelet decomposition; N is the total number of wavelet coefficients; f represents the meaning is the ratio of the variance and the average value of the wavelet decomposition of the D4 and D3 layers. This article selects six parameters to describe the PD, and the article selects 100 sets of data to calculate these six parameters. Figure 13 shows the values of the six parameters of the two models of plate-to-plate air gap discharge and creeping discharge.
From the six parameter values of the above two discharge models, we can see that a single parameter has a weaker change trend and regularity for the two discharge models. So after introducing these six parameters, we combined the classification and recognition technology of the neural network with these six parameters to get better classification results. Finally, by using a gray scale analysis system, we selected three parameters a, b, and e as the quantities to characterize the PD characteristics.
The wavelet neural network approximates the objective function y(x) by a linear combination of wavelet functions. The output of the wavelet neural network is shown in Equation (10).
f ( x ) = i = 1 N I ( x ) w i ψ ( x b i a i )
N is the number of neurons in the wavelet neural network, and wi is the weight from the input layer to the hidden layer of the wavelet neural network. In this paper, we use the AFPE method to determine the number of neurons in the wavelet neural network. The specific expression is shown in Equation (11).
J A F P E ( f S ) = n + N d I + 2 N n N d I 2 N 1 2 n j = 1 n ( f s ( I j ) y j ) 2
In the above formula, fs represents the output function of the wavelet neural network, N is the number of neurons in the wavelet neural network, dI is the dimension of the wavelet neural network, and n is the number of input characteristic parameters used to train the wavelet neural network.
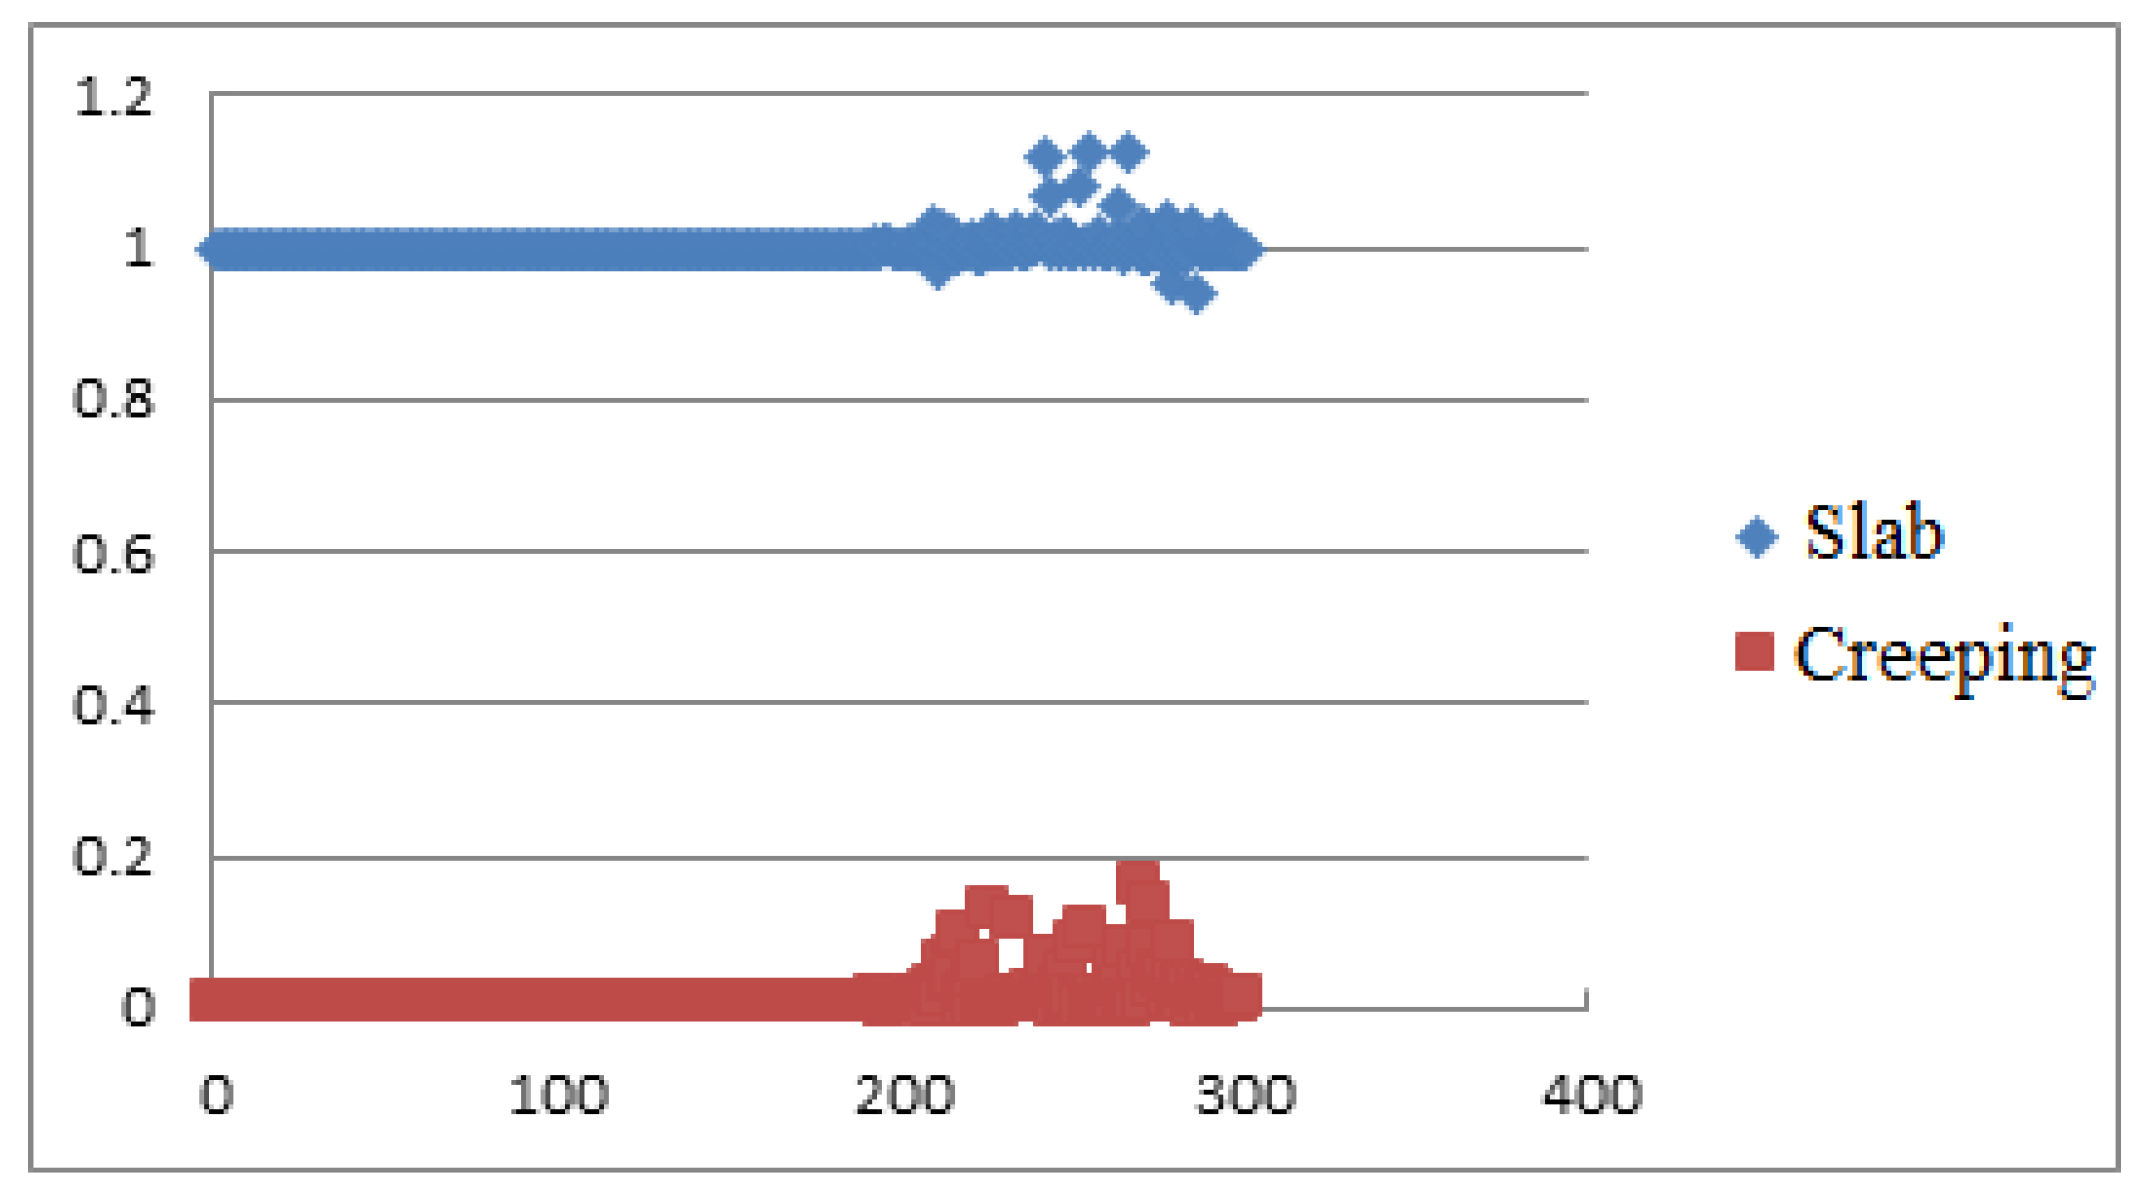
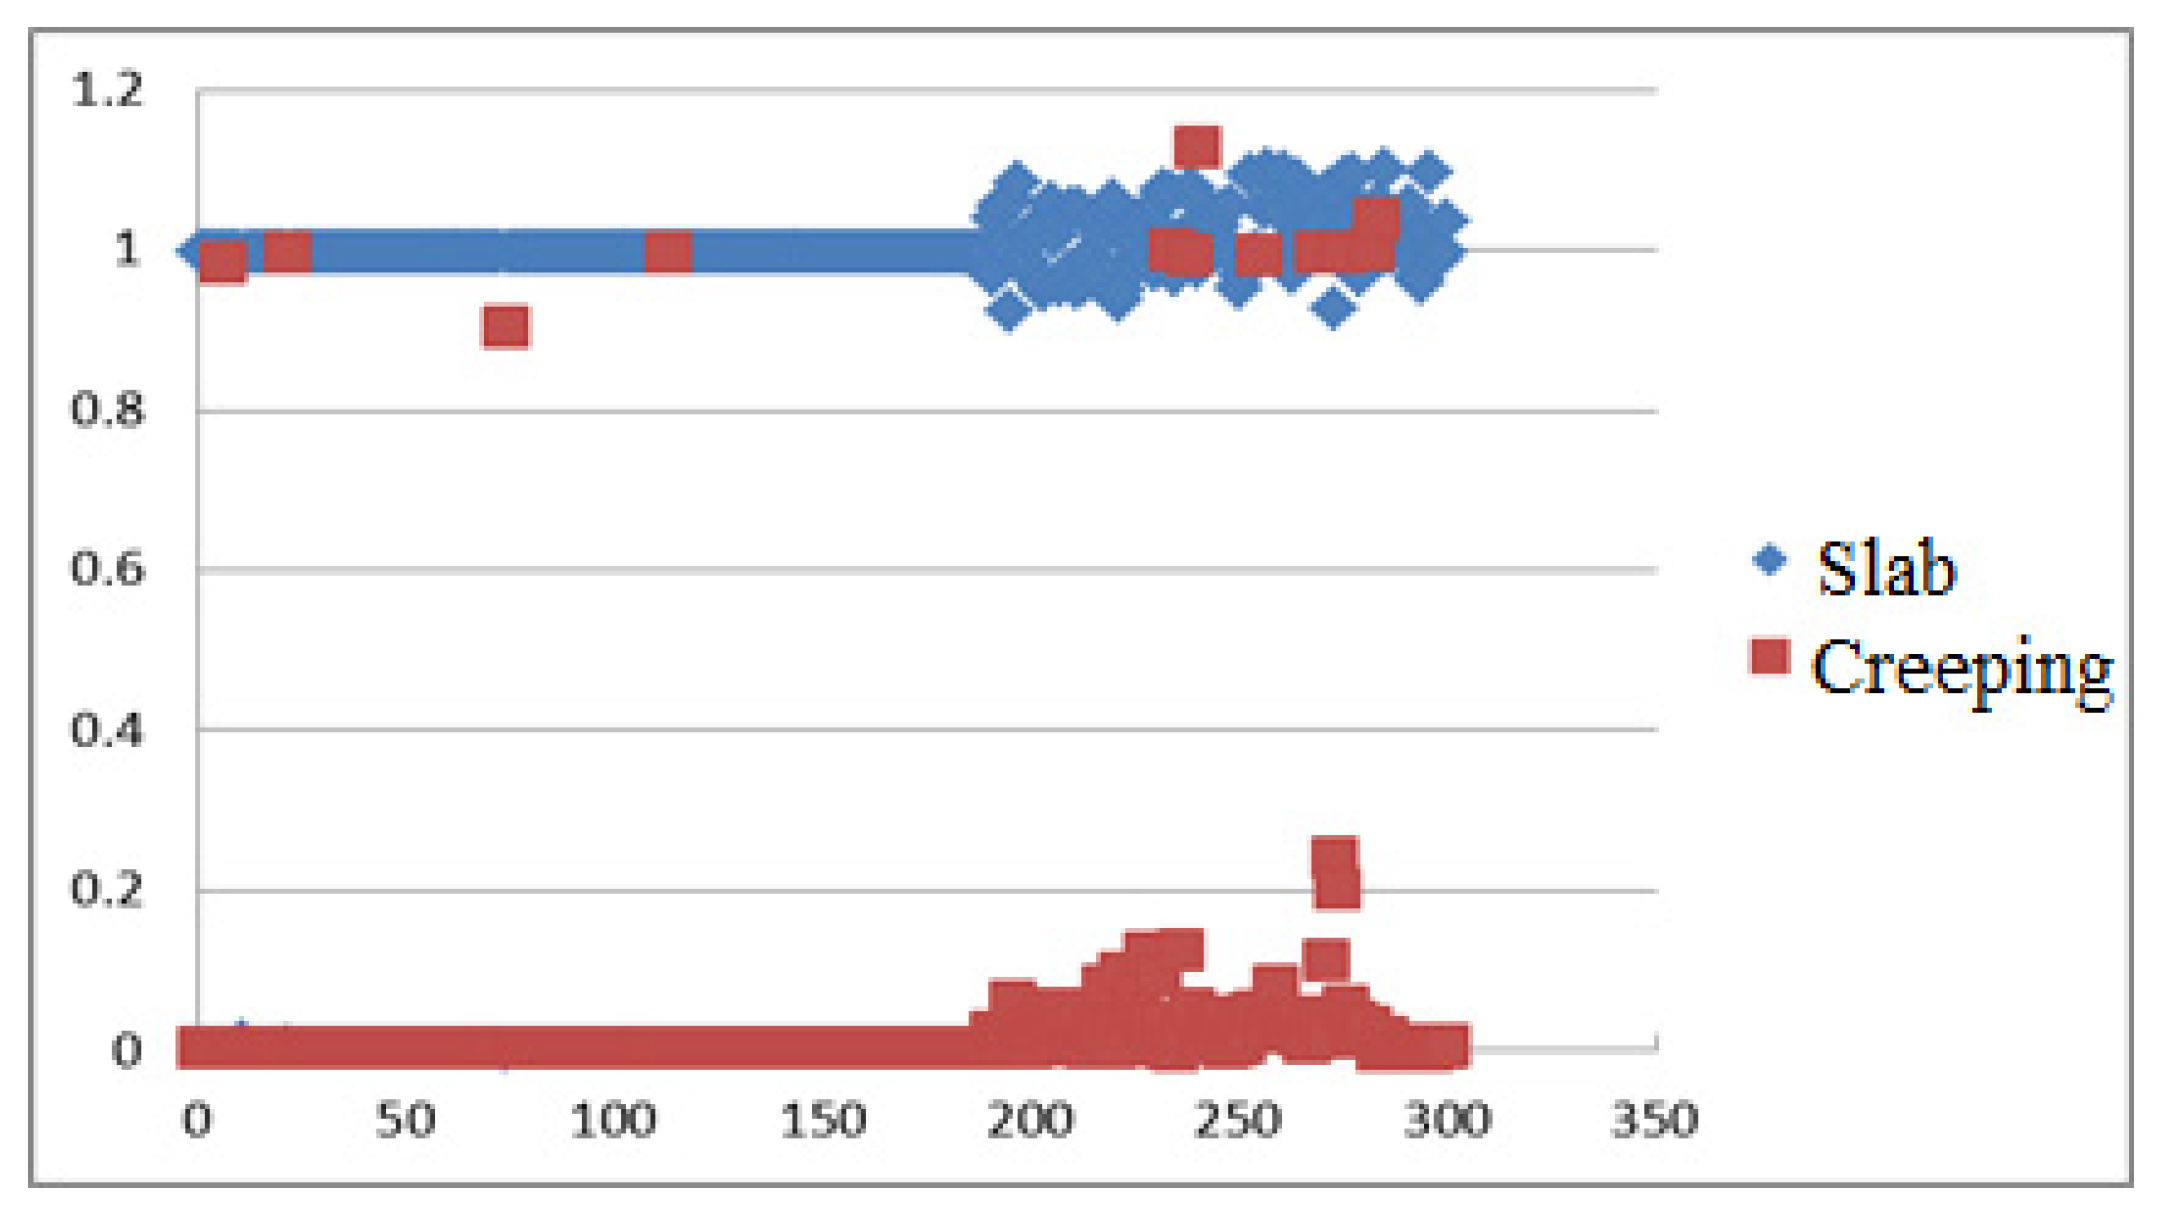
This paper chooses a three-layer neural network, the number of nodes in the hidden layer is 7, and the output layer uses Db10 as the activation function of the output layer, call up Formulas (10) and (11). First, three values of a, b, and e of 100 sets of data are selected and input to the neural network. The neural network is trained and the weight of the neural network is adjusted. Then, after re-selecting 100 sets of new data into the neural network, the ability of the neural network to accurately classify is verified. An output value of 1 indicates a plate-to-plate discharge model, and an output value of 0 indicates a creeping discharge model. Figure 14 shows the results after training the neural network. Figure 15 shows the classification results of the trained neural network for the new data.
After training the neural network, the correct probability of data classification has reached 96%. Of course, we will improve the method and increase the training in subsequent studies, and strive to make the accuracy rate to 100%.
Finally, through multi-scale analysis and BP neural network research, we finally realized the differentiation of five types of PD in five types of cable terminations. Through the different types of partial discharge, we can monitor the insulation status of the cable termination; and at the same time, it can also be used to help improve the production process and material formulation.

6. Conclusions

This paper studies the processing methods of ultrasonic signals for PD in liquid/solid composite media, and obtains the ultrasonic signals of five PD models of needle-plate, slide-flash, suspension, creeping and plate-to-plate air gap discharge. Firstly, interference is suppressed by wavelet denoising, and then multi-scale analysis is used to energize the signal. Then, the neural network is used for classification and recognition. Finally, multi-scale analysis and the BP neural network are used to realize pattern recognition. The following conclusions are obtained:
(1)
By analyzing the energy distribution of different types of PD, it is found that the energy of the needle-plate discharge is mainly distributed in the D3 and D2 regions, with 19.9% and 72.6%; The energy D4, D3, and D2 of the suspension discharge are distributed at 12.2%, 18.3%, and 48.5%, with a gradient rising relationship; The energy of the slide-flash discharge is mainly distributed in the D2 and D1 regions, with 74.5% and 12.6%. These three types have good resolution.
(2)
Among different types of PD energy distributions obtained by multi-scale analysis, plate-to-plate air gap discharge and creeping discharge have similar characteristics in the D4, D3, and D2 regions. Both of them have parabolic shape with peak value, and their discrimination degree is low. It is necessary to cooperate with other recognition methods to fully realize the recognition of these five kinds of PD. Both are parabolic forms with peaks, the two have a low degree of discrimination with each other, and other recognition methods are needed to fully realize the recognition of these five PDs.
(3)
Using the classification and recognition capabilities of the BP neural network, the six characteristic parameters of the plate-to-plate air-gap discharge and the creeping discharge ultrasonic signal are distinguished, and the three characteristic quantities are screened to realize the distinction between the two types of discharges.
(4)
Using the method of combining multi-scale analysis and neural networks, by extracting the characteristic values of the characteristic signals, the five types of discharge can be accurately distinguished. By distinguishing the type of PD, we can use it to judge the defect condition of the cable terminal, and it can also be used to estimate life and danger.

Author Contributions

Conceptualization, Y.W.; Data curation, L.L.; Formal analysis, Y.W.; Funding acquisition, X.Z.; Investigation, J.G.; Methodology, N.G.; Software, Y.L.; Writing—original draft, Y.W.; Writing—review & editing, X.Z. All authors have read and agreed to the published version of the manuscript.

Funding

Project supported by the National Natural Science Foundation of China (Grant No. 51577045) and A Project of Shandong Province Higher Educational Science and Technology Program (Grant No. J17KB135).

Conflicts of Interest

The authors declare no conflict of interest.

References

  1. Kucheriava, I.M. Numerical Study of Electric field Distribution in High-Voltage Cable Termination with Stress Control Cone. Техн. Електрoдинаміка 2017, 1, 17–22. [Google Scholar] [CrossRef] [Green Version]
  2. Zhao, S.; Li, B.; Wang, Y. Pattern Recognition of Transformer Partial Dischage based on Acoustic Method. Proc. CSEE 2003, 23, 108–112. [Google Scholar]
  3. Sugimoto, S.; Nakade, M. Copper Compound Deposition for Decreasing Electrical Insulation in Aged Oil-filled Cables. IEEE Trans. Dielectr. Electr. Insul. 2018, 25, 1660–1667. [Google Scholar] [CrossRef]
  4. Zhang, R.; Qiu, Z.; Wu, J.; Li, X.; Wang, S. Study on Gaseous Products in the Aging Process of Silicone Oil in Cable Terminals. In Proceedings of the 2018 IEEE Conference on Electrical Insulation and Dielectric Phenomena, Cancun, Mexico, 21 October 2018; pp. 394–397. [Google Scholar]
  5. Mithun, M.; Kumbhar, G.B. Detection, Measurement, and Classification of PD in a Power Transformer: Methods, Trends, and Future Research. Iete Tech. Rev. 2017, 15, 1–11. [Google Scholar]
  6. Shady, S.R.; Shams, M.A. A Review of PD Detection, Diagnosis Techniques in High Voltage Power Cables. In Proceedings of the 2018 IEEE 12th International Conference on Compatibility, Power Electronics and Power Engineering (CPE-POWERENG 2018), Doha, Qatar, 7 June 2018; pp. 375–384. [Google Scholar]
  7. Rizzi, A.; Mascioli, F.M.F.; Baldini, F.; Mazzetti, C.; Bartnikas, R. Genetic optimization of a PD diagnostic system for cable accessories. IEEE Trans. Power Deliv. 2009, 24, 1728–1738. [Google Scholar] [CrossRef]
  8. Sharkawy, R.M.; Abdel-Galil, T.K. Particle identification in terms of acoustic PD measurements in transformers oils. IEEE Trans. Dielectr. Electr. Insul. 2008, 15, 1649–1657. [Google Scholar] [CrossRef]
  9. Kundu, P.; Kishore, N.K.; Sinha, A.K. Identification of two simultaneous PD sources in an oil-pressboard insulation system using acoustic emission techniques. Appl. Acoust. 2012, 73, 395–401. [Google Scholar] [CrossRef]
  10. Sebastian, B.; Jacek, Ł.; Dariusz, Z. Using Clustering Methods for the Identification of Acoustic Emission Signals Generated by the Selected Form of PD in Oil-Paper Insulation. Arch. Acoust. 2018, 43, 207–215. [Google Scholar]
  11. Mustafa, H.; Khaled, S.; Ayman, E.-H. Classification of Common PD Types in Oil-paper Insulation System Using Acoustic Signals. IEEE Trans. Dielectr. Electr. Insul. 2015, 22, 1674–1684. [Google Scholar]
  12. Mehrdad, M.; Mohammed, S.F.; Mehdi, E.-A. PD Pattern Recognition via Sparse Representation and ANN. IEEE Trans. Dielectr. Electr. Insul. 2015, 22, 1061–1071. [Google Scholar]
  13. Manuel, S.; Paolo, M. A structural property of the wavelet packet transform method to localise incoherency of a signal. J. Frankl. Inst. 2019, 356, 10123–10137. [Google Scholar]
  14. Manuel, S.; Paolo, M. An on-line orthogonal wavelet denoising algorithm for high-resolution surface scans. J. Frankl. Inst. 2018, 355, 9245–9270. [Google Scholar]
  15. Vargas, R.N.; Veiga, A.C.P. Seismic trace noise reduction by wavelets and double threshold estimation. IET Signal. Process. 2017, 11, 1069–1075. [Google Scholar] [CrossRef]
  16. Elaiyaraja, G.; Kumaratharan, N.; Rao, T.C.S. Fast and Efficient Filter Using Wavelet Threshold for Removal of Gaussian Noise from MRI/CT Scanned Medical Images/Color Video Sequence. Iete J. Res. 2019, 2019, 268–284. [Google Scholar] [CrossRef]
  17. Chung, J.; Powers, E.J.; Lamoree, J. Power disturbance classifier using a rule-based method and wavelet packet-based hidden Markov model. IEEE Trans. Power Deliv. 2002, 17, 233–241. [Google Scholar] [CrossRef]
  18. Magnago, F.H.; Abur, A. Application of wavelet to model short term power system disturbance. IEEE Trans. Power Syst. 1996, 11, 2031–2037. [Google Scholar]
  19. Quan, G.; Wenbo, W.; Qi, D. PD Pattern Recognition Based on Synchro Squeezing Wavelet Transform and Multi-Scale Characteristic Parameters. In Proceedings of the 2019 International Conference on Information Technology, Electrical and Electronic Engineering (ITEEE 2019), Sanya, China, 20 January 2019; pp. 473–477. [Google Scholar]
  20. Li, G.; Wang, X.; Li, X. PD Recognition with a Multi-Resolution Convolutional Neural Network. Sensors 2018, 18, 1–27. [Google Scholar]
  21. Jia, R.; Xie, Y.; Wu, H. Power Transformer PD Fault Diagnosis Based on Multidimensional Feature Region. Math. Probl. Eng. 2016, 3, 121–131. [Google Scholar]
  22. Walter, G.G.; Shen, X. Wavelets and Other Orthogonal Systems, 2nd ed.; CRC Press: Boca Raton, FL, USA, 2001; pp. 32–78. [Google Scholar]
  23. Boonpoke, S.; Marungsri, B. Pattern recognition of PD by using simplified fuzzy artmap. World Acad. Sci. Eng. Technol. 2010, 65, 212–219. [Google Scholar]
  24. Alexandridis, A.; Chondrodima, E.; Sarimveis, H. Radial basis function network training using a nonsymmetric partition of input space and particle swarm optimization. IEEE Trans. Neural Netw. Learn. Syst. 2013, 24, 219–230. [Google Scholar] [CrossRef]
  25. Tang, J.; Xie, Y. PD location based on time difference of energy accumulation curve of multiple signals. IET Electr. Power Appl. 2010, 5, 175–180. [Google Scholar] [CrossRef]
  26. Sherif, S.M.G.; Ibranhim, B.M.T.; Nagy, I.E. Integrated ANN-Based Proactive Fault Diagnostic Scheme for Power Transformers Using Dissolved Gas Analysis. IEEE Trans. Dielectr. Electr. Insul. 2016, 23, 1838–1845. [Google Scholar]
  27. Zhou, S.; Jing, L. Pattern recognition of PD based on moment features and probabilistic neural network. Power Syst. Prot. Control. 2016, 3, 98–102. [Google Scholar]
  28. Paolo, M. Denoising and harmonic detection using nonorthogonal wavelet packets in industrial applications. J. Syst. Sci. Complex. 2007, 20, 325–343. [Google Scholar]
  29. Mercorelli, P. Biorthogonal wavelet trees in the classification of embedded signal classes for intelligent sensors using machine learning applications. J. Frankl. Inst. 2007, 344, 813–829. [Google Scholar] [CrossRef]
  30. Michael Weeks. Digital Signal Processing using MATLAB and Wavelets; Pallai, D.F., Ed.; Infinity Science Press LLC: Sudbury, MA, USA, 2007; pp. 275–336. [Google Scholar]
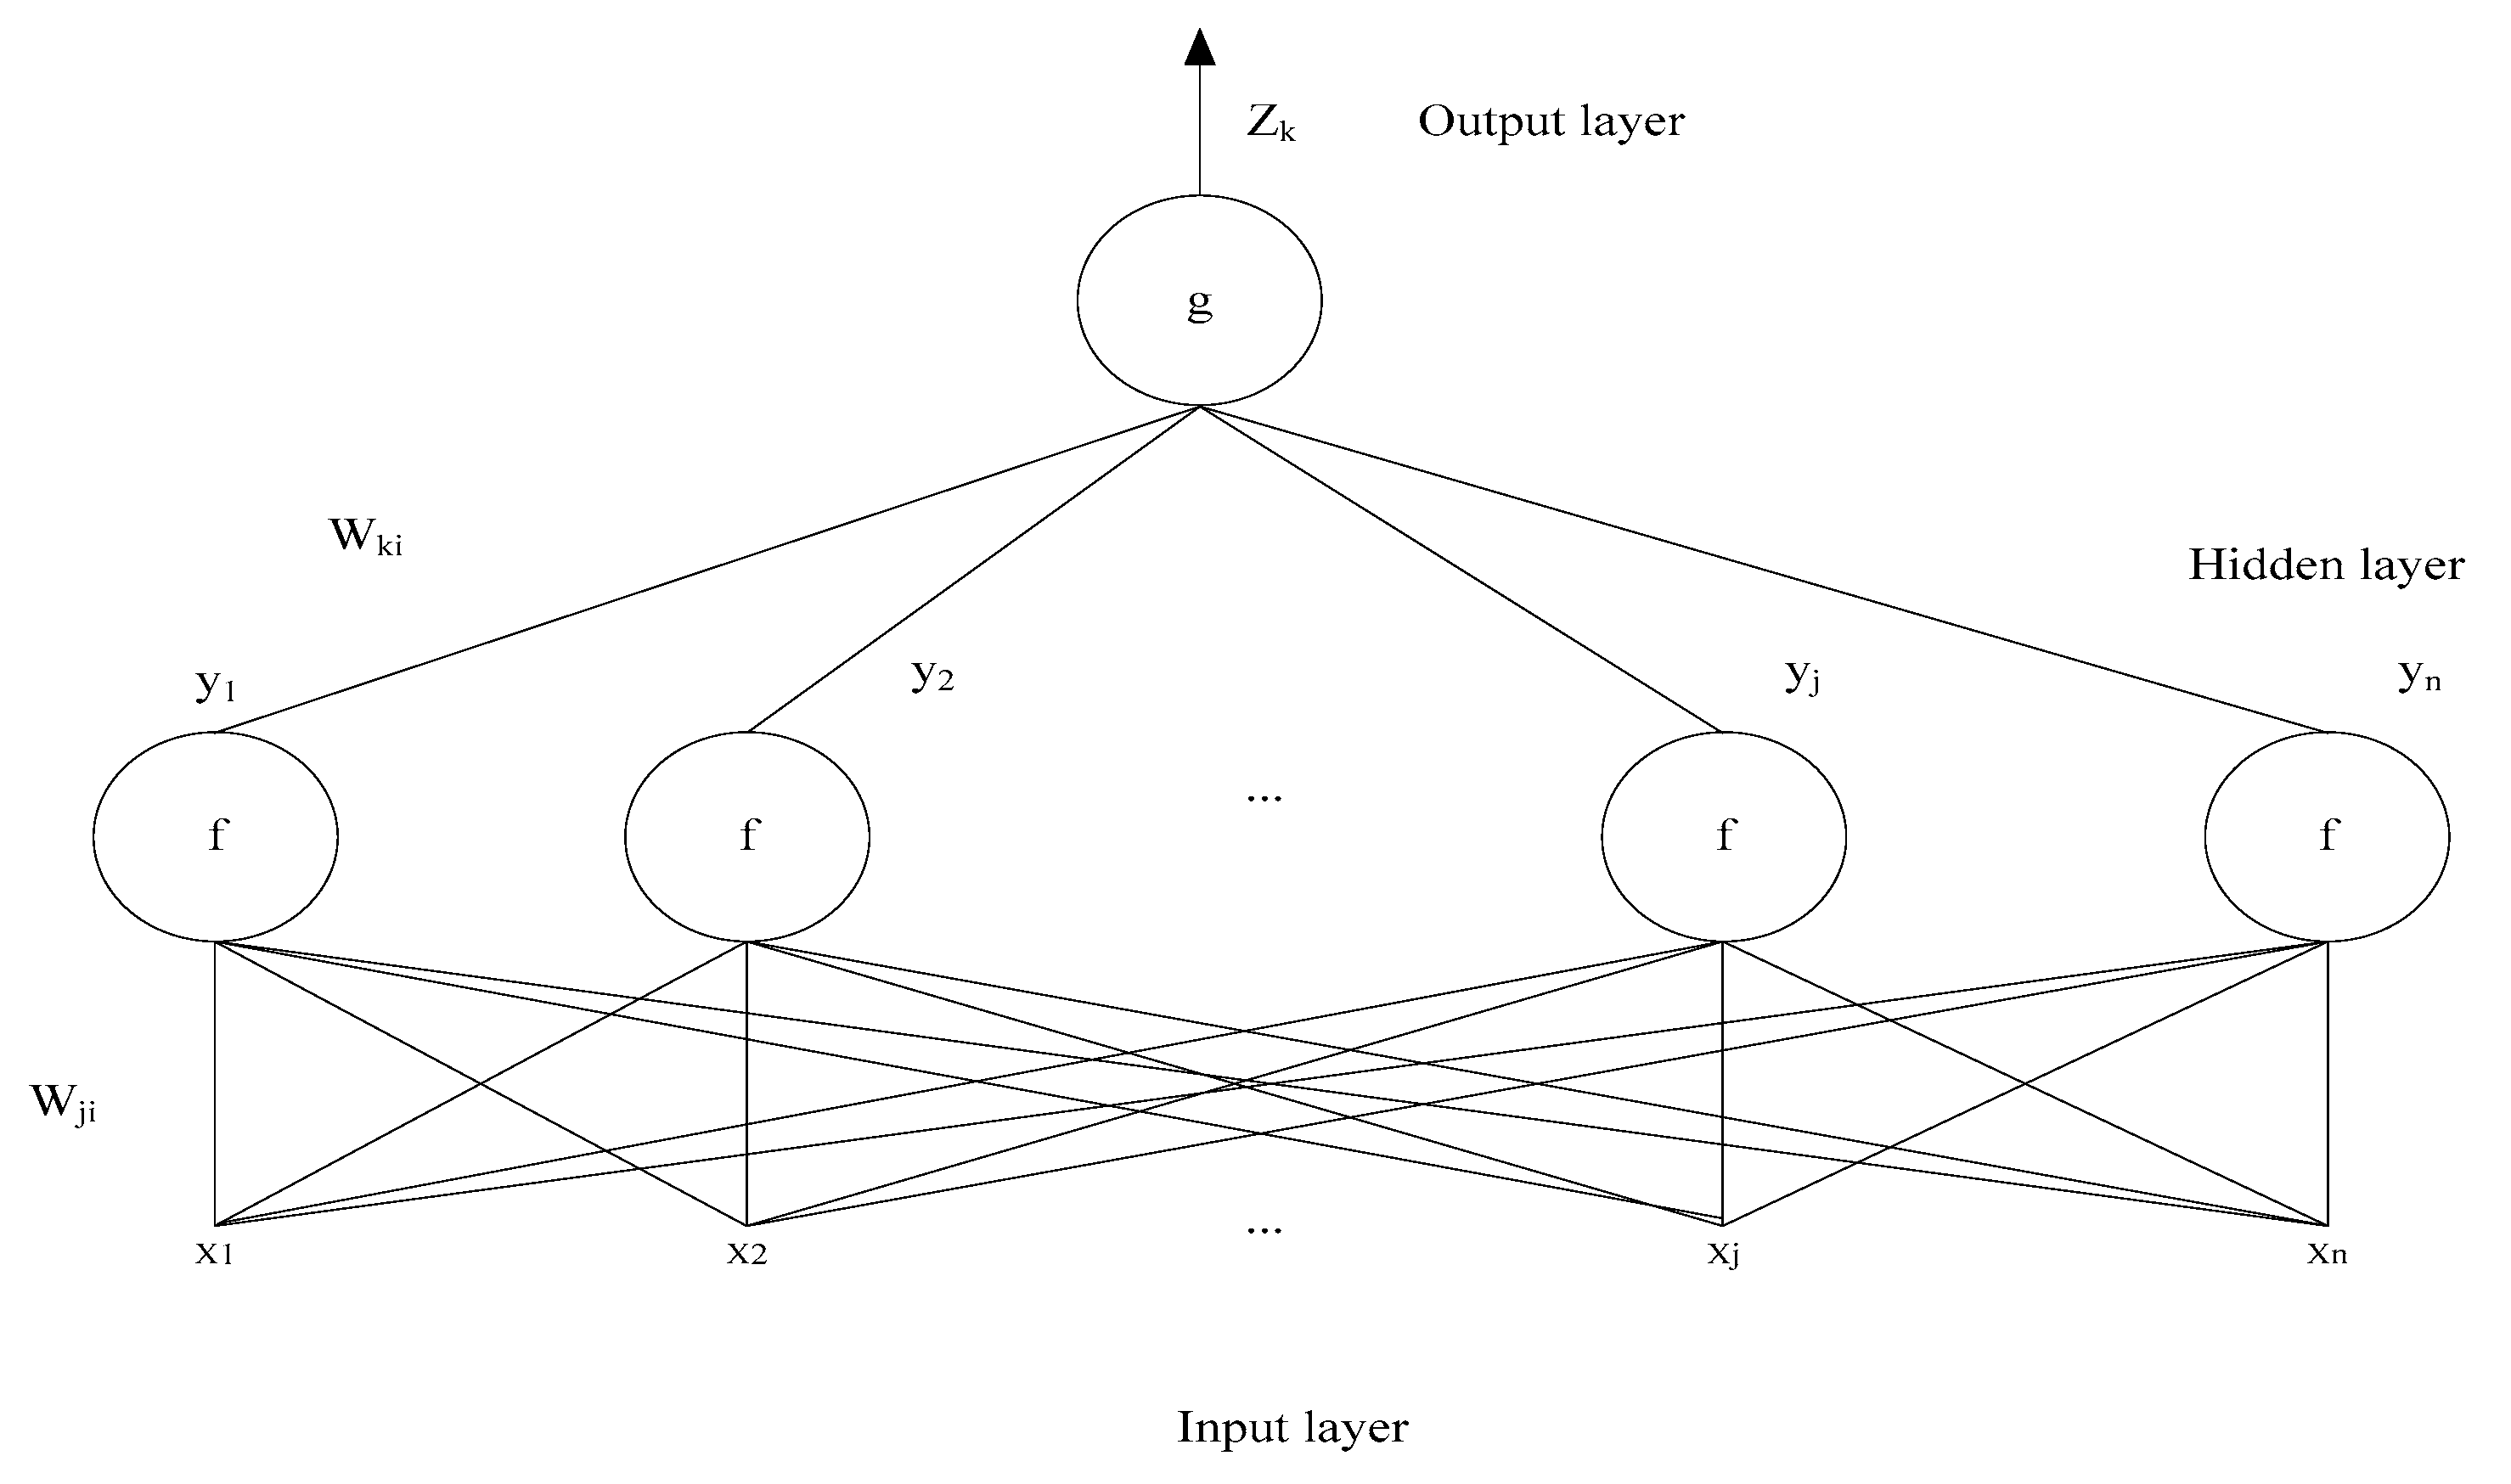
Figure 1. Schematic diagram of the BP neural network.
Energies 13 00366 g001
Figure 2. The five types of discharge models: (a) Needle-plate discharge, (b) Sliding-flash discharge, (c) Suspended discharge, (d) Creeping discharge, (e) Plate-to-plate air gap discharge. 1. High-voltage leads; 2. polyethylene test board; 3. PTF bracket; 4. copper electrode; 5. cable oil.
Energies 13 00366 g002
Figure 3. Test system schematic. T1—isolation transformer; T2—voltage regulator; C1, L1—low-pressure, low-pass PI filter; T3—high-voltage experimental transformer; C2, L2—high-voltage low-pass filter; CK—coupling capacitor; Zin—detection impedance; T—tank; S—piezoelectric sensor; AMP—preamplifier; and DAQ—data acquisition card.
Energies 13 00366 g003
Figure 4. Cable terminal PD fault simulation system and operating platform.
Energies 13 00366 g004
Figure 5. Signal before filtering.
Energies 13 00366 g005
Figure 6. Signal after wavelet filtering.
Energies 13 00366 g006
Figure 7. Time-domain wavelet decomposition and energy spectrum of needle-plate PD ultrasound signal: (a) Time domain signal; (b) Wavelet decomposition; (c) Energy spectrum distribution.
Energies 13 00366 g007aEnergies 13 00366 g007b
Figure 8. Time-domain wavelet decomposition and energy spectrum of a plate-to-plate air gap PD ultrasound signal: (a) Time domain signal; (b) Wavelet decomposition; (c) Energy spectrum distribution.
Energies 13 00366 g008aEnergies 13 00366 g008b
Figure 9. Time-domain wavelet decomposition and energy spectrum of suspension PD ultrasound signal: (a) Time domain signal; (b) Wavelet decomposition; (c) Energy spectrum distribution.
Energies 13 00366 g009aEnergies 13 00366 g009b
Figure 10. Time-domain wavelet decomposition and energy spectra of slide-flash PD ultrasound signal: (a) Time domain signal; (b) Wavelet decomposition; (c) Energy spectrum distribution.
Energies 13 00366 g010aEnergies 13 00366 g010b
Figure 11. Time-domain wavelet decomposition and energy spectrum of creeping PD ultrasonic signal: (a) Time domain signal; (b) Wavelet decomposition; (c) Energy spectrum distribution.
Energies 13 00366 g011aEnergies 13 00366 g011b
Figure 12. Energy distribution diagrams of five different types of PD. (a). needle-plate discharge; (b). Suspension discharge; (c). creeping discharge; (d). plate-to-plate air gap discharge; (e). slide-flash discharge.
Energies 13 00366 g012
Figure 13. Six parameter distribution diagrams of creeping discharge and plate-to-plate air gap discharge: (a) a parameter distribution; (b) b parameter distribution; (c) c parameter distribution; (d) d parameter distribution; (e) e parameter distribution; (f) f parameter distribution.
Energies 13 00366 g013aEnergies 13 00366 g013b
Figure 14. Training result of neural network.
Energies 13 00366 g014
Figure 15. Classification result of unknown data of neural network.
Energies 13 00366 g015
Table 1. Frequency domain of each decomposition level.
Decomposition LevelsFrequency Band (kHz)
A50–15.75
D515.75–31.25
D431.25–62.5
D362.5–125
D2125–250
D1250–500