Article

Direct and Indirect Environmental Aspects of an Electric Bus Fleet Under Service

Automotive Engineering and Transports Department, Technical University of Cluj-Napoca, Bdul.Muncii 103-105, Cluj-Napoca, Romania
*
Author to whom correspondence should be addressed.
Energies 2020, 13(2), 336; https://doi.org/10.3390/en13020336
Submission received: 28 October 2019 / Revised: 29 December 2019 / Accepted: 3 January 2020 / Published: 10 January 2020
(This article belongs to the Special Issue Intelligent Transportation Systems for Electric Vehicles)

Abstract

:
The reduction of pollutant emissions in the field of transportation can be achieved by developing and implementing electric propulsion technologies across a wider range of transportation types. This solution is seen as the only one that can offer, in areas of urban agglomeration, a reduction of the emissions caused by the urban transport to zero, as well as an increase in the degree of the health of the citizens. This paper presents an analysis of the direct and indirect environmental aspects of a fleet of real electric buses under service in the city of Cluj-Napoca, Romania. The solution of using 41 electric buses to replace Euro-3 diesel buses (with high pollution levels) in the city’s transport system eliminates a local amount of 668.45 tons of CO2 and 6.41 tons of NOx—pollutant emissions directly associated with harmful effects on human health—annually.

1. Introduction

Contemporary trends of population migration to urban centers and the “metropolization” of urban cities (especially those that are local and regional centers) have been continuously increasing, which has been confirmed by a global increase in population migration. With such an increase in the number of inhabitants in these urban agglomerations, problems related to the public transport of passengers (as an integrated part of the functionality and sustainability of a city) have arisen, which must be solved through the prism of several factors, such as efficiency, versatility, punctuality, modularity, and comfort.
The fact that, in general, the road transport sector is one of the largest net contributors to the generation of NOx pollutants (about 13% of total pollutant emissions) and 27% of total greenhouse gas (GHG) emissions in the atmosphere at the European level presently cannot be ignored [1]. For this reason, the European Union has adopted (and will adopt) numerous laws and regulations related to the substantial reduction of pollutant emissions caused by transport using internal combustion engines as an energy source.
At the present time, most urban public transportation systems use buses equipped with internal combustion engines, which use fossil fuels as an energy source. Even in the short term, the use of renewable sources (biofuels) has been accepted worldwide as an immediate solution to completely or partially replace fossil fuels (as they can contribute to reducing global GHG emissions); however, there are many limitations to their use, regarding the protection of the environment.
Pollutant emissions and greenhouse gas emissions caused by functioning of internal combustion engines, such as CO2, NOx, and PM (particulates), have been shown to lead to serious problems, with negative impacts on the environment and human health [2,3,4,5].
Thus, the electrification of urban passenger transport systems (in the form of electric vehicles) is currently seen (and has been implemented, in places) as a relevant/potential solution for a massive/total reduction of local pollution and greenhouse gas emissions.
Especially in Europe, urban centers are often characterized by unique architectural structures, with development occurring around an old town center populated with historic and public buildings. These buildings are permanently exposed to the corrosive effects of emissions and vibration caused by road traffic and, accordingly, several limitations have been imposed on vehicular access in such areas. Primary initiatives in this regard have been made in big cities, such as Vienna, Winchester, Madrid, Berlin, and Cluj-Napoca [6,7,8,9]. As a conclusion, studies have generally shown that small and medium cities could successfully adopt sustainable urban transport technologies based on the use of electric transport vehicles [10,11].
It is worth mentioning that emissions reduction is done locally, using electric vehicles—the so called zero emission vehicle (ZEV) concept—and, in the global mode, the intensity of the emissions depends directly on the energy mix used in the production of electricity [12].
The recent massive addition of the electric powertrain in vehicles has been mainly implemented in the construction of cars used as a means of personal travel and in the construction of buses for passenger transport. Conceptually, the construction of an electric powertrain does not differ between a car and an electric bus; the general structures are shown in the Figure 1.
Electric buses have different constructive solutions for the powertrains, these differences relating to the power source for the electric engine. Generally speaking, most common construction solutions for contemporary electric buses are: battery electric, hybrid series, and hybrid parallel; their basic structures (configurations) are shown in Figure 1.
The hybrid technology (both series and parallel types) uses both an internal combustion (IC) engine and an electric motor to produce the required traction power. In the serial configuration of a hybrid propulsion unit, the IC engine is used only to generate the electricity (through a generator) required by the electric traction motor(s) or to be stored in the bus batteries. In the parallel configuration of a hybrid propulsion unit, both the internal combustion engine and the electric motor provide the traction force necessary to move the bus. The traction force can be supplied by both engines (IC engine and/or electric motor) through a torque converter, as well as by independent driving of the traction wheels. In general, the storage capacity of the batteries is much higher in the case of electric buses (being the only energy source available), compared to the buses with hybrid propulsion, where the electric motor operation is performed only in well-defined situations (i.e., starting, slope climbing, increasing the acceleration in the case of overtaking, and so on), the rest of the operations using the IC engine. The hybrid type construction of powertrain greatly helps to significantly reduce the pollutant emissions caused by transport equipped with only an IC engine (using petrol, diesel, gas, or renewable fuels); but does not totally eliminate emissions, as battery electric buses do.
The main barrier that must be overcome for the massive penetration of electric means of transport is that related to the autonomy or range (distance in km) that the vehicles have, compared to the autonomy of those vehicles powered by internal combustion engines. At the beginning of the development of electric vehicles (EVs), the autonomy was relatively low (40–60 km) and the electric vehicles were intended only for urban use and for small trips within the urban surroundings; however, at present, the autonomy achieved by certain electric vehicles has approached the threshold of traveling 400 km with only a single battery charge [13,14].
This has been made possible due to the exponential development of technologies related to increasing the storage capacity of electricity in batteries (as well as the energy source of the electric vehicle), Li-Ion technology being one of the most versatile and efficient technologies from this point of view.
Li-Ion technology is not a new technology just emerging into the market; research into the energy performance of Li-Ion batteries has been carried out since the 1970s, with their primary application being in the field of mobile electronic equipment. However, their application in the electrification of vehicles has been delayed, due to their high manufacturing costs and the safety restrictions, which had to be overcome by manufacturers [15,16]. Due to the high cost of these batteries, the purchase price of EVs is expected to remain higher than that of gasoline or diesel vehicles; this condition will be a key determinant of further massive penetration in the automotive market (despite EV’s savings in fuel and maintenance costs) [17,18,19,20]. Once these barriers (along with many others [21]) in the market have been overcome, an increasing number of electric vehicles will be available in the automotive market, both for personal use and as a means of transport for passengers in urban agglomerations.
Studies on the possibilities of implementing electric buses in urban transport systems have been carried out by numerous researchers. Most of them analyzed computer simulation methods for different operating scenarios and proposed various algorithms for calculating and estimating the energy efficiency of electric buses. Stempien and Chan [22] presented a comparative study of different bus powertrain designs by a comparison that included such factors as powertrain technologies (i.e., fuel cell, fuel cell electric, battery electric, hybrid electric, IC diesel, and compressed natural gas buses), capital and operating costs, fuel consumption, and fuel cycle emissions. In their study, they used the data presented by Erkkilae et al. [23], which considered bus energetic consumption values (used also further to calculate the amount of indirect emissions) of 0.66–1.23 kWh/km for a lower load and 0.7–1.45 kWh/km for a higher load. By compiling the existent data in the literature, the authors affirmed, as a major conclusion, that the battery electric bus technology is one of the most competitive options for advanced public transport systems in constrained urban areas in the future. Lajunen A. [24] presented an analysis regarding the energy consumption and cost-benefits of hybrid and electric city buses. The analysis was made by simulation (using the ADVISOR vehicle simulation program) to define the energy efficiency of buses. The author did not use real data from exploitation as data sources for models, stating that “…there are no available, comparable results of the energy consumption in the literature for the plug-in hybrid and electric city buses because their commercialization is in early stages”. Moreover, an important remark (conclusion) of the author was that the exploitation condition (operation schedule and route planning) of a hybrid or electric bus is a condition that must be considered before introduction in an urban transport system for efficient energy use. A recent study of Vepsalainen et al. [25] studied the energy efficiency of an electric bus using a computationally efficient model for energy demand prediction. This study represented a novel approach to predict energy consumption variation with a wide range of uncertain factors (i.e., temperature, battery technical and functioning parameters, rolling resistance, and payload) and the simulation results gave values of 0.43–2.30 kWh/km (1.20 kWh/km average value with standard deviation of 0.32 kWh/km) net energy consumption. No data about real routes were applied as computational data in this study, however.
Data from the real exploitation of three types of electric buses in certain traffic conditions over a particular route in Macao (8.8 km long) was presented by Zhou et al. [26]. The net energetic consumption measured was 1.38–1.75 kWh/km for a 12 m e-bus type and 0.79 kWh/km for an 8 m e-bus type, resulting a reduction in CO2 emissions, from a life-cycle perspective, of 19%–35% (compared with a diesel bus). Based on the same exploitation condition previously presented, Song et al. [27] continued the study, regarding the benefits of the introduction of electric buses into Macao’s urban transportation system by calculating the reduction of GHG emissions. The results were situated between 56.47–133.76 kgCO2eq/100 km (average value of 127.99 kgCO2eq/100 km), taking into consideration the particularities of the energy mix for electricity production.
The aim of this paper is to quantify the direct and indirect CO2 and NOx pollutant emissions due to real urban exploitation of an electric bus fleet under service, in the particular case of Cluj-Napoca city. Real technical data related to the energy efficiencies of the electric buses, which have been integrated into the urban transport system of Cluj-Napoca, are presented and analyzed (from direct and indirect pollutant emissions emission point of view), in order to show that there are major differences between data obtained by computer simulation and the real ones (taking into account the particular operating conditions).

2. Materials and Methods

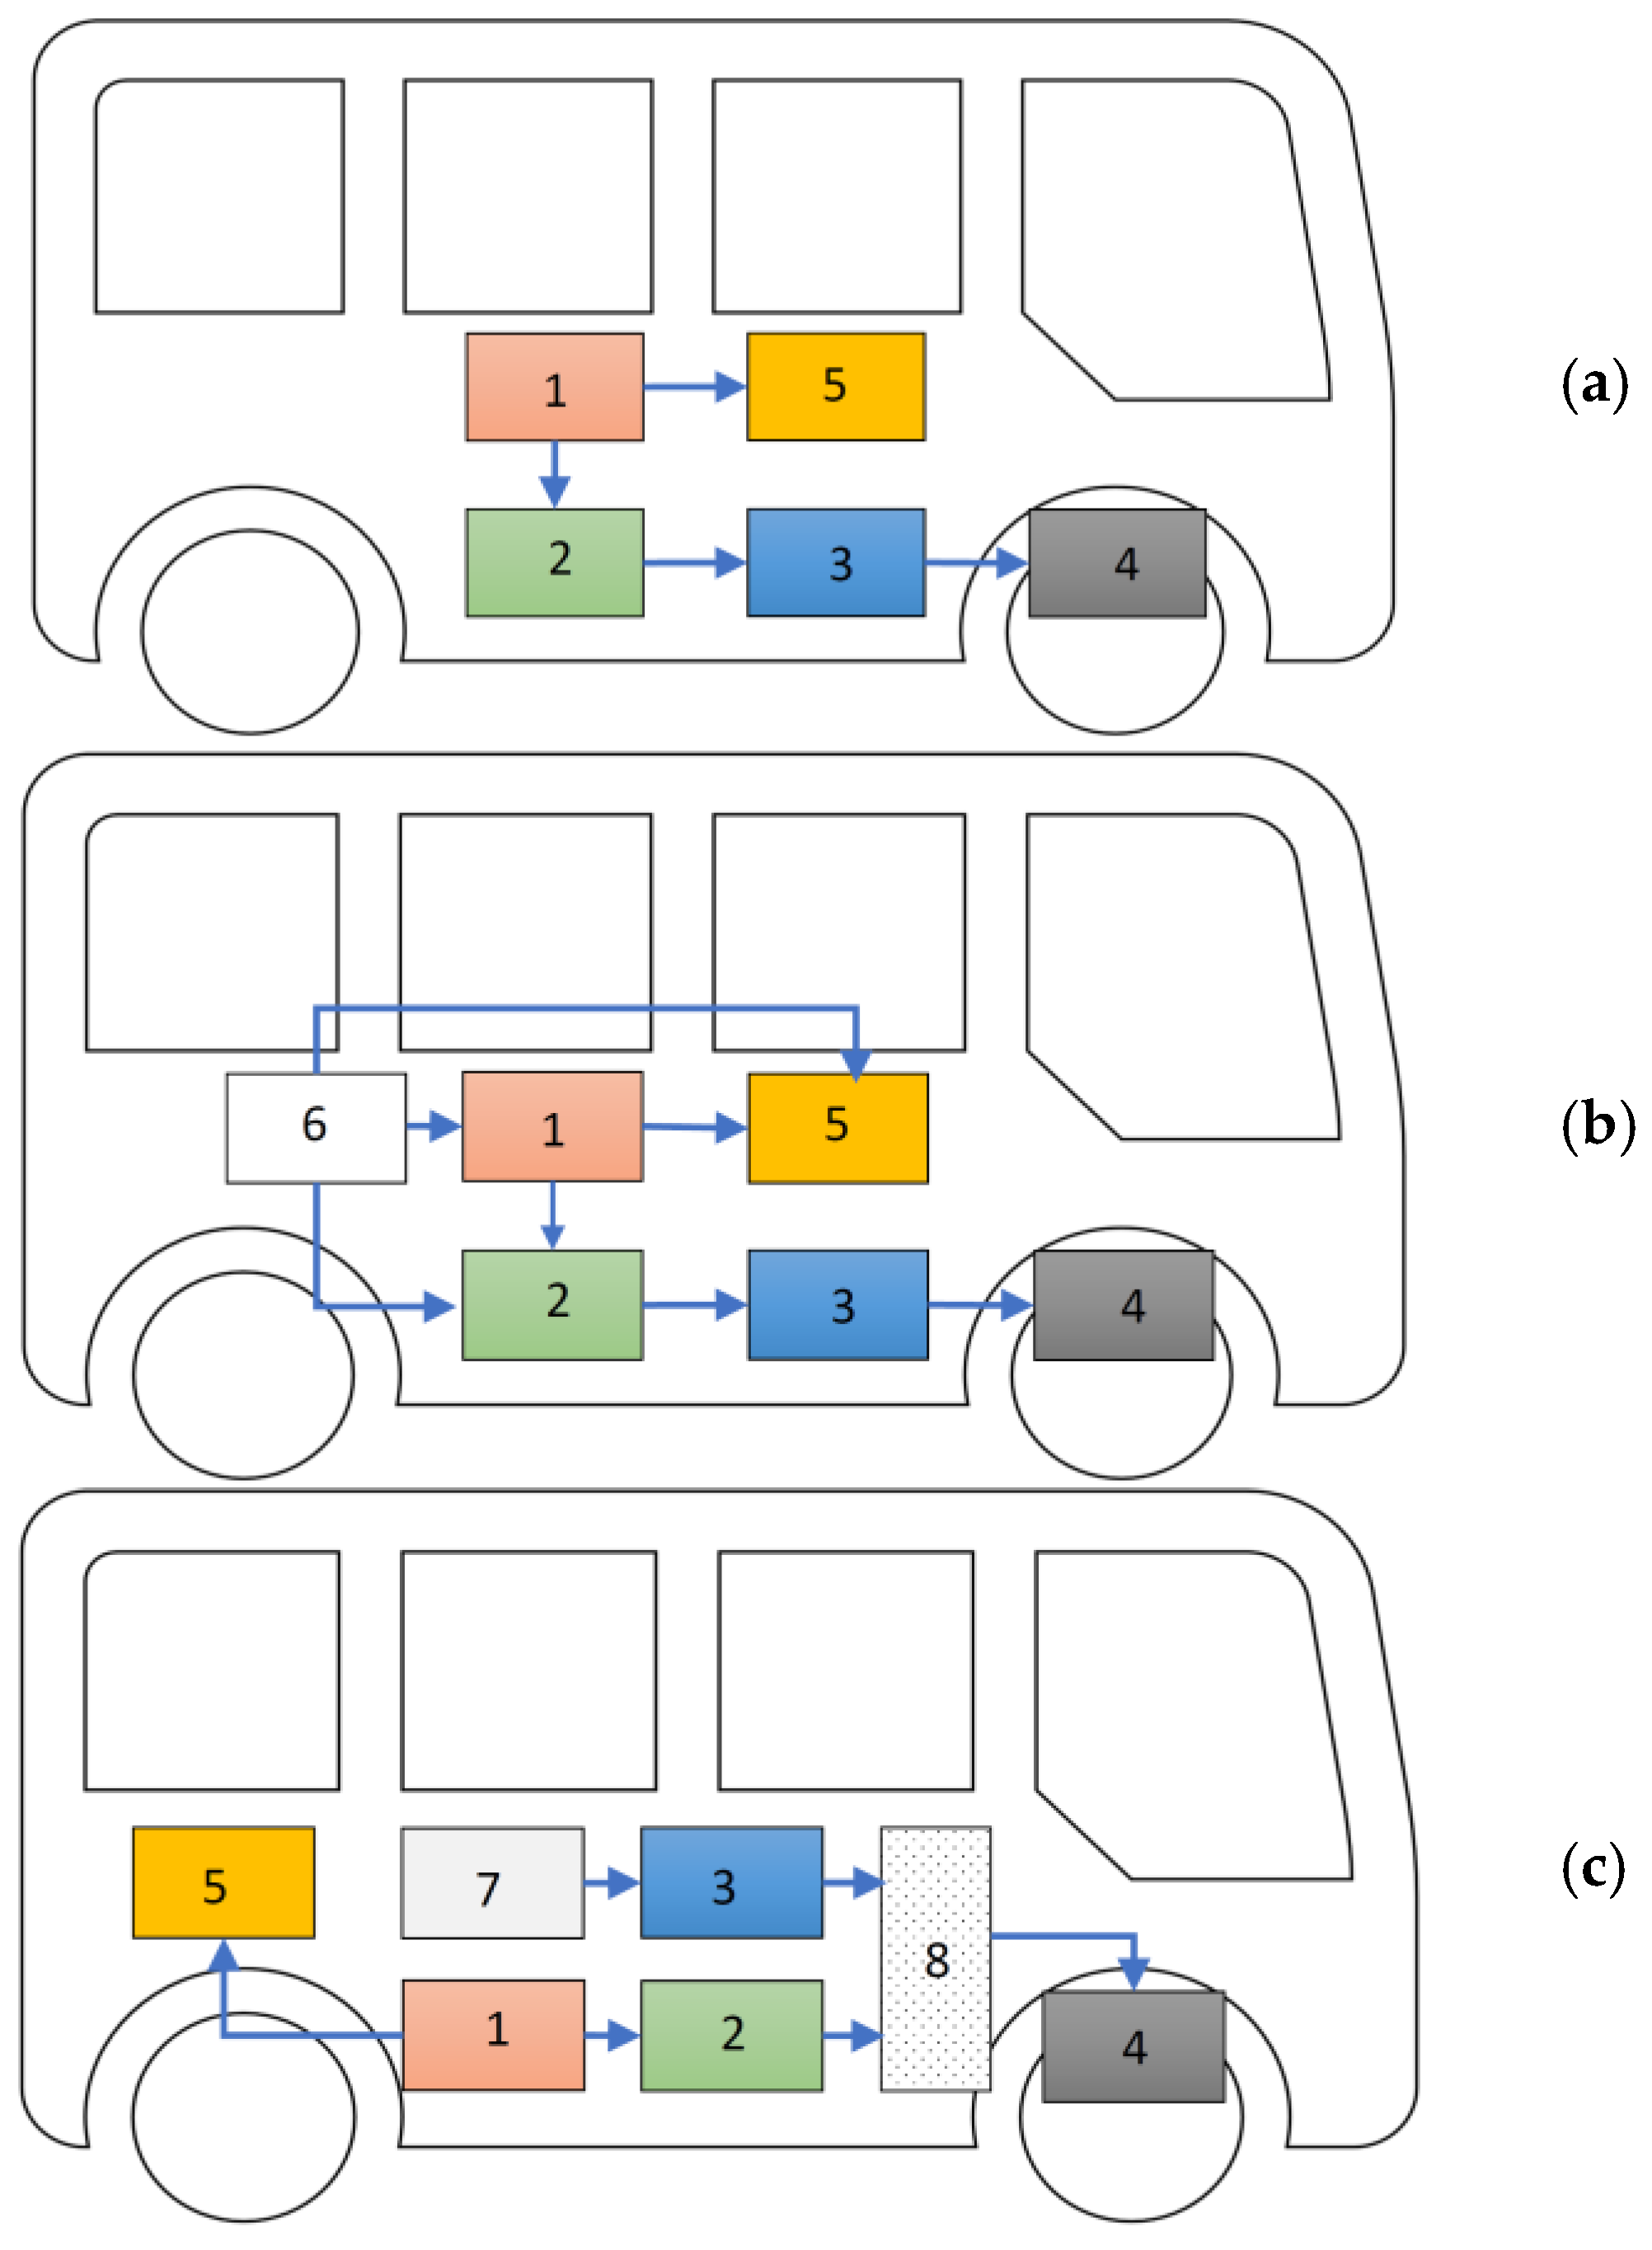
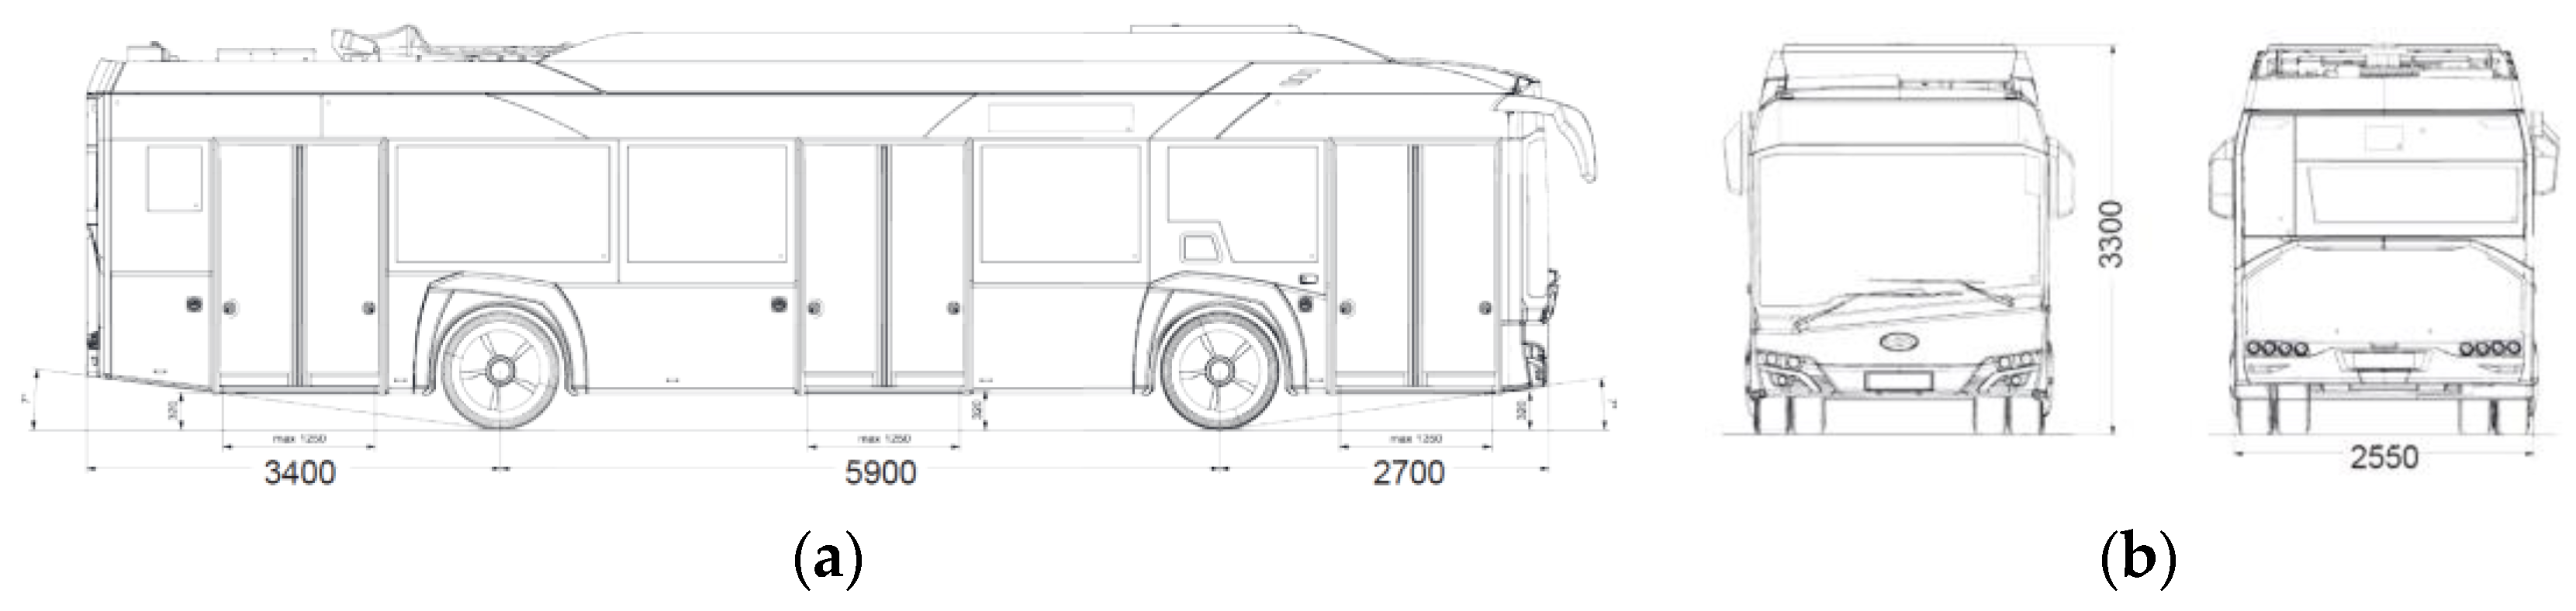
2.1. Cluj-Napoca City’s Urban Passenger Transportation System

The city of Cluj-Napoca is a large urban agglomeration located in Transylvania, in the northwestern area of Romania, with a stable population of approx. 400,000 inhabitants. Besides the stable population, the city is an important university (academic) center and, so there is also a permanent fluctuation of approx. 100,000 students that study and live in the city. Thus, the city of Cluj-Napoca can be seen as a large urban agglomeration with an architectural mix between the old central area (medieval) and the peripheral neighborhoods (contemporary), featuring all of the typical problems related to the optimal operation of a public passenger transport system. From the point of view of the main characteristics of the urban transport system, the total length of the routes served for the urban public transport of passengers in the city of Cluj-Napoca is 355.3 km, of which buses are used on 279.4 km (47 lines), trolleybuses are used on 51.95 km (seven lines), and trams are used on 23.95 km (four lines). In addition to these, there are also routes in the metropolitan area, which total 278.45 km.
The totality of the urban means of transport for passengers of Cluj-Napoca city consists of 297 buses (of which 41 are electric buses and 256 are diesel buses Euro 4–Euro 6), 81 trolleybuses, 27 trams, and nine diesel minibuses. The 41 electric buses represent 13.8% of the total buses and 9.90% of the total means of the urban transport fleet. Furthermore, 149 (36% of the total) vehicles out of the total means of transport use electric powertrains. From the point of view of the number of passengers transported, 78.6% are transported by buses, 14.6% by trolleybuses, and 6.8% by trams.
The need to reduce local pollutant emissions has become a stringent contemporary demand and, from this point of view, the administration of the City of Cluj-Napoca has decided to purchase and put under service a fleet of 41 electric buses. The model that won the international tender was the Solaris 12E, a bus model that meets all the standards and requirements of a passenger transport in terms of energy efficiency, security, and comfort.
In the construction of the Solaris 12E electric buses (Figure 2, Table 1), which are used for urban passenger transport, two types of Li-Ion type battery are used. A total of 11 buses use LiFePO4-type batteries and the other 30 are equipped with NMC (LiNiMnCoO2)-type batteries (arranged in five separate packs). The predicted range is approx. 140 km for a single (full) battery charge, a charging process that can be performed in both slow and fast modes.

2.2. Research Methodology

As presented above, the aim of this paper was to quantify the direct and indirect CO2 and NOx emissions due to urban exploitation of an electric bus fleet, in the particular case of Cluj-Napoca city.
There were two directions we might take to estimate the environmental effects of exploitation of the electric bus fleet: calculation of the direct reduction of pollutant emissions as a result of replacing IC Euro-3 norm buses (diesel) with electric buses, and calculation of the indirect reduction of pollutant emission by considering the energy mix for production of electrical energy.
The intensity of CO2 and NOx emissions for a Euro 3 bus were derived as the average value from different specialized studies on urban bus emissions [28,29,30,31,32]; from which, we arrived at the values of 1259 gCO2/km and 12.08 gNOx/km.
Also, a scenario was considered in which the 41 Euro 3 buses would have been replaced with new Euro 6 buses. In this case, for the Euro 6 buses the emissions values were considered to be 1133 g/km for CO2 and 1.11 g/km for NOx (based on reference [33]). It can be observed that the difference of the CO2 emissions is approx. 10% lower for Euro 6 buses, but the use of selective catalytic reduction (SCR) systems using aqueous urea solutions for Euro 6 bus’s exhaust emissions control, results in a reduction of NOx emissions by more than 10 times.
The fleet of electric buses is permanently monitored by the management center for urban transportation of Cluj-Napoca city, which is achieved by direct internet connection between each electric bus and the management center. The technical parameters for the operation of the electric buses (e.g., energy consumed—related to battery-out current and voltage, energy recovered—related to brake regeneration, battery state of charge, temperature inside the bus, speed, operation of auxiliary systems, temperature of electric motor, operating errors, and so on) and specific data taking into account the routes on which the buses are under service (e.g., route served, GPS position, number of passengers ascended, number of passengers descended, and so on) are provided in real time. Thus, these data have been stored and can be accessed for the continuous monitoring of the electric bus fleet from the energetic and economic efficiency points of view. According to the main data of the electric bus fleet over one year, a total distance of 530,944 km had been traveled, an average load of 3089 passengers per month per bus (1,519,788 passengers per year for the 41-bus fleet), and with an average energy consumption of 0.96 kWh/km and 0.38 kWh/km energy recovered/generated (i.e., net energy consumption was 0.58 kWh/km). The energy recovered/generated by electric buses was obtained due to the regenerative braking process (converting the kinetic energy of the bus into electric energy, which is stored in its batteries). This process improves the overall efficiency of a bus by increasing its operational range (autonomy).
It should be mentioned that there were no dedicated (preferred) exploitation routes for each electric bus, since they served passenger transport routes depending only on the management and transport needs at that time. For the fluidization of traffic in the city of Cluj-Napoca, there are traffic lanes dedicated to buses and trolleybuses, in which their average speed is approx. 15 km/h (compared to the average city traffic speed of 13.7 km/h) with a peak speed of 50 km/h, which means that the energy recovered by the electric buses by the regenerative braking process had high values. Aspects related to the exploitation and operational data of the electric bus fleet under service are presented in Figure 3, Figure 4, Figure 5, Figure 6 and Figure 7.

3. Results and Discussions

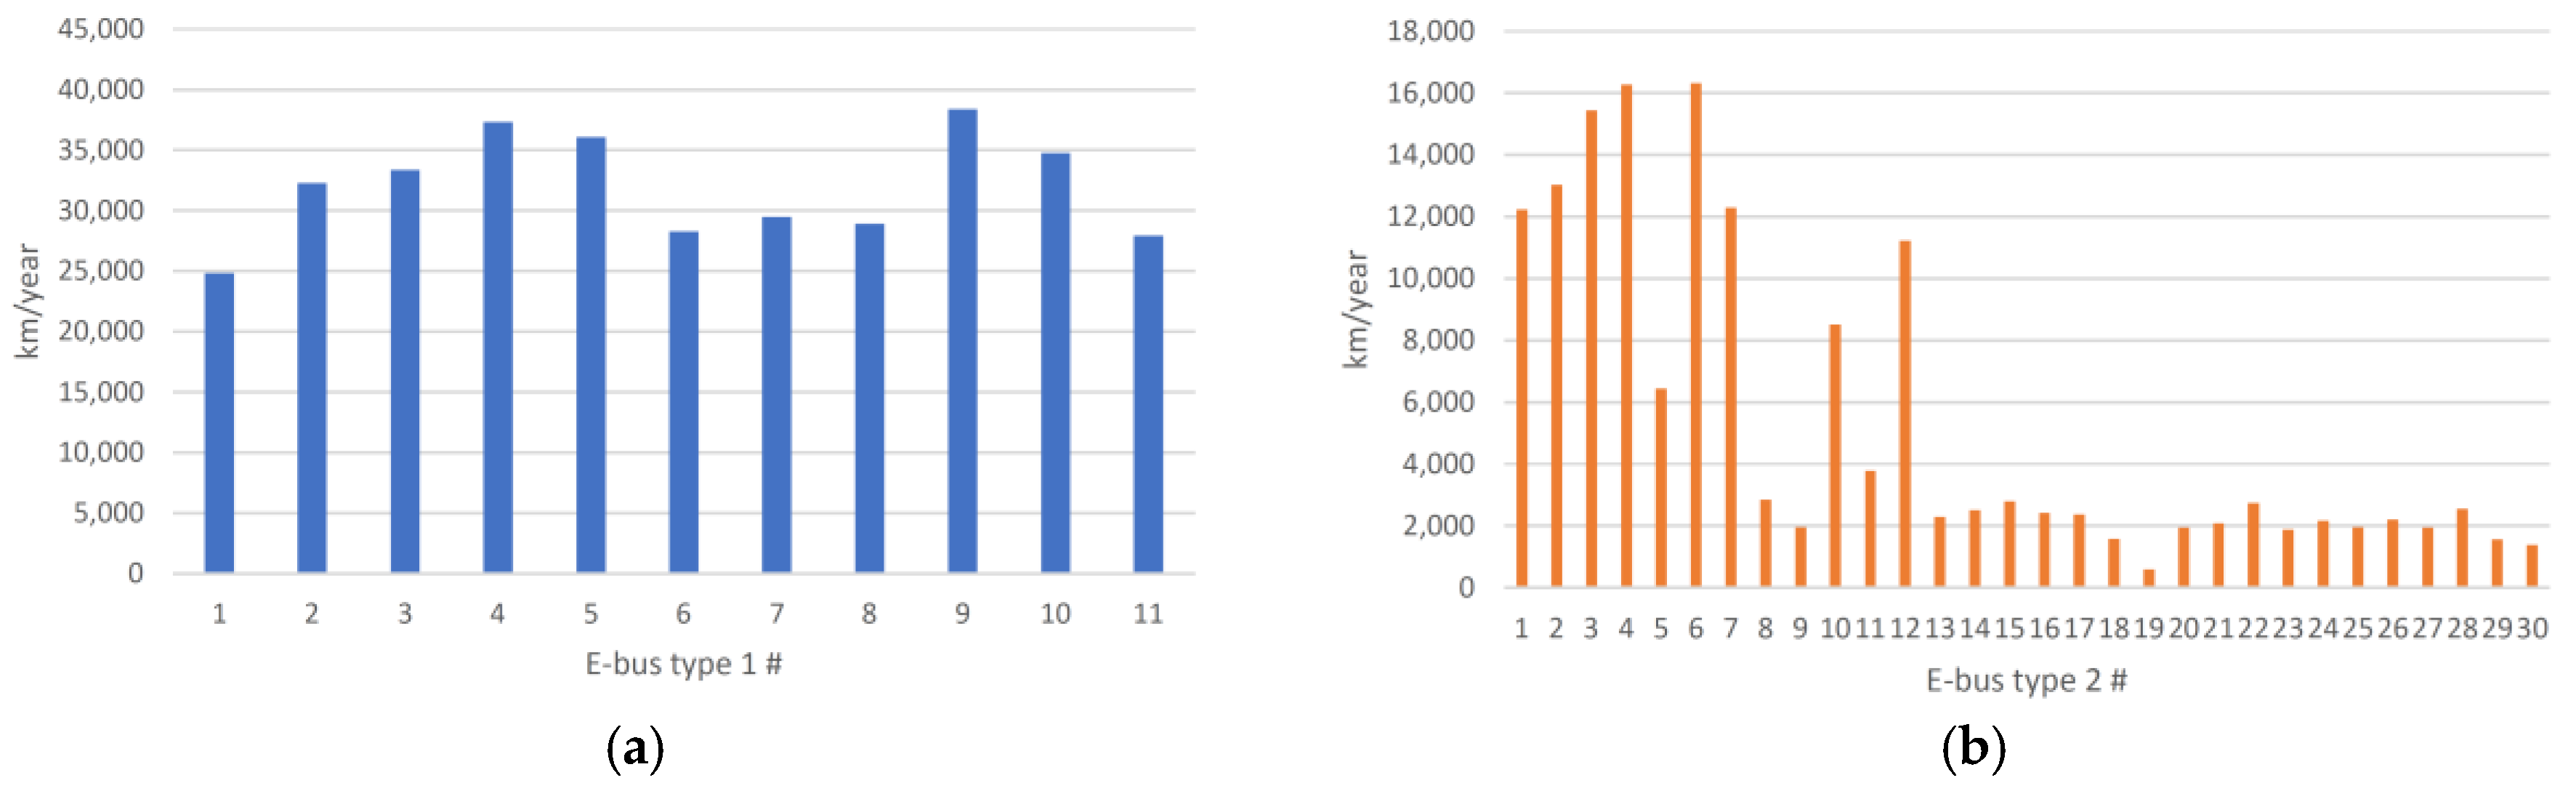
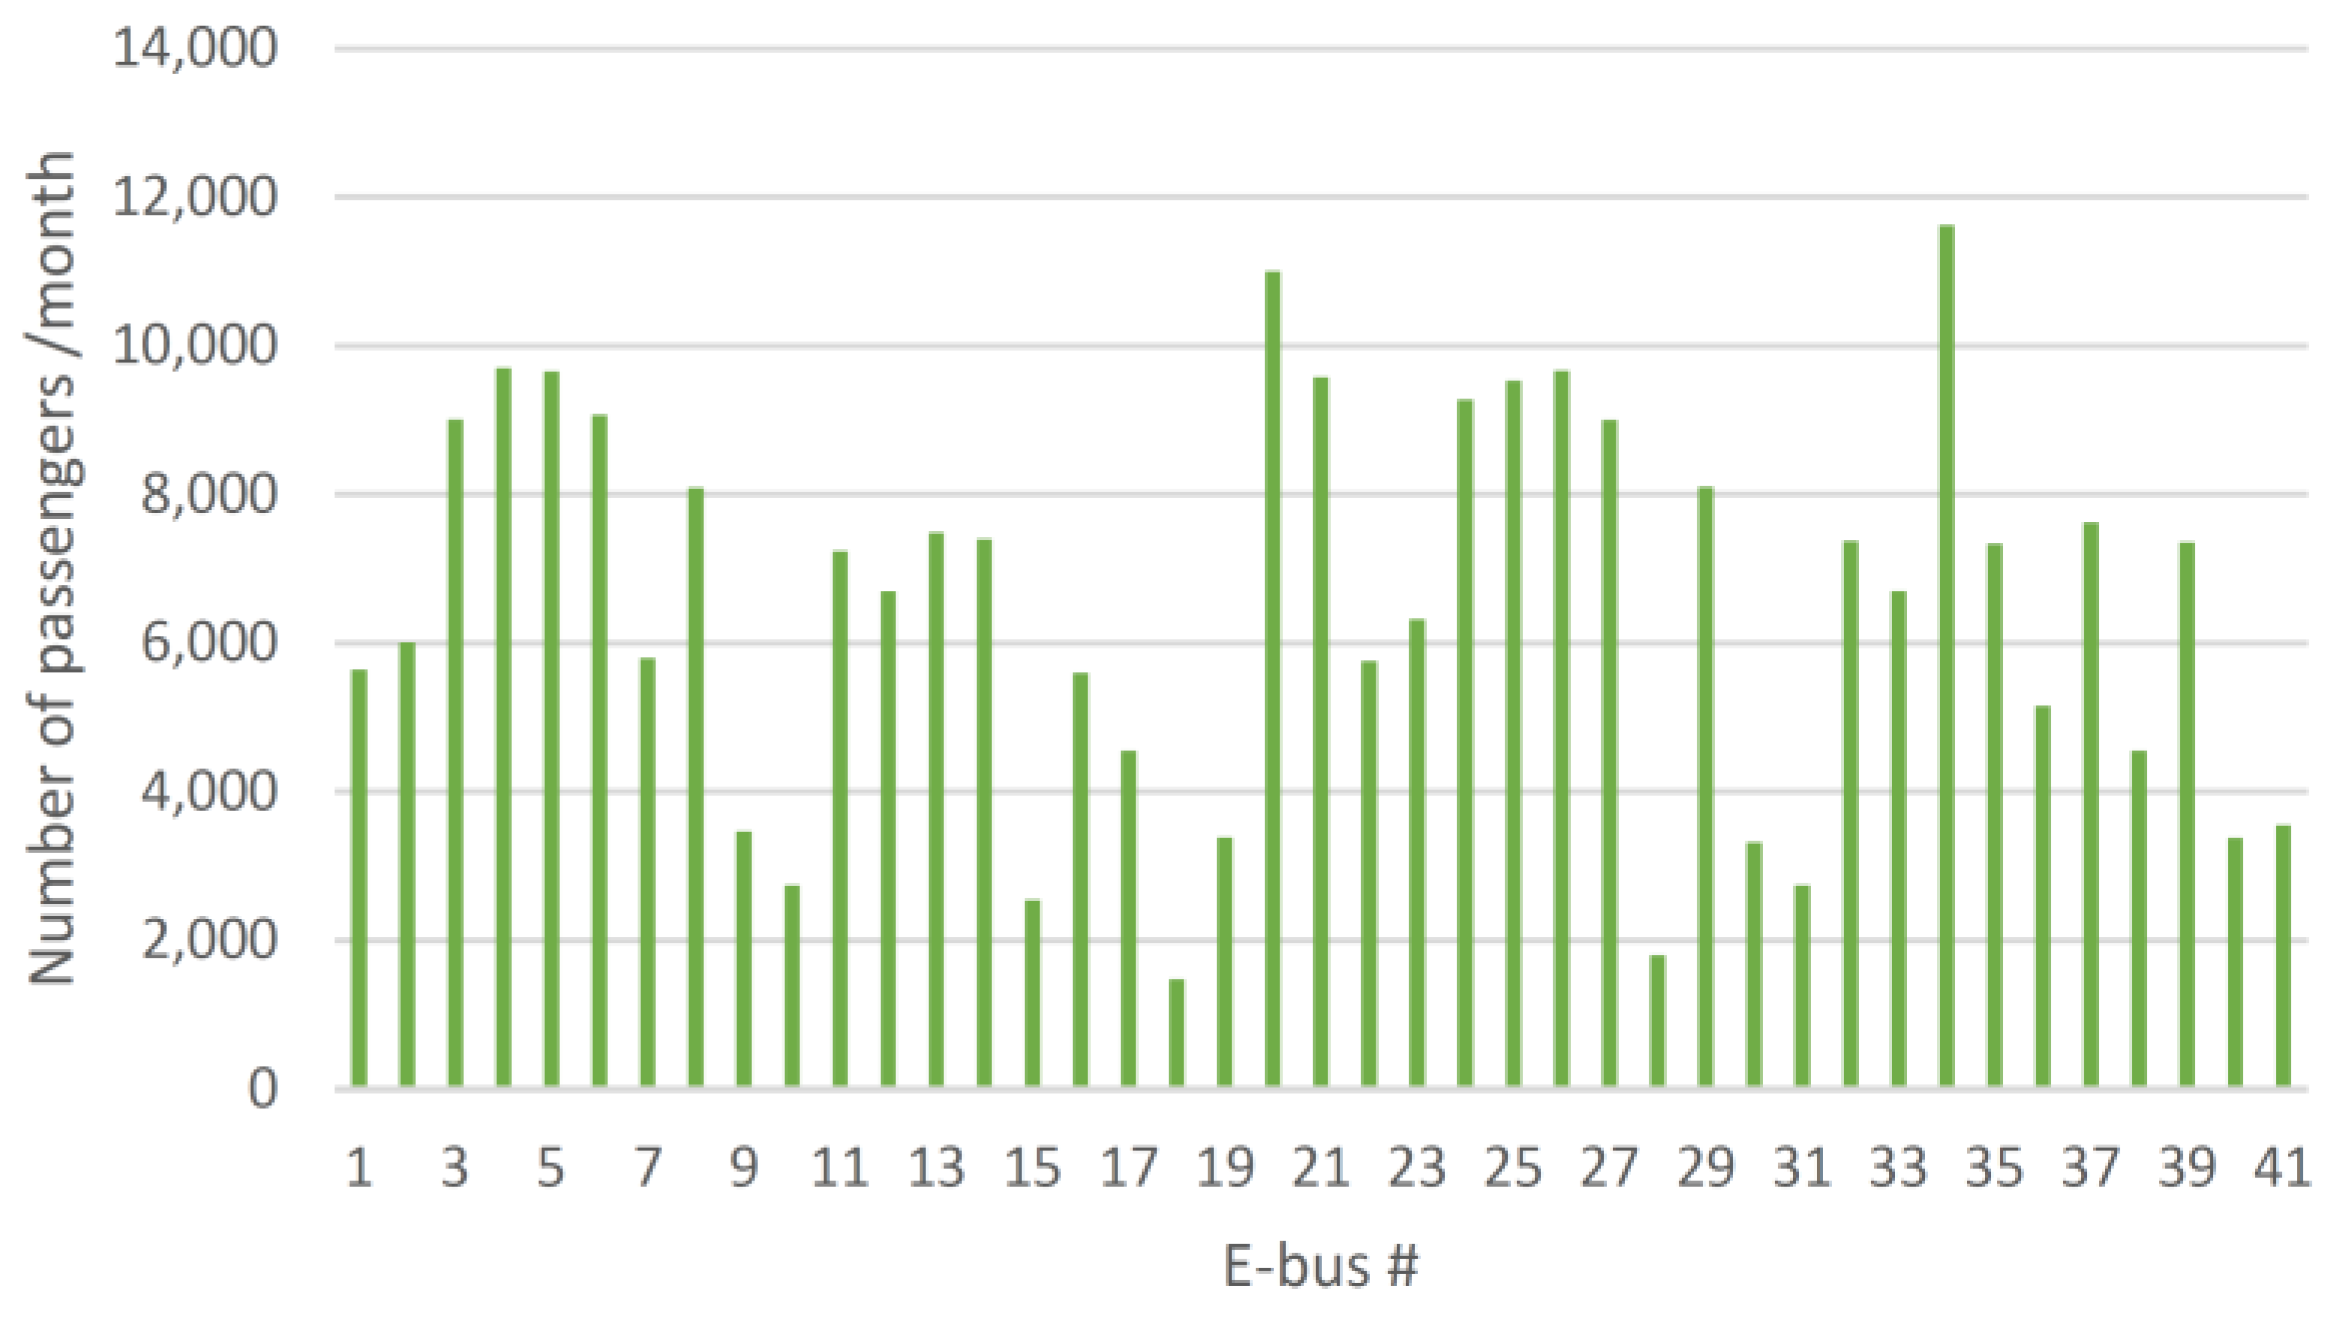
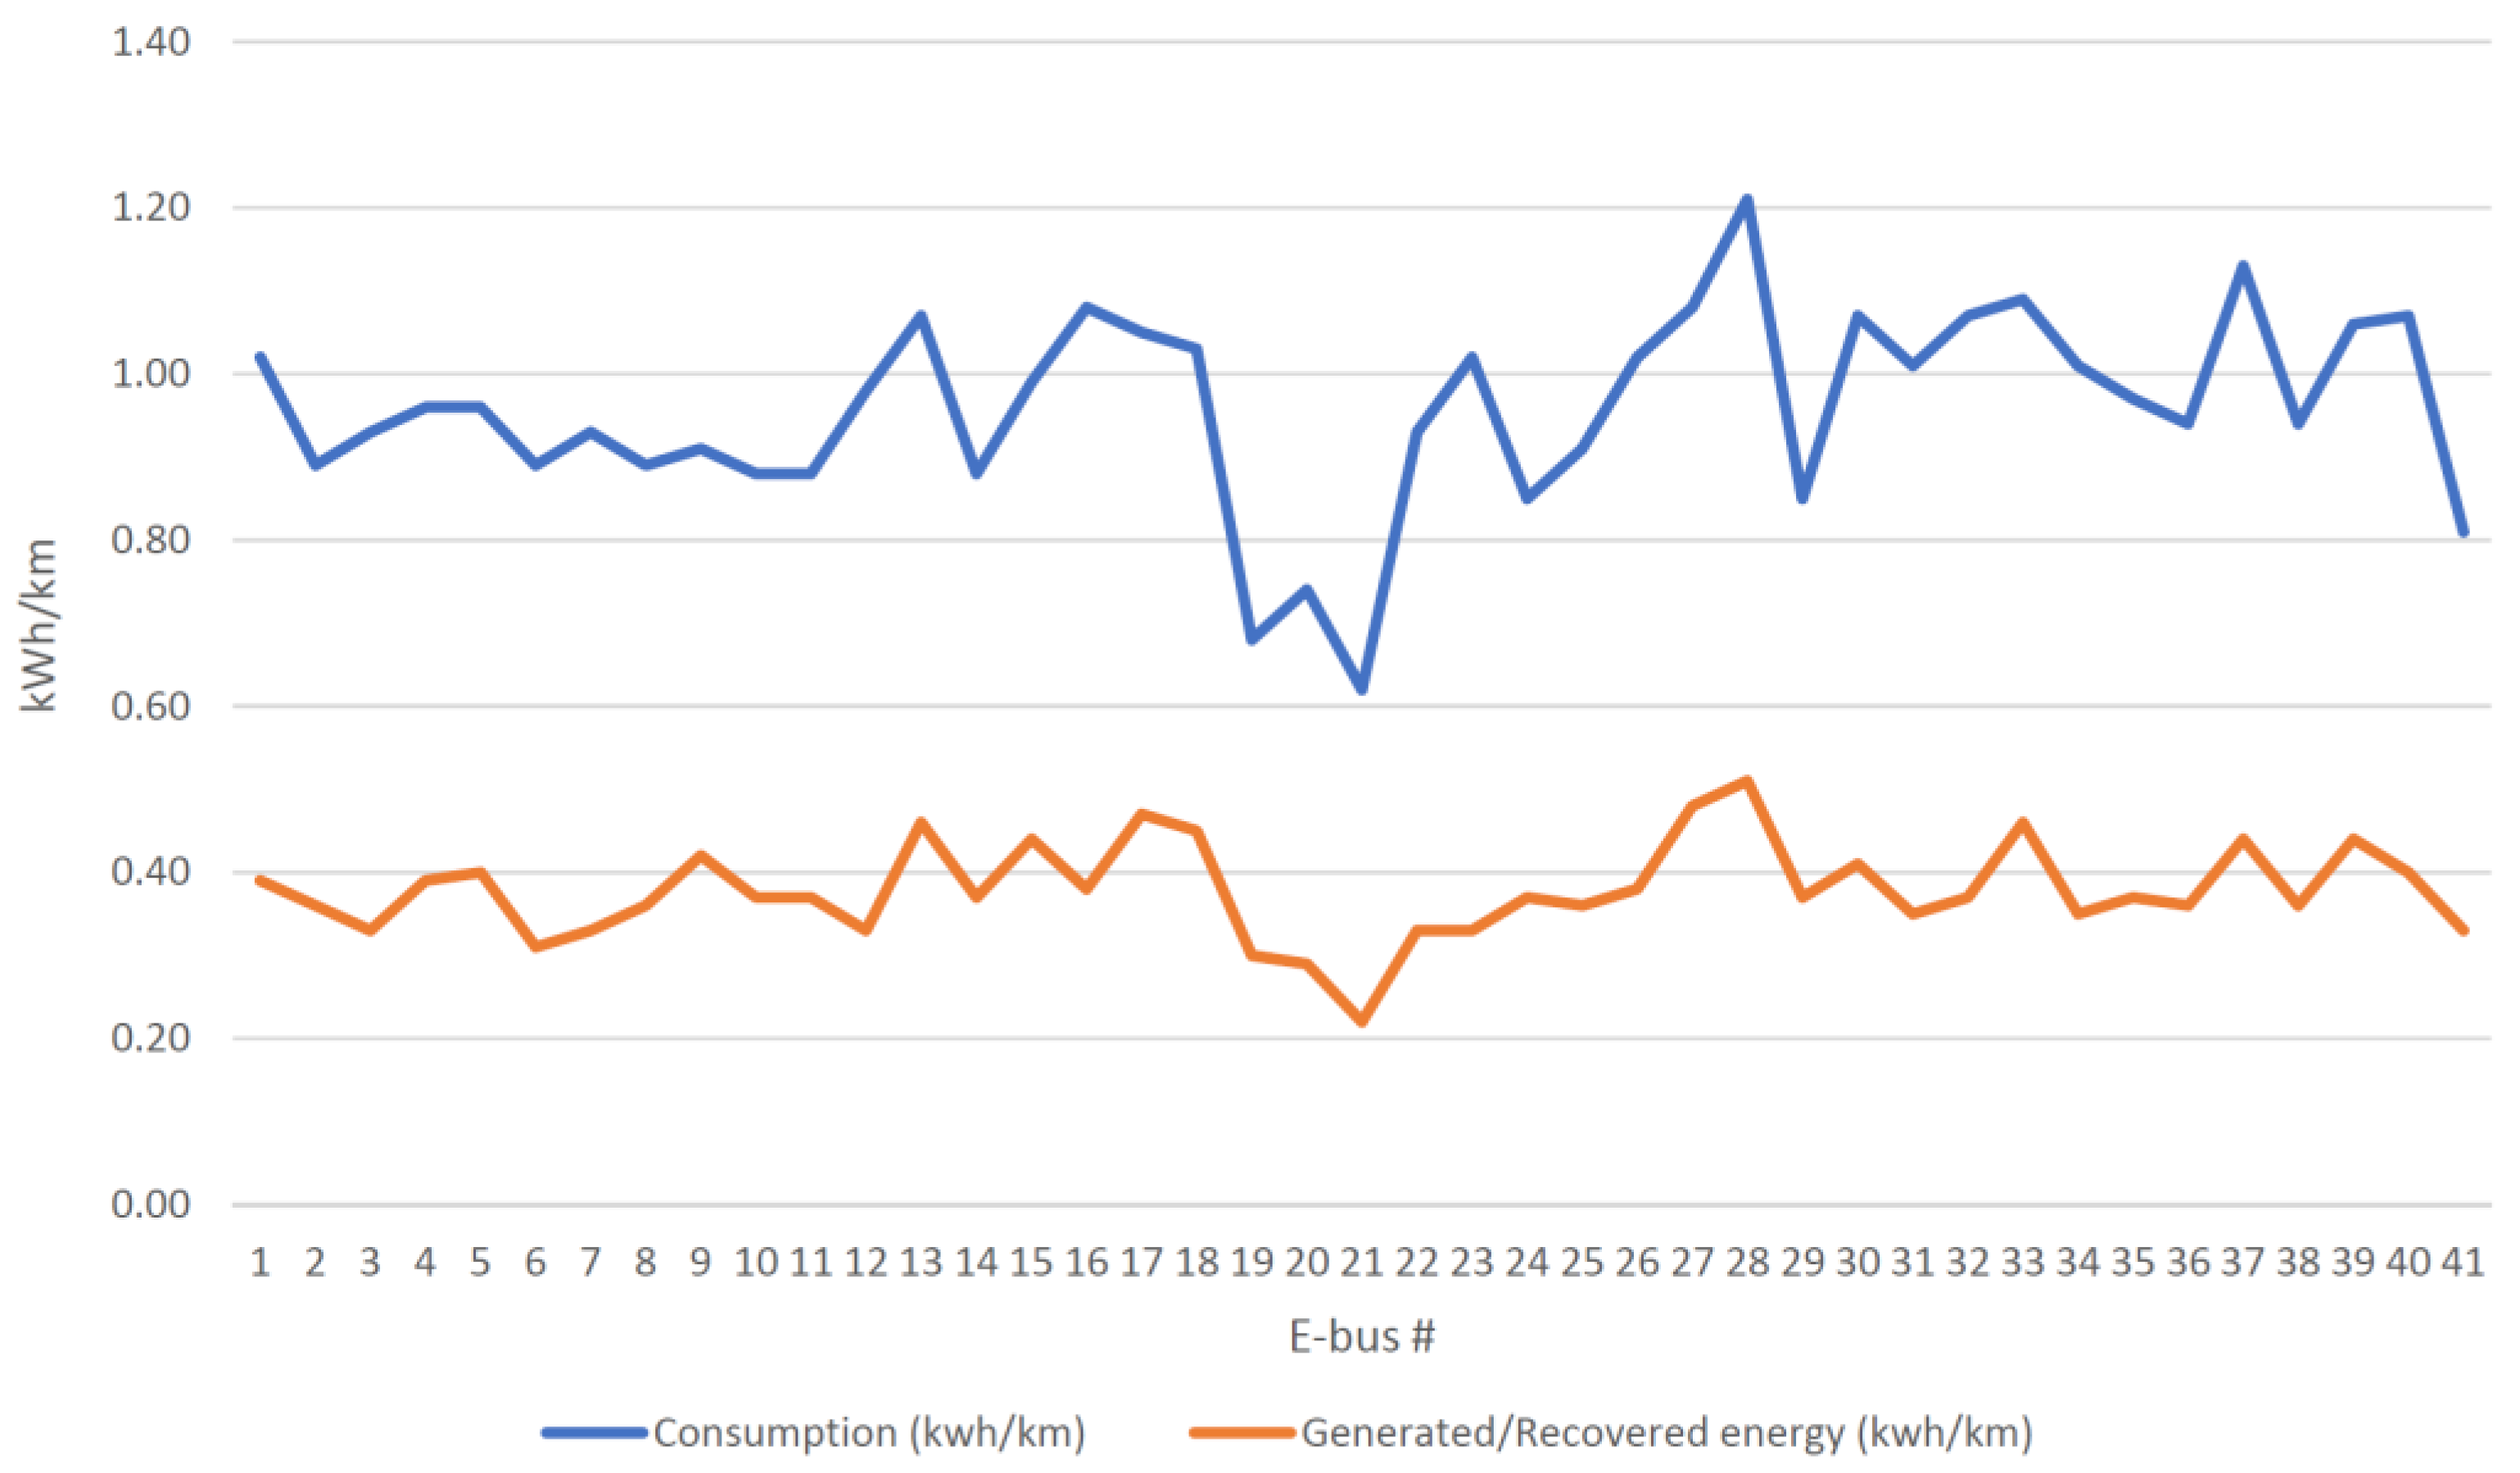
3.1. Direct Emissions Reduction

The direct emissions reduction due to replacing 41 diesel buses (Euro-3 pollution norm) with electric buses, considering the emissions intensity of the considered pollutants and the exploitation data presented previously, was found to be 668.45 tons of CO2 and 6.41 tons of NOx per year. Furthermore, taking into account the number of passengers transported by the electric bus fleet, it can be said that each passenger contributed to reducing the local pollution caused by urban traffic by 439.83 gCO2 and 4.22 gNOx per year.
In the case of the scenario of replacing Euro 3 buses with new Euro 6 buses, the direct reduction of CO2 emissions would be only 66.9 tons and in the case of NOx emissions of 5.83 tons, per year. Under these conditions, taking into account the intensity of the use of buses as a means of urban transport from the point of view of the transported passengers, the reduction of local pollution would be 44 gCO2/passenger/ year and 3.8 gNOx/passenger/year. It can be observed that when using Euro 6 buses instead of Euro 3 buses, the difference between CO2 emissions does not show great differences, but the reduction of NOx emissions is large, sensitive equal to the reduced amount by using electric buses.

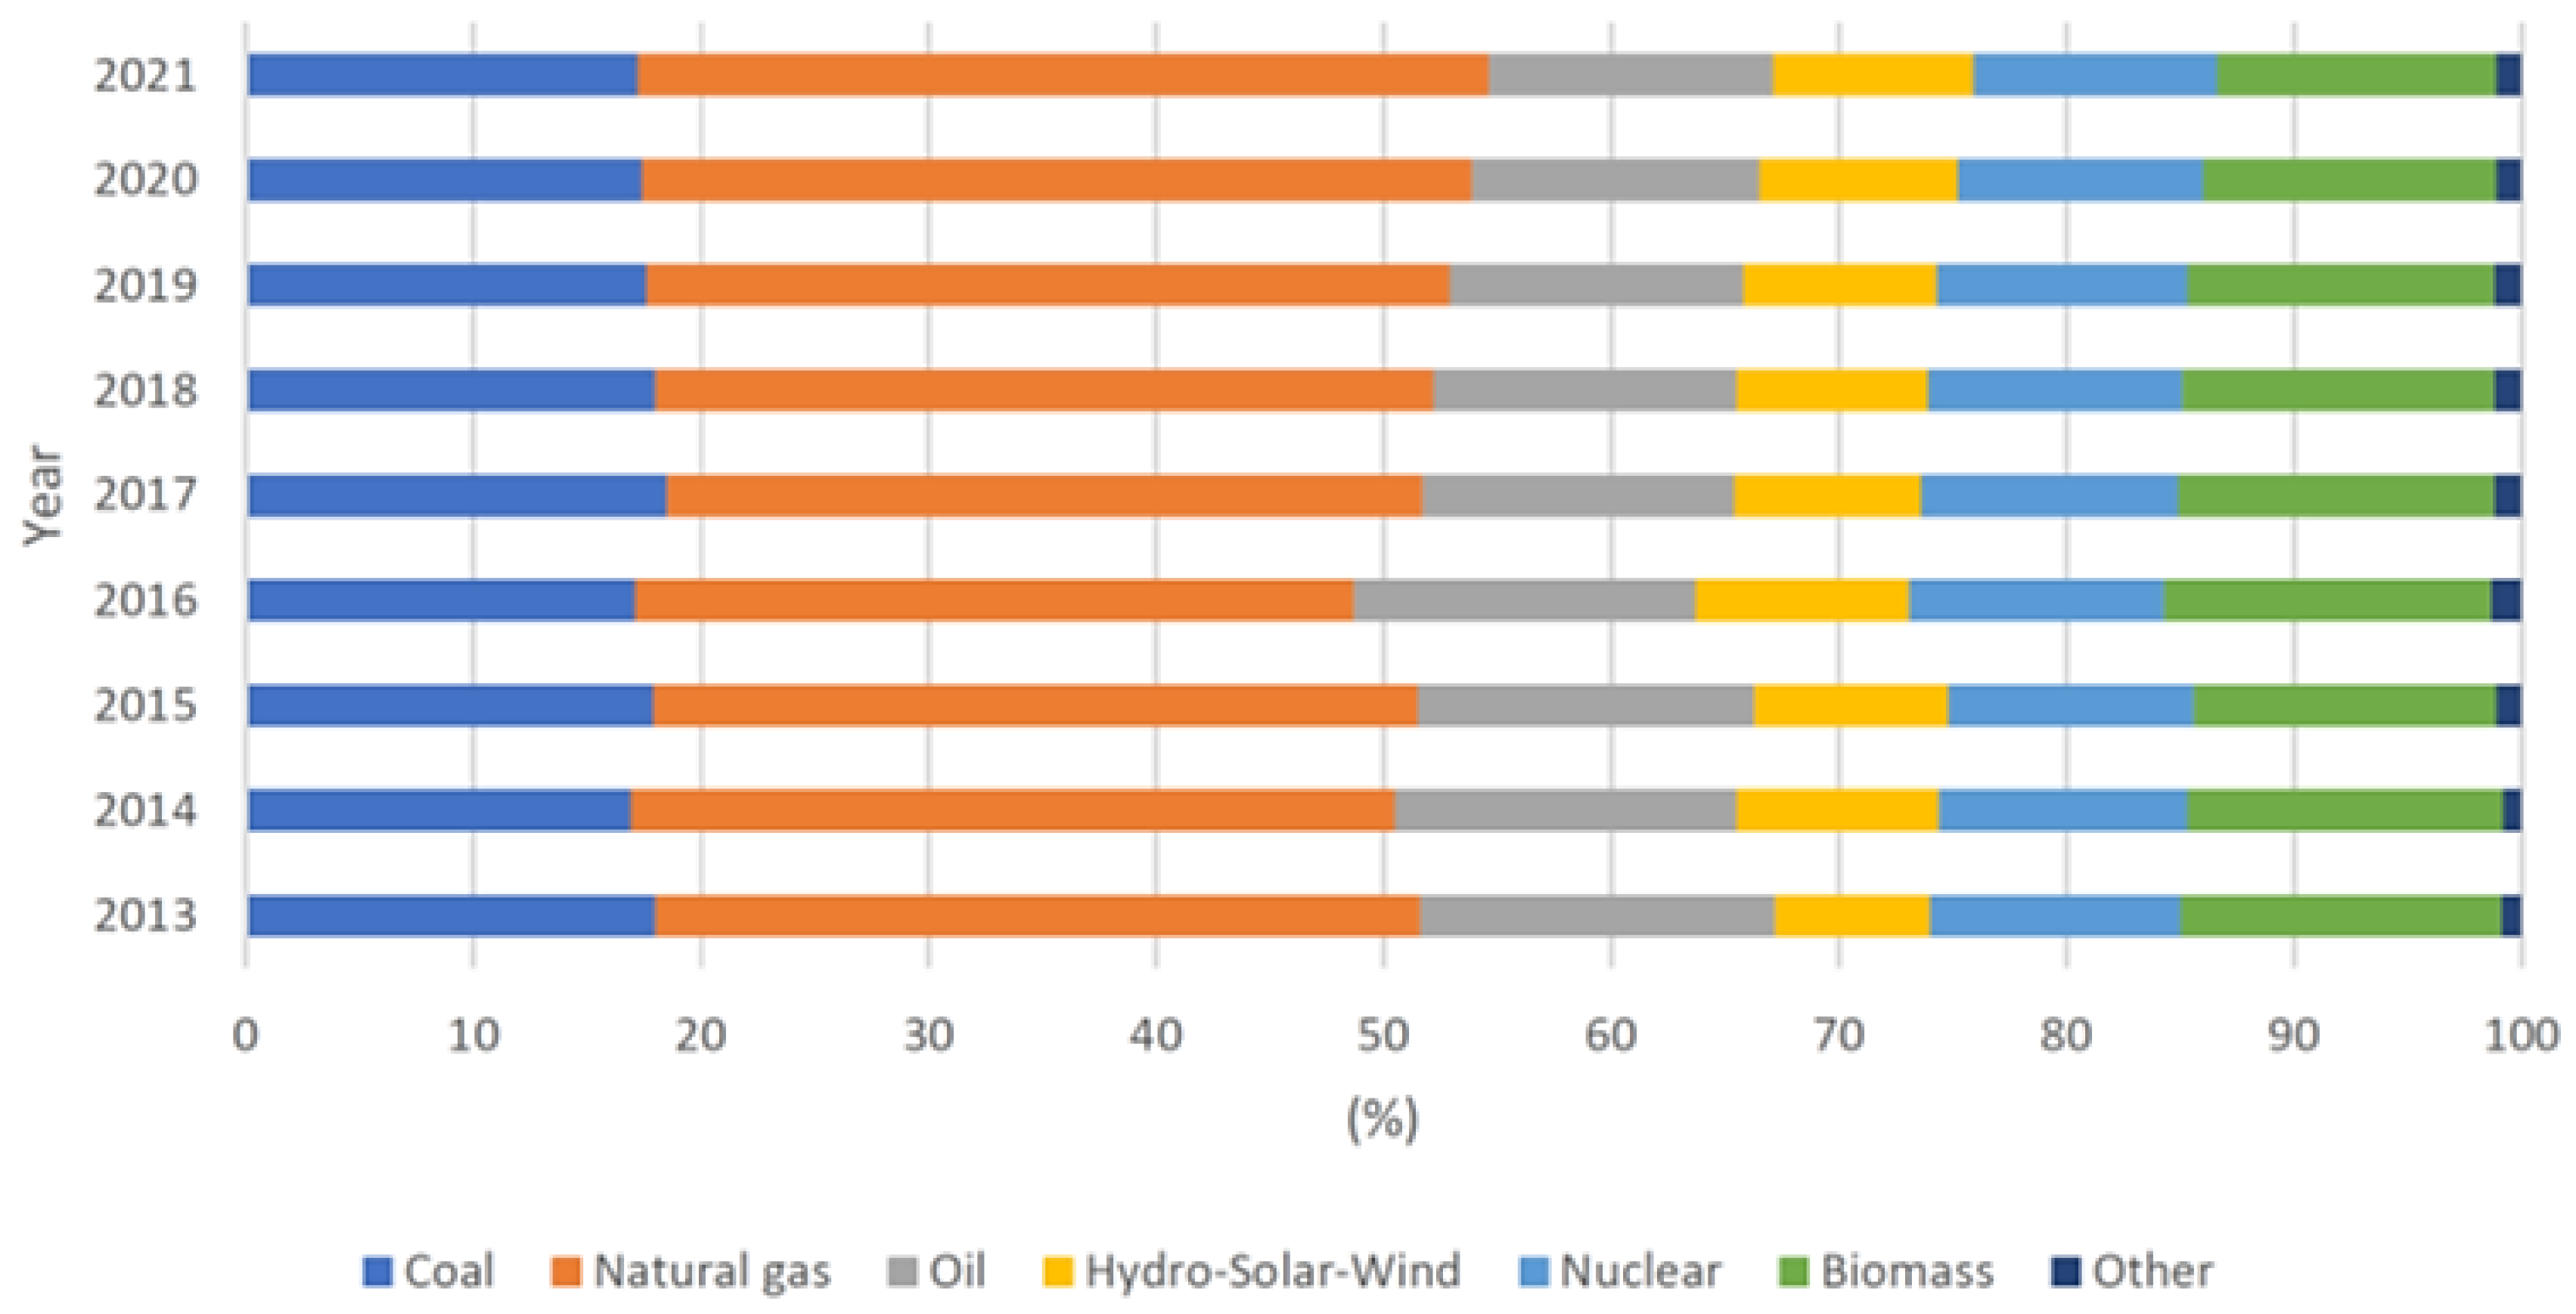
3.2. Indirect Emissions Reduction

To estimate the indirect pollutant emissions reduction by exploitation of the electric bus fleet, it is necessary to analyze the energetic mix of energy production used in charging the batteries of the fleet.
The method used to calculate the amount of emission of each considered pollutant is presented in Equation (1) (in the case of CO2, but applicable also for the NOx pollutant emission calculation), considering the energy consumption of the buses (kWh/km) and the intensity of pollutant emission function of energy source mix:
EVBCO2 (g/km) = TDkm × CO2 (emissivity) × Ebalance × Plosses,
where EVBCO2 (g/km) represents the amount of CO2 emissions, TDkm is traveled distance, CO2 (emissivity) is the pollutant emissivity due to the energy source mix used for electric energy production, Ebalance is the effective energy consumption of an e-bus, and Plosses = 1.15–1.22 are the losses caused by the electric distribution grid and the EVs internal electrical circuits. Since there are no official final data for Romania regarding the emission intensity for the electricity production in 2019 year (on the basis of the used fuel), data were taken from the references [12,34] and Figure 8 [35].
Figure 8 shows the Romanian energy mix over a period of 9 years (both historical and that forecast for 2020 and 2021) [35]. It can be noted that, within this energy mix, the “green energy” in 2019 represented a share of 34.2% of the total (renewable + nuclear), from which the average value of the intensity of CO2 production of 434.38 g/kWh and the average value of the intensity of NOx emissions production of 2.17 g/kWh for 2019 were derived (Table 2).
Based on this data, it is possible to calculate the amount of pollutant emissions indirectly eliminated in the atmosphere by using the fleet of 41 electric buses: 153.83–163.19 tons of CO2 per year (average value of 158.51 tons of CO2 per year) and 0.770–0.815 tons of NOx per year (average value of 0.792 tons of NOx per year). If considering the total number of kilometers traveled annually by all 41 electric buses under service, then the reduction of the considered emissions was 298.54 gCO2/km and 1.49 gNOx/km per year.

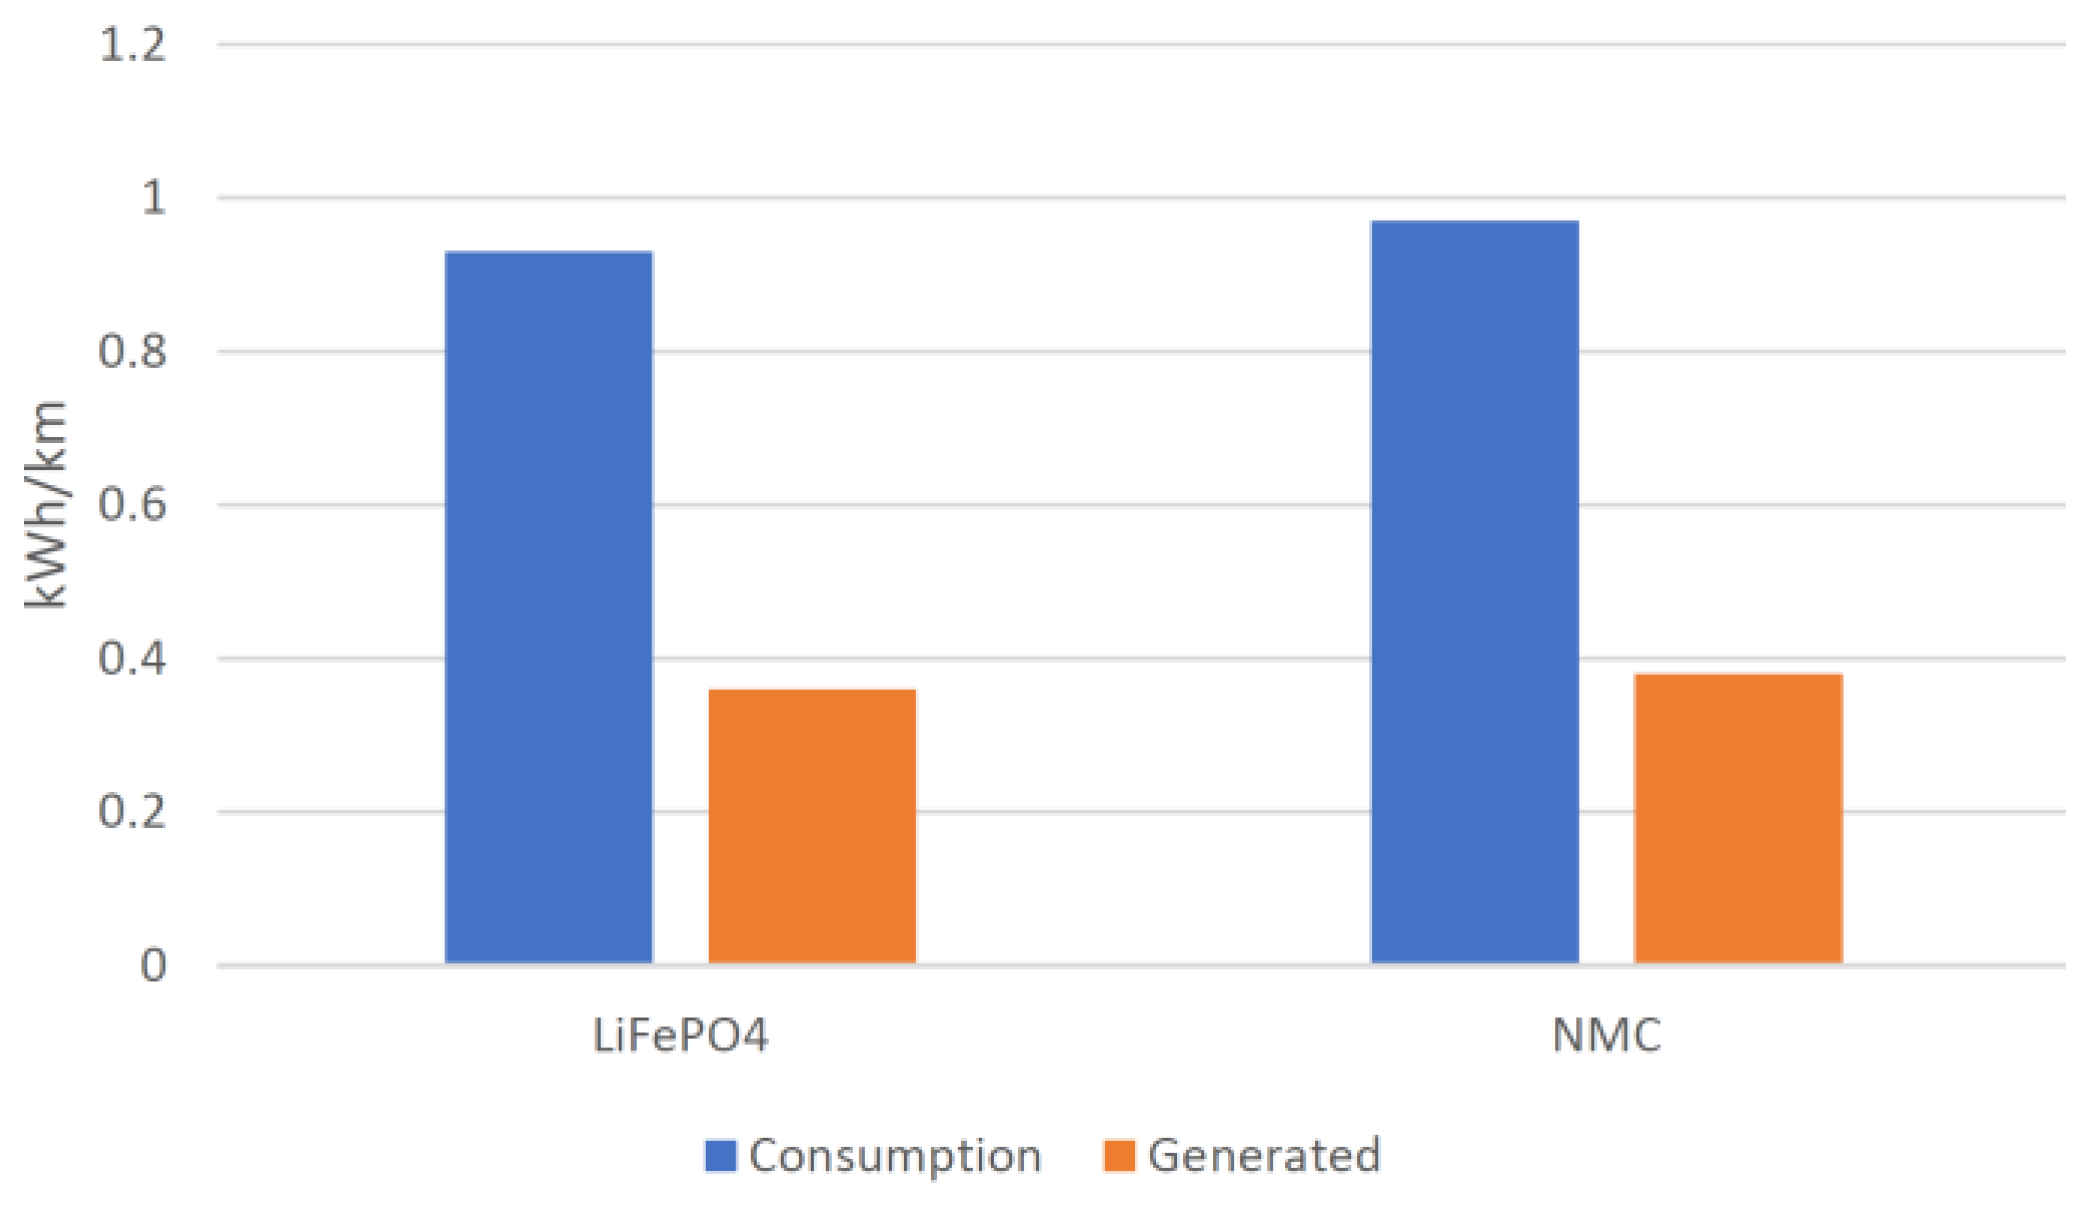
3.3. Effect of Battery Technologies

A separate discussion is related to the battery technologies used in the bus powertrain designs. As mentioned before, there were two types of batteries used: LiFePO4-type and NMC-type.
Li-Ion technology has been used in the construction of many types of batteries, the difference being the material used in the construction of the cathode (generally, graphite is used as the anode material). Thus, different acronyms have been used to identify this, such as: LFP, lithium iron phosphate; LCO, lithium cobalt oxide; LMO, lithium manganese oxide; NMC, lithium nickel manganese cobalt oxide; and NCA, lithium nickel cobalt aluminum oxide [15]. This particularity in the construction of the cathode causes differences in battery properties, in terms of specific energy, specific power, energy density, performance, voltage level, safety behavior, life span, and cost.
The major differences between the LiFePO4 and NMC batteries used for the electric powertrain of the Solaris 12E can be identified according to the following main operating characteristics:
  • Cycle life: LiFePO4—10,000 (80% retained capacity), NMC—10,000 (60% retained capacity);
  • Recommended C-rate: LiFePO4—C/2, NMC—C/5;
  • Ability to work in high-temperature environments: LiFePO4—YES (up to 120–140 °C), NMC—NO;
  • Danger of thermal runaway and fire hazard: LiFePO4—NO, NMC—YES; and
  • Thermal management equipment: LiFePO4—NO, NMC—YES.
Based on these main characteristics (among others), it has been considered that NMC-type batteries can cover a large variety of different applications (from small and home electronics to industrial energy storage facilities) and show great potential for the future automotive industry, mainly due to their higher energy density, as compared to LiFePO4 technology.
Nevertheless, it can be seen, from Figure 7, that the differences regarding the net energy consumption are relatively negligible and do not significantly influence the values of pollutant emissions by e-bus exploitation; however, they can be helpful in managing the fleet, by allocating routes in which the possibility of energy recovery (by the regenerative braking process) is greater. The energetic balance between energy consumption and energy generated (recovered) is 0.55 kWh/km for LiFePO4-type batteries and 0.58 kWh/km for NMC-type batteries (5.45%), which indicates that the influence of battery type on bus exploitation parameters does not have a major influence on the overall energetic efficiency of an electric bus.

4. Conclusions

Even though, at present, the costs associated with the introduction of electric buses into urban passenger transport systems are comparatively high, compared to buses equipped with modern internal combustion engines, their immediate utility is given by the local reduction of polluting emissions; appealing to the zero emission vehicle (ZEV) concept. In the particular case of the city of Cluj-Napoca, defined as a city with a medieval structure and infrastructure (old and historic buildings, narrow streets, multiple markets place, and so on), the introduction and operation of a fleet of 41 electric buses managed to eliminate a local amount of 668.45 tons of CO2 and 6.41 tons of NOx—pollutant emissions directly associated with harmful effects on human health—annually.
The emission balance was positive in both the cases of CO2 and NOx pollutants. The exploitation of 41 electric buses (in the particular traffic conditions of Cluj-Napoca city) had managed to reduce global pollution emissions by 509.95 tons of CO2 and 5.618 tons of NOx each year.
These values could be improved further, in order to increase the values of the indirect pollutant and GHG emissions eliminated through local energy management, whereby the energy mix used by the city contained a higher percentage of green energy (such as wind, solar, and/or energy from renewable sources).
The operation of a fleet of urban electric buses was shown to be feasible, taking into account the small average speeds of traffic in urban agglomeration areas and the fact that, when stopped in traffic, an electric bus consumed a minimal amount of energy (only that needed for supplying its auxiliary systems).
The obtained values of the net energy consumption (lower than those found in the specialized literature) were directly influenced by the type and power of the electric propulsion group of the bus (162 kW power of the Solaris 12 E electric motor, comparative to 180 kW for BYD 9K and 240 kW for e-CITARO), the traffic conditions (the existence of dedicated/exclusive lines for buses and which by their nature increase the efficiency of the braking energy regeneration process) and the traffic conditions and the behavior of driver.
Furthermore, local policies to reduce polluting emissions need to be developed and supported further (taxes, preferential parking places, dedicated commuting lanes, education, and so on) in the personal and passenger transportation fields, in order to increase the share of electric and hybrid vehicles in the urban transport system.

Author Contributions

Conceptualization and supervision, B.O.V. and F.M.; methodology and resources, C.D.M. and V.N.; data curation, I.S. and A.A.S.; writing—original draft preparation, F.M.; writing—review B.O.V. and F.M. All authors have read and agreed to the published version of the manuscript.

Funding

This research received no external funding.

Conflicts of Interest

The authors declare no conflict of interest.

References

  1. Sabine, G.; Michael, G.; Nicole, M.; Katarina, M. European Environmental Agency (2019) European Union Emission Inventory Report 1990–2017 under the UNECE Convention on Long-Range Transboundary Air Pollution (LRTAP); EEA Report No 08/2019; EEA: Copenhagen, Denmark, 2019; ISSN 1977–8449. [Google Scholar] [CrossRef]
  2. Crouse, D.L.; Goldberg, M.S.; Ross, N.; Chen, H.; Labreche, F. Postmenopausal breast cancer is associated with exposure to traffic-related air pollution in Montreal, Canada: A case-control study. Environ. Health Perspect. 2010, 118, 1578–1583. [Google Scholar] [CrossRef] [Green Version]
  3. Hung, L.J.; Tsai, S.; Chen, P.; Yang, Y.; Liou, S.; Yang, C. Traffic air pollution and risk of death from breast cancer in Taiwan: Fine particulate matter (PM 2.5) as a proxy marker. Aerosol Air Qual. Res. 2011, 12, 275–282. [Google Scholar] [CrossRef] [Green Version]
  4. Manzetti, S. Ecotoxicity of polycyclic aromatic hydrocarbons, aromatic amines and nitroarenes from molecular properties. Environ. Chem. Lett. 2012, 10, 349–361. [Google Scholar] [CrossRef]
  5. Manzetti, S. Polycyclic aromatic hydrocarbons in the environment: Environmental fate and transformation. Polycycl. Aromat. Compd. 2013, 33, 311–330. [Google Scholar] [CrossRef]
  6. Wall, G.; Felstead, T.; Richards, A.; McDonald, M. Cleaner vehicle buses in Winchester. Transp. Policy 2008, 15, 55–68. [Google Scholar] [CrossRef]
  7. Garcia Sanchez, J.A.; Lopez Martinez, J.M.; Martin, J.L.; Flores Holgado, M.N.; Morales, H.A. Impact of Spanish electricity mix, over period 2008-2030, on the Life Cycle energy consumption and GHG emissions of Electric, Hybrid Diesel-Electric, Fuel Cell Hybrid and Diesel Bus of the Madrid Transportation System. Energy Convers. Manag. 2013, 74, 332–343. [Google Scholar] [CrossRef]
  8. Varga, B.; Mariasiu, F.; Moldovanu, D.; Iclodean, C. Electric and Plug-In Hybrid Vehicles–Advanced Simulation Methodologies; Springer: Basel, Switzerland, 2015; pp. 477–524. [Google Scholar]
  9. Varga, B.; Iclodean, C.; Mariasiu, F. Electric and Hybrid Buses for Urban Transport-Energy Efficiency Strategies; Springer: Basel, Switzerland, 2016; pp. 85–103. [Google Scholar]
  10. Kuhne, R. Electric buses–An energy efficient urban transportation means. Energy 2010, 35, 4510–4513. [Google Scholar] [CrossRef]
  11. Nurhadi, L.; Boren, S.; Ny, H. A sensitivity analysis of total cost of ownership for electric public bus transport system in Swedish medium size cities. Transp. Res. Procedia 2014, 3, 818–827. [Google Scholar] [CrossRef] [Green Version]
  12. Varga, B.; Mariasiu, F. Indirect environment-related effects of electric car vehicles use. Environ. Eng. Manag. J. 2018, 17, 1591–1597. [Google Scholar]
  13. Junquera, B.; Moreno, B.; Álvarez, R. Analyzing consumer attitudes towards electric vehicle purchasing intentions in Spain: Technological limitations and vehicle confidence. Technol. Forecast. Soc. Chang. 2016, 109, 6–14. [Google Scholar] [CrossRef]
  14. Un-Noor, F.S.; Padmanaban, L.; Mihet-Popa, M.N.; Mollah, E.; Hossain, A. Comprehensive Study of Key Electric Vehicle (EV) Components, Technologies, Challenges, Impacts, and Future Direction of Development. Energies 2017, 10, 1217. [Google Scholar] [CrossRef] [Green Version]
  15. Shabbir, A.; Trask, S.E.; Dees, D.W.; Nelson, P.A.; Lu, W.; Dunlop, A.R.; Polzin, B.J.; Jansen, A.N. Cost of automotive lithium-ion batteries operating at high upper cutoff voltages. J. Power Sources 2018, 403, 56–65. [Google Scholar]
  16. Brand, M.; Gläser, S.; Geder, J.; Menacher, S.; Obpacher, S.; Jossen, A.; Quinger, D. Electrical safety of commercial Li-ion cells based on NMC and NCA technology compared to LFP technology. In Proceedings of the EVS27 International Battery, Hybrid and Fuel Cell Electric Vehicle Symposium, Barcelona, Spain, 17–20 November 2013. [Google Scholar]
  17. Tzeng, G.H.; Lin, C.W.; Opricovic, S. Multi-criteria analysis of alternative-fuel buses for public transportation. Energy Policy 2005, 33, 1373–1383. [Google Scholar] [CrossRef]
  18. Li, Y.; Bao, L.; Deng, H.; Lu, D. Promoting the Marketization of Battery-Electric-Bus (BEB) based on the Satisfaction Model. Procedia-Soc. Behav. Sci. 2013, 96, 1146–1155. [Google Scholar] [CrossRef] [Green Version]
  19. Mirchandani, P.; Adler, J.; Madsen, O.B.G. New logistical issues in using electric vehicle fleets with battery exchange infrastructure. Procedia-Soc. Behav. Sci. 2014, 108, 3–14. [Google Scholar] [CrossRef] [Green Version]
  20. Christidis, P.; Focas, C. Factors Affecting the Uptake of Hybrid and Electric Vehicles in the European Union. Energies 2019, 12, 3414. [Google Scholar] [CrossRef] [Green Version]
  21. Vassileva, I.; Campillo, J. Adoption barriers for electric vehicles: Experiences from early adopters in Sweden. Energy 2017, 120, 632–641. [Google Scholar] [CrossRef]
  22. Stempien, J.P.; Chan, S.H. Comparative study of fuel cell, battery and hybrid buses for renewable energy constrained areas. J. Power Sources 2017, 340, 347–355. [Google Scholar] [CrossRef]
  23. Erkkilae, K.; Nylund, N.O.; Pellikka, A.P.; Kallio, M.; Kallonen, S.; Kallio, M.; Ojamo, S.; Ruotsalainen, S.; Pietikäinen, O.; Lajunen, A. eBUS-Electric bus test platform in Finland. In Proceedings of the eBUS-Electric Bus Test Platform in Finland, EVS27 International Conference, Barcelona, Spain, 17–20 November 2013. [Google Scholar]
  24. Lajunen, A. Energy consumption and cost-benefit analysis of hybrid and electric city buses. Transp. Res. Part C 2014, 38, 1–15. [Google Scholar] [CrossRef]
  25. Vepsalainen, J.; Otto, K.; Lajunen, A.; Tammi, K. Computationally efficient model for energy demand prediction of electric city bus in varying operating conditions. Energy 2019, 169, 433–443. [Google Scholar] [CrossRef]
  26. Zhou, B.; Wu, Y.; Zhiu, B.; Wang, R.; Ke, W.; Zhang, S.; Hao, J. Real-world performance of battery electric buses and their life-cycle benefits with respect to energy consumption and carbon dioxide emissions. Energy 2016, 96, 603–613. [Google Scholar] [CrossRef]
  27. Song, Q.; Wang, Z.; Wu, Y.; Li, J.; Yu, D.; Duan, H.; Yuan, W. Could urban electric public bus really reduce the GHG emissions: A case study in Macau? J. Clean. Prod. 2018, 172, 2133–2142. [Google Scholar] [CrossRef]
  28. Mahmoud, M.; Garnett, R.; Ferguson, M.; Kanaroglou, P. Electric buses: A review of alternative powertrains. Renew. Sustain. Energy Rev. 2016, 62, 673–684. [Google Scholar] [CrossRef]
  29. Tucki, K.; Orynycz, O.; Świć, A.; Mitoraj-Wojtanek, M. The Development of Electromobility in Poland and EU States as a Tool for Management of CO2 Emissions. Energies 2019, 12, 2942. [Google Scholar] [CrossRef] [Green Version]
  30. Oprešnik, S.R.; Seljak, T.; Vihar, R.; Gerbec, M.; Katrašnik, T. Real-World Fuel Consumption, Fuel Cost and Exhaust Emissions of Different Bus Powertrain Technologies. Energies 2018, 11, 2160. [Google Scholar] [CrossRef] [Green Version]
  31. Arcentales, D.; Silva, C. Exploring the Introduction of Plug-In Hybrid Flex-Fuel Vehicles in Ecuador. Energies 2019, 12, 2244. [Google Scholar] [CrossRef] [Green Version]
  32. Nylund, N.O.; Erkkilä, K.K.; Lappi, M.; Ikonen, M. Transit Bus Emission Study: Comparison of Emissions from Diesel and Natural Gas Buses. Research Report PRO3/P5150/04. 2004. Available online: https://www.cti2000.it/Bionett/BioG-2004001%20Transit%20Bus%20Emission%20Study.pdf (accessed on 31 July 2019).
  33. Maciej, G. Comparative studies exhaust emissions of the Euro VI buses with diesel engine and spark-ignition engine CNG fuelled in real traffic conditions. In MATEC Web of Conferences (VII International Congress on Combustion Engines); EDP Sciences: Les Ulis, France, 2017; Volume 118, p. 00007. [Google Scholar]
  34. POST-Parliamentary Office of Science and Technology. Carbon Footprint of Electricity Generation, Report Number 268. 2006. Available online: http://www.parliament.uk/documents/post/postpn268.pdf (accessed on 20 August 2019).
  35. Romanian National Institute for Statistics. Statistica Energiei. Available online: http://www.insse.ro/cms/ro/content/statistica-energiei (accessed on 20 August 2019). (In Romanian)
Figure 1. General structures of electric and hybrid powertrains used in the construction of buses: (a) electric bus; (b) hybrid series; and (c) hybrid parallel. 1, battery; 2, electric motor; 3, transmission; 4, final drive; 5, auxiliaries; 6, generator; 7, engine; and 8, torque converter/coupler.
Energies 13 00336 g001
Figure 2. Overall dimensions of the Solaris 12 E bus. (a) side view (b) front view.
Energies 13 00336 g002
Figure 3. Number of kilometers traveled annually per each e-bus: (a) LiFePO4 battery bus type; and (b) NMC battery bus type.
Energies 13 00336 g003
Figure 4. Number of passengers carried per month.
Energies 13 00336 g004
Figure 5. Passenger number dynamics for one day’s operations of an electric bus.
Energies 13 00336 g005
Figure 6. Energy balance of the fleet of electric buses (kWh/km).
Energies 13 00336 g006
Figure 7. Energy balance (net energy consumption), according to battery type.
Energies 13 00336 g007
Figure 8. The energy mix of the electricity production in Romania (historical, current, and forecast) [35].
Energies 13 00336 g008
Table 1. Main technical data of the Solaris 12 E bus.
ParameterValue
EngineElectric portal axle ZF AVE130 2 × 110 kW
Traction battery technologyLiFePO4 technology:
58.8 kW pack nominal energy; 687.02 V nominal voltage
NMC technology:
50.7 kW pack nominal energy; 651.20 V nominal voltage
Charging systemPlug-in
(optional pantograph)
Front axleZF independent suspension
Rear (drive) axleZF portal axle with integrated electric motors
Suspension leveling systemECAS air suspension with lowering/raising function:
lowering and raising the bus, lowering right side by 70 mm, raising by approx. 60 mm.
Passenger capacity seatedMax. 37 + 1
(depending on door arrangement and batteries)
Table 2. CO2 and NOx emissions intensities, depending on the energy mix for the year 2019 [11,34].
Electricity Generation SourcesEnergy Mix (%)CO2 Emission Factor (gCO2eq/kWh)Direct CO2 Emission by Fuel (gCO2/kWh)NOX Emission Factor (gNOXeq/kWh)Direct NOX Emission by Fuel (gNOX/kWh)
Coal17.6100017061.056
Oil12.965083.8540.516
Natural Gas35.3500176.51.70.6001
Renewable23.2153.480.0060.001392
Nuclear1150.5500

