Article

Characteristics of Gel Time and Dielectric Strength of Epoxy Composite According to the Mixing Ratio of Micro-Fillers

1
Department of Electronic Engineering, Hanyang University, Hanyangdaehak-ro 55, Ansan 15588, Korea
2
Advanced Materials System Team 2, KUKDO Chemial, Gasan digital 2-ro, 61, Seoul 08588, Korea
*
Author to whom correspondence should be addressed.
Energies 2020, 13(19), 5165; https://doi.org/10.3390/en13195165
Submission received: 27 August 2020 / Revised: 28 September 2020 / Accepted: 1 October 2020 / Published: 4 October 2020
(This article belongs to the Section F: Electrical Engineering)

Abstract

:
The dielectric strength and gel time of epoxy composites vary with the mixing ratio of epoxy resin, hardener, additives, filler, etc., and especially the gel time affects the productivity and economics of ultra-high-voltage (UHV) equipment. However, previous studies focused only on the dielectric strength of epoxy composites for the reliability of UHV equipment. Therefore, a study considering both the dielectric strength and gel time of the epoxy composite is required. In this paper, the characteristics of the gel time and dielectric strength of the epoxy micro-composites according to the mixing ratio of silica (SiO2) and alumina (Al2O3) micro-fillers without changing the mixing ratio of epoxy resin and hardener are analyzed. Experimental results show that the gel time decreased and the dielectric strength increased as the mixing ratio of the SiO2 micro-filler increased. Therefore, it is concluded that the gel time can be controlled by changing the mixing ratio of micro-fillers without changing the mixing ratio of the epoxy resin and hardener. In addition, experimental data can be used as basic data for economical production considering both the reliability and productivity of UHV power equipment.

1. Introduction

Sulfur hexaflouride (SF6) has a global warming potential (GWP) that is 22,800 times higher than carbon dioxide among the six greenhouse gases regulated by the Kyoto protocol [1]. Therefore, in order to regulate and reduce the use of SF6 applied as an insulating material in ultra-high-voltage (UHV) power equipment, eco-friendly insulating gases and solid insulating materials are being discussed as alternatives to SF6 [2,3]. Recently developed fluorine-based gas has a lower GWP and similar dielectric strength to SF6 gas, so it is attracting attention as an insulating gas to replace SF6 gas. However, problems such as high liquefaction temperature, toxicity and reliability have not been solved yet. Therefore, studies on solid insulating materials that are relatively safe and reliable compared to fluorine-based gases are being actively conducted [4,5].
Epoxy resins which are used as solid insulating materials have excellent electrical and chemical properties such as withstand voltage, adhesive strength, wear resistance and water resistance [6,7,8]. However, pure epoxy resins are not suitable for use as solid insulating materials in UHV power equipment, since they cannot be made into large moldings due to inadequate mechanical and thermal properties. In addition, when the temperature inside the epoxy increases due to the exothermic reaction generated in the curing process of the epoxy resin, the reaction rate that affects the cross-linking mechanism and internal mechanical stress is changed, which causes internal cavities and surface deformation [9]. Therefore, in order to improve the insufficient mechanical and thermal properties of epoxy resin, research on epoxy composites is being conducted to improve tensile strength, compression, coefficient of thermal expansion, glass transition temperature, etc., by polymerizing, dispersing rubber or adding inorganic micro-fillers [10,11,12,13,14,15].
Epoxy composites are insulating materials that improve physical and chemical performance by mixing two or more materials with pure epoxy. Epoxy composites as insulating materials are generally focused on maximizing the advantages of epoxy and overcoming the disadvantages by adding inorganic fillers. However, by controlling the ratio of epoxy resin, hardener and additive during the manufacture of epoxy composites, glass transition temperature, gel time, tensile strength, etc., can be changed. These variations may, over time, cause eventual degradation in the performance of the epoxy composite [16,17,18,19]. Gel time is the time to harden from the liquid state to the solid state by heating the semi-cured epoxy resin, and gel time affects the production cost and productivity of UHV power equipment. The glass transition temperature (Tg) is the temperature at which the properties of the material change from glassy phase to rubbery phase as the temperature is increased, and this affects the mechanical properties of epoxy composites. Therefore, when the gel time is shortened and the Tg is decreased, the production cost increases and the productivity, mechanical properties and thermal properties decrease. Consequently, there is a need for a technology that can control the productivity without damaging the high mechanical, thermal and dielectric properties of the epoxy composite. However, most of the recent research has focused on improving the performance of epoxy and has not considered the gel time for the economical production of epoxy insulation to be used in UHV power equipment.
In this paper, in order to allow epoxy molding of UHV power equipment to be more efficient, an investigation of the variation in gel time by changing the mix ratio and blend of micro-fillers without changing the amount of epoxy resin and hardener is undertaken. Five epoxy composites were fabricated by varying the mix ratio of alumina (Al2O3) and silica (SiO2) micro-filler, as these are commonly used in manufacturing epoxy composites for use in HV equipment [20]. In addition to measuring the gel time, in order to ensure the dielectric and thermal characteristics of the resulting materials were suitable for the reliability and productivity of UHV power equipment, the relative permittivity, dielectric loss tangent and glass transition temperatures were measured. Finally, a scale parameter of 63.2% of the probability of dielectric breakdown for each specimen was provided through the AC/LI dielectric breakdown test.

2. Composition of Epoxy Composites

For use as solid insulation in UHV power equipment, epoxy composite materials should have high heat resistance and dielectric strength. Therefore, the additional material is to be included with the epoxy resin and hardener must provide these functions. Consequently, in this paper, epoxy micro-composites were prepared by adding two micro-fillers to determine their effect on performance. The epoxy resin, hardener and micro-fillers are discussed below.

2.1. Epoxy Resin Composition

The epoxy resin is comprised of epoxy resin, a diluent and a coupling agent as a matrix material of an epoxy micro-composite. In this case, the content of the epoxy resin composition is preferably 10 to 30 wt% based on 100 wt% by weight of the total molding composition. When the content of the epoxy resin composition is less than 10 wt%, the viscosity is too high for molding. Further, when it exceeds 30 wt%, the coefficient of linear expansion is too high to reduce the dimensional stability so that it cannot be used as a material for a UHV power equipment parts. Therefore, bisphenol A epoxy resin and bisphenol F (Kukdo Chemical Co., Ltd., Seoul, Korea) were used for the epoxy resin of the epoxy resin composition. Moreover, according to the proposal based on the manufacturing process guidelines of Kukdo Chemical Co., Ltd., an epoxy insulator manufacturer, the weight percent of bisphenol A and bisphenol F was selected as 11 and 82 wt%, respectively. Polypropylene glycol and epoxy silane (Hitachi chemical co., Ltd., Tokyo, Japan) were used as the diluent and coupling agent. The weight percent of polypropylene glycol and epoxy silane of the epoxy resin composition was 6 and 2 wt%, respectively.

2.2. Hardener Composition
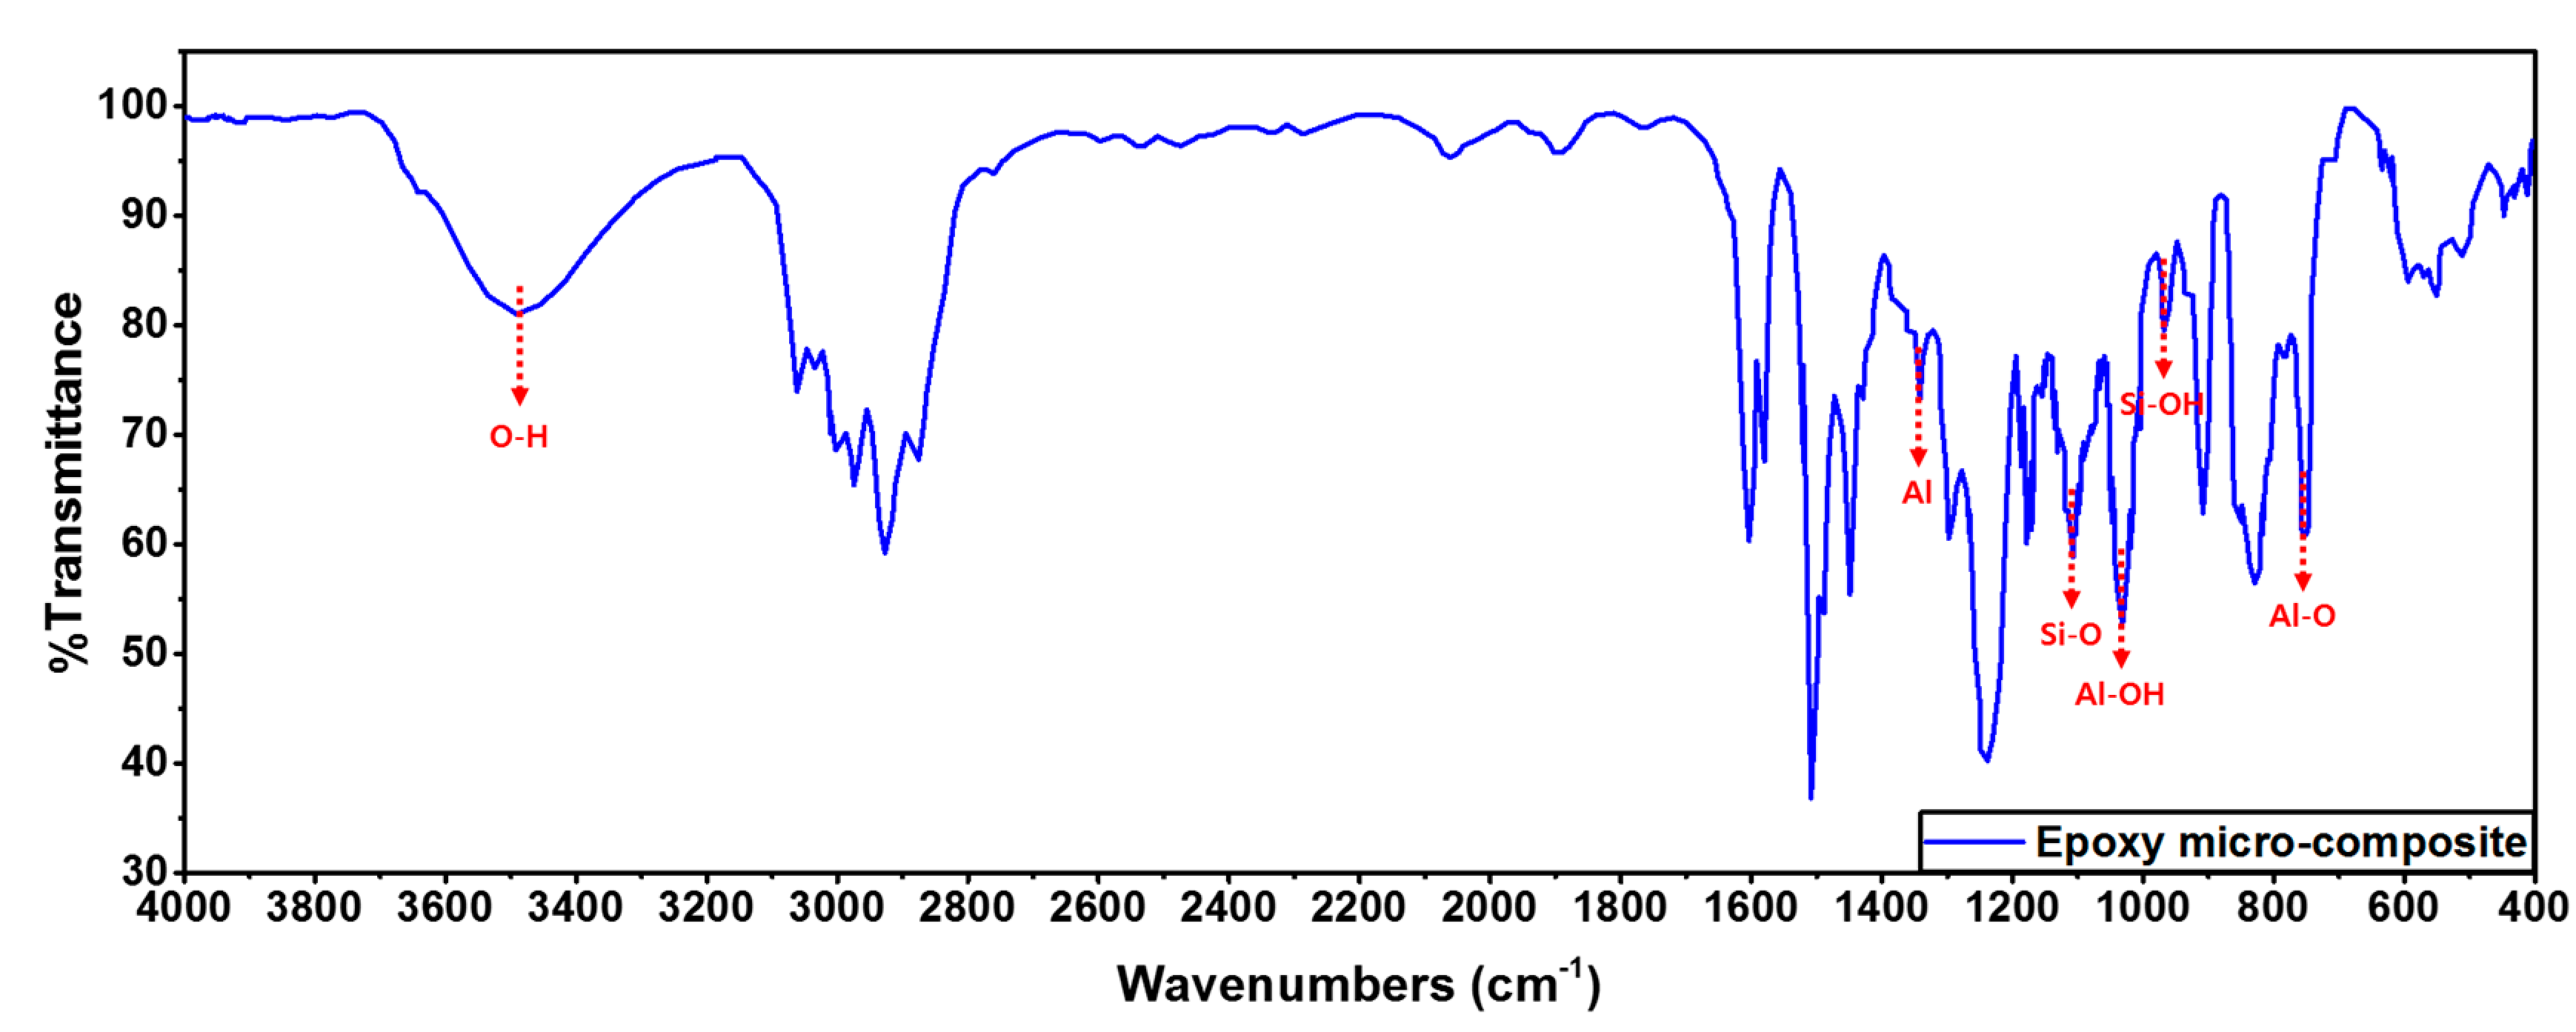
The hardener is composed of a hardener, additive and catalyst, which reacts with the epoxy resin composition to cure the epoxy from a two-dimensional linear structure to a three-dimensional network structure to determine the properties of the epoxy micro-composite. In this case, the content of the hardener composition is preferably 10 to 30 wt% based on 100 wt% of the total molding composition, such as an epoxy resin composition. Therefore, according to the proposal based on the manufacturing process guidelines of Kukdo Chemical Co., Ltd., an epoxy insulator manufacturer, methyltetrahydrophthalic anhydride (MeTHPA) with 78 wt%, tetrahydr ophthalic anhydride (THPA) (Kukdo Chemical Co., Ltd., Seoul, Korea) with 20 wt% and amine-based or imidazole-based (ShinEtus Co., Ltd., Tokyo, Japan) with 2 wt% were used as the hardener, additive and catalyst, respectively.

2.3. Micro-Fillers

As stated above, micro-fillers can improve physical and chemical properties such as mechanical strength, dimensional stability, thermal expansion coefficient, glass transition temperature and aging characteristics of the epoxy micro-composite. In addition, the gel time of the epoxy micro-composite can be controlled by changing the mixing ratio of the fillers. Therefore, since the electrical, chemical and physical properties of the epoxy micro-composite change depending on the mixing ratio and type of micro-filler, it is very important to determine the mixing ratio and type of micro-fillers according to the characteristics of the HV power device to be manufactured.
As outlined above, the inorganic micro-fillers used in this work are SiO2 (M10, Sibelco Asia, Nonsan, Korea) and Al2O3 (AS-C20, SHOWA DENKO, Tokyo, Japan) [21,22,23]. Al2O3 micro-filler, also referred to as aluminum oxide, has a thermal conductivity of 38 W/m·K, which is very high compared to the value for SiO2 of 3 W/m·K, so has an advantage over the low thermal conductivity of SiO2 [10]. However, as Al2O3 has a higher specific gravity than SiO2, it precipitates more readily in an epoxy resin and this can lead to greater density of particles at the lower sections of a molded component and variation in thermal performance through the component. As Al2O3 has a higher specific gravity than SiO2, for the same weight Al2O3 will have fewer particles and take up less volume than the equivalent in SiO2, i.e., it will affect the overall volume of the product. The Al2O3 micro-filler used in this work has an average particle diameter of 23 μm and contains impurities such as Fe2O3, SiO2 and Na2O, but the level of impurities should be lower than 3 wt% [21,22].
As stated in the previous paragraph, SiO2 micro-filler, also referred to as silicon oxide, has a larger number of particles than Al2O3 at the same weight due to their low specific gravity. SiO2 has a hydroxy group (-OH group) on the particle surface which gives rise to the possibility of hydrogen bonding developing into covalent bonding with the epoxy resin in the final component [12,24]. SiO2 micro-filler has an average particle diameter of 20 μm and contains impurities such as Fe2O3, Al2O3, TiO2, K2O and CaO, but impurities other than SiO2 should be lower than 1 wt% [23]. The SiO2 micro-filler used in this work has a prismatic shape with a surface area of over 350 m2/kg and a density of 2000–3000 kg/m3. When the micro-filler content is less than 60 wt%, the coefficient of linear expansion is too high which reduces the dimensional stability. When it exceeds 75 wt%, the viscosity is too high and it is not possible to mold a component successfully, so that it is not proper material for UHV power equipment. In the composite produced for this work, the total content of Al2O3 micro-filler and SiO2 micro-filler was 65.48 wt% based on 100 wt% of the total molding composition.
To allow analysis of changes in the gel time and dielectric strength characteristics of the epoxy composite according to the filler mix ratio of SiO2 and Al2O3, resin composites with five ratios of micro-filler were produced. The mix ratios of SiO2 to Al2O3 selected are shown in Table 1, i.e., 1:0, 3:1, 2:1, 1:1 and 0:1.

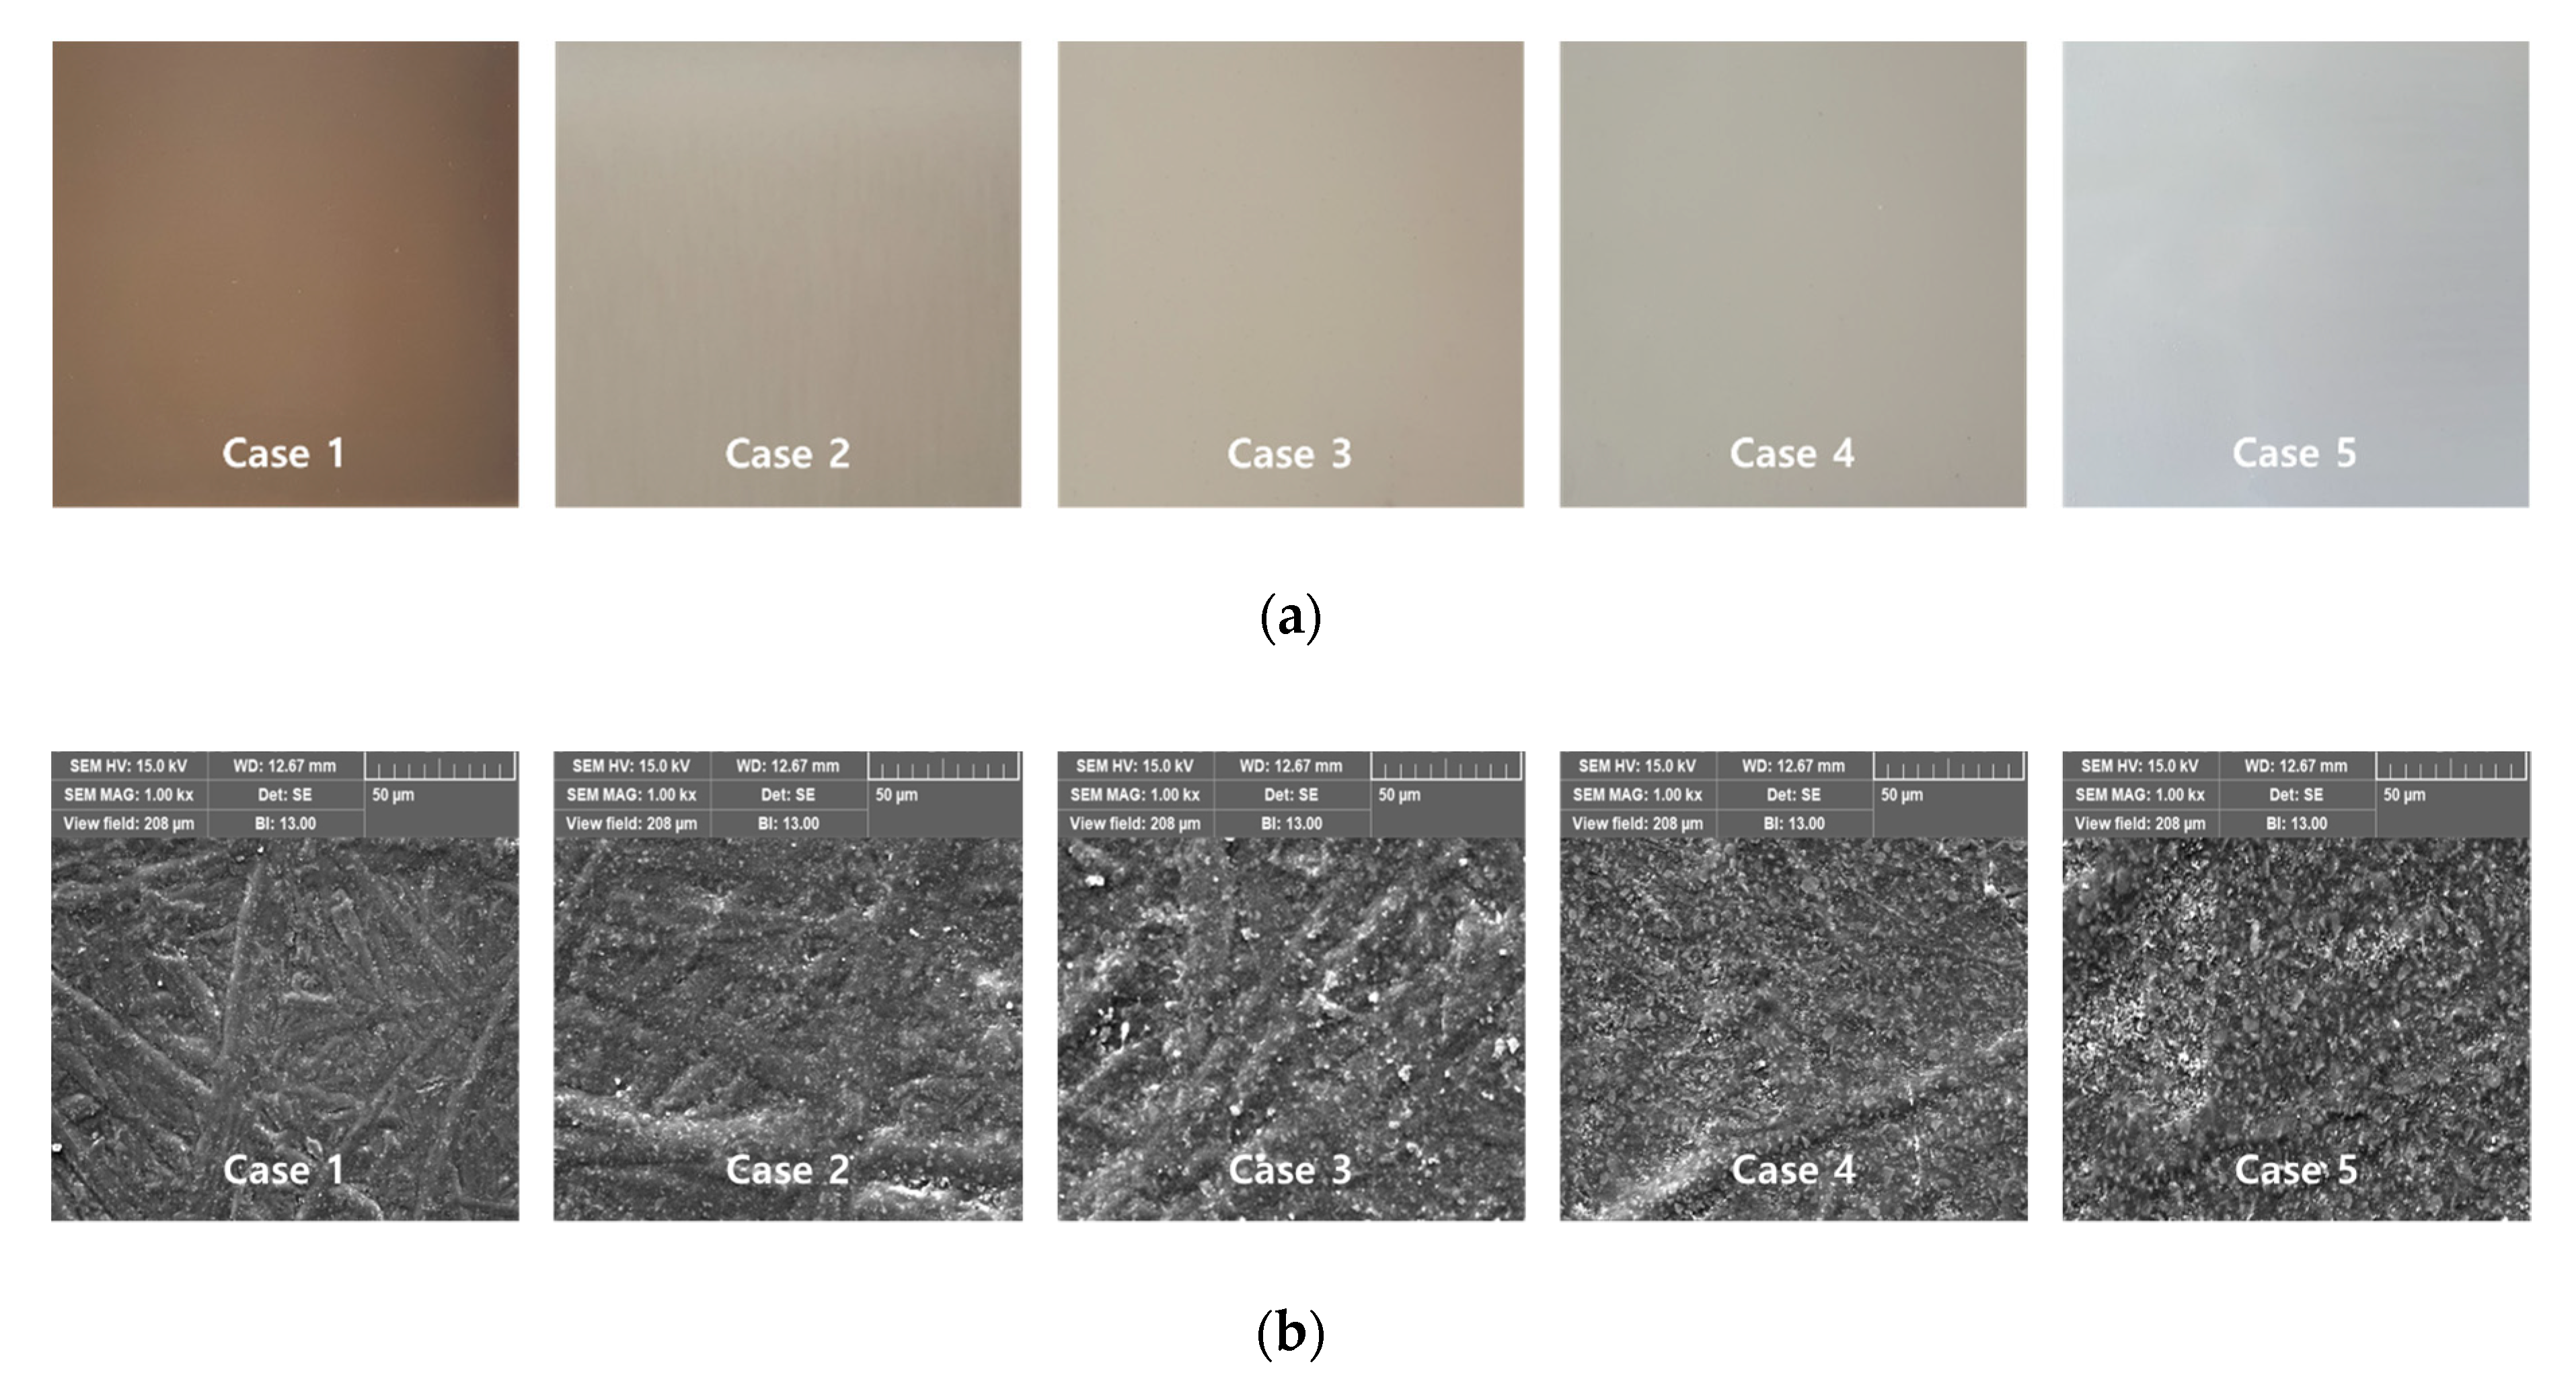
3. Fabrication of Epoxy Micro-Composite

Generating the composite material was a multistage process. Section 3.1 describes the production of the base epoxy resin and the combining of that with the appropriate filler, Section 3.2 describes the production of the hardener mix and Section 3.3 describes the production of the final composite. The entire process of Section 3 was performed based on the manufacturing process guideline of Kukdo Chemical Co., Ltd., a manufacturer of epoxy insulators, and all materials involved in the manufacture of epoxy composites are the same as described in Section 2. The detailed description of the procedure is given below.

3.1. Preparation of Epoxy Resin Composition and Combination with Micro-Filler

In order to fabricate the epoxy resin composition, bisphenol A epoxy resin, bisphenol F epoxy resin, a diluent and a coupling agent were added to a reaction vessel (volume: 0.3 m3). In the process used in this work, 11 wt% of bisphenol A epoxy resin, 82 wt% of bisphenol F epoxy resin, 6 wt% of the diluent and 2 wt% of coupling agent is selected. Therefore, 10 kg of bisphenol A epoxy resin, 75 kg of bisphenol F epoxy resin, 5 kg of diluent and 2 kg of coupling agent were added to the reaction vessel, and then the mixture was stirred maintaining the temperature over 353.15 K at atmospheric pressure for 2 h or more. The amount of resin produced was equivalent to 18.6 wt% based on 100 wt% by weight of the epoxy micro-composite. Then, 65.84 wt% of mixed micro-fillers, composed of SiO2 and Al2O3, was added to the reaction vessel containing the epoxy resin and stirred for 1 h or more in a normal temperature atmospheric pressure.

3.2. Preparation of Hardener Composition and Combination with Micro-Filler

To prepare the hardener composition, the hardener, additive and catalyst are combined. The selected hardener composition is MeTHPA hardener, 78 wt%, THPA additive, 20 wt%, and amine and imidazole catalysts, each 1 wt%. Therefore, 80 kg of MeTHPA hardener, 20 kg of THPA additive, 1 kg of amine catalyst and 1 kg of imidazole catalyst were used. Initially, MeTHPA hardener and THPA additive were added to the reaction vessel (volume: 0.3 m3), and then stirred at a temperature of 423.15 K for 3 h, then the temperature was lowered to 373.15 K and the amine and imidazole catalysts were added and stirred for 1 h. This produced an amount of hardener equivalent to 15.56 wt% based on 100 wt% by weight of the epoxy micro-composite. Then, 65.84 wt% of mixed micro-fillers, composed of SiO2 and Al2O3, was added to the reaction vessel, which already contained the hardener composition, and stirred for 1 h or more in a normal temperature atmospheric pressure.

3.3. Manufacturing Process of Epoxy Micro-Composite

To manufacture the epoxy micro-composite specimens, according to the mixing ratio of micro-fillers outlined in Table 1, firstly, the epoxy resin and hardener components, prepared in Section 3.1 and 3.2, respectively, were combined in the appropriate proportions, stirred and mixed at a temperature of 333.15 K. Thereafter, after removing the bubbles in the filled epoxy, through defoaming for 2 h at a pressure of 0.266 bar, the mixture was injected into a square-shaped mold made of copper (area: 100 × 100 mm, thickness: 2 mm). The epoxy composite injected into the mold was first cured for 18 h at a temperature of 353.15 K and, finally, the primary cured mixture was secondarily cured for 12 h at a temperature of 413.15 K to prepare the epoxy micro-composite.
To confirm the completion of polymerization of the epoxy micro-composite, a Fourier transform-infrared spectrometer (FT-IR, FTIR-4100 type A, JASCO, Tokyo, Japan) was used, and the measured results at a wavenumber range of 4000–400 cm−1 and a resolution of 4 cm−1 are shown in Figure 1.
As a result of the measurement, based on the wavenumber characteristics generated during the polymerization of the epoxy resin and hardener [25], the presence of an O-H bond at peak 3600 cm−1, an Al bond at peak 1390 cm−1, an Al-OH bond at peak 1035 cm−1, an Al-O bond at peak 750 cm−1, Si-O at peak 1090 cm−1, Si-OH at peak 950 cm−1 and a Si-O bond at peak 795 cm−1 was confirmed [26,27]. These results mean that the polymerization of the epoxy micro-composite prepared in Section 3 was completed.
The specimens manufactured according to the mixing ratios of SiO2 and Al2O3 micro-filler are shown in Figure 2a. A total of 275 specimens were prepared for dielectric breakdown, Tg measurement, relative permittivity and gel time measurement according to temperature, and as a result of measuring the area and thickness of each specimen, the error rate was less than 1%. The specimen was artificially cut in half to create a fracture surface, and the fracture surface of the specimens measured at 1000x magnification by scanning electron microscope (SEM, SU7000, HITACHI, Tokyo, Japan) is shown in Figure 2b. The composition of each specimen set, i.e., amount of epoxy resin, hardener and micro-filler fractions in the specimens, is shown in Table 1. Each square-shaped specimen has a thickness of 2 mm and an area of 100 × 100 mm.

4. Material Characteristic Evaluation of Epoxy Micro-composite

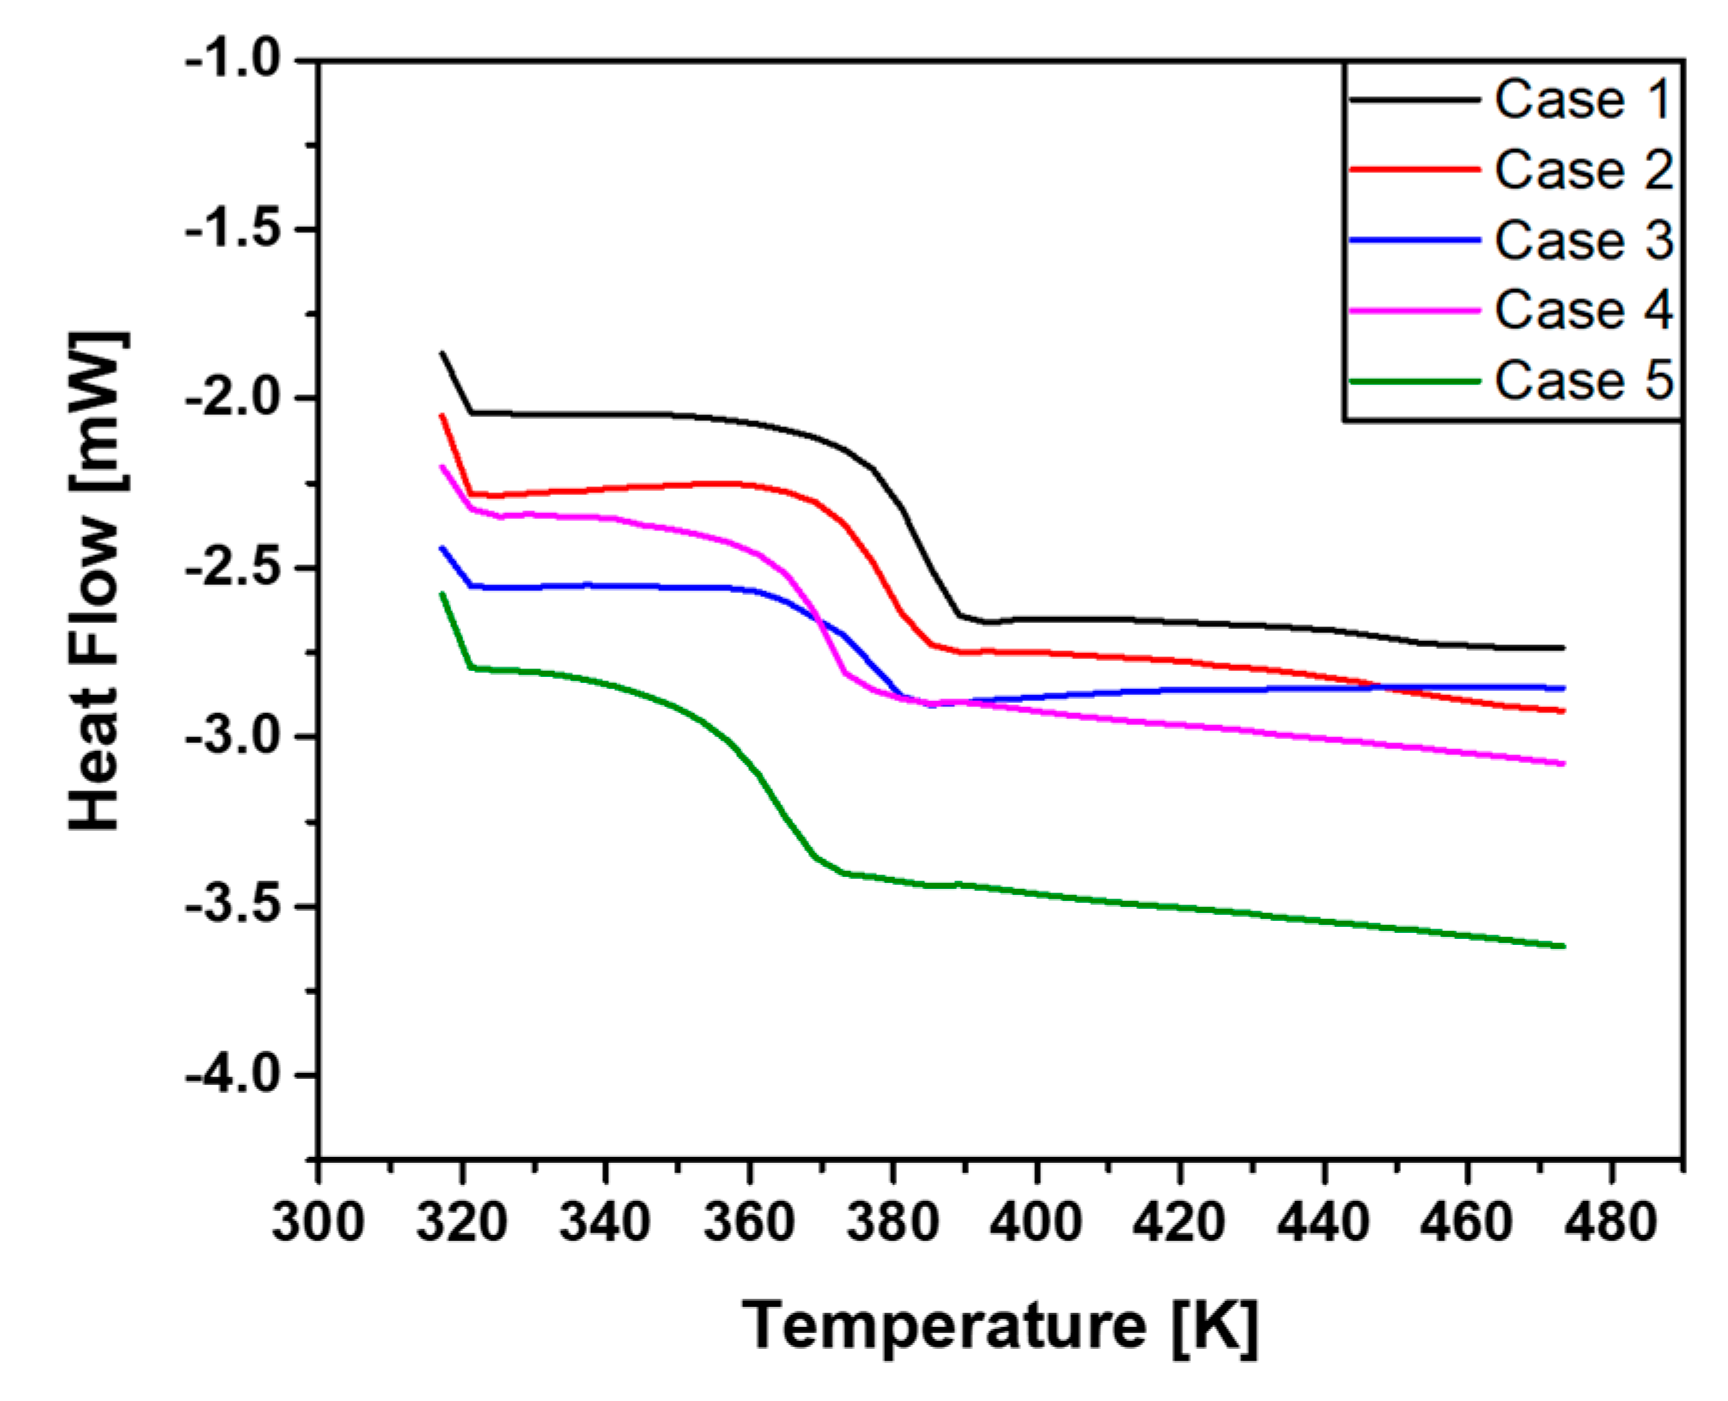
4.1. Measurement of Gel Time and Glass Transition Temperature

Since the gel time according to the temperature is related to the curing time of the epoxy composite, in order to consider the production cost and productivity of the UHV power equipment, it is required to measure the gel time according to the temperature. Therefore, in order to propose a technology to control productivity without compromising the high mechanical, thermal and dielectric properties of the epoxy composite, gel times were measured at 353.15, 393.15 and 413.15 K of temperature for each specimen.
Gel time was measured using a Gelnorm gel timer (Geltimer Gt-SP, Gel instrument AG, Thalwil, Switzerland), and the measurement method was as follows. First, the temperature for measuring the gel time was set. Then, 10 mg of a mixture (without the weight of the test tube) composed of epoxy resin composition, hardener composition and micro-filler was placed in a test tube, and stirred for 1 min. Finally, after the stopper and the stamper were assembled in a test tube, the time that the storage modulus and the loss modulus coincide was determined as the gel time. After the gel time, the epoxy composite changes from a liquid state to a solid state (three-dimensional network structure).
In order to ensure the consistency of the experimental results, the experiment was conducted 5 times according to each case, and the average values for these are summarized in Table 2. When the temperature was 353.15 K, the gel time of the case 5 specimen was the longest at 27 h 16 min, and when the temperature was 413.15 K, the gel time of the case 1 specimen was the shortest at 37 min.
Based on these results, the following conclusions were drawn. When the mixing ratio of SiO2 is increased, the cross-link reaction of the epoxy composite is accelerated due to the hydrogen bonds strengthened by the -OH group, and eventually the gel time is decreased. In addition, when the curing temperature is increased, the cross-link reaction of the epoxy resin, curing agent and additives is accelerated due to the increased temperature, so the gel time is shortened [12,24].
When the temperature of the UHV power equipment is heated to a temperature of Tg or more, the cross-link density of the solid-state epoxy composite in which the cross-link reaction is completed is weakened, and it changes into a rubbery state such as silicone rubber. Therefore, the electrical, mechanical, thermal and chemical properties of the epoxy micro-composite change, and eventually the dielectric insulation performance of the solid insulation is decreased. Therefore, in order to verify the applicability in UHV power equipment to the case 1 to case 5 specimens, Tg was measured for each specimen. Tg was measured using a differential scanning calorimeter (DSC, DSC 3-, Mettler Toledo, Columbus, USA), and the measurement method was as follows. First, 10 mg of the cut specimen piece was placed in a hermetic aluminum pan and sealed in a DSC cell. Then, the temperature at which a rapid change in heat capacity was observed while changing the temperature at a heating rate of 10 K/min from 317.15 to 473.15 K was selected as Tg. The results of the experiment are as shown in Figure 3 and Table 2, where the Tg of case 5 without SiO2 was the lowest at 353.21 K, and case 1 and case 2 with a large amount of SiO2 added were the highest at 372.75 K.
From the experimental results, the following conclusions were drawn. When the content of SiO2 is increased, hydrogen bonding by -OH groups present on the surface of the SiO2 molecule increases, and eventually the Tg is increased due to the increase in the cross-link density of the epoxy composite [28]. Further, When the gel time measurement temperature is increased, the cross-link reaction of the epoxy resin, hardener and filler is accelerated in the curing process of the epoxy composite, and finally the gel time is shortened.

4.2. Measurement of Relative Permittivity and Dielectric Loss Tangent

The permittivity is the degree to which charge can accumulate in the dielectric when an electric field is applied, and the relative permittivity is a relative ratio of the permittivity of other dielectrics based on the permittivity of the vacuum. The dielectric loss tangent is the dielectric dissipation factor or loss angle due to dielectric loss. At AC voltage, if the dielectric loss tangent of the solid insulator is large, electric power loss due to heat occurs. Further, if the difference between the relative permittivity of the solid insulator and the surrounding material is large, the dielectric strength decreases due to the concentrated electric field. Therefore, in order to provide basic dielectric properties when the epoxy composite is applied as an insulator for HV power equipment, the relative permittivity and dielectric loss tangent were measured for each specimen.
Relative permittivity and dielectric loss tangent were measured using a capacitance and dissipation/power factor test set (Haefely, Basel, Switzerland) and solid test cell (Haefely, Basel, Switzerland). A plate-shaped specimen with an area of 10 × 10 mm and a height of 2 mm was prepared in consideration of the leakage current and surface discharge. Moreover, a pressure of 1 bar was applied to the electrode and the specimen in order to remove air bubbles that may be generated at the interface between the electrode and the specimen during the bonding process of the specimen. The measurement method of relative permittivity and dielectric loss tangent according to the IEC62631-2-1 standard was carried out as follows [29]. First, the applied electric field was set to 1 kV/mm, and the capacitance and resistance of the specimen was measured using the capacitance and dissipation/power factor test set. The relative permittivity (r) is derived by applying the specimen capacitance (C), area (A), thickness (d) and permittivity of the vacuum (Ꜫo) to Equation (2) based on Equation (1).
C = Q V = ε A d = ε r ε o A d
ε r = C d ε o A
The dielectric loss tangent (tan δ) is obtained by applying the measurement voltage frequency (f), the measured sample capacitance (C) and resistance (R) to Equation (3).
tan δ = ω C R = 2 π f C R
The results obtained from the experiments are shown in Table 3.
The relative permittivity of case 5 was the highest at 5.236 and case 1 was the lowest at 4.024. The dielectric loss tangent of case 1 was the highest at 0.027 and case 5 was the lowest at 0.004.
As the content of SiO2 micro-filler decreases, covalent bonding by -OH groups present on the surface of the SiO2 molecule decreases, thereby reducing the interfacial bonding strength at the surface of the epoxy micro-composite [30,31,32]. Therefore, the relative permittivity increased and the dielectric loss tangent decreased as the mixing ratio of the SiO2 in the epoxy micro-composite decreased. These results can be used to design the shape of the insulating material in UHV equipment using the relative permittivity values by providing the characteristic value of the insulating material in AC electric field analysis. Further, the degree of electric power loss can also be predicted using the dielectric loss tangent value.

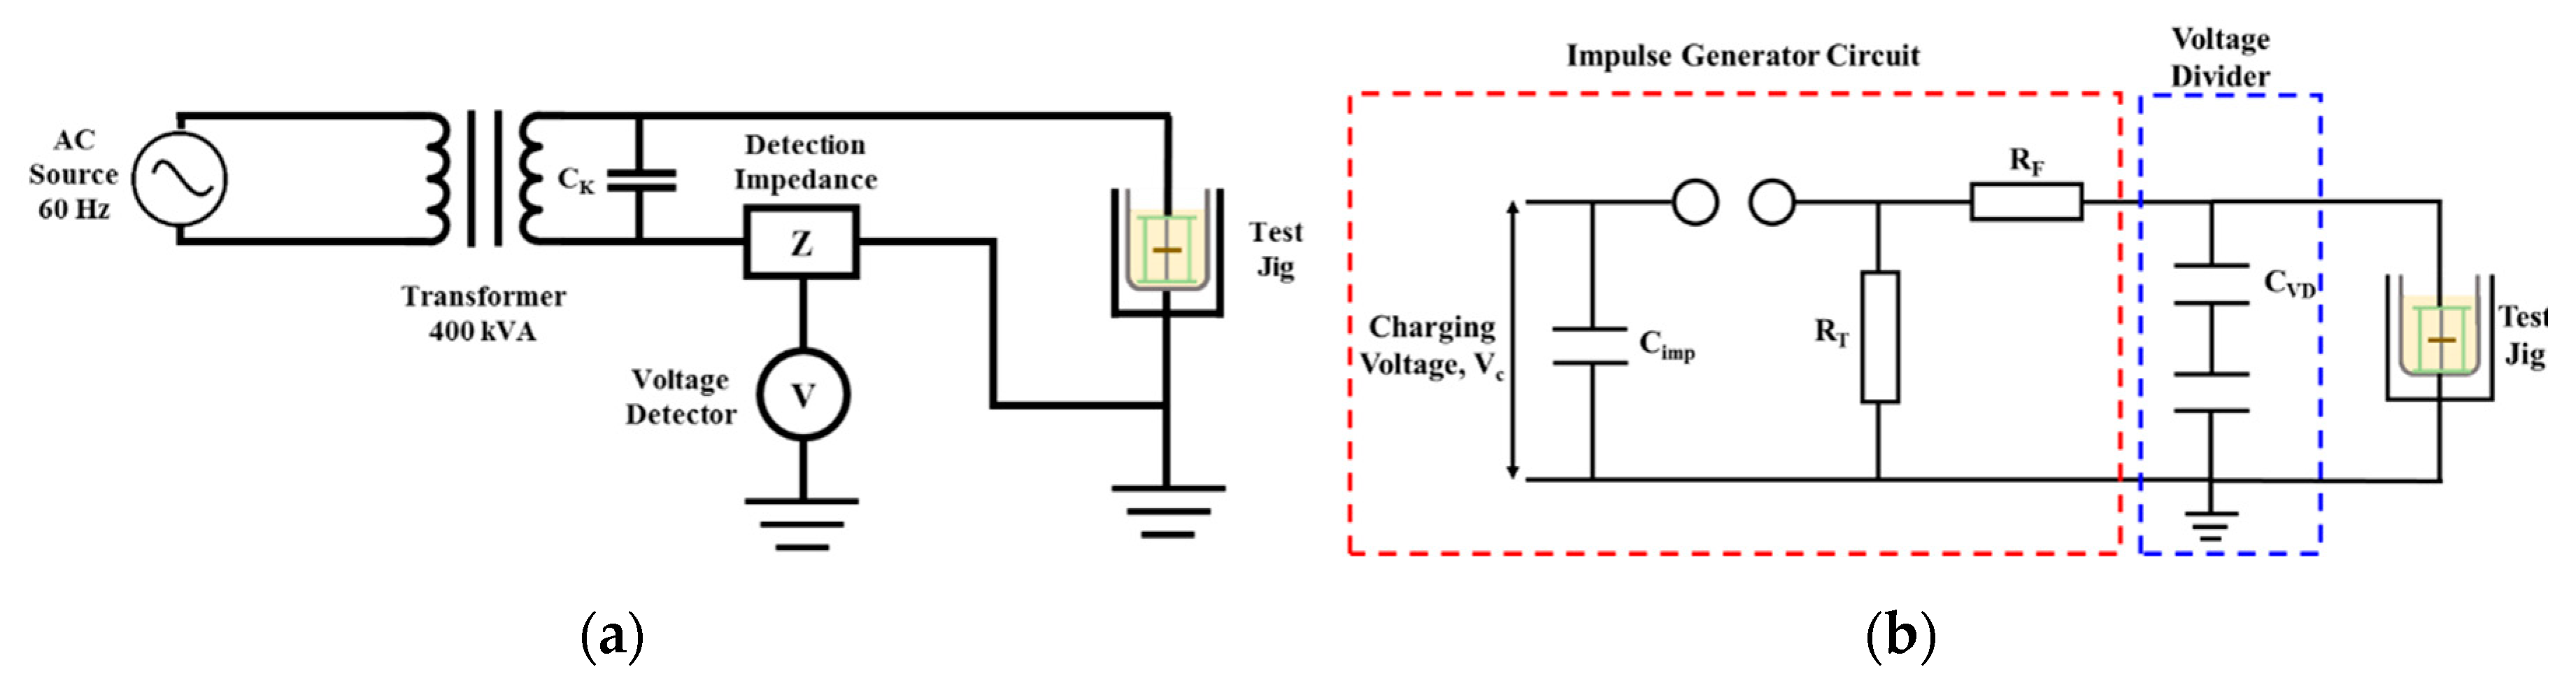
5. Evaluation of Dielectric Breakdown Characteristic

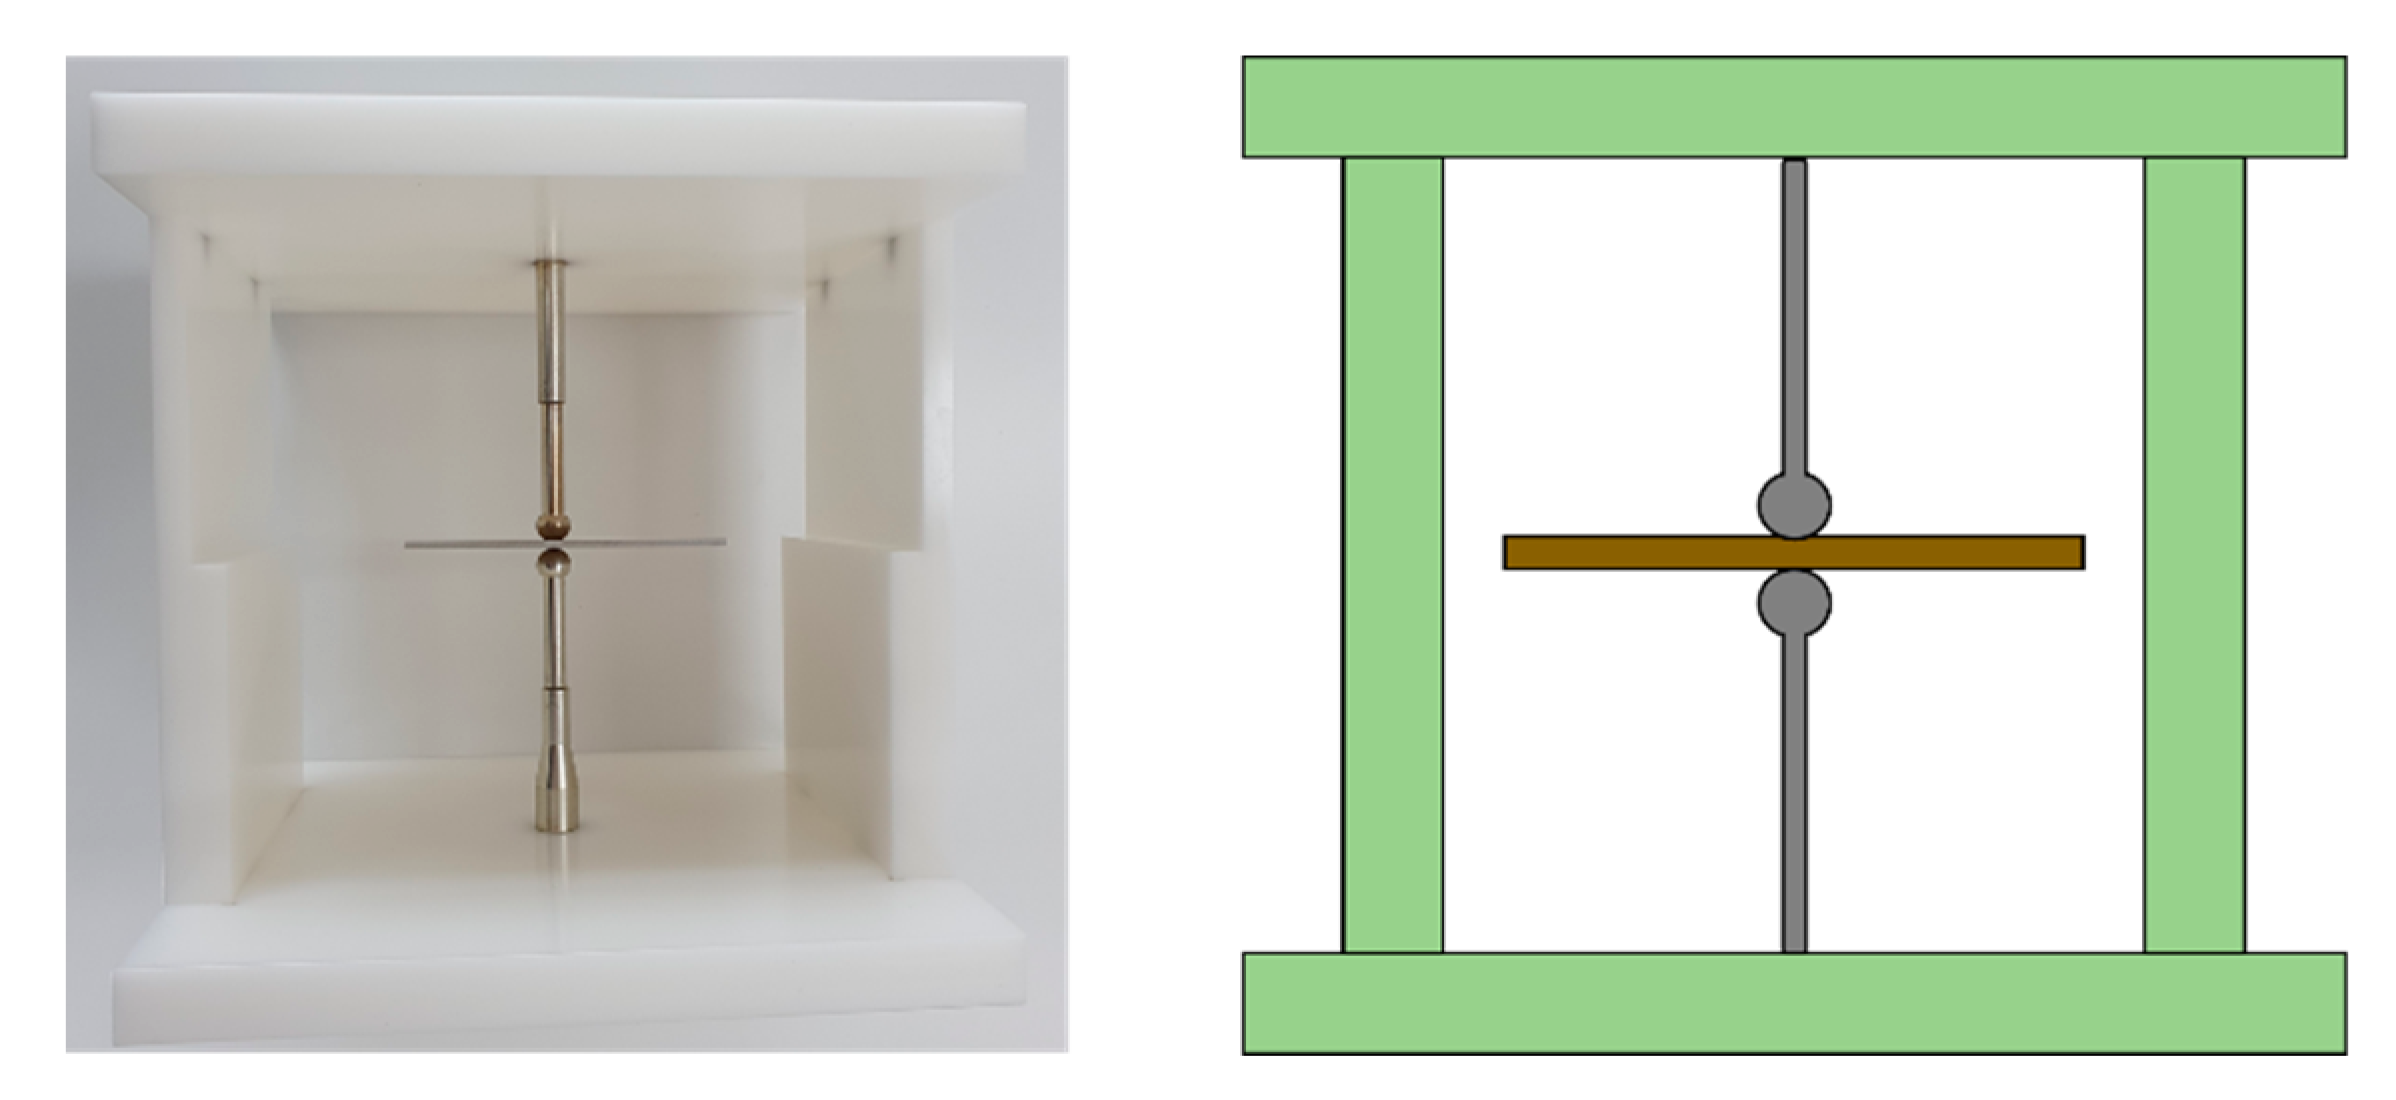
5.1. Dielectric Breakdown Test System

The block diagram of the circuit for AC dielectric breakdown tests is shown in Figure 4a. As shown, these tests were conducted using a 400 kV/60 Hz AC transformer connected to the test jig. The rate of voltage rise was selected as 1 kV/s, in accordance with the IEC60243-1 standard [33]. For each specimen, the dielectric breakdown tests were conducted five times and the breakdown voltage (BDV) was determined from the median of the test results. When a set of test results contained a value which deviated by more than 15% from the median, five additional tests were performed.
The block diagram of the test circuit for the lightning impulse (LI) dielectric breakdown test is shown in Figure 4b. The LI dielectric breakdown tests were conducted using an LI generator with ±1600 kV, a voltage divider and a test jig. According to the IEC 60060-1 standard [34], the LI voltage is defined as a wave front of 1.2 us ± 30% and a wave tail of 50 us ± 20%. Therefore, for the LI voltage used in the test, LI voltage with a wave front of 1.15 us and a wave tail of 48.2 us was used. In the LI dielectric breakdown tests, the first applied voltage was 70% of the expected dielectric breakdown voltage. The expected dielectric breakdown voltage is the voltage at which insulation breakdown occurs by increasing from 0 to 10 kV. If breakdown did not occur, the applied voltage was increased by 3 kV. This process was repeated until dielectric breakdown occurred. As with the AC breakdown test method, the tests were conducted five times and the BDV was determined from the median of the test results. When the test results deviated by more than 15% from the median, five additional tests were performed.
The structures of the electrode and test jig are shown in Figure 5. The test jig was made from polytetrafluoroethylene (PTFE), and the test jig was placed in a chamber filled with room-temperature mineral oil. The spherical electrodes with a diameter of 2 mm and adjustable rods were made from stainless steel, and the square-shaped specimen has a thickness of 2 mm and an area of 100 × 100 mm according to the IEC 60243-1 standard [33].

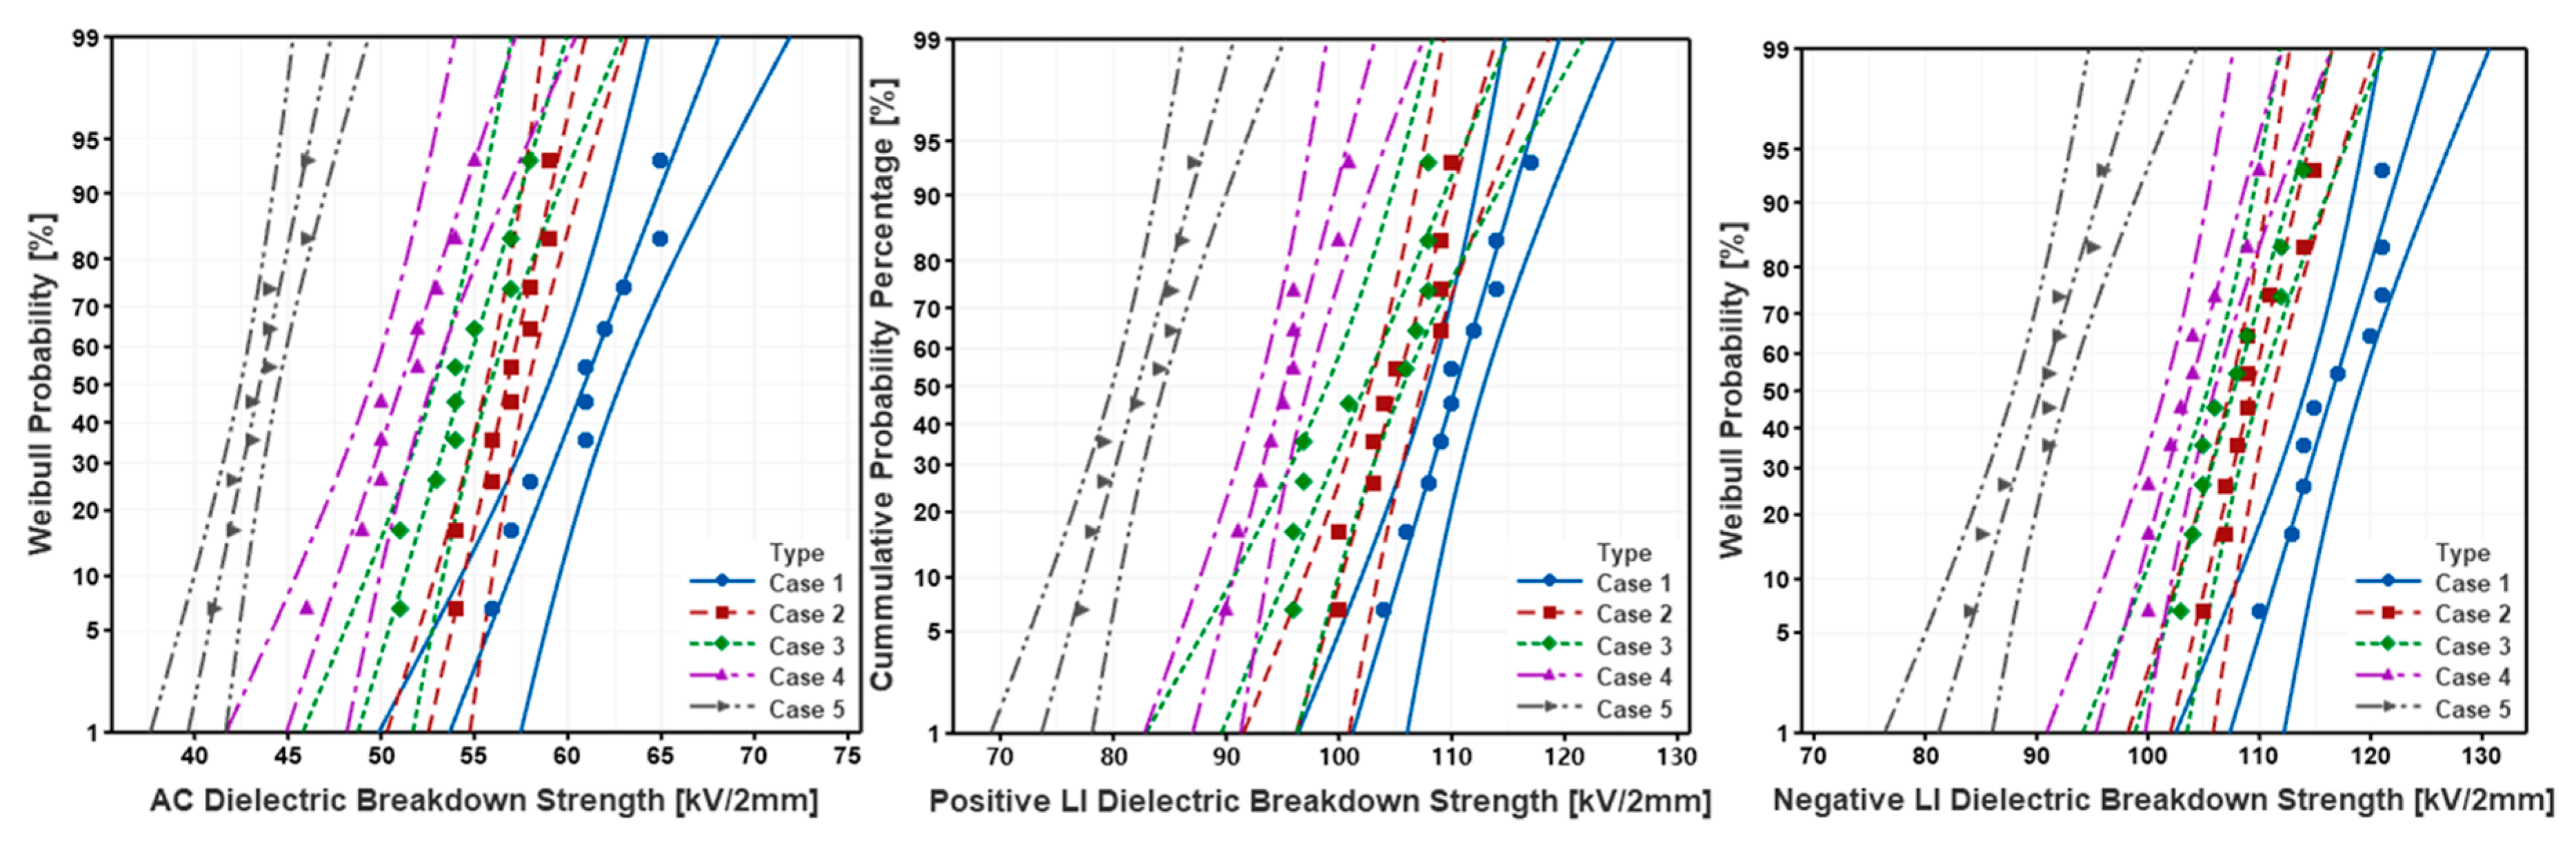
5.2. AC/LI Dielectric Breakdown Test Result

In order to analyze the dielectric insulation characteristic of the epoxy composite according to the mixing ratio of the SiO2 and Al2O3 micro-fillers, AC and LI dielectric breakdown tests were performed on the specimens with a thickness of 2 mm manufactured in Section 3. Further, the dielectric strength according to the type of applied voltage was analyzed using a Weibull plot. The Weibull plot of the AC/LI dielectric strength is shown in Figure 6, and the Weibull parameter of the AC/LI dielectric strength is summarized in Table 4. The scale parameter represents the electric field strength at a breakdown probability of 63.2%. The shape parameter is the slope of the Weibull plot and indicates the degree of variance in the data.
From the experimental results, it was noted that both the AC and LI dielectric strength decreased as the amount of SiO2 in the filler mix decreased. As the amount of SiO2 decreased from 100% (case 1) to 0% (case 5), the scale parameter of the AC dielectric strength decreased by 28.9% from 62.2 to 44.2 kV/2 mm, the scale parameter of the positive LI dielectric strength decreased by 25.2% from 112.2 to 83.9 kV/2 mm and the scale parameter of the negative LI dielectric strength decreased by 22.1% from 118.4 to 92.2 kV/2 mm. These results were analyzed in respect to the interfacial bonding and mixing ratio.
The analysis of the results from the viewpoint of interfacial bonding is as follows. In the case of epoxy resins and SiO2, since -OH groups are present in the molecular structure, hydrogen bonding occurs between the organic and inorganic materials, which enhances the interfacial bonding force. Therefore, as the SiO2 content in the additive decreased, it is considered that the dielectric strength was reduced due to the decrease in the interfacial bonding strength of the epoxy micro-composite. This is in agreement with the findings in [12,15,24,28].
The analysis of the results from the viewpoint of the mixing ratio is as follows. As the specific gravity of micro-SiO2 and micro-Al2O3 is 2.65 and 3.94, respectively, for a given weight of filler material, the number of molecules of micro-SiO2 is larger than that of micro-Al2O3. Given the larger number of particles of filler in SiO2, and the resulting larger surface area, the cross-link density between particles and epoxy will be increased. The increased cross-link density suppresses the movement of electrons inside the dielectric, which increases the dielectric breakdown strength [35,36]. Therefore, as the percentage of SiO2 in the additive increased, the dielectric strength was improved.

6. Discussion

The gel time and dielectric strength of epoxy micro-composites affects the economics, productivity and reliability of UHV power equipment. This paper investigated the impact of the mix ratio of two standard micro-fillers on epoxy molding for UHV power equipment, as this can affect the gel time, relative permittivity, dielectric loss tangent, glass transition temperature and dielectric breakdown. Tests were conducted to ascertain the effect of changing the mix ratio of SiO2 and Al2O3.
All experimental results are summarized in Table 5, and based on analysis of these, the following comments can be made:
  • As the mixing ratio of SiO2 increased, the gel time decreased due to strengthening of the hydrogen bonding by -OH groups present in the SiO2 and epoxy resin molecular structure.
  • As the curing temperature increased, the increased temperature accelerated the mixing reaction of the epoxy resin, curing agent and additives, which reduces the gel time.
  • As the mixing ratio of SiO2 increased, the Tg was increased, but the change of Tg was insignificant when the mixing ratio of SiO2 and Al2O3 exceeded 3:1.
  • As the mixing ratio of SiO2 increased, hydrogen bonding by -OH groups present on the surface of SiO2 was decreased, and eventually the bonding force at the interface of the epoxy composite was strengthened. Therefore, the relative permittivity was decreased and the dielectric loss tangent was increased.
  • As the mixing ratio of SiO2 increased, the number of molecules of micro-SiO2 relative to the same weight was increased by the difference in specific gravity, and eventually the AC/+LI/-LI dielectric strength was improved due to the increased cross-link density.
  • As the mixing ratio of SiO2 increased, hydrogen bonding by -OH groups present in the molecular structure of SiO2 and epoxy resin was strengthened, and eventually the AC/+LI/-LI dielectric strength was improved due to the strengthened interfacial bonding strength.

7. Conclusions

In terms of economics, productivity and reliability of UHV power equipment, case 1 with the mixing ratio of SiO2 100% is the most suitable as a mixing ratio of micro-fillers for manufacturing epoxy micro-composite insulators because it has excellent properties of gel time, Tg and dielectric strength. However, if Al2O3 is not added in the manufacturing process of the epoxy composite insulator, the thermal properties of the epoxy composite deteriorate due to the low thermal conductivity. In addition, due to the short gel time, curing proceeds before the epoxy composite is injected into the mold, and eventually cavity formation and molding failure may occur in the epoxy composite.
The operating temperature, conditions of operation, size, required dielectric strength, etc., of the UHV power equipment to be manufactured by each manufacturer are different. Therefore, for the economics, productivity and reliability of UHV power equipment, it is recommended to apply gel time, Tg and dielectric strength data according to the mixing ratio of SiO2 and Al2O3 obtained in this paper to the manufacturing process of the solid insulator. However, depending on the operating temperature of the UHV power equipment to be manufactured, the thermal effect of the filler must be additionally considered.

Author Contributions

Conceptualization, D.-H.O.; investigation, D.-H.O.; methodology, J.-H.S.; resources, Y.-H.J.; formal analysis, H.-S.K.; visualization, D.-W.K.; writing—original draft preparation, D.-H.O.; supervision, B.-W.L.; writing—review and editing, B.-W.L. All authors have read and agreed to the published version of the manuscript.

Funding

This work was supported by the Korea Institute of Energy Technology Evaluation and Planning(KETEP) and the Ministry of Trade, Industry & Energy(MOTIE) of the Republic of Korea (No. 20171210000100) and in part by the Korea Electric Power Corporation under Grant R16XA01.

Conflicts of Interest

The authors declare no conflict of interest.

References

  1. The Intergovernmental Panel on Climate Change (IPCC). Greenhouse Gas Protocol Report. Available online: https://www.ghgprotocol.org/sites/default/files/ghgp/Global-Warming-Potential-Values%20%28Feb%2016%202016%29_1.pdf (accessed on 14 September 2020).
  2. Kevork, M.; Ozcan, K.; Orhan, E.; Ergun, C. AC Breakdown Strength of N2, SF6 and a Mixture of N2+SF6 containing a Small Amount of SF6. IEEE Inter. Symp. Electr. Insul. 1996, 763–765. [Google Scholar]
  3. Malik, N.H.; Qureshi, A.H. A Review of Electrical Breakdown in Mixtures of SF6 and Other Gases. IEEE Trans. Electr. Insul. 1979, E1-14, 1–13. [Google Scholar] [CrossRef]
  4. Sato, J.; Sakaguchi, O.; Kubota, N.; Makishima, S.; Kinoshita, S.; Shioiri, T.; Yoshida, T.; Miyagawa, M.; Homma, M.; Kaneko, E. New technology for medium voltage solid insulated switchgear. In Proceedings of the IEEE Asia Pacific Transmission and Distribution Conference and Exhibition, Yokohama, Japan, 6–10 October 2002; pp. 1791–1796. [Google Scholar]
  5. Shimizu, T.; Kinoshita, S.; Makishima, S.; Sato, J.; Sakaguchi, O. Material and simulation technology for solid insulated switchgear. In Proceedings of the IEEE 7th International Conference Properties and Application of Dielectric Materials (ICPADM), Nagoya, Japan, 1–5 June 2003; pp. 1194–1197. [Google Scholar]
  6. Ellis, B. Chemistry and Technology of Epoxy Resins; Springer: Cham, Switzerland, 1993; p. 29. [Google Scholar]
  7. Wetzel, B.; Haupert, F.; Zhang, M.Q. Epoxy nanocomposites with high mechanical and tribological performance. Compos. Sci. Technol. 2003, 63, 2055–2067. [Google Scholar] [CrossRef]
  8. Huang, X.; Jiang, P.; Tanaka, T. A review of dielectric polymer composites with high thermal conductivity. IEEE Electr. Insul. Maga. 2011, 27, 8–16. [Google Scholar] [CrossRef]
  9. Fessler, H.; Perla, M. Precision casting of epoxy-resin photoelastic models. J. Strain Anal. Eng. Design. 1973. [Google Scholar] [CrossRef]
  10. John, A.M. Interfacial effects in composites. Pure Appl. Chem. 1985, 57, 1667–1678. [Google Scholar]
  11. Imai, T.; Sawa, F.; Nakano, T.; Ozaki, T.; Shimizu, T. Effects of Nano- and Micro-filler Mixture on Electrical Insulation Properties of Epoxy Based Composites. IEEE Trans. Dielectr. Electr. Insul. 2006, 13, 319–326. [Google Scholar] [CrossRef]
  12. Park, J.J.; Lee, C.H.; Lee, J.Y.; Kim, H.D. Preparation of Epoxy/Micro-and NanoComposites by Electric Field Dispersion Process and Its Mechanical and Electrical Properties. IEEE Trans. Dielectr. Electr. Insul. 2011, 18, 667–674. [Google Scholar] [CrossRef]
  13. Tanaka, T.; Montanari, G.C.; Mülhaupt, R. Polymer nanocomposites as dielectrics and electrical insulation-perspectives for processing technologies, material characterization and future applications. IEEE Trans. Dielectr. Electr. Insul. 2004, 11, 763–784. [Google Scholar] [CrossRef]
  14. Lewis, T.J. Nanometric dielectrics. IEEE Trans. Dielectr. Electr. Insul. 1994, 1, 812–825. [Google Scholar] [CrossRef]
  15. Kochetov, R.; Andritsch, T.; Morshuis, P.H.F.; Smit, J.J. Thermal and Electrical Behaviour of Epoxy-based Microcomposites Filled with Al2O3 and SiO2 Particles. In IEEE International Symposium on Electrical Insulation, Proceedings of the 2010 IEEE International Symposium on Electrical Insulation (ISEI 2010), San Diego, CA, USA, 6–9 June 2010; IEEE: New York, NY, USA, 2010; pp. 1–5. [Google Scholar]
  16. Andritsch, T.; Kochetov, R.; Gebrekiros, Y.T.; Morshuis, P.H.F.; Smit, J.J. Short term DC breakdown strength in epoxy based BN nano- and microcomposites. In Proceedings of the IEEE International Conference on Solid Dielectrics (ICSD), Potsdam, Germany, 4–9 July 2010; pp. 179–182. [Google Scholar]
  17. Castellon, J.; Nguyen, H.N.; Agnel, S.; Toureille, A.; Frechette, M.; Savoie, S.; Krivda, A.; Schmidt, L.E. Electrical Properties Analysis of Micro and Nano Composite Epoxy Resin Materials. IEEE Trans. Dielectr. Electr. Insul. 2011, 18, 651–658. [Google Scholar] [CrossRef]
  18. Danikas, M.G.; Tanaka, T. Nanocomposites-a review of electrical treeing and breakdown. IEEE Electr. Insul. Maga. 2009, 25, 19–24. [Google Scholar] [CrossRef]
  19. Zhou, W.; Wang, C.; Ai, T.; Wu, K.; Zhao, F.; Gu, H. A novel fiber-reinforced polyethylene composite with added silicon nitride particles for enhanced thermal conductivity. Compos. Part A Appl. Sci. Manuf. 2019, 40, 830–836. [Google Scholar] [CrossRef]
  20. Amin, M. Methods for Preparation of Nano-Composites for Outdoor Insulation Applications. Rev. Adv. Mater. Sci. 2013, 173–184. [Google Scholar]
  21. SIBELCO. Coating. Available online: https://coatings.sibelcotools.com/mineral/quartz/ (accessed on 16 September 2020).
  22. EUROQUARZ. Available online: https://www.euroquarz.de/uploads/media/TDS_Silverbond_1.pdf (accessed on 16 September 2020).
  23. SHOWA DENKO. Available online: https://showadenko.us/wp-content/uploads/2019/06/Showa-Denko-Thermal-Filler-Brochure-2019.pdf (accessed on 16 September 2020).
  24. Park, J.J.; Lee, C.H. The Properties of DSC and DMA for Epoxy Nano-and-Micro Mixture Composites. Trans. Electr. Electron. Mater. 2011, 11, 69–72. [Google Scholar]
  25. WIKIPEDIA-InInfrared Spectroscopy Correlation Table. Available online: https://en.wikipedia.org/wiki/Infrared_spectroscopy_correlation_table (accessed on 20 September 2020).
  26. Klapiszewski, L.; Jamrozik, A.; Strzemiecka, B.; Koltsov, I.; Borek, B.; Matykiewicz, D.; Voelkel, A.; Jesionowski, T. Characteristics of Multifunctional, Eco-Friendly Lignin-Al2O3 Hybrid Fillers and Their Influence on the Properties of Composites for Abrasive Tools. Molecules 2017, 22, 1920. [Google Scholar] [CrossRef] [PubMed] [Green Version]
  27. Beganskienė, A.; Sirutkaitis, V.; Kurtinaitienė, M.; Juškėnas, R.; Kareiva, A. FTIR, TEM and NMR Iinvestigations of Stöber Silica Nanopartic. Mater. Sci. 2004, 10. [Google Scholar]
  28. Teo, J.K.J.; Teo, K.C.; Pan, B.; Xiao, Y.; Lu, X. Epoxy/polyhedral oligomeric silsesquioxane (POSS) hybrid networks cured with an anhydride: Cure kinetics and thermal properties. Polymer 2007, 48, 5671–5680. [Google Scholar]
  29. IEC. IEC 62631-2-1: Dielectric and Resistive Properties of Solid Insulating Materials-Part 2-1: Relative Permittivity and Dissipation Factor-Technical Frequencies (0.1 Hz-10 MHz)-AC Methods; IEC: Geneva, Switzerland, 2018. [Google Scholar]
  30. Iyer, G.; Gorur, R.S.; Richert, R.; Krivda, A.; Schmidt, L.E. Dielectric properties of epoxy based nanocomposites for high voltage insulation. IEEE Trans. Dielectr. Electr. Insul. 2011, 18, 659–666. [Google Scholar] [CrossRef]
  31. Guo, J.; Chen, Y.; Jia, Z.; Tanaka, T.; Wu, J.; Cheng, Y.H. Study on Electrical Properties of Micro-nano Structured Epoxy Composites. In Proceedings of the 2014 International Symposium on Electrical Insulating Materials, Niigata, Japan, 1–5 June 2014; pp. 441–444. [Google Scholar]
  32. Klampar, M.; Spohner, M.; Skarvada, P.; Dallaeva, D.; Kobrtck, J.; Liedermann, K. Dielectric properties of epoxy resins with oxide nanofillers and their accelerated ageing. In Proceedings of the IEEE Electrical Insulation Conference (EIC), Ottawa, ON, Canada, 2–5 June 2013; pp. 286–290. [Google Scholar]
  33. IEC. IEC 60243-1: Electric Strength of Insulating Materials-Test Methods-Part 1: Tests at Power Frequencies; IEC: Geneva, Switzerland, 2013. [Google Scholar]
  34. IEC. IEC 60060-1: High-Voltage Test Techniques-Part 1: General Definitions and Test Requirements; IEC: Geneva, Switzerland, 2010. [Google Scholar]
  35. Ovsik, M.; Fiala, T.; Manas, M.; Dockal, A. Ultra-Nano Indentation Properties of Crosslinked PBT. In Proceedings of the MATEC Web of Conferences; 2010. Available online: https://www.matec-conferences.org/articles/matecconf/pdf/2018/69/matecconf_cscc2018_02038.pdf (accessed on 16 September 2020).
  36. Hussein, M.A.; Albeladi, H.K.; AlRomaizan, A.N. Role of Cross-Linking Process on the Performance of PMMA. Int. J. Biosens. Bioelectron. 2017, 3, 279–284. [Google Scholar] [CrossRef]
Figure 1. Fourier transform-infrared (FT-IR) spectra of epoxy micro-composite.
Energies 13 05165 g001
Figure 2. The specimens according to the mixing ratios of SiO2 and Al2O3: (a) the surface of specimens according to the mixing ratios of SiO2 and Al2O3; (b) the fracture surface of specimens measured at 1000x magnification by SEM.
Energies 13 05165 g002
Figure 3. The DSC of the epoxy micro-composite.
Energies 13 05165 g003
Figure 4. The block diagram of the test circuit for the dielectric breakdown test: (a) AC dielectric breakdown test circuit; (b) lightning impulse (LI) dielectric breakdown test circuit.
Energies 13 05165 g004
Figure 5. The structure of the test jig and electrodes.
Energies 13 05165 g005
Figure 6. Weibull plot of the AC/LI dielectric strength.
Energies 13 05165 g006
Table 1. The contents of each specimen set and mixing ratios of SiO2 and Al2O3.
ContentsCase 1Case 2Case 3Case 4Case 5
Epoxy resin composition18.6 wt%18.6 wt%18.6 wt%18.6 wt%18.6 wt%
Hardener composition15.56 wt%15.56 wt%15.56 wt%15.56 wt%15.56 wt%
SiO265.84 wt%49.38 wt%43.89 wt%32.92 wt%-
Al2O3-16.46 wt% 21.95 wt%32.92 wt%65.84 wt%
Mixing ratio100:03:12:11:10:100
Table 2. The gel time and glass transition temperature (Tg) of the specimens.
Case 1Case 2Case 3Case 4Case 5
353.15 K gel time13 h 53 min15 h 46 min17 h 23 min17 h 30 min27 h 16 min
393.15 K gel time1 h 48 min2 h 42 min2 h 59 min3 h 25 min4 h 27 min
413.15 K gel time37 min1 h 1 min1 h 8 min1 h 25 min1 h 52 min
Tg372.75 K372.56 K367.75 K364.58 K353.21 K
Table 3. The relative permittivity and dielectric loss tangent.
Case 1Case 2Case 3Case 4Case 5
Relative permittivity4.0244.2524.3764.6175.236
Dielectric loss tangent0.0270.0180.0160.0140.004
Table 4. Weibull parameter of the AC/LI dielectric strength.
Applied VoltageScale Parameter (kV/2 mm); Shape Parameter
Case 1Case 2Case 3Case 4Case 5
AC62.2; 24.157.6; 30.455.5; 26.452.2; 23.744.2; 29.1
Positive LI112.2; 31.7106.9; 33.8104.8; 24.096.8; 29.883.9; 28.2
Negative LI118.4; 36.5110.9; 35.7109.6; 31.1105.5; 30.192.2; 28.6
Table 5. The characteristics of epoxy micro-composite according to the mixing ratio of SiO2 and Al2O3.
Case 1Case 2Case 3Case 4Case 5
Epoxy resin composition [wt%]18.618.618.618.618.6
Hardener composition [wt%]15.5615.5615.5615.5615.56
SiO2 [wt%]65.8449.3843.8932.92-
Al2O3 [wt%]-16.4621.9532.9265.84
Mixing ratios100:03:12:11:10:100
353.15 K gel time13 h 53 min15 h 46 min17 h 33 min17 h 30 min27 h 16 min
393.15 K gel time1 h 48 min2 h 42 min2 h 59 min3 h 25 min4 h 27 min
413.12 K gel time37 min1 h 1 min1 h 8 min1 h 25 min1 h 52 min
DSC Tg [K]372.75372.56367.75364.58353.21
Relative permittivity4.0244.2524.3764.6175.236
Dielectric loss tangent0.0270.0180.0160.0140.004
AC dielectric strength
(scale parameter) [kV/2 mm]
62.257.655.552.244.2
Positive LI dielectric strength
(scale parameter) [kV/2 mm]
112.2106.9104.896.883.9
Negative LI dielectric strength
(scale parameter) [kV/2 mm]
118.4110.9109.6105.592.2

