Article

Methodology for Predictive Assessment of Failures in Power Station Electric Bays Using the Load Current Frequency Spectrum

by
Fábio Vinicius Vieira Bezerra
1,2,*,
Gervásio Protásio Santos Cavalcante
2,
Fabrício Jose Brito Barros
2,
Maria Emília Lima Tostes
2 and
Ubiratan Holanda Bezerra
2
1
ELETROBRÁS ELETRONORTE—Electric Generation and Transmission Utility of North of Brazil, Brasilia 68270000, Brazil
2
Electrical Engineering Post Graduation Course, Federal University of Para, Belém 66075-110, Brazil
*
Author to whom correspondence should be addressed.
Energies 2020, 13(19), 5123; https://doi.org/10.3390/en13195123
Submission received: 23 August 2020 / Revised: 19 September 2020 / Accepted: 29 September 2020 / Published: 1 October 2020
(This article belongs to the Section F: Electrical Engineering)

Abstract

:
This paper presents a novel analysis methodology to detect degradation in electrical contacts, with the main goal of implanting a predictive maintenance procedure for sectionalizing switches, circuit breakers, and current transformers in bays of electric transmission and distribution substations. The main feature of the proposed methodology is that it will produce a predictive failure indication for the system under operation, based on the spectral analysis of the load current that is flowing through the bay’s components, using a defined relationship similar to the signal-to-noise ratio (SNR) used in data communication. A highlight of using the proposed methodology is that it is not necessary to make new investments in measurement devices, as the already-existing oscillography measurement infrastructure is enough. By implementing the diagnostic system proposed here, electrical utilities will have a modern tool for monitoring their electrical installations, supporting the implementation of new predictive maintenance functions typical of the current electrical smart grid scenario. Here, we present the preliminary results obtained by the application of the proposed technique using real data acquired from a 230 kV electrical substation, which indicate the effectiveness of the proposed diagnostic procedure.

1. Introduction

In order to remain competitive in the current global energy market scenario, electric power generation, transmission, and distribution utilities are required to operate their systems more efficiently, safely, and reliably, with minimum equipment unavailability, in order to minimize the penalties imposed by the legislation and, at the same time, maintain a good quality of energy supply to all consumers. This scenario has increasingly stimulated the practice of predictive maintenance in electrical utilities in order to extend the time of equipment in operation, shutting them down only when there is an indication of imminent failure signaled by the real-time operation supervision and control system.
With this focus, great research efforts have been observed for the development of predictive systems for fault diagnosis, thus avoiding unnecessary disconnections of systems in operation, making the electric energy business more attractive and competitive [1,2,3].
Particularly in electrical power systems, predictive maintenance practices have been developed for many years, highlighting techniques such as oil analysis in power transformers; vibration analysis in machines and transformers [4,5,6,7,8]; the use of thermo vision techniques for the detection of hot spots in electric installations and equipment in general [9,10,11]; and the use of IEDs (Intelligent Electronic Devices), among other things, which generate a significant volume of data that are analyzed in a predictive way by intelligent diagnostic systems to generate real-time information that allows one to diagnose possible imminent failures in an electrical system [12].
Despite the advances achieved with current predictive diagnosis systems, many new developments need to be carried out for several other important pieces of equipment in electrical systems that are not yet covered by the practices of predictive maintenance already in use.
For example, in the structure of electrical power systems, substations play an important and essential role in the process of transmitting/distributing energy to electric loads, and the failure of any of their components will result in energy supply interruption, with consequent financial losses for the operators of these systems.
In these substations, sectionalizing switches and circuit breakers are the main switching elements of transmission/distribution lines arriving/leaving substations, and the periodic maintenance of these elements is essential to ensure the reliability of the electrical system as a whole. In these elements, the main source of failure is the electric contacts, which degrade with continued operation, reaching critical conditions from which failures are highly probable events [13].
The value of the static contact resistance (SCR) or contact temperature of these components can be used as indicators for the early detection of incipient failures [14,15]. Values of resistance and/or temperature above a defined critical threshold may indicate an alert condition, representing a high probability of failure, and it is necessary, in this condition, to carry out some equipment maintenance procedures.
It is usual practice in electric utilities to use thermo vision cameras as a procedure for detecting hot spots in the contacts of sectionalizing switches and other contacts in the bay, because they are apparent and accessible with the use of this technology. For circuit breakers, however, this practice is not possible, because the contacts are internal to the structure, not being directly accessible to thermo vision. Thus, a way to evaluate failure indication in a circuit breaker under operation would be to measure its static contact resistance, because as this resistance increases it represents a more critical operation condition in a failure event.
According to the current practice of electrical utilities, the measurement of a circuit breaker’s contact resistance is made when the maintenance team isolates the circuit breaker at a time of preventive or corrective maintenance. There is also no available monitoring system to monitor the degradation evolution of contact resistance with the system in operation—that is, in real time. A monitoring system with this feature could feed an intelligent diagnostic system capable of detecting hazardous circuit breaker operation conditions. The point is that the direct measurement of a circuit breaker’s contact resistance, with the electrical system in operation, still does not present itself as a viable technological solution.
In this case, it would be desirable to have methodologies that allow estimating the circuit breaker’s contact degradation indirectly via a correlation analysis. According to [16], the possible effects of electric current flowing through electric contacts can be of an electromechanical, electric, or thermal nature. Among the effects of electrical nature are partial discharges (sparking), which appear as higher frequency distortions in the electrical current flowing through the contacts [16]. Thus, an indirect way to estimate the contact degradation would be through an analysis of the frequency spectrum of the load current flowing through the contacts.
For the electrical system in operation, the load current that flows through the circuit breaker’s contact is the same that flows through the sectionalizing switches and current transformers that, together with the circuit breakers, are located in the substation’s bays. Thus, the analysis of load current, at first, can give a failure indication for the bay as a whole, and the circuit breaker’s contact condition should be indirectly inferred by a thermo vision inspection of the bay’s apparent contacts. That is, if the load current frequency spectrum analysis has indicated a critical condition for the substation bay, and for that condition the thermo vision inspection revealed that the apparent contact temperatures are within permissible limits, then the failure indication corresponds to the circuit breaker itself or even the current transformer. This is the proposed predictive procedure to be presented in this paper, which constitutes a novel approach to a problem not yet found in the technical literature.

2. Related Works

In the current literature, technical papers focusing on monitoring non-apparent electric contacts, as is the case of circuit breakers, without disconnecting the respective equipment for in loco inspection are not found.
Most referenced papers have cited laboratory tests concerning the analysis of circuit breakers’ contacts’ dynamic response—that is, the contact dynamic resistance during the process of electric arc disruption, when the contacts are opened under load, forming the electric arc [17,18,19,20]. All these works aim at developing models to represent circuit breakers’ dynamic resistance time behavior to obtain an indication of contact degradation due to the continued equipment operation.
Another research focus found in the literature is the analysis of circuit breakers’ contacts’ frequency response, which also may indicate the contacts’ degradation by analyzing the frequency response of the load current flowing through the contacts. According to [17], circuit breakers’ contacts’ frequency response tests have presented a characteristic resonance frequency in the range of MHz, which was related to the circuit breakers’ contacts’ degradation stage. This procedure can be performed without dismounting the circuit breaker, but it has to be out of service.
According to laboratory tests performed by [21], emulating fault conditions with an electric arc in resistive, resistive-inductive, and nonlinear loads has resulted in increased magnitudes for the load current frequency spectrum as compared to the steady-state condition. This evidence is an indication that load current spectral analysis may be a good discriminator to detect electric contacts’ degradation in the real-time operation of electric systems. This condition will be used as a basic principle for developing the proposed methodology in this article.

3. Proposed Methodology

3.1. Background for Establishing the Proposed Methodology

The predictive diagnosis system to evaluate the electric contact degradation status is based on the spectral analysis of the load current flowing through the bay where the circuit breaker is located, as illustrated in Figure 1. According to Figure 1, in normal operation the load current, after flowing through the sectionalizing switches SW 1, SW 3, and SW 4 and circuit breaker CB, is measured by the current transformer (CT) and stored in the oscillography database for a posteriori analysis.
It is a well-known phenomenon in electrical systems that the temperature rise in electrical contacts is associated with their degradation—that is, the more degraded the contact is, the higher its temperature. This is the principle used by thermo vision inspections in order to detect the degradation status of electrical contacts.
On the other hand, the increase in the electric contact’s temperature means a corresponding increase in the energy loss through the joule effect, which reflects that more partial discharges occur in the degraded contacts than would occur in perfect contacts. This phenomenon is expected to occur in a typical frequency range and must be present in the frequency spectrum of the electric current flowing through these contacts.
Thus, it is expected that, by the load current spectral analysis, it will be possible to infer the degradation condition of electrical contacts. More degraded electrical contacts should have frequency spectra different from those representing good contacts. Thus, by comparing the two spectrum profiles the contact degradation status can be inferred.
Fourier transform [22,23], as shown in Equation (1), will be used to obtain the load current frequency spectrum.
F n = k = 0 N 1 f ( k ) · e j 2 π N n · k    n = 0 , , ( N 1 ) ,
where:
  • N—number of samples per period (sampling rate);
  • f(k)—magnitude of each sample;
  • Fn—complex values (magnitude and phase angle) of the n sinusoids obtained by Fourier Discrete Transform (FDT).
The frequency spectrum resulting from the application of (1) will be divided into two regions of interest for analysis. The first one goes up to a Fc cutting frequency, which divides the load current spectrum into a low-frequency region (f ≤ Fc) and a high-frequency one (f > Fc).
Region f ≤ Fc encompasses the harmonic frequencies typical of the equivalent nonlinear load [24,25] that is connected to the bay transformer. Nonlinear loads typical of today’s electrical systems [26] generate more significant harmonic distortions up to the 25th harmonic order or a little more, which in 60 Hz systems would correspond to a range of up to 1.5 or even 2 kHz.
Above this cutting frequency are the supraharmonics, which are signals with a frequency from 2 to 150 kHz. [27]. The supraharmonics range is where it is expected to find frequencies that represent the phenomenon of electrical contact degradation. This means that one needs to define a metric to express the degree of relative degradation of contacts. In the technical literature of the data communication area, there is the signal–noise relationship which expresses in decibels the loss of information due to the presence of noise, and this is extensively used to evaluate communication systems’ performances.
Making an analogy with the signal–noise relationship [22] used in telecommunications, here a similar relationship is proposed—that is, the CDI (Contact Degradation Indicator), which is expressed in dB according to Equation (2):
CDI d B = 20   l o g 10 ( 1 n   k = 1 n S k 2 1 n k = 1 n R k 2 ) ,
where:
  • Sk—frequency spectra magnitudes obtained from the Fourier Discrete Transform (1) for the low-frequency region (f ≤ Fc) using a low-pass filter;
  • Rk—frequency spectra magnitudes obtained from the Fourier Discrete Transform (1) for the high-frequency region (f > Fc) using a high-pass filter.
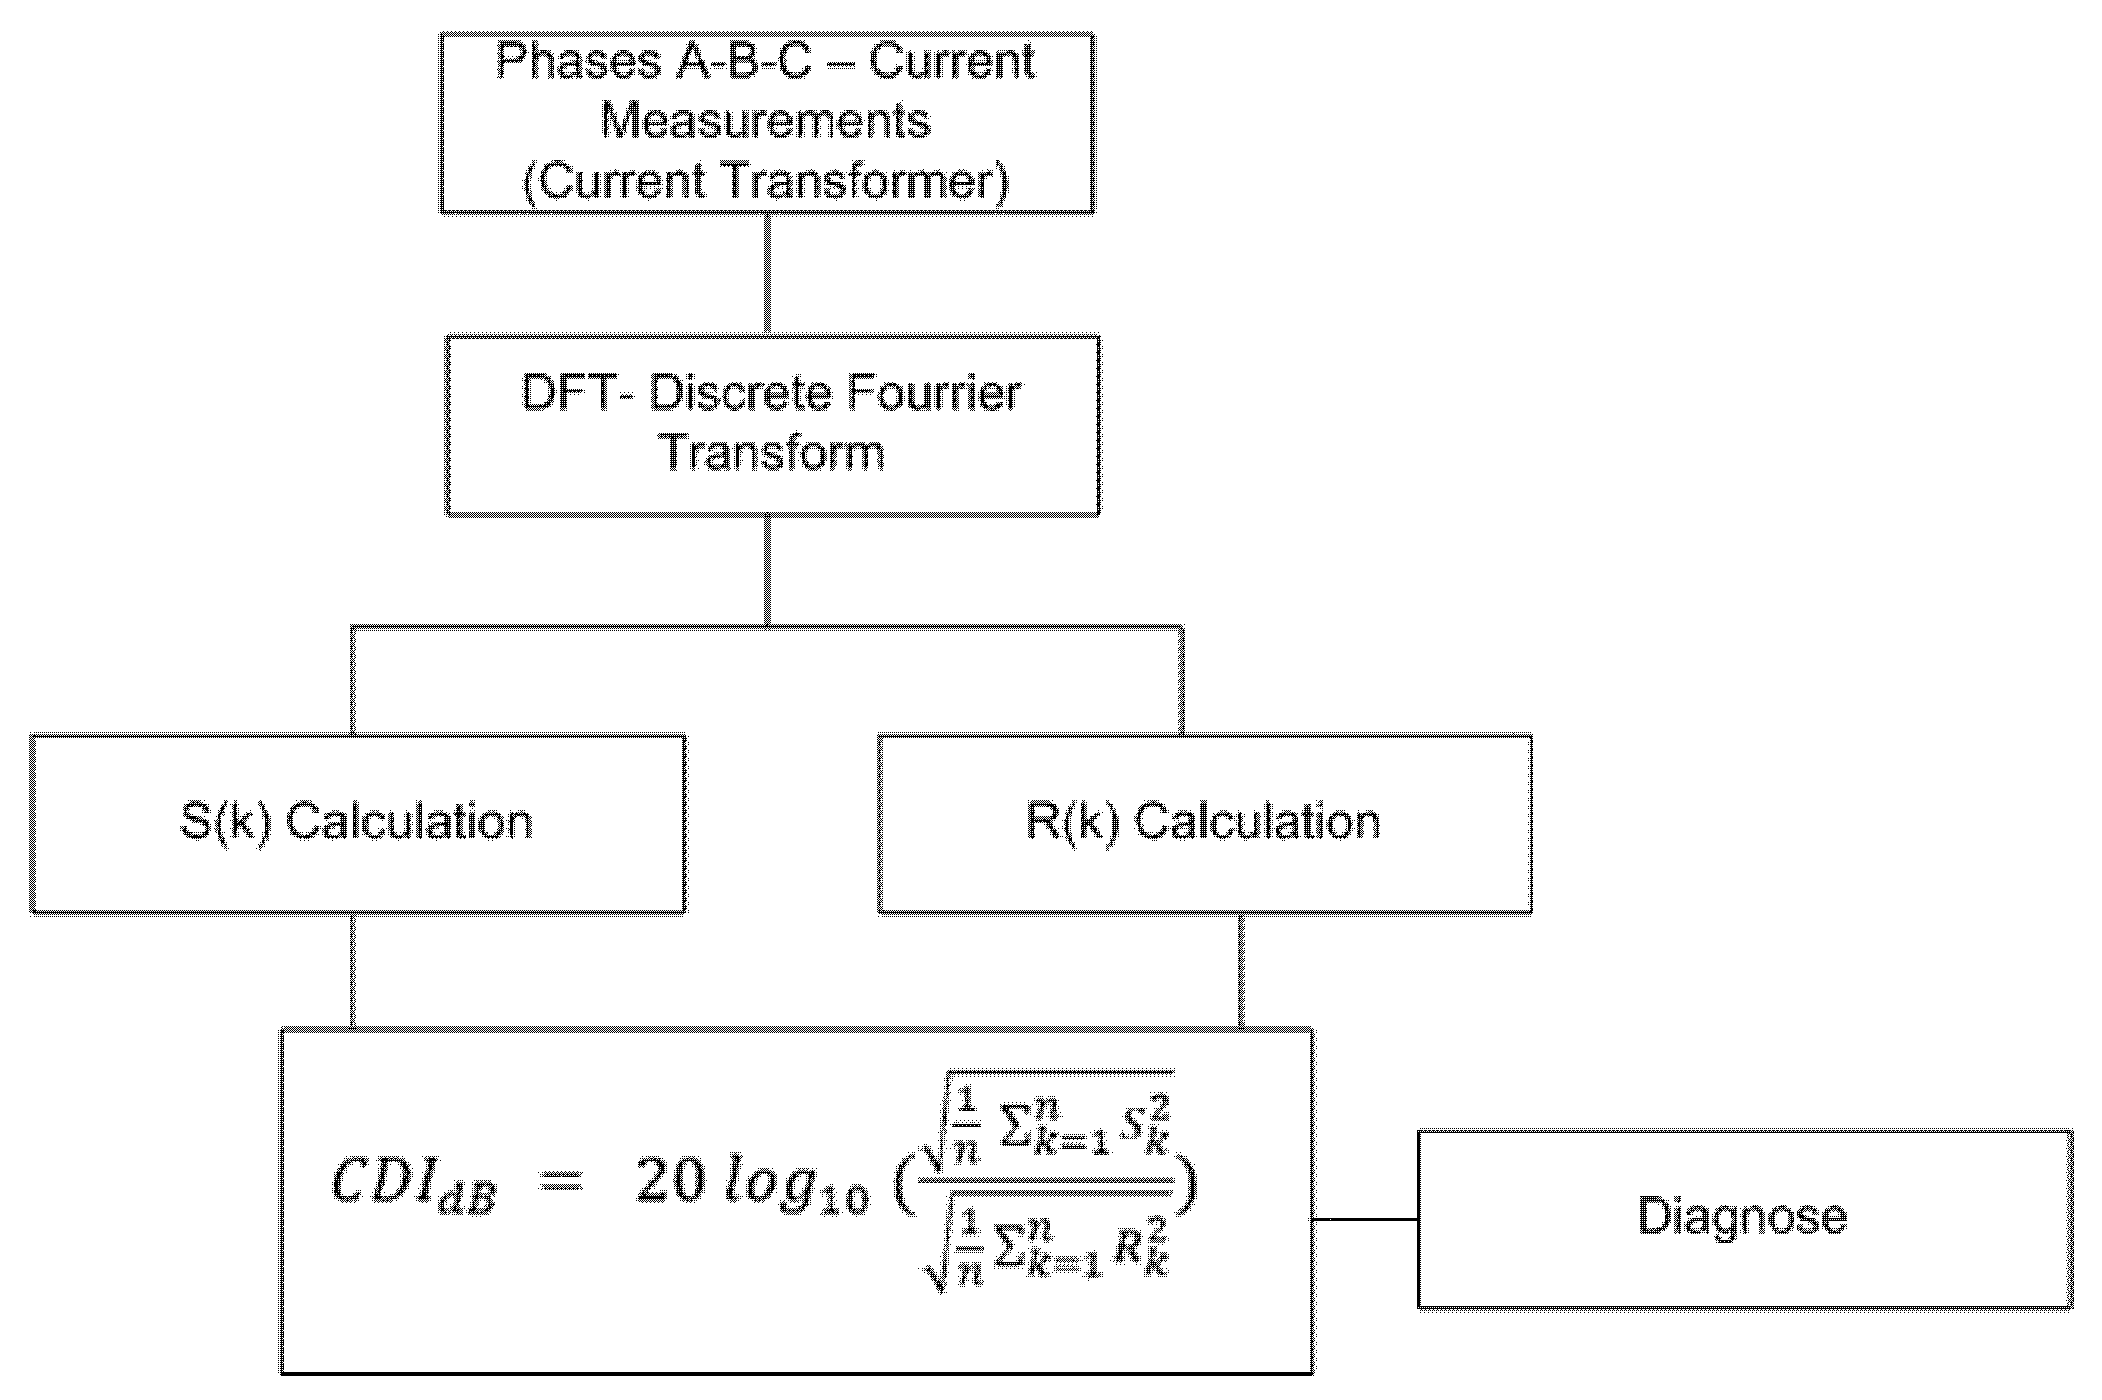
The overall methodology procedure is presented in Figure 2.
According to the flowchart presented in Figure 2, the bay’s current measurements in phases A-B-C are acquired by the current transformer and stored in the oscillography database. Then, Fourier Discrete Transform is applied to obtain signals S(k) and R(k) and the corresponding CDI for the operating condition under analysis. The calculated values for CDI can be used to feed an intelligent inference system—for example, using Artificial Neural Networks, Fuzzy Logic, and others—to generate a diagnosis of the bay’s failure condition. This article presents a simplified diagnosis, based on the failure thresholds obtained from typical data of a real 230 kV substation operation.

3.2. Laboratory Tests for Validating the Proposed Methodology

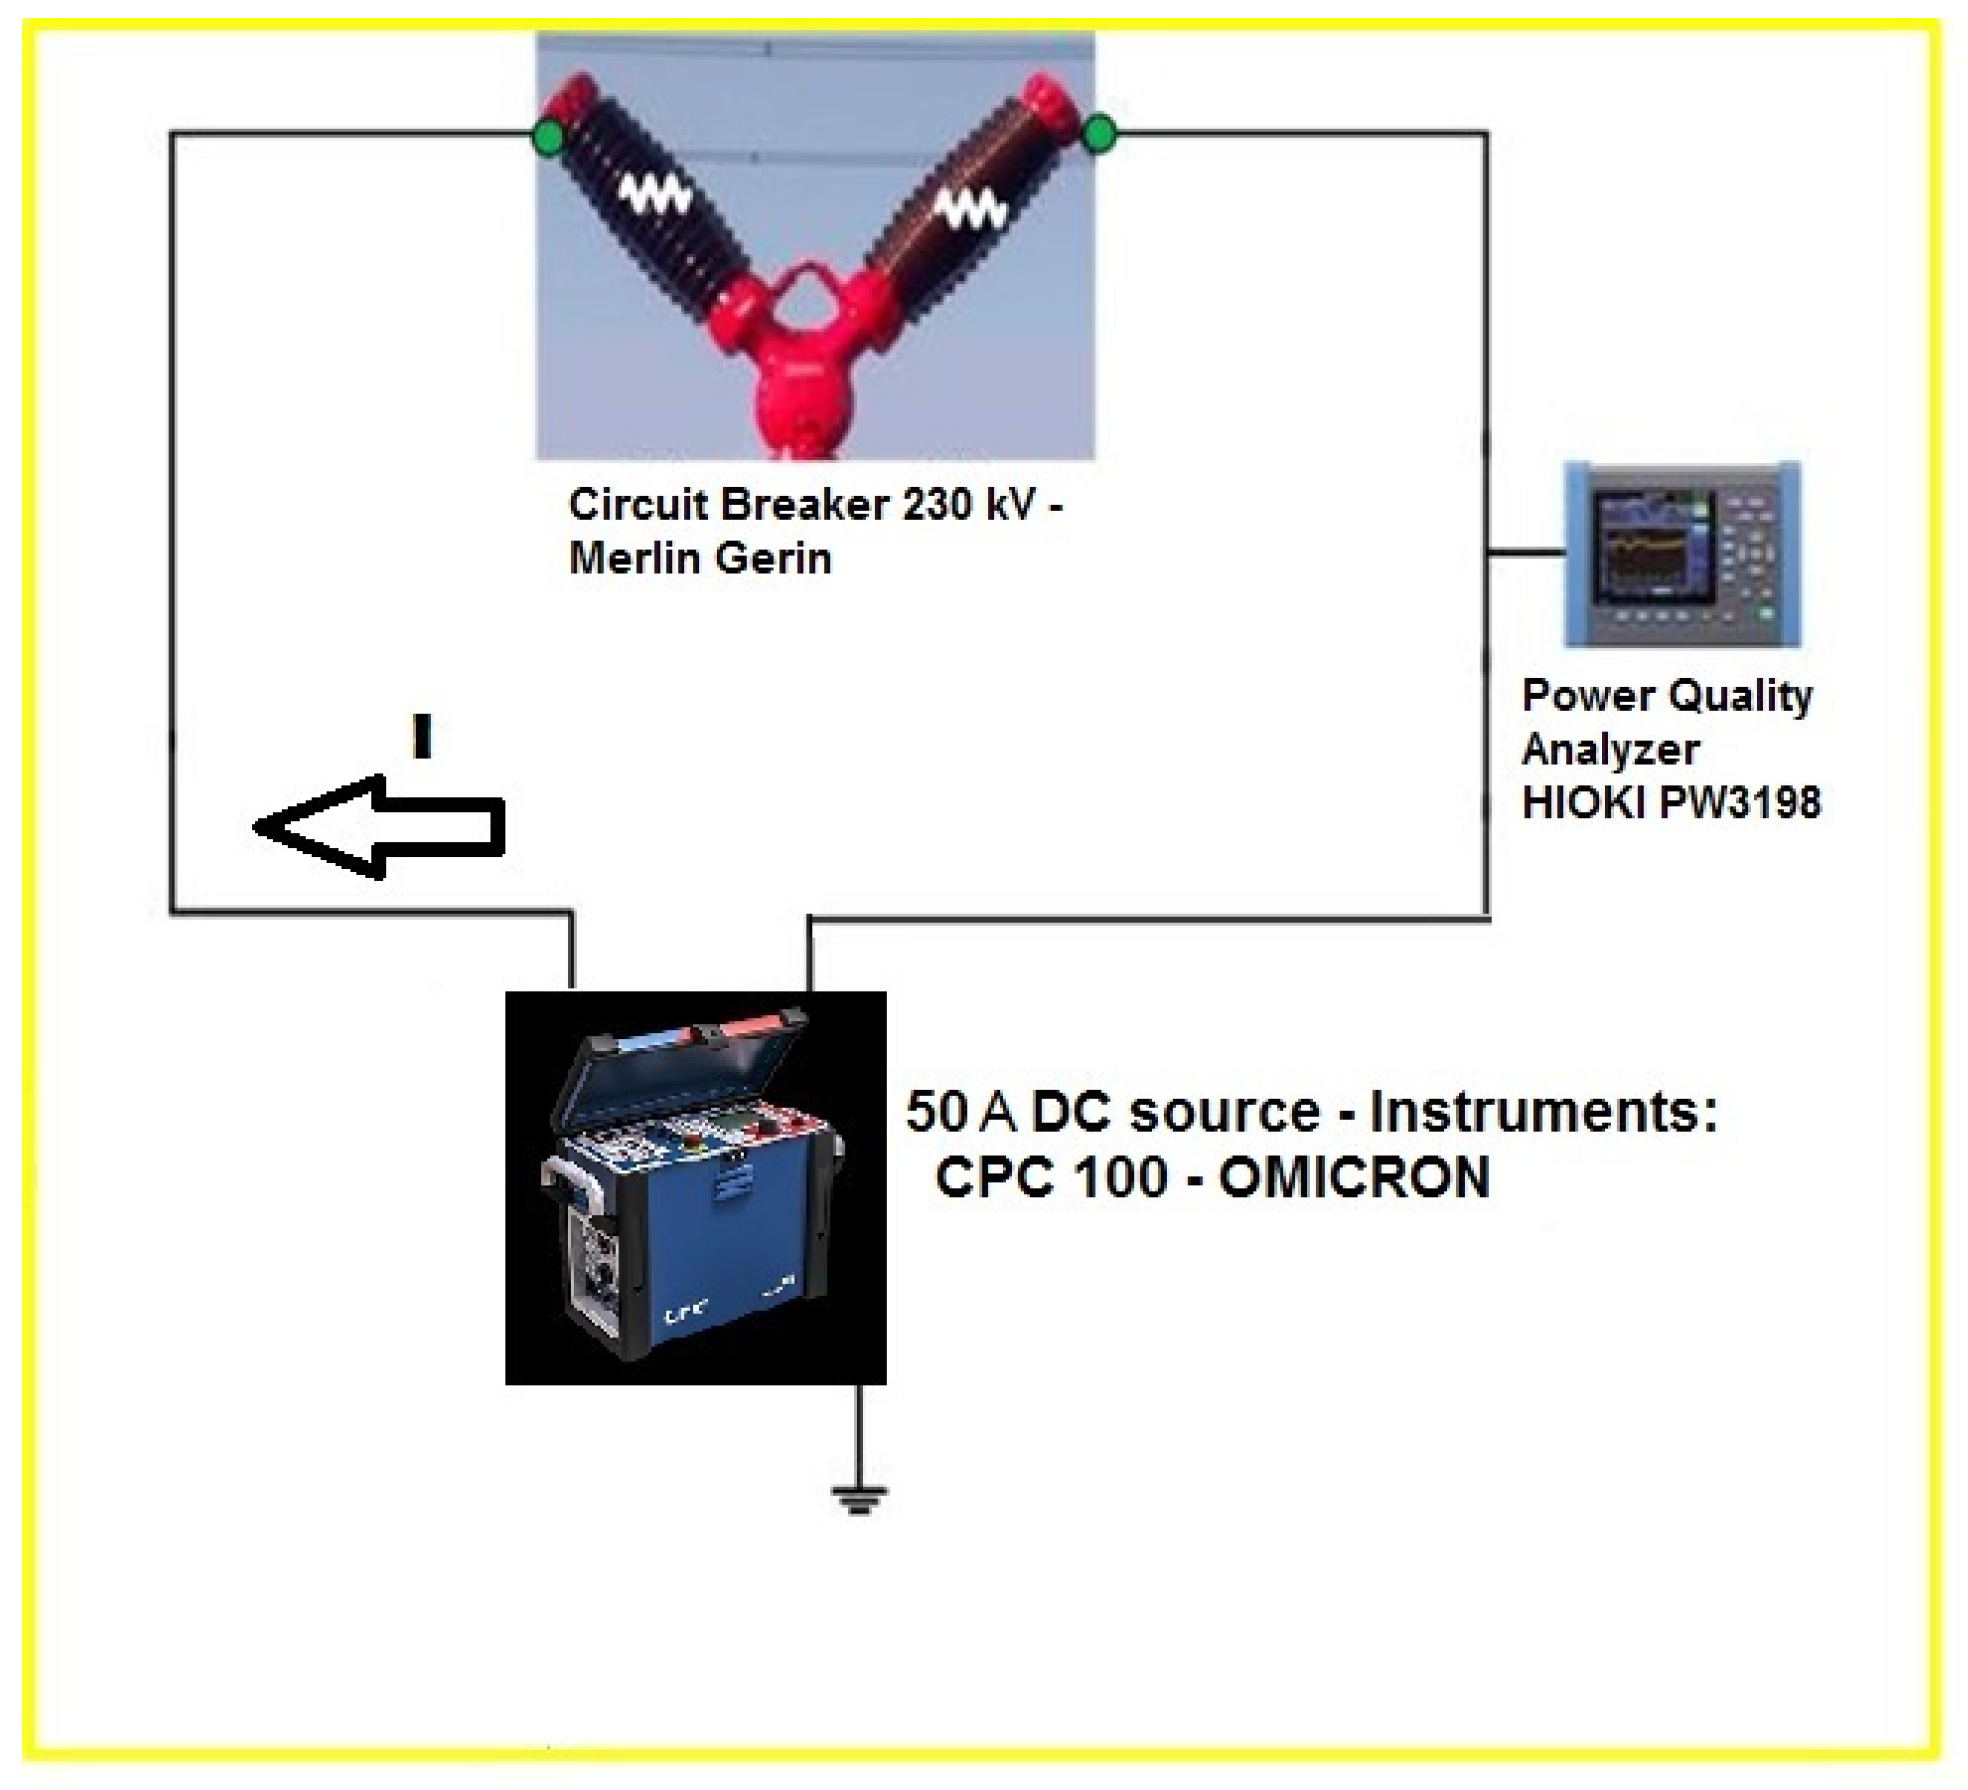
The present case study aims to identify the frequency band that is excited by the electric current flowing through the circuit breaker’s internal contacts for different static resistances conditions. According to [28], the minimum DC current magnitude recommended by the International Electrotechnical Commission, IEC standard 60,694 is 50 A [29] for the calculation of the static resistance of electrical contacts, so as to overcome the possible galvanic effects of these contacts. This is particularly important when dealing with robust contacts such as those of high-voltage circuit breakers, such as the one used in this bench test.
Following the IEC 60,694 recommendation, the bench test was set up, as presented in Figure 3, in the ELETRONORTE utility test laboratory at the 230 kV Guamá substation located in Belém City, Brazil, whose main components are a DC current source, up to 200 A; a 230 kV Merlin Gerin circuit breaker; a HIOKI DC current claw; and a HIOKI PW3198 power quality analyzer. For the DC current waveform acquisition, a sampling frequency of 20 kHz and a DC current magnitude of 50 A were used.
According to [30,31], DC current sources, depending on their specific design, generate typical harmonic distortions of up to 1.2 kHz, and in some cases these may be larger, around 1.5 kHz. Then, one can expect that harmonic distortions due to contact degradation will appear above these thresholds, corresponding to small partial discharges of high frequency due to imperfections in the contact material, which degrades continually with the time of use. Three successive measurements were performed for two circuit breakers of 230 kV, one with a contact resistance equal to 30 μΩ and the other with a resistance equal to 50 μΩ, whose results are presented in Table 1.
A low-pass and a high-pass filter-type Finite Impulse Response (FIR) with a Kaiser window were used to obtain the signals S(k) and R(k), respectively, for the cutting frequency Fc = 1.5 kHz, using MATLAB (MathWorks, Inc. Natick, MA, USA) [32].
By the inspection of Table 1, it is observed that the circuit breaker with a higher contact resistance (50 μΩ) presented a lower gain in dB, around 66 dB, which means it is more degraded, as was expected. The three successive measurements are to confirm the result repetition under the same test conditions. These results are a promising indication that the proposed procedure can have a potential application for the predictive maintenance of electric contacts in power system substation bays, as will be presented in next section.

4. Results and Discussion

The results obtained with bench tests, presented in Section 3.2, confirmed that using the Contact Degradation Indicator (CDI), as defined in Equation (2), can be a good discriminator to apply in the real-time operation of electrical power systems. In actual electrical systems, however, the load current that is measured in current transformers (CT) flows through several series contacts, including the CT winding, before being sampled by the oscillography data acquisition system, as illustrated formerly by the bay arrangement presented in Figure 1. Thus, the CDI may be used to indicate the bay degradation state as a combination of the individual elements’ degradations.
To illustrate this point, in Table 2 are shown measurements performed in two bays that supply two 230/69/13.8 kV power transformers belonging to the ELETRONORTE utility Guamá substation.
These two bays have the same structure by phase as that shown in Figure 1, so that the switches SW1, SW3, SW4; the circuit breaker (CB); and the current transformer (CT) in Table 2 have the same relative locations as in Figure 1. The recorded temperatures correspond to the highest measured values between the two series apparent contacts of each element during a recent thermo vision inspection. Circuit breakers’ internal contact resistances represent also the last measured values for these bays. The oscillography system used has a sampling rate of 256 samples/cycle in 60 Hz, so that the sampling frequency is 15.36 kHz. The cutoff frequency Fc for the CDI calculation was 1.5 kHz.
By inspection of Table 2, it is observed that, in both bays, phase B is more degraded than phases A and C. In the case of bay 1, the higher degradation of phase B (74.01 dB) is probably due to the circuit breaker’s higher contact resistance—in this case, 75.7 μΩ—since the temperatures recorded in phases A, B, and C do not present major differences among them. In the case of bay 2, the circuit breaker’s contact resistances in phases A, B, and C are practically the same, and the higher degradation of phase B (74.02 dB) is probably due to the higher contact temperatures of switches SW1 and SW4—respectively, 54 and 54.7 °C.
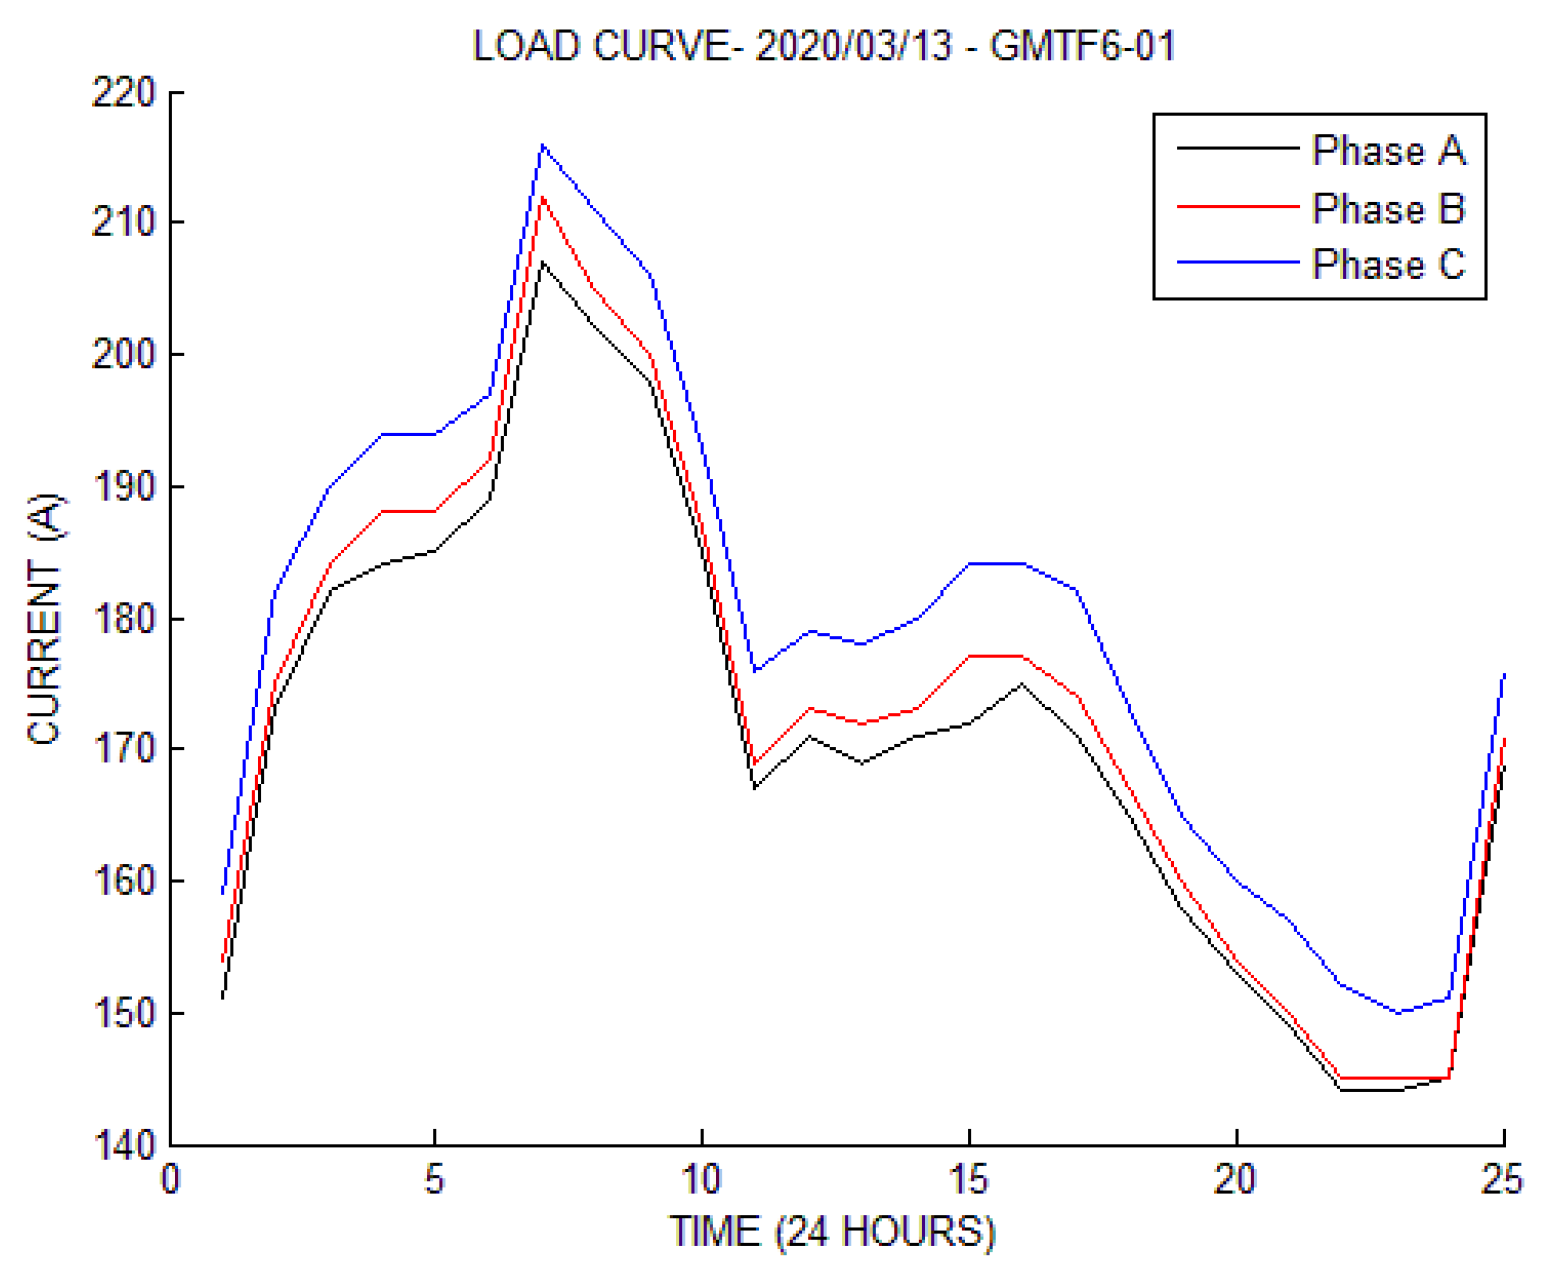
The data in Table 2 represent a single measurement for a specific time instant of the electric power system operation. Thus, it cannot be immediately concluded that phase B is the most degraded in relation to the combined analysis of its contacts. It is effectively known that the energy losses in contacts depend on many factors, such as the load current itself, which is continuously varying; the environment temperature and humidity; the cloud cover; and whether it is rainy or sunny. It is expected that, along the power system operation cycle, these conditions may change considerably and consequently also the calculated IDC for each phase. To illustrate this point, in Figure 4 the hourly calculated CDIs for phases A-B-C of bay 1 are presented, and in Figure 5 the respective phase A-B-C loading, from 8 a.m. on 13 March 2020 to 8 a.m. 14 March 2020, are presented.
From Figure 4, it is noted that the calculated CDI values present significant variations throughout the daily cycle of system operation, but it is expected that these variations present a decreasing tendency in the observed period. To better visualize this behavior, a linear regression model was fitted to the CDI values which resulted in Equations (3)–(5) for phases A-B-C, respectively. The negative slopes of the fitted straight lines are coherent with the expected contact degradation process.
YA = −0.02314 XA + 80.15,
YB = −0.02316 XB + 80.00,
YC = −0.03721 XC + 80.13,
where:
  • YA,B,C—are the CDIs in dB for phases A, B, and C, respectively;
  • XA,B,C—are the time in hours for phases A, B, and C, respectively.
It is observed by the inspection of Figure 4 that the calculated hourly values for CDI alternate between indicating lower gains for phases B and C and presenting more occurrences for phase B. Using a least square curve fitting for these data, we obtained the linear models presented in Figure 4 for phases A-B-C, showing that, during the observation time window, phases B and C were the most degraded in bay 1, respectively. In Figure 5, the corresponding daily load curves for phases A-B-C for the same time period are presented.
The preventive maintenance of the bays’ sectionalizing switches and circuit breakers occurs at relatively long time intervals, and for the sectionalizing switches this interval is in the scale of months for thermo vision inspections, whereas for the circuit breakers’ internal contacts this occurs on a scale of years. Over this time interval, the contacts degrade and may achieve imminent failure conditions. Thus, the use of CDI as an indicator of degradation should reflect this long-term trend, with a corresponding reduction in gains in dB as time passes. The lower the gain in dB, the higher the probability of contact failure. In this way, threshold values should be established for the CDI, so that as the calculated values approach these thresholds the bays are forwarded for the on-site evaluation of operating conditions.
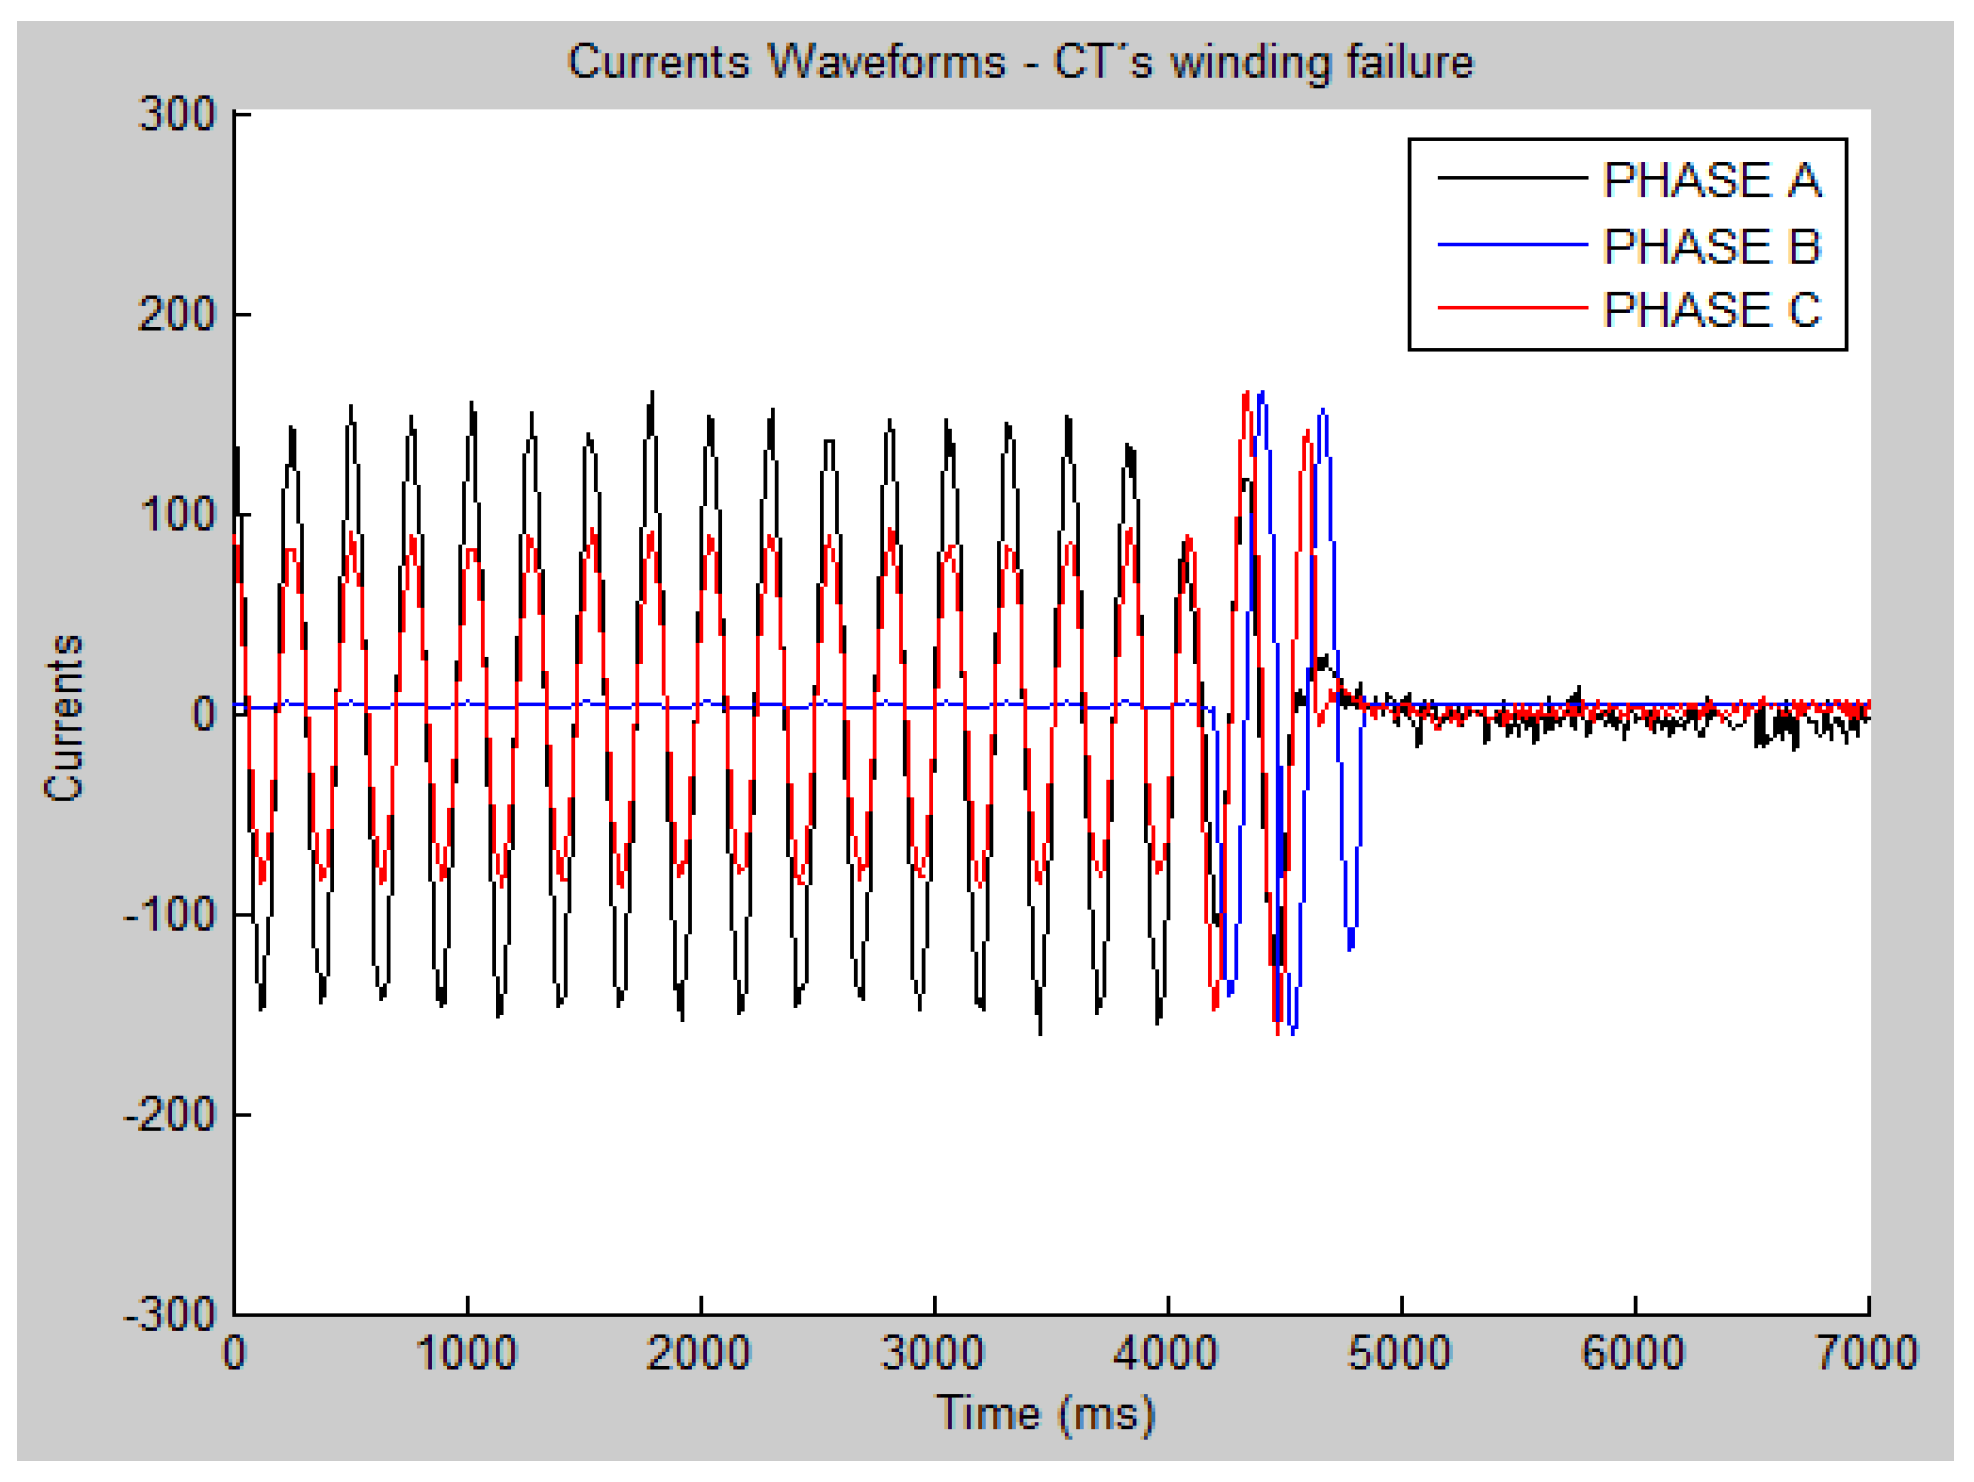
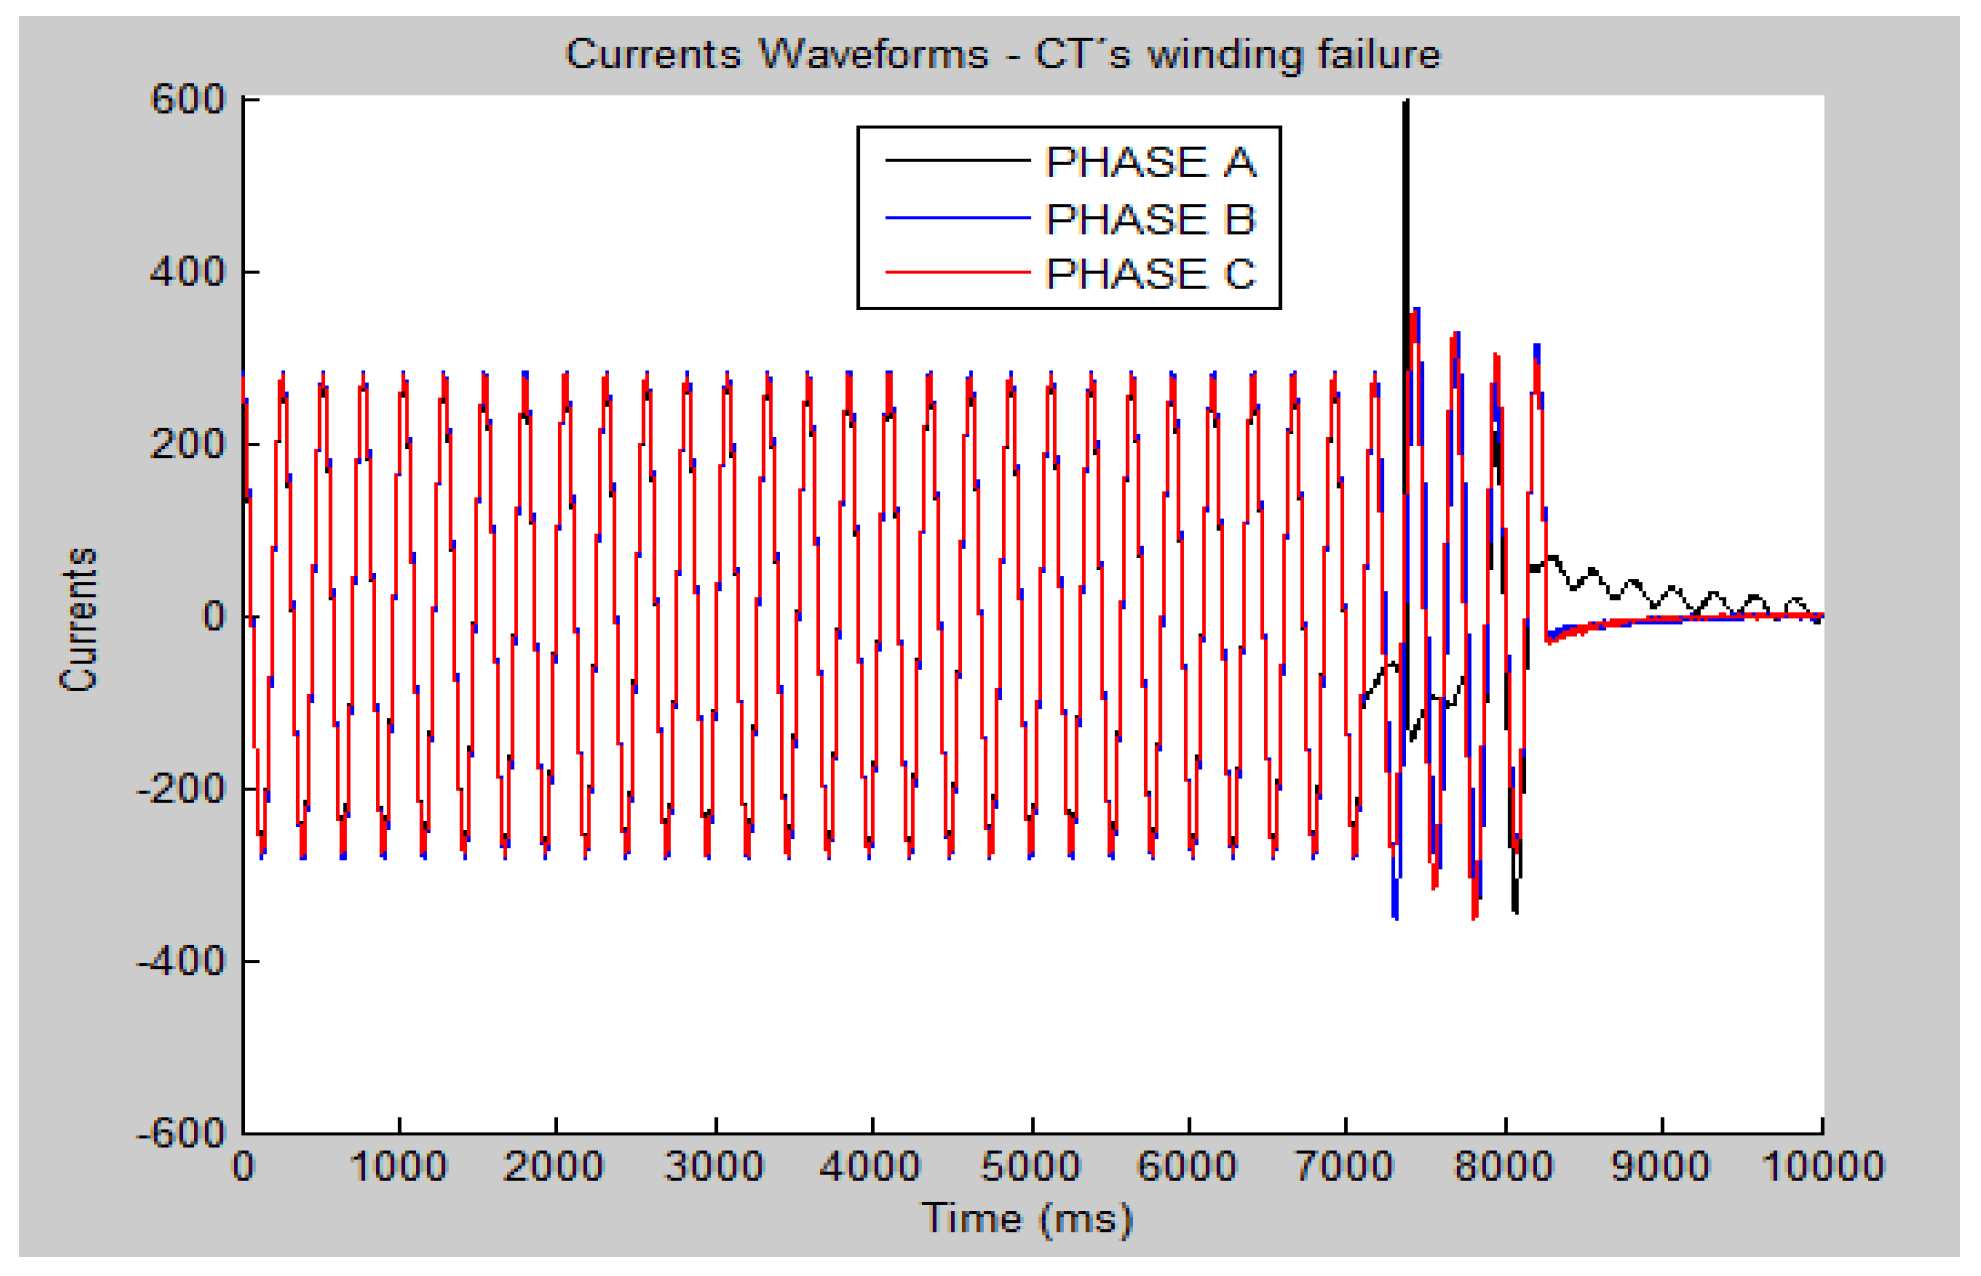
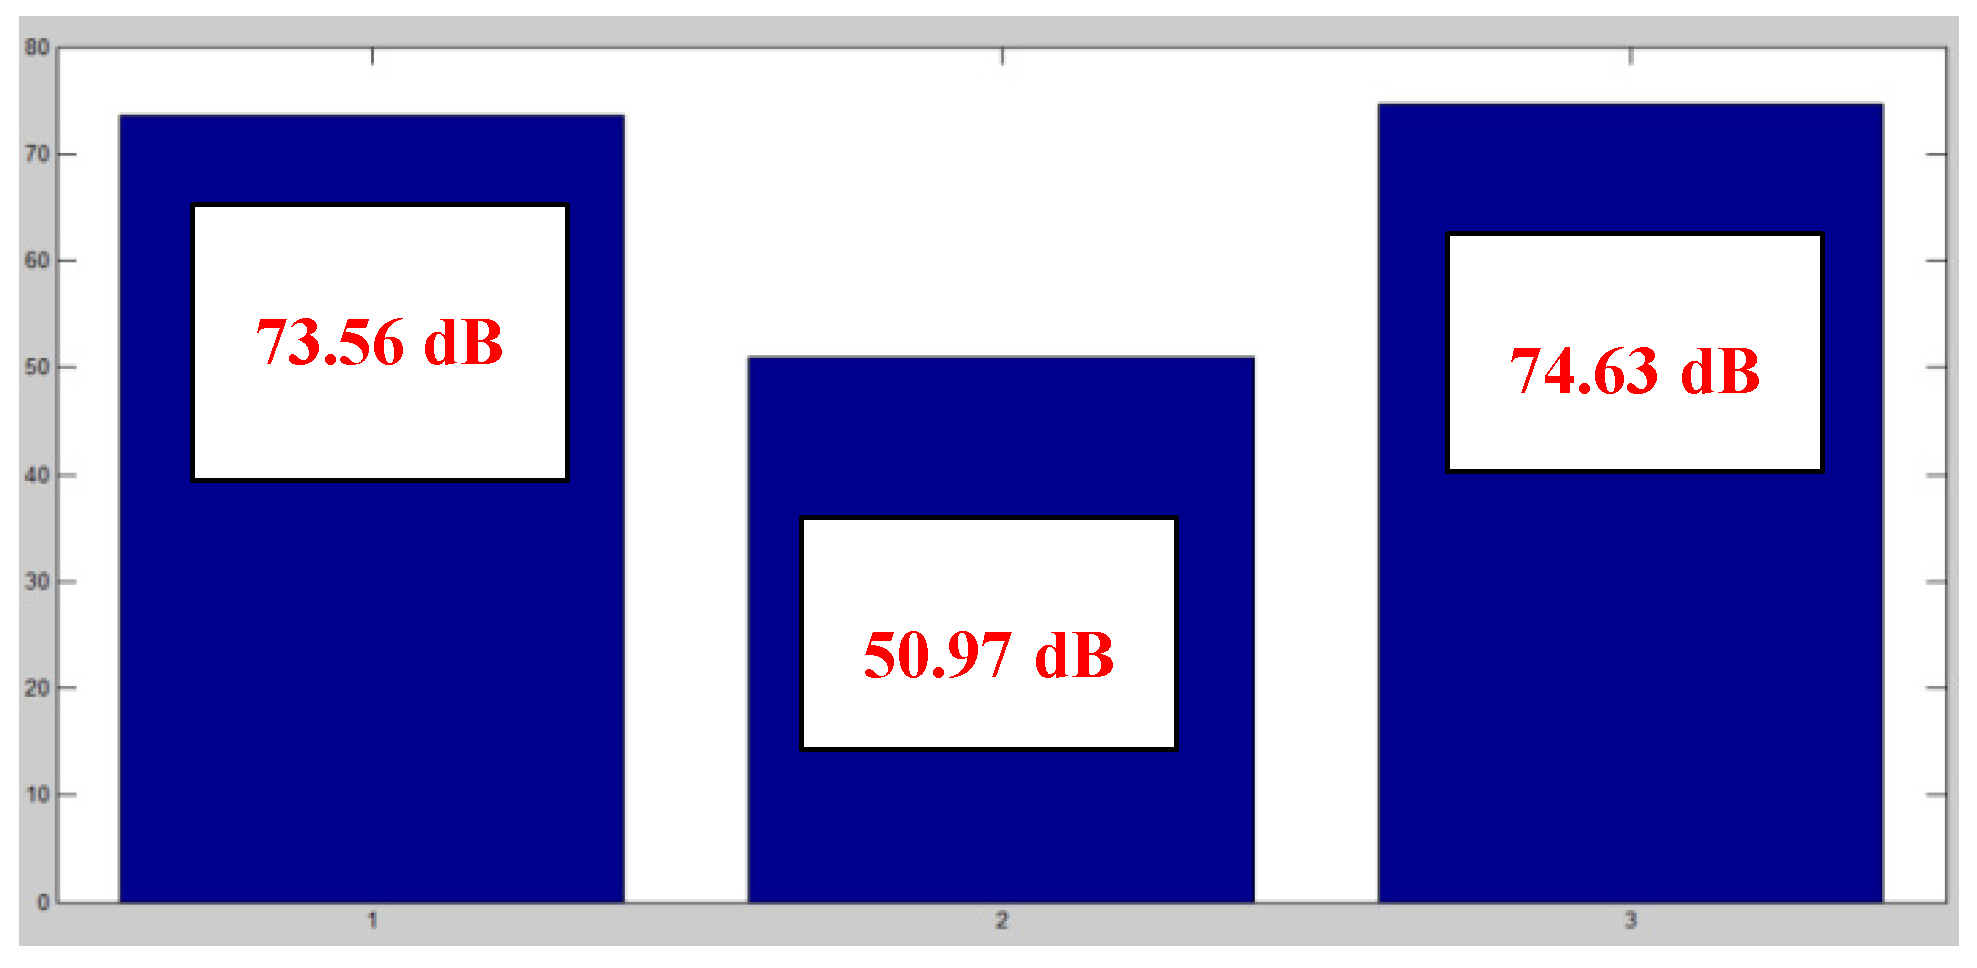
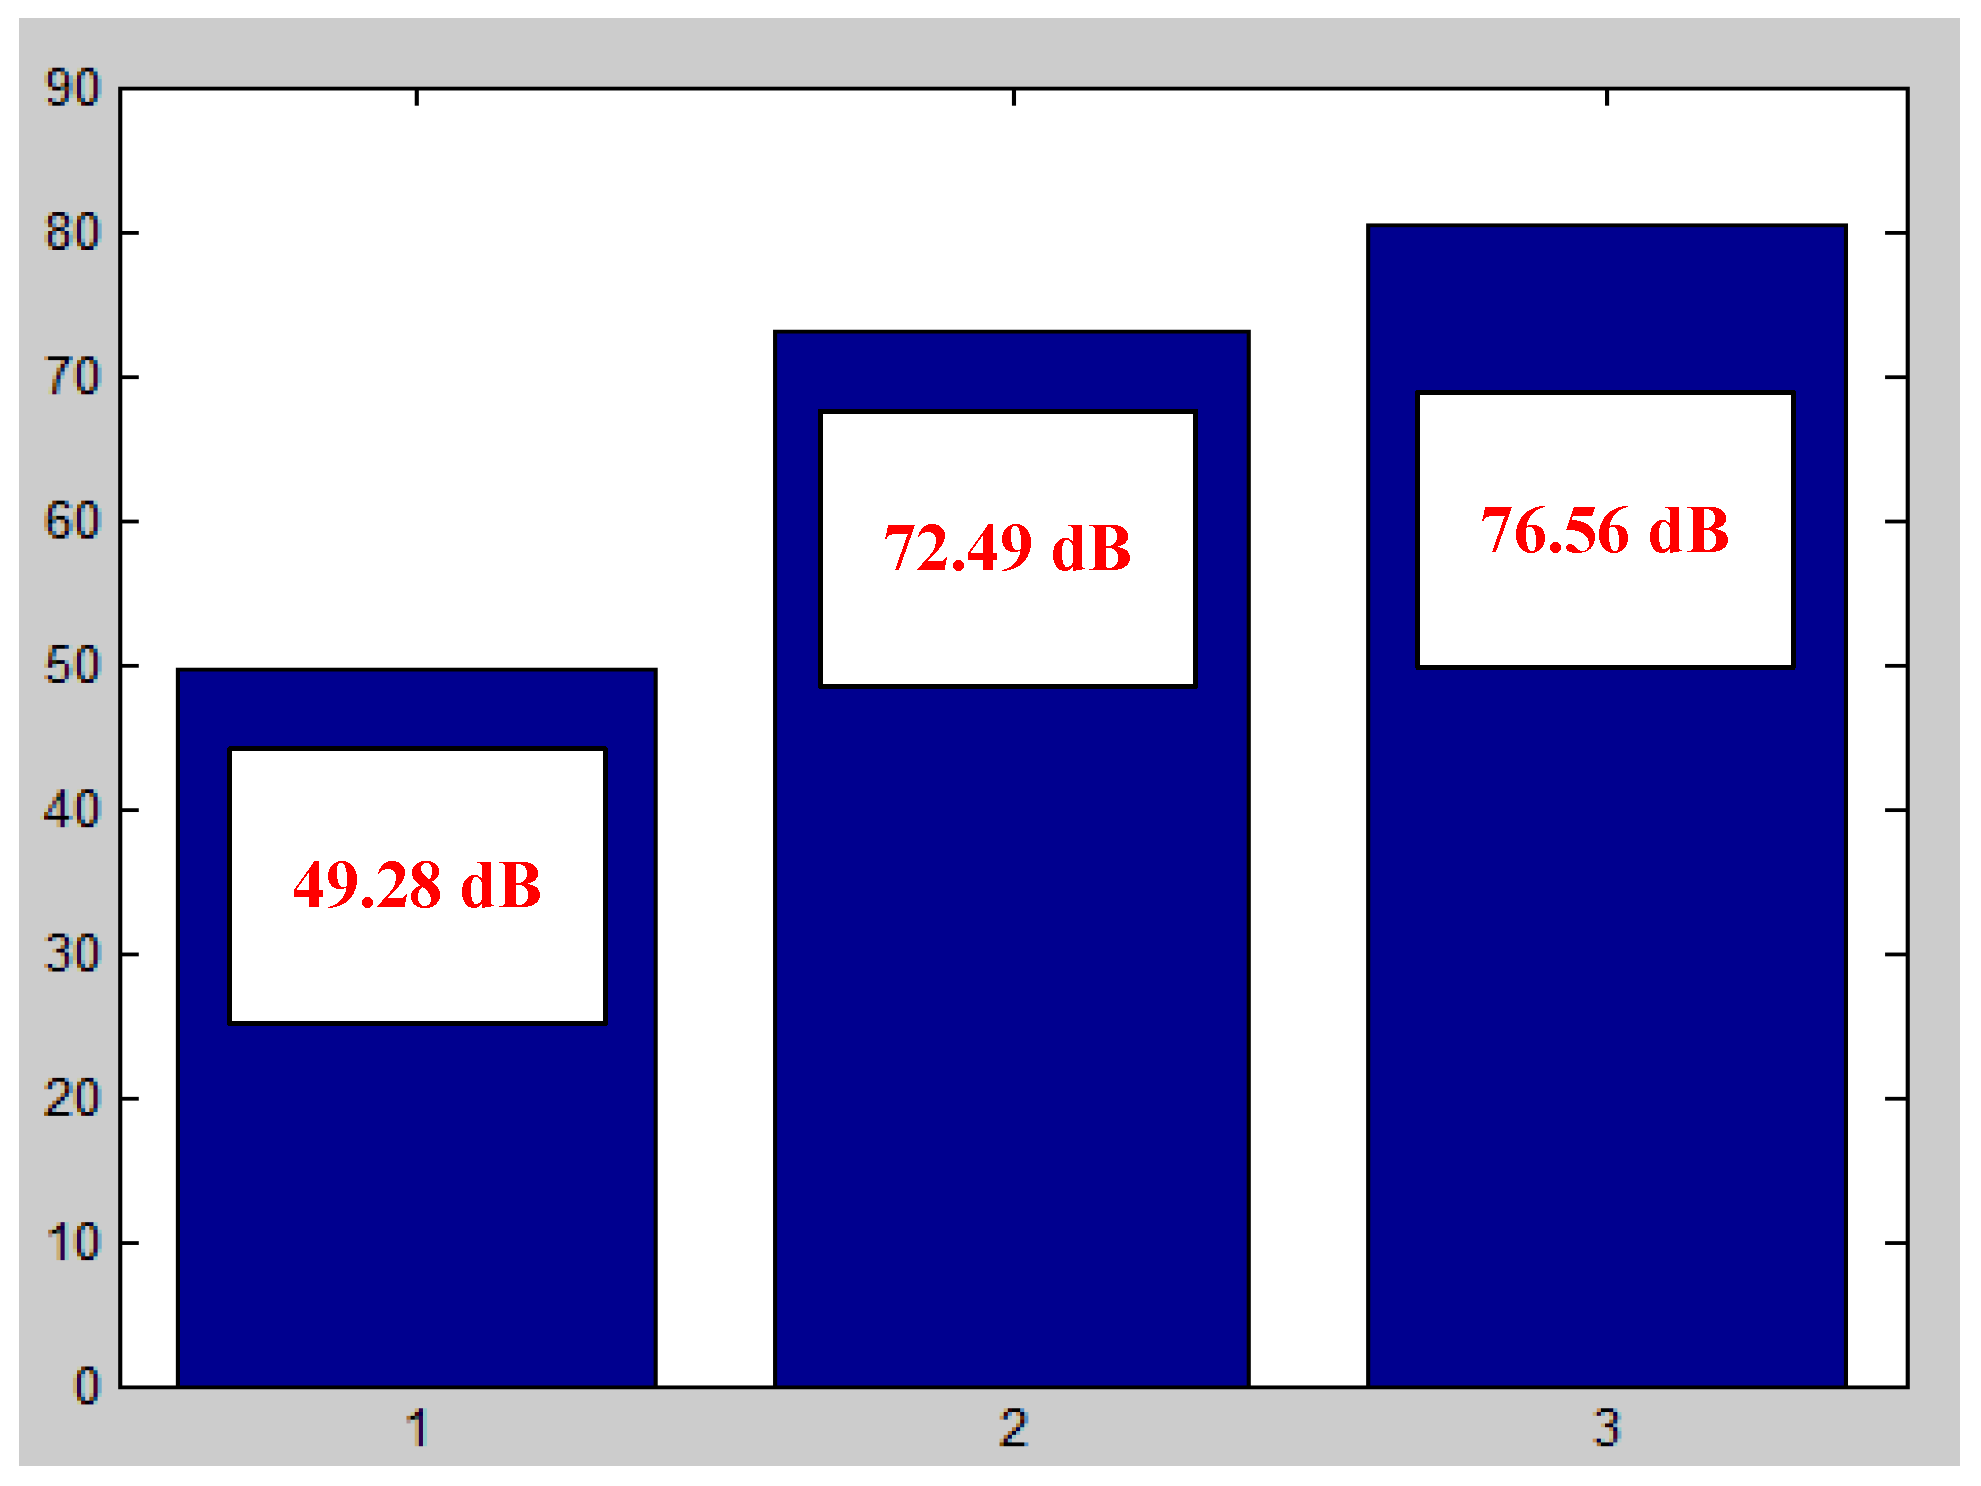
Regarding the establishment of CDI thresholds, in Figure 6, Figure 7, Figure 8 and Figure 9 two critical situations are presented that have occurred involving failures in current transformers’ windings, which may be considered, at first, as limit values to be monitored for the calculated CDI for the substation bay in real-time operation. The load current waveforms for the CT phases A, B, and C in a period immediately preceding the CT failures are presented in Figure 6 and Figure 7, and the respective calculated CDIs are in Figure 8 and Figure 9.
Figure 6 corresponds to the failure in phase B, while Figure 7 corresponds to the CT failure in phase A. It is worth noting that these are different failure events in two different CTs and in two different 230 kV substations; the phase B failure happens on 4 March 2019, and the phase A failure happens on 19 April 2019. Both failures have resulted in CT explosions.
It is observed, by the inspection of Figure 8 and Figure 9, which present the calculated CDIs for each failure occurrence, that the lowest CDIs are 50.97 and 49.38 dB for the fault phases B and A, respectively, whereas the non-faulted phases present much higher gains of between 72 and 77 dB, with differences above 20 dB in relation to the fault phases.
The CDI thresholds should be obtained from the electrical utility maintenance history. Many intrinsic factors can influence the evolution of contact degradation, such as the contact materials’ characteristics, which may vary according to the manufacturer; the load current magnitude and operating cycles; environmental conditions such as temperature, humidity, rainy, and sunny conditions; the system operating voltage, and others. Certainly, these thresholds should vary from one electrical system to another, constituting, therefore, a customized parameterization for each system. Due to the lack of detailed historical labeled data on utility maintenance practices, in this article we chose to use an extreme condition that corresponded to cases of current transformer explosion, because these events have been well documented.
According to the CDI calculation for several different operating conditions, it has been noted that an usual range of occurrence for the bay CDI in normal operating conditions is above 70 dB, which reflects an adequate value for sectionalizing switches’ temperatures and circuit breakers’ static contact resistances. Thus, an extreme condition close to 50 dB, which corresponded to CT failure, should be avoided preventively. In principle, a real-time monitoring system can be implemented in such a way that, as successive calculated CDI values approach this threshold or another threshold in accordance with the utility’s maintenance experience, a preventive assessment of the bay’s conditions should be performed.
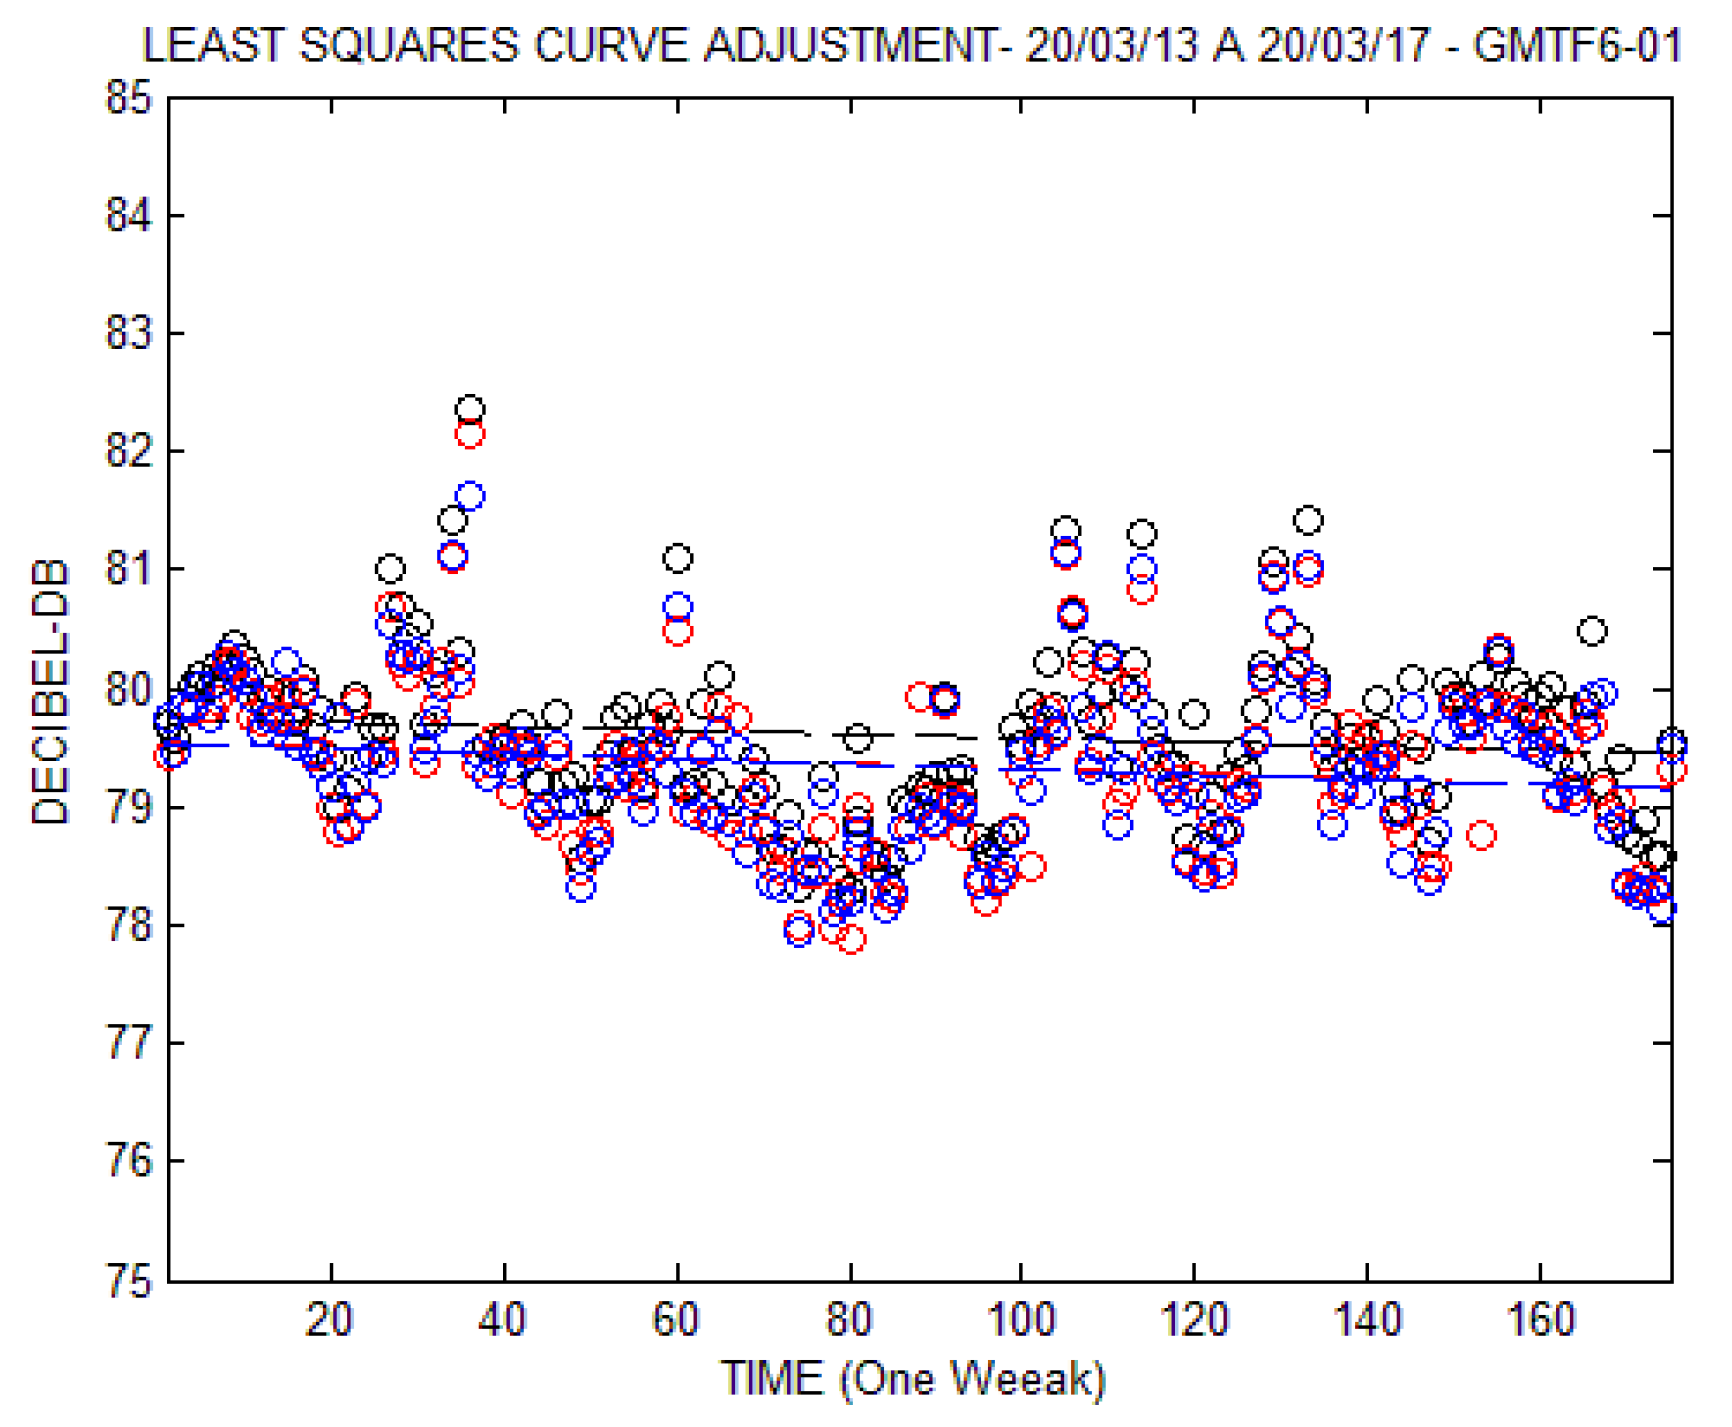
To illustrate this longer-term tendency, in Figure 10 the results of an hourly measurement campaign in a 230 kV bay at the Guamá Substation for a week-long period from 13 to 20 February 2020 are presented. In Figure 10, the linear curve fitting resulted in the straight-line Equations (6)–(8) for phases A-B-C, respectively:
YA = −0.001666 XA + 79.74,
YB = −0.002203 XB + 79.54,
YC = −0.002191 XC + 79.53.
Observing these equations, it is noted that the angular coefficients are small and negative, expressing a trend of a slow decrease in CDI in dB, confirming the slow dynamic behavior of the contact degradation process, as discussed earlier. According to these linear approximations, the initial values for CDIs are 79.74, 79.54, and 79.53 dB, and the final values a week later are 79.46, 79.17, and 79.16 dB for phases A-B-C, respectively, which represent insignificant changes in the contact degradation. Using the linear models in (6)–(8) as an initial approximation to estimate how long it would take to reach the final value of 75 dB, for example, it would result in around 4 months for phase A, and around 3 months for phases B and C.
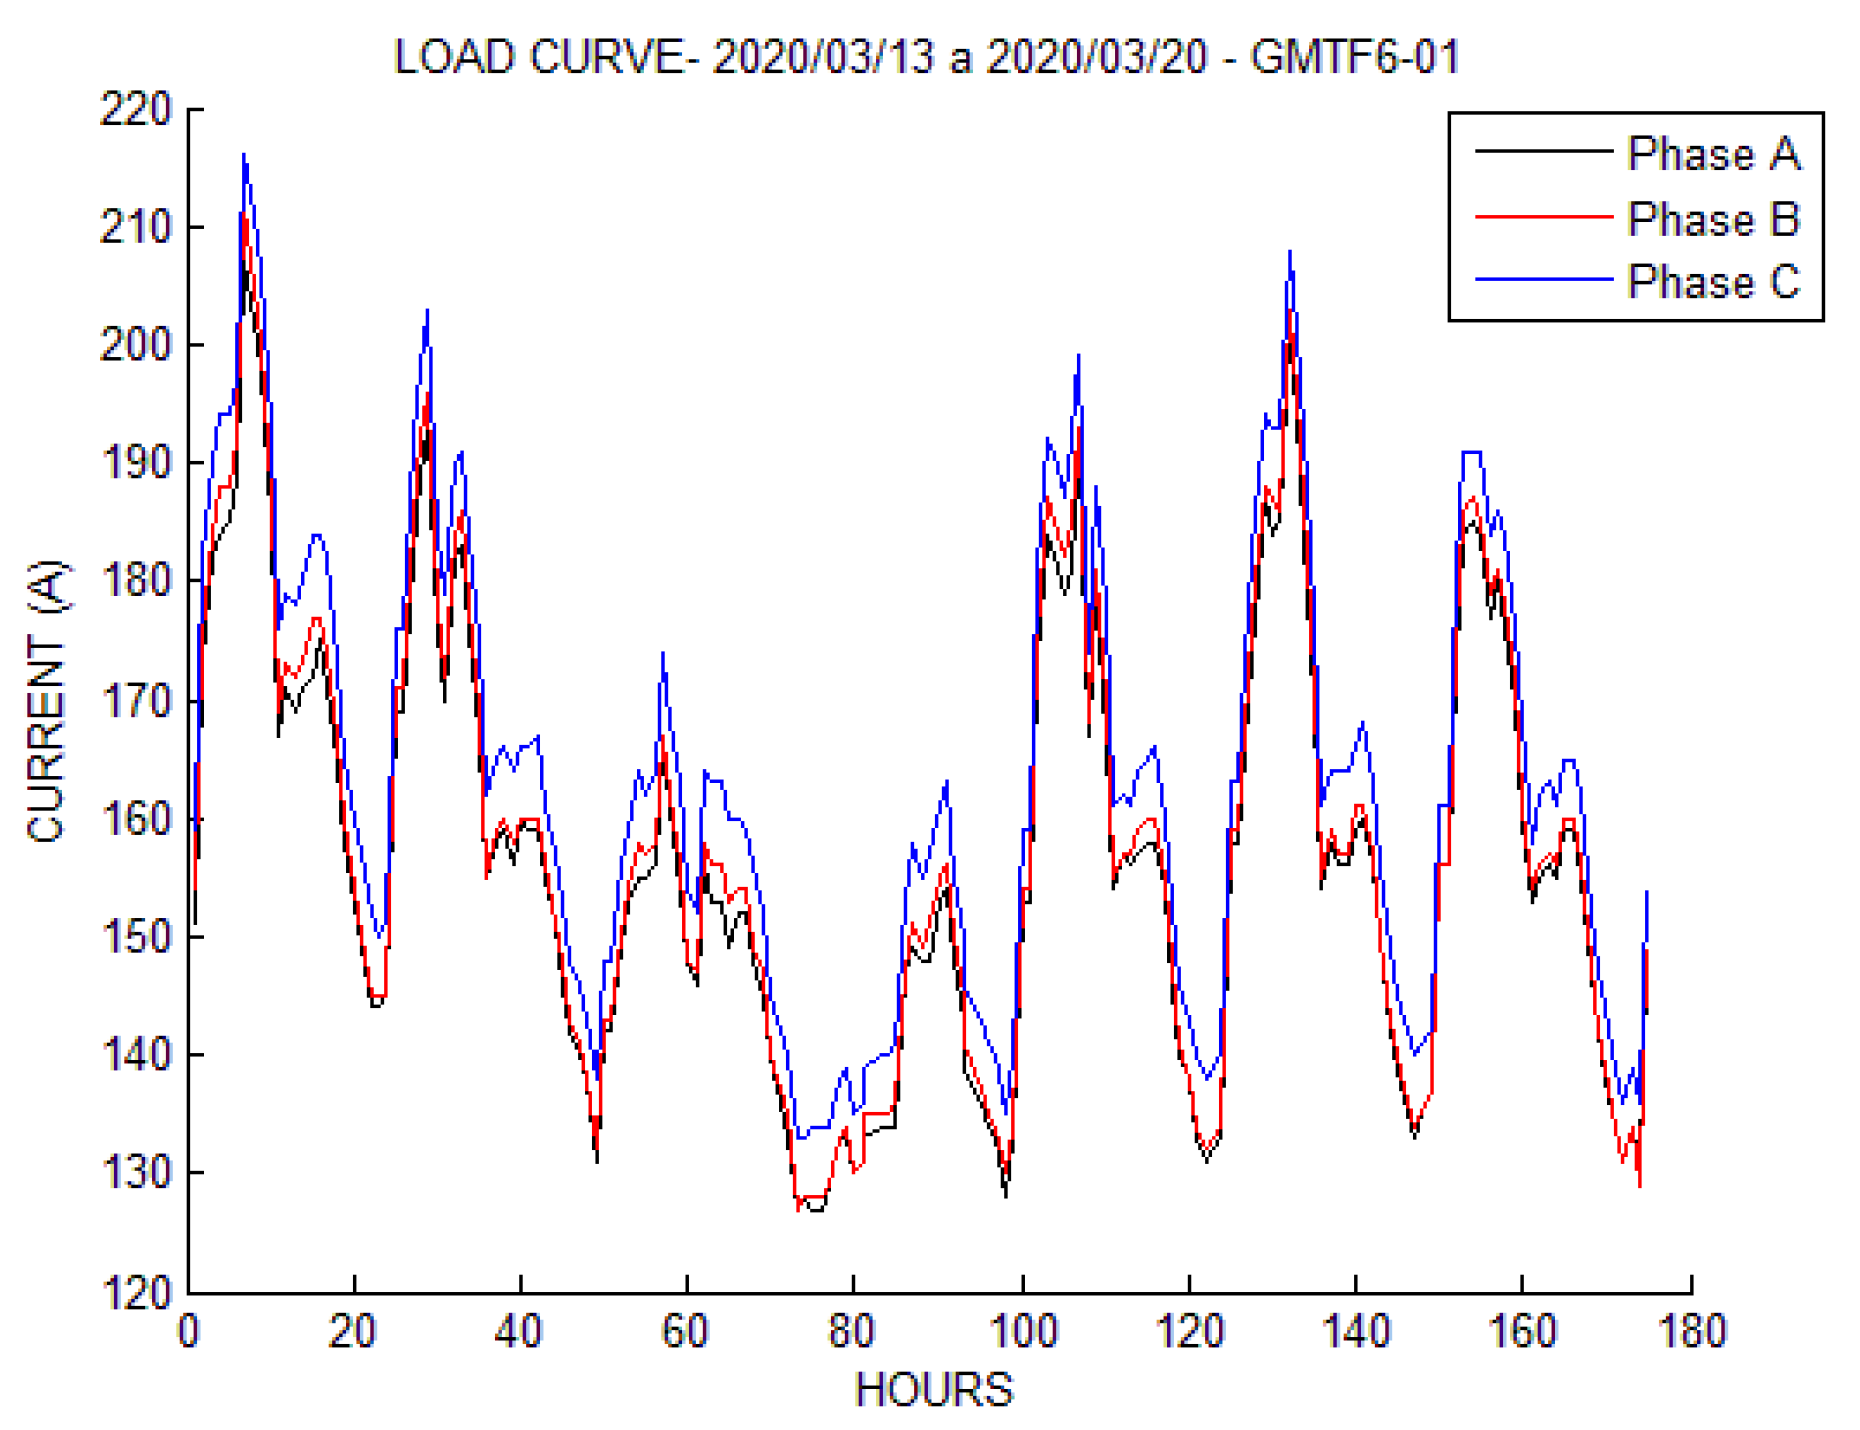
For the same week period, in Figure 11 the corresponding load curves for Phases A-B-C are presented, starting on Thursday at 8 a.m. and finishing on Thursday at 8 a.m. the next week.

5. Conclusions

The results obtained confirm that the proposed methodology for the predictive diagnosis of failures in bays of power transmission/distribution substations through load current spectral analysis is a very viable technique for implementation in real electrical systems with reduced cost, since these systems already have implanted oscillography infrastructure, which enables the use of the proposed technique in real-time monitoring.
The usual practice in most electric power utilities today is to perform preventive visual and thermography inspections of substation bays every few months. That is, they do not have an online criticality indicator to trigger the inspection. Thus, the procedure proposed here can fulfill this role as an effective-cost solution in these situations.
Some other electric power utilities are already implementing online monitoring services by visual and thermography images, but even in these cases the predictive monitoring system proposed can help reduce costs, because the visual and thermography images would only need to be triggered when the CDI reaches a threshold indicating that a critical condition has been reached.
The analysis of the harmonic profile of equivalent loads supplied by electric substations is of fundamental importance to define the cutoff frequency Fc for the CDI calculation, and it is recommended to accomplish this characterization according to the substation service voltage—that is, 69, 138, 230 kV, and so on.
It is also important to establish the most representative thresholds for the CDI gains in dB, according to the operational experience and operating environment of each electrical system.
It is understood that this work constitutes an initial proposal in developing a diagnostic system integrated with the operation of electrical systems, which should certainly be the object of future work in this area of interest. Finally, it is understood that the development of intelligent diagnostic systems for the automation of this analysis procedure and its integration with the operation of electrical systems is also a line of research and development that is quite attractive to investigate.

Author Contributions

Conceptualization, F.V.V.B. and U.H.B.; methodology, F.V.V.B., U.H.B., M.E.L.T., F.J.B.B., and G.P.S.C.; software, F.V.V.B., F.J.B.B.; validation, F.V.V.B., F.J.B.B., and U.H.B.; formal analysis, F.V.V.B., G.P.S.C., F.J.B.B., M.E.L.T., and U.H.B.; investigation, F.V.V.B., G.P.S.C., F.J.B.B., M.E.L.T., and U.H.B.; resources, F.V.V.B. and G.P.S.C.; data curation, F.V.V.B.; writing—original draft preparation, F.V.V.B. and U.H.B.; writing—review and editing, U.H.B. All authors have read and agreed to the published version of the manuscript

Funding

This research received no external funding.

Acknowledgments

The research was supported by PROPESP, the research and post-graduation pro rectory of Federal University of Pará; CEAMAZON—Center of Excellence on Energy Efficient in the Amazon; ELETROBRÁS ELETRONORTE—Generation and Transmission Utility in the north of Brazil.

Conflicts of Interest

The authors declare no conflict of interest.

References

  1. Kwong, R.H.; Yonge-Mallo, D.L. Fault Diagnosis in Discrete-Event Systems: Incomplete Models and Learning. IEEE Trans. Syst. Man Cybern. Part B 2011, 41, 118–130. [Google Scholar] [CrossRef] [PubMed]
  2. Langarica, S.; Ruffelmacher, C.; Nunez, F. An Industrial Internet Application for Real-Time Fault Diagnosis in Industrial Motors. IEEE Trans. Autom. Sci. Eng. 2020, 17, 284–295. [Google Scholar] [CrossRef]
  3. Ballal, M.S.; Jaiswal, G.C.; Tutkane, D.R.; Vanikar, P.A.; Mishra, M.K.; Suryawanshi, H.M. Online Condition Monitoring System for Substation and Service Transformer. IET Electr. Power Appl. 2017, 11, 1187–1195. [Google Scholar] [CrossRef]
  4. Saponara, S.; Fanucci, L.; Bernardo, F.; Falciani, A. Predictive Diagnosis of High-Power Transformer Faults by Networking Vibration Measuring Nodes with Integrated Signal Processing. IEEE Trans. Instrum. Meas. 2016, 65, 1749–1760. [Google Scholar] [CrossRef]
  5. Carneiro, J.C. Substation Power Transformer Risk Management: Predictive Methodology Based on Reliability Centered Maintenance Data. In Proceedings of the 4th International Conference on Power Engineering, Energy and Electrical Drives, Istanbul, Turkey, 13–17 May 2013. [Google Scholar]
  6. Firoozi, H.; Mahmoodi, N.; Kharezi, M.; Ghiyasi, M.I. Frequency Response Analysis—Low Frequency Characteristics and Fault Diagnosis on Power Transformers. In Proceedings of the 10th IEEE International Conference on Solid Dielectrics, Potsdam, Germany, 4–9 July 2010. [Google Scholar]
  7. Hong, K.; Huang, H.; Zhou, J. Winding Condition Assessment of Power Transformers Based on Vibration Correlation. IEEE Trans. Power Deliv. 2015, 30, 1735–1742. [Google Scholar] [CrossRef]
  8. Rinaldi, I.; Smit, J.; Munir, B. Diagnosing Winding on Core Condition of Power Transformer by Vibration Signal Analysis. In Proceedings of the IEEE International Conference on Condition Monitoring and Diagnosis, Bali, Indonesia, 23–27 September 2012. [Google Scholar]
  9. Dubey, A.K.; Jaffery, Z. Design of Early Fault Detection Technique for Electrical Assets Using Infrared Thermograms. Int. J. Electr. Power Energy Syst. 2014, 63, 753–759. [Google Scholar]
  10. Chottopadhyay, P.; Sil, J.; Dutta, T. Condition Monitoring of Electrical Equipment Using Thermal Image Processing. In Proceedings of the IEEE First International Conference on Control, Measurement and Instrumentation, Kolkata, India, 8–10 January 2016. [Google Scholar]
  11. Sampaio, D.J.B.S.; Sousa, V.G.S.; Glatt, R.; Rubbo, D.; Costa, A.F. Thermography Inspection Using a Microcontroller-based Camera Positioning System. In Proceedings of the 3rd International Conference on Applied Robotics for the Power Industry, Foz do Iguassu, Brazil, 14–16 October 2014. [Google Scholar]
  12. Sisman, G.R.; Oproescu, M. Monitoring the Parameters of the Electronics Devices to Assure the Predictive Maintenance of Equipment. In Proceedings of the 10th International Symposium on Advanced Topics in Electrical Engineering, Bucharest, Romania, 23–25 March 2017. [Google Scholar]
  13. Razi-Kazemi, A.A.; Abdollah, M. Novel High-Frequency-Based Diagnostic Approach for Main Contact Assessment of High-Voltage Circuit Breakers. IET J. Inst. Eng. Technol. 2018, 12, 1121–1126. [Google Scholar] [CrossRef]
  14. Kadechhar, A.; Riba, J.R.; Eguilaz, M.M.; Capelli, F.; Gonzalez, D. On-line Resistance Measurement of Substation Connectors Focused on Predictive Maintenance. In Proceedings of the 18th International Power Eletronics and Motion Control Conference (PEMC), Budapest, Hungary, 26–30 August 2018. [Google Scholar]
  15. Kadechhar, A.; Riba, J.-R.; Moreno-Eguilaz, M.; Perez, J. SmartConnector: A Self-Powered IoT Solution to Ease Predictive Maintenance in Substation. IEEE Sens. J. 2020, 20, 11632–11641. [Google Scholar] [CrossRef]
  16. Braunovic, M.; Konchits, V.V.; Myshkin, K.N. Electrical Contacts—Fundamentals Applications and Tecnology; CRC Press: Boca Raton, FL, USA, 2006. [Google Scholar]
  17. Khoddam, M.; Sadeh, J. Pourmohamadiyan-Performance Evaluation of Circuit Breaker Electrical Contact Based on Dynamic Resistance Signature and Using Health Index. Trans. Compon. Packag. Manuf. Technol. 2016, 6, 1505–1512. [Google Scholar] [CrossRef]
  18. Tingling, C.; Wenjun, Z.; Guangyao, J.; Zhiyong, Y.; Gao, W. Influence of the Injected Current on Dynamic Contact Resistance Measurements of HV Circuit Breakers. In Proceedings of the China International Conference on Electricity Distribution (CICED 2014), Shenzhen, China, 23–26 September 2014. [Google Scholar]
  19. Stanisic, Z. Method for Static and Dynamic Resistance Measurements of HV Circuit Breaker. In Proceedings of the IEEE PES International Conference and Exhibition on Innovative Smart Grid Technologies, Manchester, UK, 5–7 December 2011. [Google Scholar]
  20. Souza, T.R.; Costa, G.E.; Oliveira, C.A.; Sousa, V.W. Characterization of Contacts Degradation in Circuit Breakers through the Dynamic Contact Resistance. In Proceedings of the PES Transmission & Distribution Conference and Exposition—Latin America, Medellin, DC, USA, 10–13 September 2014. [Google Scholar]
  21. Lezama, J.; Schweitzer, P.; Weber, S.; Tisserand, E.; Joyeux, P.; Rabla, M. Frequency Analysis to Arcing Detection and Prototyping FPGA Approach. In Proceedings of the IEEE 59th Conference on Electrical Contacts (HOLM), Newport, RI, USA, 22–25 September 2013. [Google Scholar]
  22. Ziemer, R.E.; Tranter, W.H.; Fannin, D.R. Signals and Systems. Continuous and Discrete, 4th ed.; Prentice Hall: London, UK, 1998. [Google Scholar]
  23. Arrilaga, J. Power Systems Harmonics; John Wiley and Sons, Inc.: Hoboken, NJ, USA, 1985. [Google Scholar]
  24. IEEE Recommended Practices and Requirements for Harmonic Control in Electrical Power Systems: IEEE Standard 519. 2014. Available online: https://ieeexplore.ieee.org/document/6826459 (accessed on 14 July 2020).
  25. Dugan, R.; Kennedy, B.J. Electrical Power System Quality; McGraw-Hill, Inc.: New York, NY, USA, 1996. [Google Scholar]
  26. ANEEL. Electric Energy Distribution Procedures Guide—PRODIST, Module 8—Power Quality; Electric Energy Brazilian Agency, ANEEL: Brasilia, Brazil, 2017.
  27. Meyer, J.; Khokhlov, V.; Klatt, M.; Blum, J.; Warniek, C.; Wohlfahrt, T.; Myrzik, T. Overview and classification of interferences in the frequency range 2–150 kHz (Supraharmonics). In Proceedings of the 2018 International Symposiumon on Power Eletronics, Electrical Devices, Automation and Motion (SPEEDAM), Amalfi, Italy, 20–22 June 2018. [Google Scholar]
  28. Bhole, A.A.; Gandhare, W.Z. An Overview of Dynamic Contact Resistance Measurement of HV Circuit Breakers. J. Inst. Eng. Ser. B 2016, 97, 219–226. [Google Scholar] [CrossRef] [Green Version]
  29. IEC 62271—High-Voltage Switchgear and Controlgear—Part 1: Common Specifications. 2007. Available online: http://www.abnt.org.br/pesquisas/?searchword=60694&x=6&y=18 (accessed on 14 July 2020).
  30. Mariscotti, A. Analysis of the DC-link Current Spectrum in Voltage Source Inverters. IEEE Trans. Circuits Syst. I Fundam. Theory Appl. 2002, 49, 484–491. [Google Scholar] [CrossRef]
  31. Abramovitz, A.; Bem-Yaakov, S. Current Spectra Translation in Single Phase Rectifiers: Implications to Active Power Factor Corrections. IEEE Trans.Circuits Syst. I Fundam. Theory Appl. 1997, 2, 1342–1347. [Google Scholar] [CrossRef]
  32. Karris, S.T. Signals and Systems with MATLAB and Simulink, 3rd ed.; Orchard publications: London, UK, 2007. [Google Scholar]
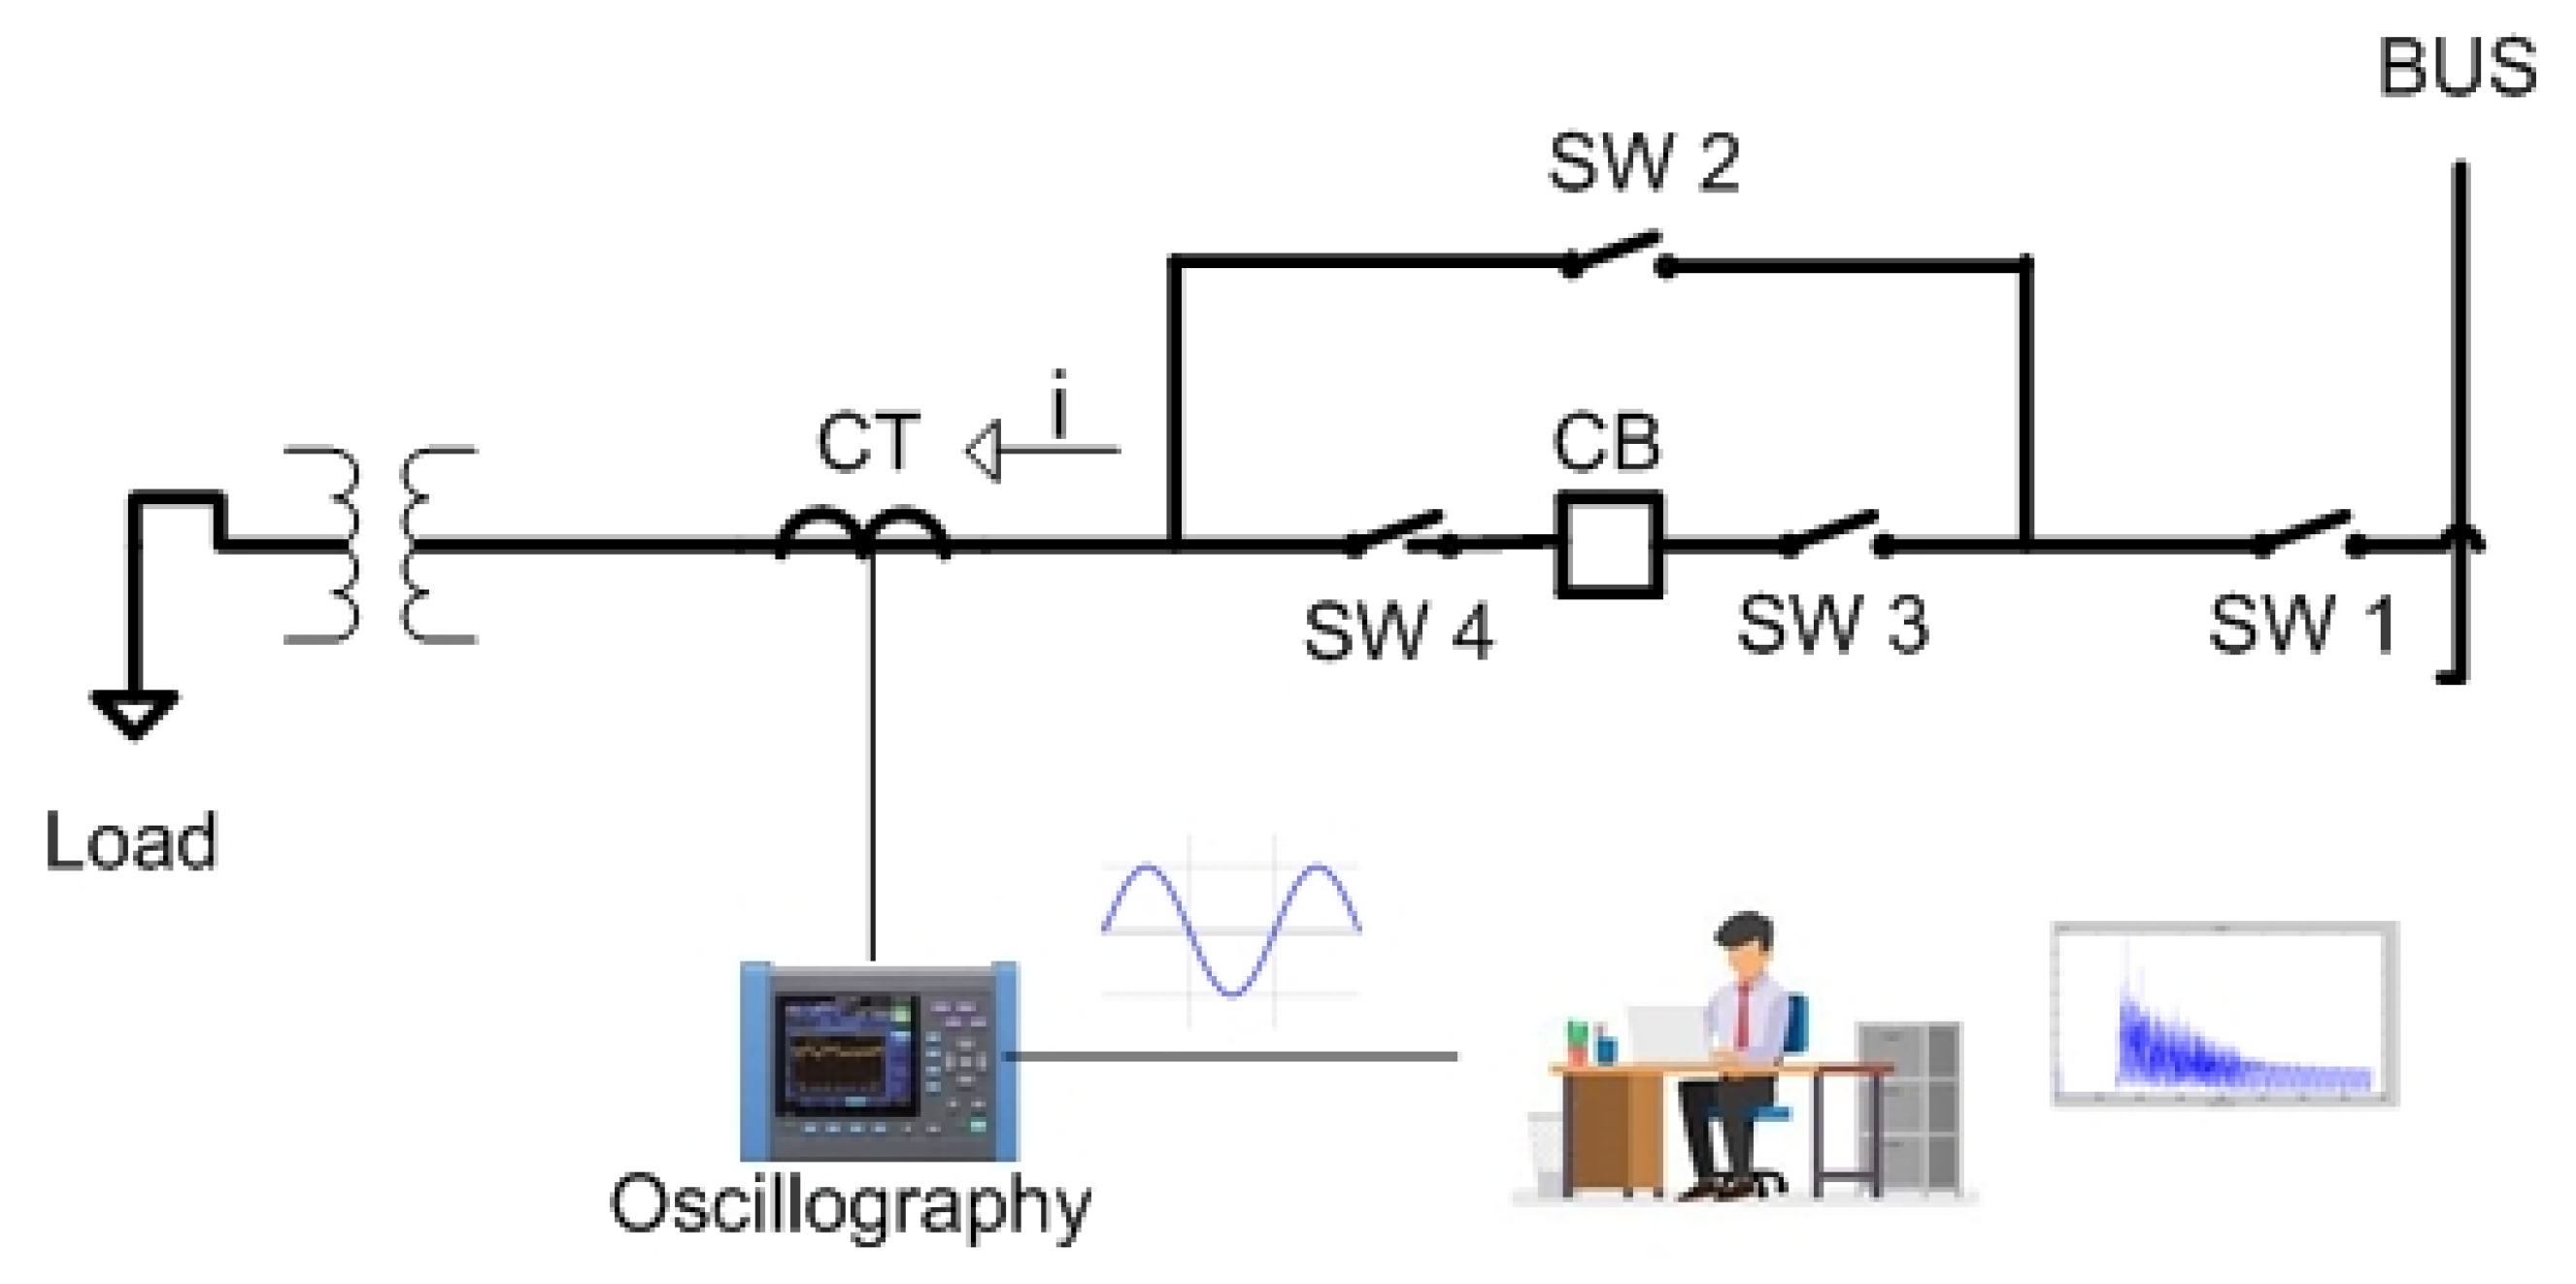
Figure 1. Representation of a typical substation bay connecting a substation electric bus to a power transformer supplying an equivalent load.
Energies 13 05123 g001
Figure 2. Methodology flowchart.
Energies 13 05123 g002
Figure 3. Bench test arrangement using a 200 amp DC current source, a 230 kV circuit breaker, and a power quality analyzer with a DC claw.
Energies 13 05123 g003
Figure 4. Hourly calculated CDI for bay 1 from 8 a.m. 13 March 2020 to 8 a.m. on 14 March 2020. Phases A-B-C are in black, red, and blue, respectively.
Energies 13 05123 g004
Figure 5. Hourly measured load for bay 1 from 8 a.m. on 13 March 2020 to 8 a.m. on 14 March 2020. Phases A-B-C are in black, red, and blue, respectively.
Energies 13 05123 g005
Figure 6. Phases A, B, and C electric current waveforms immediately before the CT winding failure occurrence in phase B.
Energies 13 05123 g006
Figure 7. Phases A, B, and C electric current waveforms immediately before the CT failure occurrence in phase A.
Energies 13 05123 g007
Figure 8. Calculated CDIs for phases A, B, and C for the CT failure in the phase B windings.
Energies 13 05123 g008
Figure 9. Calculated IDCs for phases A, B, and C for the CT failure in phase A.
Energies 13 05123 g009
Figure 10. Hourly calculated CDI for a week-long measurement campaign in a 230 kV substation bay from 13 to 20 February 2020 for phases A-B-C, which are in black, red, and blue. respectively.
Energies 13 05123 g010
Figure 11. Hourly measured load for Bay 1 for a week-long measurement campaign from 8 a.m. on 13 February 2020 to 8 a.m. on 20 February 2020. Phases A-B-C in are black, red, and blue, respectively.
Energies 13 05123 g011
Table 1. CDI calculation for circuit breakers with static resistances equal to 30 and 50 μΩ, respectively.
MeasurementCDI (dB)—CB’s Resistance 30 μΩCDI (dB)—CB’s Resistance 50 μΩ
170.4466.12
270.5666.69
370.6166.71
Table 2. Temperatures and circuit breaker static resistances measurements for Bays 1 and 2, and the corresponding calculated CDIs.
MeasurementTemperature °CCB Res μΩCDI (dB)
Bay 1SW1SW3SW4CTCB
Phase A47.342.042.044.039.570.378.6
Phase B45.142.041.039.040.075.774.01
Phase C38.439.641.238.939.866.287.07
Bay 2
Phase A46.337.942.739.039.962.479.37
Phase B54.040.954.739.240.062.074.02
Phase C39.840.944.039.139.961.986.95