Abstract
Increasing numbers of photovoltaic systems and heat pumps in existing building clusters can lead to an overload of the associated electric grid substations. Based on a multi-agent-based simulation of three building cluster types the impact of building flexibility in regard to the residual substation load is studied. Each building announces its available flexibility, e.g., “heat pump can be switched off/on”. A cluster master coordinator evaluates the incoming offers and decides which offers are accepted in regard to the substation’s capacity utilization. The goal is to honour the substation’s limit by shifting the residual load. This paper presents results from three typical urban building clusters for different penetration scenarios in regard to heat pumps, photovoltaic systems, batteries and electric vehicles. It is shown that in the studied building clusters a high penetration of heat pumps and photovoltaic systems can violate the existing substation’s limits, regardless of the efforts by the master coordinator. Batteries of typical capacities cannot reduce the peak residual load. The load shifting options of the master coordinator are limited.
1. Introduction
Worldwide, the electricity demand is increasing [1]. In 2017, 24% of the electricity consumed in the European Union was used in households [2]. This share will increase, e.g., driven by the replacement of fossil fuel heating systems with heat pumps and the expected shift from combustion engine cars to electrical vehicles [3]. Additionally, electrical grid stability is challenged by the increasing amount of fluctuating renewable energy sources (RES) while the numbers of traditional, controllable power plants decreases. RES are not generally centralized in big power plants (e.g., wind farms) but very often decentralized (e.g., photovoltaic systems on building sites). This changes the traditional unidirectional grid system with power suppliers and consumers to a bi-directional grid system (prosumers, generation and consumption on-site).
In order to support grid stability and to avoid extensive reinforcement of the existing grid, new energy control and storage strategies are necessary. One key for grid support is the use of the energy flexibility of buildings. Single buildings and building clusters can support the grid if they are able to control or shift their loads and production/storage units in a grid friendly way. This is possible with an appropriate demand side management (DSM), e.g., demand respond (DR).
DSM is the concept of influencing consumers’ energy demand in respect to the consumed amount of energy in general and the time dependent consumption behavior. Its goal is changing the load-shape according to the concurrent availability of electricity in the grid [4] or to the current local PV yield. The most common domestic DSM is the intelligent control of household appliances (e.g., washing machines or dishwashers) according to the availability of renewable energies. A well-founded, quantified estimation of the DR flexibility of residential smart appliances (washing machines, tumble dryers, dishwashers, domestic hot water buffers and electric vehicles) can be found in [5]. According to [6,7], only very limited amounts of energy and peak loads can be shifted through the control of domestic electrical appliances. Using thermal storage for DSM purposes would be more promising.
In order to make best use of a building’s energy flexibility (BEF), it is particularly important to identify and characterize its flexibility. Different studies evaluated the potential impact of BEF. For example, a novel DR estimation framework for quantifying flexibility for residential and commercial buildings using thermostatically controlled loads (i.e., HVAC, water heaters and refrigerators) is presented in [8]. In ref. [9] thermal storage tanks for heating and domestic hot water and in [10,11] the thermal building mass are the central elements of the analysis. The need to consider case-study specifics in the use of buildings to ensure the flexibility of the power supply is demonstrated in [12]. The resulting flexibility potential can be used as an instrument to determine the impact or cost-effectiveness of DSM for residential buildings.
Different flexibility factors exists for single buildings e.g., Grid Support Coefficient GSC [13], Relative Import Bill RIB [14], Flexibility Factor FF [15], Energy Flexibility E-flex [16] or Flexibility Index FI [17]. They express the flexibility in regard to price or CO2 emission penalty signals. The factors show the potential of a building for shifting the energy use from high to low price or CO2 emission periods. Flexibility factors for building clusters are given in [18].
Due to the different definitions and quantification methods for energy flexibility, it is difficult to compare the results between such studies. Ref. [3] gives an evaluation of definitions and quantification methodologies. Comparison of methods on a thermal case study shows significant overlap among indicators: the temporal flexibility, the amplitude of power modulation and the associated cost. A data driven model that simulates a generic building cluster is introduced in [19]. The approach can be used to simulate building energy flexibility for district or even regional level energy planning. It is shown that the uncertainty of the energy flexibility decreases when the aggregated number of buildings increases. Different examples of the use of flexibility in buildings is shown in [20].
The management of a building cluster is more complex than for a single building only. A central coordinator is responsible for the DSM of the building cluster. The coordinator collects all the information of the individual buildings states and activation offers and compares the aggregated cluster state with the grid needs. Depending on the optimization objective the coordinator decides which actions take place within the buildings and signals each building its new control strategy. For this a complex management system is needed. Often a multi-agent system (MAS) is used. MAS can be used not only for single building’s energy management, but also for building clusters (smart grids). The agents of a MAS are able to interact with their environment. The agents have means to communicate with each other and to coordinate themselves to reach given targets. Therefore, they can be used for DSM and DR to optimize e.g., the self-consumption or the grid interaction of a building or a building cluster. A wide range of literature is available on the topic. For example, Ref. [21] focuses on the algorithms of MAS which are tested in simulations of a chilled-water cooling system and a direct-expansion air conditioning system in a multi-zone building. A MAS is developed and installed in an existing residential building to control different consumers and production/storage units to avoid grid voltage or frequency drops [22]. A review of MAS in [23] shows their usefulness for smart grids.
The study described in this paper focuses on a MAS-operated smart building cluster. The MAS controls the flexible building loads in order to support the local power substation and is referred to as “SmartStability”. The impact on the substation of different heat pump, PV and battery penetrations is investigated without and with the MAS.
2. SmartStability Methodology
2.1. Overview
SmartStability is a simulation tool developed by three departments of the University of Applied Sciences and Arts Northwestern Switzerland and is based on Java [24]. For this project, the first version described in [25,26] was extended and enhanced. SmartStability simulates load shifting within a building cluster to satisfy the substation limits based on a MAS. The basic methodology is shown in Figure 1. The MAS consists of two main parts: the market coordinator and the agents representing individual buildings. Each building agent individually and independently decides about the sharing of its available flexibilities on a time-step basis. The flexibility is provided by tradable goods, i.e., on/off switching of heat pumps for space heat/domestic hot water (DHW) or electrical DHW boilers and de-/charging of batteries. Non-tradable goods are plug loads/lighting and charging of e-vehicles. If PV yield is available, each building first satisfies its own energy demand, then charges its own available battery and lastly distributes any remaining power within the cluster. The buildings PV surplus is always used within the cluster before adding to the substations residual load.
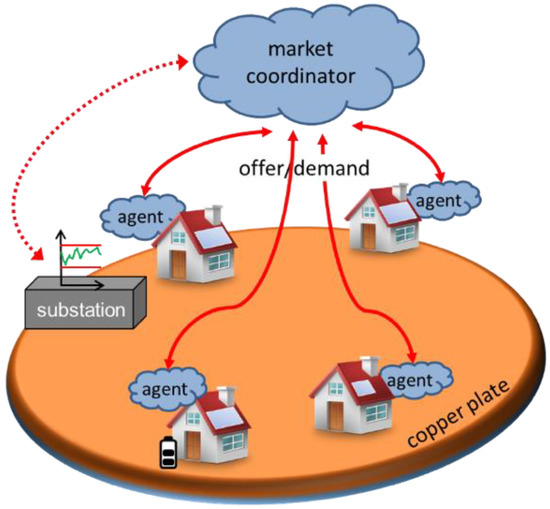
Figure 1.
Basic methodology of SmartStability. Each building acts as an independent agent, the market coordinator strives to keep the residual load in the substations limit. The grid within the building cluster acts like a copper plate [27].
The characteristics of each building, its behavior and flexibility, i.e., supported appliances, can be configured individually. As an example, it can be defined that a building has a PV system and a heat pump, another might have an electrical DHW boiler, a third may have a PV system and a battery. Furthermore, the electricity demand profile for plug loads/lighting can be selected from a wide range and participation in flexibility trading can be set, i.e., in a given cluster of buildings not all buildings necessarily participate in the trading. During the simulation, the building continuously calculates the state of its appliances, i.e., the demand for the heat pump, the temperature of the building (taking solar gains, heat pump action and thermal mass into account), the DHW storage temperature, the state of the battery and the amount of PV yield.
In order to trade flexibilities, each building agent repeatedly sends flexibility offers to the market coordinator. The amount of flexibility which a building agent may offer is calculated based on the characteristics of the available appliances and their current state as well as the building’s needs, such as comfort aspects. For example, if the building will stay in a given temperature range (20–23 °C are used herein) during the next time-step and the heat pump is on, the agent may offer to turn off the heat pump. Vice versa, if the building is getting cold (but not too cold) then the agent might offer to turn the heat pump on. But if the building gets too cold and the comfort limits of the inhabitants are threatened, then the heat pump will be turned on and no flexibility in regard to the heat pump can be offered.
The market coordinator knows about the substation’s utilization and the state of the connected buildings. Based on the chosen optimization strategy and the collected information, the market coordinator selects and accepts flexibility offers by the building agents if needed. The coordinator accepts as many offers as necessary to minimize the deviation reported by the optimization function. Of course, if an offer is accepted, the building agent will control the specific appliance immediately. By doing this, the market coordinator coordinates the DSM of the building cluster. The market coordinator accepts flexibility offers available in a specific order:
- (1)
- All PV production offers are accepted because direct use of locally produced electricity has highest priority.
- (2)
- If the optimization function continues to signal a too-large deviation (e.g., the substation’s utilization is outside its limits) the remaining offers from the buildings are ranked, whereby fixed amounts like heat pumps or electrical DHW boilers come first, battery offers are last.
The ranking is performed based on a number provided by the building agent with each offer. This number is based on a priority value and a risk factor for not fullfilling the comfort requirements. Each tradeable good has a priority value (see Table 1), e.g., the activation of a heat pump has a higher priority than charging the battery. It is assumed that the user is more interested in a warm building than in the batterys’ state of charge. On the other hand, a battery should be empty in the morning in order to be ready to be charged again. The decharging of a battery has priority over deactivating the heat pump. This logic leads to a priority sequence for different goods and their activation.

Table 1.
Tradable goods and their priority value; a lower number reflects a higher priority [26].
This leads to following priority sequence:
- Increase of consumption: 1. boiler on, 2. Heat pump on 3. Battery charging
- Decrease consumption: 1 battery discharging, 2 boiler off, 3. Heat pump off.
In addition to this simple priority sequence the risk of not fullfilling the comfort requirements must be considered. How long can a heat pump keep its current state of operation without jeopardizeing thermal comfort? This risk depends on a time factor. In each time step, the number of time steps is calculated that are needed to heat up/cool down the building and hot water storage until the comfort limit is reached if nothing happened to the activation status of the heat pump. Also, the scope of action for the battery is considered. The combination of priority value and risk factor results in the ranking number which indicates how easy it would be for the building to fulfill the submitted offer. The ranking number y has an inverted porportional approach as shown in Equation (1) [26]:
where b is the priority value according to Table 1, tc the time span of the next cycle and t the time factor. Time span and factor have the same unit, e.g., minutes.
y = b × tc/t
A low number implies a high priority in the ranking. The longer a building can maintain the new status, the lower the ranking number is and vice versa. E.g. turning off the heat pump if the building is warm implies a low ranking number if it takes a long time for the building to cool down. If the building is only slightly warm, it submits its “turn off heat pump” offer with a higher ranking number because less time is left until the heat pump needs to be turned on again. The market coordinator chooses the offers in the sequence from low to high numbers. The off or on status will allways be maintained until the minimum or maximum temperature of the building or DHW storage tank is reached or an offer is accepted.
Each building is modelled with a resistor–capacity model. To characterise the temperature behavior of the buildings heating up and cooling down time, the necessary constants are derived from a seperat thermal building simulation of a typical single family building.
The goal of SmartStability is to investigate the impact on the existing substations of three existing building clusters if the building clusters increase the penetration of heat pumps, batteries and e-vehicles in the future. The MAS is used to keep the residual load in the limits of the existing substations as shown in Figure 2 to avoid reinforcement of these stations. If existing substations can deal with increasing future residual loads, the utility can save costs. This reduces grid costs and environmental impact.
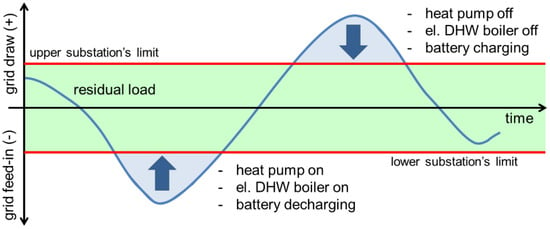
Figure 2.
Trading methodology: heat pumps and electrical DHW boilers are switched off/on and/or the de-/charging of the batteries is initiated in order to honor the load limits of the substation.
2.2. Building Clusters and Scenarios
2.2.1. Cluster Characteristics
In cooperation with an energy supplier three typical building clusters in Basel (Switzerland) are defined. The definitions follow the types introduced in [28], i.e.,
- Type C—one- and two-family houses with low cluster density (see Table 2)
 Table 2. Characteristics of cluster type C.
 - Type E/F—terraced houses with medium cluster density (see Table 3)
 Table 3. Characteristics of cluster type E/F.
 - Type G—high rise multi-family houses and block developments (see Table 4)
 Table 4. Characteristics of cluster type G.
The numbers of houses and apartments, the heated floor area, the dimensions of the initial PV systems and the plug/lighting loads are adapted to reflect real clusters. The number of houses/apartments and their geometries are not changed in the scenarios studied.
2.2.2. Load Profiles
A database of 348 sets of 15-min smart meter profiles from the energy supplier is used for domestic plug loads and lighting. Each unit is randomly assigned a profile from this database. The average basic cluster loads per unit are chosen according to data available from the energy supplier, i.e.,:
- Type C: 3506 kWh/y and unit
- Type E/F: 2174 kWh/y and unit
- Type G: 1517 kWh/y and unit
The hot water tap-profile depends on the user. The basic household types found in Basel are divided into three main categories: approx. 23% households with children, approx. 30% households without children and approx. 47% single person households [29] (see Figure 3). Thirteen different hot water tap-profiles which reflect these household types are generated with the tool from [30] and are also randomly distributed across the units. The basic loads and hot water tap-profiles stay put when once chosen.
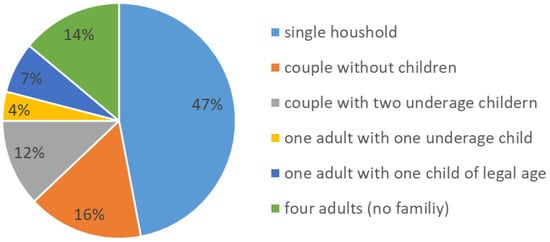
Figure 3.
Household types in Basel [29].
A base or reference scenario and several variants are considered for each cluster type. The scenario “today” is used as the reference scenario and a range of scenarios for the year 2035 with different penetrations of heat pumps, PV systems and batteries are defined. The goal is to analyze likely future residual load profiles at the substations and see if the existing substations can deal with the new challenges or if a reinforcement of the substations may be necessary.
Today, the penetration of heap pumps, PV systems and batteries is very low (see Table 5) and typically 26% of all units use an electrical DHW boiler [31]. For 2035, it is assumed that 50%or 100% of the buildings have a heat pump (40% brine/water, 60% air/water) and electrical DHW boilers are inexistent. Additionally, it is assumed that 80% of the buildings have PV-systems and in one scenario a penetration of 50%with batteries is considered. For type G, the penetrations assumed for 2035 are slightly different due to the low number of buildings. In all 2035 scenarios the penetration with electric vehicles increases [32]. When participation in flexibility trading is set, the trading starts when the residual load exceeds 95% of the substation’s limits. The design load limits for the substations for type C are set to 400 kVA, and for types E/F and G to 630 kVA.

Table 5.
Basic data for different scenarios for type C, type E/F and type G.
Based on the available roof areas and orientations the PV systems are orientated SE, S or SW. The basic assumptions are: 6.5 m2/kWp, ηModul = 18%and ηSYS = 85 %. The slope is 30°. The battery parameters are: max SOC = 98 %, min SOC = 20 %, start SOC = 20 %, charge/discharge loss is 2 %, self-discharge loss is 1 %/month, de-/charge power: 100%max. capacity. Only buildings with a PV system can have a battery. The specific heating demand of all buildings is 35 kWh/(m2 y). It is assumed that all buildings with a heat pump are retrofitted. The hot water tank, served by an electrical boiler or a heat pump, is simulated with an empirical eight-temperature-layer-model based on measurements of a real 300 L tank [26]. The model is extrapolated for a 600 L and 1000 L tank. The heat pumps are simulated with a floating capacity depending on the ambient temperature but limited with a maximum capacity depending on the building size. The average heat pump COPs for air/water are 3.7/2.6 heating/DHW and for brine/water 4.9/2.9 heating/DHW. Climate data of the year 2015 is used for all scenarios. All results are based on 15 min resolution.
3. Results
3.1. Building Cluster Type C
Figure 4 shows the utilization of the substation for type C. Values ± 100% are within the substation’s limits. Values above or below ± 100% are outside the substation’s limits and considered violations. The main findings are:
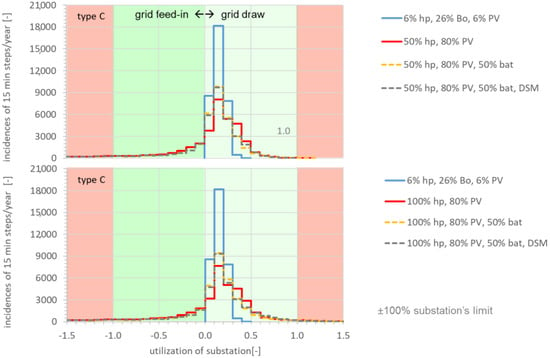
Figure 4.
Type C: substation’s utilization with different heat pump penetrations (top: 50% hp, bottom: 100% hp) [27].
- Today, only grid draw occurs. Feed-in doesn’t exist, the low amount of PV yield is completely used within the cluster. The substation is underutilized.
- Upgrading of PV systems to 80% penetration leads to feed-in overload of the substation.
- The penetration of 50% or 100% heat pumps increases the grid draw. The limit is slightly exceeded with 50% heat pumps and strongly with 100% heat pumps. In both cases the substation limits are violated in regard to the grid draw limit.
- Batteries of the assumed capacity can’t reduce the peak utilizations. The substation remains overloaded at both feed-in and draw limits.
- The trading of flexibility reduces the utilization of grid draw. In case of 50% heat pump penetration, the limit can be met due to trading. In case of 100% heat pump penetration the achieved reduction is not enough to avoid violation of the draw limit.
Three annual substation residual load profiles illustrate the impact of batteries and trading for the scenario “2035: 100% hp” (Figure 5). The substation’s overload for feed-in (<−100%) due to PV surplus only occurs between April and September. Between November and March, the grid draw leads to an overload (>100%) due to no or low PV yield and high demand from the heat pumps. Batteries reduce the utilization of the substation for grid draw during spring, summer and autumn und for feed-in mainly in spring and autumn. They cannot reduce the peak utilization. In the summer, they are full due to high PV yield and in the winter, they are empty because of low PV yield. Thus, the studied battery sizes are not able to contribute to the trading.
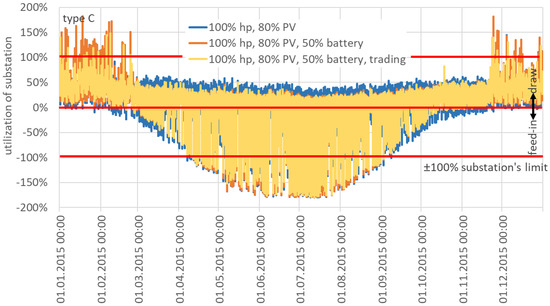
Figure 5.
Different annual residual load profiles of the substation utilization (scenario “100% hp”).
In winter, the trading reduces the utilization of the substation due to the coordination of the heat pump run times for heating and DHW within the cluster. In the summer, the heat pumps only prepare DHW. This means a smaller amount of available tradable energy; at the same time, a large amount of PV yield is available. Therefore, the trading’s impact on the substation’s utilization is higher in winter than in summer but generally only moderate, overall.
The DSM reduces the maximum draw power by about 19% and the maximum feed-in power by about 1%. This mirrors the high DSM impact on the heat pump run time in winter and the low impact in summer due to the high PV yield and low demand for heat pumps. Overall, the yearly residual demand increases by 5% when DSM is active. This shows that grid friendly building behavior can lead to higher overall energy demand.
A detailed view of a winter week is shown in Figure 6. The cluster’s residual load profiles with/without trading are different, because the trading has a large impact on the behavior of the building (top of Figure 6). This is related to the strategy of status change for the heat pumps. The current status is always kept until a critical temperature is reached (house is too cold or too warm) or an offer is accepted (additional set point only when trading is allowed). After a status has changed the status is kept again until a new change is necessary. This leads to different energy profiles of the heat pumps with/without trading (bottom of Figure 6).
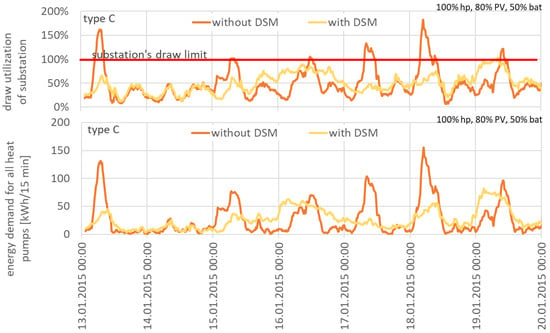
Figure 6.
Detailed view of one week with/without DSM for scenario “100% hp, 80% PV, 50% bat”. Top: residual load at the substation for the whole cluster, bottom: total energy demand for the heat pumps.
The self-consumption and autarky rates of type C change within the cluster’s configurations (Figure 7). The self-consumption rate describes the self-consumed part of the PV-yield and the autarky rate shows which part of the total consumption is covered by the PV-yield. The values reported are also based on a 15 min time resolution. In the scenario “today” with 6% PV penetration the PV yield is completely used (=100% self-consumption) and the autarky rate is very low. The increase of PV penetration shows a reduced self-consumption and an increased autarky rate. The self-consumption rates increase slightly with the increasing heat pump penetration, whereas the autarky rates decrease. Batteries increase both rates. The trading has no impact on the self-consumption and autarky rates because the trading mainly occurs in winter, when the small PV yield is already used.
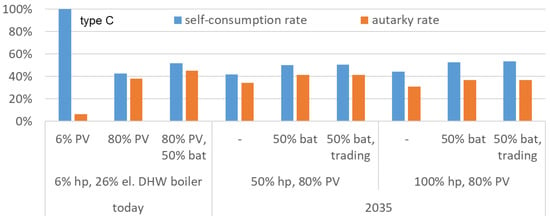
Figure 7.
Self-consumption and autarky rates for type C.
The increase in PV penetration leads to a summer surplus which violates the feed-in limit of the substation in summer. The increased penetration with heat pumps particularly increases the grid draw in winter, thereby violating the draw limit of the substation in winter. The use of batteries with the currently fairly typical dimensions of X kWhuse, bat = X kWpPV scarcely shows an impact on the load peaks of the substation. In winter the batteries are empty most of the time because of a lack of PV yield. In summer the batteries are fully charged most of the time due to an excess of PV yield. The trading mainly reduces the substation’s utilization in winter. The amount of tradable energy is higher in winter than in summer as long as there is a heating load which is covered by the heat pump in addition to the DHW load which basically must be covered both in summer and winter.
Additional simulations show that the substation of type C can be kept in its limits with 50% hp, 45% PV and trading. Upgrading the type C substation to 630 kVA allows honoring the draw limit with the scenario “100% hp, 80% PV, 50% battery and trading”, however the feed-in limit is exceeded albeit on a low level.
3.2. Building Cluster Type E/F
The utilization of the substation for type E/F is shown in Figure 8. The utilization for grid draw for the scenarios “today” and “50% hp” is basically the same because the demand by 50% hp corresponds to the demand of 6% hp and 26% electrical DHW boilers. The penetration with 80% PV increases the grid feed-in, however the substation’s limit can still just be honoured. Overall, no trading is necessary in this scenario. The increase to 100% hp penetration leads to a breach of the grid draw limit. Although trading reduces the peak draw the limit is still exceeded. In analogy to type C, batteries reduce the amount of grid draw and feed-in but they cannot reduce the peak loads and thus also not the peak utilization of the substation.
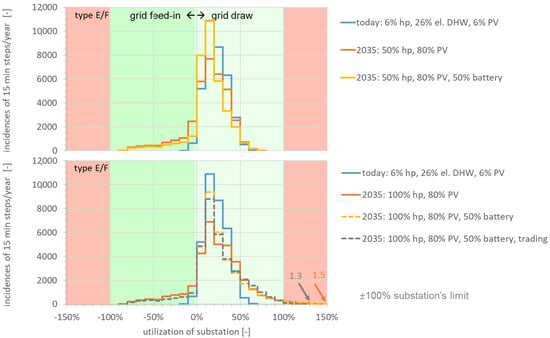
Figure 8.
Type E/F: substation’s utilization with different heat pump penetrations (top: 50% hp, bottom: 100% hp).
The self-consumption and autarky rates of type E/F show the same behaviour as type C (Figure 9). Today the PV-yield is nearly fully used within the cluster and the autarky rate is low. With the increase of PV the self-consumption rate decreases and the autarky rate increases. As the demand for 50% hp corresponds to the demand of 6% hp and 26% electrical DHW boilers the self-consumption and autarky rates stay the same. The higher demand for 100% hp increases the self-consumption rate and reduces the autarky rate. The trading does not change the self-consumption and autarky rates because in winter when the main trading part occurs only a low PV yield is available. Additional simulations show that a penetration of 70% hp does not lead to a breach of the draw limit.
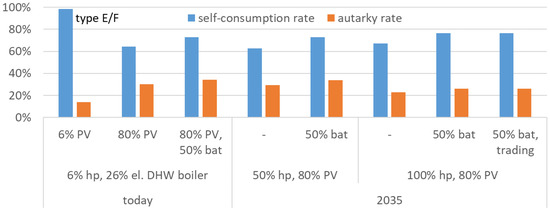
Figure 9.
Self-consumption and autarky rates for type E/F.
The increase in PV penetration to 80% PV is found to be uncritical but the substation’s feed-in limit is nearly reached. The substation cannot cope with an additional increase in PV penetration. The substation’s draw limit is honoured for a penetration of up to 50% hp but is exceeded for a penetration of 100% hp. Trading can slightly reduce the peak draw but not enough to meet the limit. Like type C, the use of batteries scarcely shows an impact on the substation’s load peaks, but they increase the self-consumption and autarky rates of the cluster.
3.3. Building Cluster Type G
Today, the cluster type G neither contains heat pumps nor PV. Therefore, only grid draw occurs (Figure 10, top). If roof top PV systems are installed, only a small amount of feed-in appears, because the PV yield is low compared to the demand. With 100% hp penetration the draw limit is slightly exceeded. This can be adjusted with trading (Figure 10, bottom). Figure 11 shows the self-demand and autarky rates for different scenarios. The results reflect that the PV yield is low compared to the demand. This is also the reason that batteries have no impact. Most of the PV yield is used immediately. The self-consumption rate increases slightly with the increasing hp penetration because of the higher demand. The autarky rates do the opposite.
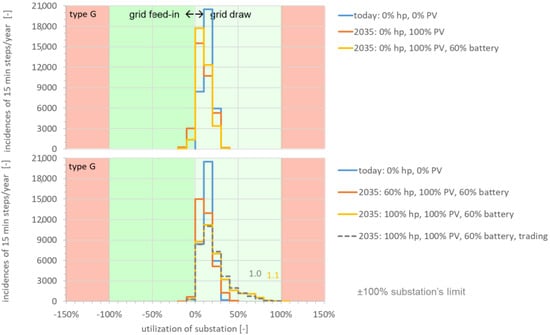
Figure 10.
Type G: substation’s utilization with different heat pump penetrations (top: 0% hp, bottom: 60/100% hp).
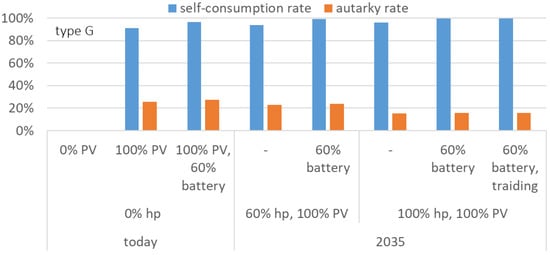
Figure 11.
Self-consumption and autarky rates for type G.
The increase in PV penetration is uncritical for the substation and therefore possible. The maximum number of heat pumps leads to a marginal breach of the substation’s draw limit, which can be adjusted by trading.
4. Conclusions, Limitations and Further Work
4.1. Conclusions
The impact of three different building clusters on the grid substation network caused by a future increase in the number of heat pumps and local PV systems is presented. The results given are based on multi-agent-simulations and the feasibility of avoiding an overload of the substations by introducing batteries and demand side management (trading) within the buildings is studied. The building agents give offers to the market coordinator in regard to their possible load flexibility. The market coordinator uses the offers to fulfill the needs of the substation. The simulated clusters are modelled to reflect real clusters.
The cluster type C mainly consists of single-family houses with low cluster density and large PV systems and shows the greatest restrictions. The feed-in limit of the substation is exceeded due to the large PV systems and correspondingly high PV yield. The draw limit is reached when only 50% of the buildings use heat pumps and demand side management is used.
The substation’s situation for cluster type E/F with terraced single- and multi-family dwellings with medium cluster density is less critical. The considered PV size increase does not induce problems in regard to feed-in because the PV yield remains moderate compared to the demand. The substation is utilized to capacity but not overloaded. It is found that up to 70% heat pump penetration is possible for cluster type E/F without the risk of a substation draw overload.
Cluster type G includes high rise buildings and block developments. Increasing the size of PV systems does not lead to a problem and 100% heat pump penetration is possible if demand side management is used. Type G is found to be least critical.
The building clusters studied provide limited options for using flexibility. In summer, the PV yield is generally high and the shiftable energy low, because only the energy for DHW is available for flexibility. In the winter, the amount of shiftable energy is usually higher than in summer due to the additional heating load. However, there is distinctly less PV yield available.
The impact of the market coordinator’s energy management only manifests itself in winter. The heat pumps can be switched off when the substation’s draw limit is threatened and switched on when there is no risk. The coordinator is able to reduce the violations of the substation’s draw limit, but only in case of small violations.
In general, batteries of a currently typical capacity cannot alleviate the peak residual loads and can hardly be activated by the market coordinator. In summer, the batteries are fully charged most of the time, because of the high PV yield and it is not possible to fully discharge them overnight. On the other hand, only a low PV yield is available in winter, which is not sufficient to charge the batteries. Most of the time, the batteries are empty, therefore.
The results clearly show that the options of the market coordinator’s management are limited. The existing substations for types C and E/F need reinforcement if the penetration with heat pumps and/or PV systems increases significantly. The situation of the type C substation is the most critical one, but the substation is also the smallest of the three considered clusters.
The results assist energy suppliers to keep their attention on the future development of existing building clusters.
4.2. Limitations and Further Work
The SmartStability approach has some limitations which must be addressed in future research in regards to the usage of available flexibility within building clusters. The modelling of buildings, technical equipment, flexibility of loads and exchange within the cluster are simplified and the control strategy options are limited. Nevertheless, the approach gives appropriate answers. Refinement of the model will entail using more detailed thermal building models, load management possibilities and coupling the buildings with a detailed grid model to take possible local issues into account, i.e., voltage and capacity effects. Areas of future interest include but are not limited to the impact of grid-coupled batteries, cluster PV installations and cluster batteries. Also, not only the technical development of existing buildings needs attention. Increasing cluster density e.g., by adding levels to existing buildings can also lead to issues for existing substations. This is a further topic which is to be addressed with the refined model.
Author Contributions
Development, simulation, analysis of data and writing—original draft, M.H.; supervisor and writing—review and editing, A.G. All authors have read and agreed to the published version of the manuscript.
Funding
The work described in this paper was funded by the Environment and Energy Agency of the city of Basel in the frame of “Program 2013–2016 2000-Watt-Society Pilot Region Basel” within the project “SmartStability: grid friendly building clusters with battery storages [33]”. Part of the underlying work was done in a partner project funded by the Swiss Federal Office of Energy SFOE under contract number BFE SI/501240 as a contribution to IEA Annex 67 Energy Flexible Buildings.
Acknowledgments
We would like to thank Holger Wache and his team from the School of Business, University of Applied Sciences and Arts Northwestern Switzerland for the bespoke code adaptations of SmartStability.
Conflicts of Interest
The authors declare no conflict of interest.
References
- International Energy Agency IEA, “Electricity”. 2019. Available online: https://www.iea.org/weo2018/electricity/ (accessed on 21 June 2019).
- Eurostat, “Energy Consumption in Housholds”. 2019. Available online: https://ec.europa.eu/eurostat/statistics-explained/index.php/Energy_consumption_in_households#Energy_consumption_in_households_by_type_of_end-use (accessed on 21 June 2019).
- Reynders, G.; Amaral Lopes, R.; Marszal-Pomianowska, A.; Aelenei, D.; Martins, J.; Saelens, D. Energy flexible buildings: An evaluation of definitions and quantification methodologies applied to thermal storage. Energy Build. 2018, 166, 372–390. [Google Scholar] [CrossRef]
- Müller, D.; Monti, A.; Stinner, S.; Schlösser, T.; Schütz, T.; Matthes, P.; Wolisz, H.; Molitor, C.; Harb, H.; Streblow, R. Demand side management for city districts. Build. Environ. 2015, 91, 283–293. [Google Scholar] [CrossRef]
- D’hulst, R.; Labeeuw, W.; Beusen, B.; Claessens, S.; Deconinck, G.; Vanthournout, K. Demand response flexibility and flexibility potential of residential smart appliances: Experiences from large pilot test in Belgium. Appl. Energy 2015, 155, 79–90. [Google Scholar] [CrossRef]
- Arteconi, A.; Hewitt, N.J.; Polonara, F. State of the art of thermal storage for demand-side management. Appl. Energy 2012, 93, 371–389. [Google Scholar] [CrossRef]
- Hall, M.; Dorusch, F.; Geissler, A. Optimierung des Eigenverbrauchs, der Eigendeckungsrate und der Netzbelastung von einem Mehrfamiliengebäude mit Elektromobilität. Bauphysik 2014, 36, 117–129. [Google Scholar] [CrossRef]
- Yin, R.; Kara, E.C.; Li, Y.; DeForest, N.; Wang, K.; Yong, T.; Stadler, M. Quantifying flexibility of commercial and residential loads for demand response using setpoint changes. Appl. Energy 2016, 177, 149–164. [Google Scholar] [CrossRef]
- Stinner, S.; Huchtemann, K.; Müller, D. Quantifying the operational flexibility of building energy systems with thermal energy storages. Appl. Energy 2016, 181, 140–154. [Google Scholar] [CrossRef]
- Hoffmann, C.; Hall, M.; Geissler, A. Quantifying Thermal Flexibility of Multi-Family and Office Buildings. In Proceedings of the Building Simulation and Optimiziation BSO, Cambridge, UK, 11–12 September 2018; pp. 230–236. [Google Scholar]
- Johra, H.; Heiselberg, P.; Le, J. Energy & Buildings Influence of envelope, structural thermal mass and indoor content on the building heating energy flexibility R. Energy Build. 2019, 183, 325–339. [Google Scholar]
- Aduda, K.O.; Labeodan, T.; Zeiler, W.; Boxem, G.; Zhao, Y. Demand side flexibility: Potentials and building performance implications. Sustain. Cities Soc. 2016, 22, 146–163. [Google Scholar] [CrossRef]
- Klein, K.; Herkel, S.; Henning, H.-M.; Felsmann, C. Load shifting using the heating and cooling system of an office building: Quantitative potential evaluation for different flexibility and storage options. Appl. Energy 2017, 203, 917–937. [Google Scholar] [CrossRef]
- Dar, U.I.; Sartori, I.; Georges, L.; Novakovic, V. Advanced control of heat pumps for improved flexibility of Net-ZEB towards the grid. Energy Build. 2014, 69, 74–84. [Google Scholar] [CrossRef]
- Le Dréau, J.; Heiselberg, P. Energy flexibility of residential buildings using short term heat storage in the thermal mass. Energy 2016, 111, 991–1002. [Google Scholar] [CrossRef]
- Weiss, T.; Rüdisser, D.; Reynders, G. Tool to Evaluate the Energy Flexibility in Builings—A Short Manual 2019; Tobias Weiß, AEE INTEC: Gleisdorf, Austria, 2019. [Google Scholar]
- Junker, R.G.; Azar, A.G.; Lopes, R.A.; Lindberg, K.B.; Reynders, G.; Relan, R.; Madsen, H. Characterizing the energy flexibility of buildings and districts. Appl. Energy 2018, 225, 175–182. [Google Scholar] [CrossRef]
- Vigna, I.; Pernetti, R.; Pasut, W.; Lollini, R. New domain for promoting energy efficiency: Energy Flexible Building Cluster. Sustain. Cities Soc. 2018, 38, 526–533. [Google Scholar] [CrossRef]
- Wang, A.; Li, R.; You, S. Development of a data driven approach to explore the energy flexibility potential of building clusters. Appl. Energy 2018, 232, 89–100. [Google Scholar] [CrossRef]
- Participants of IEA ECB Annex 67. Examples of Energy Flexibility in Buildings; Jensen, S.Ø., Parker, J., Engelmann, P., Marszal, A.J., Eds.; Danish Technological Institute: Taastrup, Denmark, 2019; Available online: www.annex67.org (accessed on 17 July 2020).
- Cai, J.; Kim, D.; Jaramillo, R.; Braun, J.E.; Hu, J. A general multi-agent control approach for building energy system. Energy Build. 2016, 127, 337–351. [Google Scholar] [CrossRef]
- Karfopoulos, E.; Tena, L.; Torres, A.; Salas, P.; Joan, J.G.; Dimeas, A.; Hatzuargyrioi, N. A multi-agent system providing demand response services from residental consumers. Electr. Power Syst. Res. 2015, 120, 163–176. [Google Scholar] [CrossRef]
- Merabet, G.H.; Talei, H.; Abid, M.; Khalil, N.; Madkour, M.; Benhaddou, D. Applications of Multi-Agent Systems in Smart Grids: A survey. In Proceedings of the International Conference on Multimedia Computing and Systems (ICMCS), Marrakech, Morocco, 14–16 May 2014; pp. 1088–1094. [Google Scholar]
- JADE Java Agent Development Framework. Available online: http://jade.tilab.com (accessed on 28 September 2020).
- Schulz, N.; Bichsel, J.; Wache, H.; Atisam, F.A.; Hoffmann, C.; Lammel, B.; Mettler, F. Smart Stability—Market-Economic Interaction of Smart Homes for Improved Power Network Stability. In Proceedings of the CISBAT Conference, Lausanne, Switzerland, 9–11 September 2015; pp. 487–492. [Google Scholar]
- Bichsel, J.; Eichin, H.; Farooq, A.; Hoffmann, C.; Lammel, B.; Schulz, N.; Wache, H. SmartStability—Smart Homes Improvimg Power Network Stability; Abschlussbericht Strategische Initiative “SmartStability”, Fachhochschule Nordwestschweiz: Muttenz/Olten/Windisch, Switzerland, 2015; Available online: www.fhnw.ch (accessed on 28 September 2020).
- Hall, M.; Geissler, A.; Wache, H. Multi-agent based simulation of smart building cluster for electric grid stabilization. J. Phys. Conf. Ser. 2019, 1343, 1–6. [Google Scholar] [CrossRef]
- Scheffler, J. Bestimmung der Maximal Zulässigen Netzanschlussleistung Photovoltaischer Energiewandlungsanlagen in Wohnsiedlungsgebieten. Ph.D. Thesis, Technische Universität Chemnitz, Chemnitz, Germany, 2002. [Google Scholar]
- Privathaushalte und Wohnbevölkerung nach Haushaltstyp; Statistisches Amt des Kantons Basel-Stadt: Basel, Switzerland; Available online: www.statistik.bs.ch (accessed on 28 September 2020).
- Pflugradt, N. LoadprofileGenerator. Available online: www.loadprofilegenerator.de (accessed on 16 June 2015).
- Nipkow, J. Elektrische Wassererwärmung in der Schweiz; Schlussbericht BFE SI /400951-01; ARENA Arbeitsgemeinschaft Energie-Alternativen: Zürich, Switzerland, 2013; Available online: https://ubdb.bfe.admin.ch (accessed on 28 September 2020).
- Siegrist, A.; Schnabl, P.; Burkart, S.; de Haan, P.; Bianchetti, R. Elektromobilität—Studie Ladeinfrastruktur Region. Basel; Amt für Umwelt und Energie: Basel, Switzerland, 2014. [Google Scholar]
- Hall, M.; Geissler, A. SmartStability: Netzdienliche Quartiere mit Stromspeicher; FHNW Institut Energie am Bau: Muttenz, Switzerland, 2019. [Google Scholar]
© 2020 by the authors. Licensee MDPI, Basel, Switzerland. This article is an open access article distributed under the terms and conditions of the Creative Commons Attribution (CC BY) license (http://creativecommons.org/licenses/by/4.0/).
