Article

Sensitivity Study of Greitzer Model Based on Physical System Parameters of Radial Compressing Units

by
Andrzej Jaeschke
* and
Grzegorz Liśkiewicz
Institute of Turbomachinery, Lodz University of Technology, Wolczanska 219/223, 90-924 Lodz, Poland
*
Author to whom correspondence should be addressed.
Energies 2020, 13(19), 5111; https://doi.org/10.3390/en13195111
Submission received: 7 September 2020 / Revised: 21 September 2020 / Accepted: 24 September 2020 / Published: 1 October 2020
(This article belongs to the Section F: Electrical Engineering)

Abstract

:
Centrifugal compressors are key elements of energy systems and industrial installations including fluid flow. Their operating range is strictly limited by the surge phenomenon. The Greitzer model is a known way of simulating the compressor’s behaviour at the surge. In this paper, the parametric study of different versions of the Greitzer model is conducted. There are several versions of this model that include 4 to 2 equation models. The system behaviour depends on the features of the compressor itself as well as of the plenum. In this paper, all terms connected with the compressor were grouped into the “Co” parameter, while those associated with the plenum were grouped into the “Pl” parameter. The study shows how each component influences the system stability. The comparison of analytical data with experimental results allowed to draw conclusions regarding the way of choosing the model parameters that provide the best simulation of the real system behaviour. The study shows that the system is well simulated by a model with relatively large values of the L c parameter. The length of the compressor parameter L c = 3.57 m was performing well for the machine with impeller radius 0.33 m. Possible explanations of this finding are presented and compared to the state of the art. This result may provide possible help in adjusting the model parameters for other machines and designing reliable anti-surge systems based on the Greitzer model suited to energy conversion systems.

1. Introduction

1.1. Unstable Phenomena in Radial Compressing Units

Centrifugal compressors are widely used in a variety of industries. Their key applications include heavy industry, transport, energy sector, home appliances, and others [1]. In most cases, the stable operation of the compressor is crucial for the undisturbed performance of the entire system including connected network and related machinery. The occurrence of the flow instabilities influences the entire system leading to the drop in the efficiency or, in the more severe cases, to the compressor failure causing significant financial losses. Therefore, the research concerning those phenomena and their avoidance is indispensable.
The operation of the radial compressor becomes unstable when the mass flow rate is decreased below a certain critical value. Emmons et al. [2] was one of the first to identify and analyse the unstable phenomena in the centrifugal compressors. An extensive overview of the research on this topic can be found in [3]. Two main unstable phenomena have been identified: the surge and the rotating stall. The former refers to global flow fluctuations in the axial direction. The latter is a phenomenon of the formation of vortex structures that travel along the circumference—so-called stall cells [4].
Those states can be identified as forms of natural fluid oscillation. In stable operation, damping forces are strong enough to suppress the oscillations, while in the unstable regime the damping is too weak to suppress them and unstable phenomena are amplified and affect the machine [5,6].

1.2. Greitzer Model of the Surge Phenomenon

The surge causes a high risk of damage of the compressor. The effort of researchers has been therefore focused on the development of reliable mathematical models of this phenomenon. In 1976, Greitzer introduced the mathematical model of unstable behaviour of compressing units [7] and verified it empirically [8]. Although Greitzer initially introduced the model for axial compressors only, it was also proven by Hansen et al. to be valid for centrifugal machines [9]. Later, a development towards the model variation capable of capturing the shapes of fully formed transients has been made by Moore and Greitzer [4,10].
Although the Greitzer model has many simplistic assumptions, it has been commonly used for numerical investigation of the surge. This model can be also considered to be a milestone and the basis for the development of enhanced models tuned for particular applications. Despite 45 years of history, the Greitzer model is still an active research interest for scientists all over the world and is widely used for the development of anti-surge systems and investigation of unstable behaviour of compressors. Meuleman et al. [11], Fink et al. [12] and Van Helvoirt et al. [13] used the model for throughout analysis of the stability of the radial compressors. The anti-surge system for radial compressors based mainly on the Greitzer model was proposed by Willems [14]. Works of Yoon et al. [15] as well as Van Helvoirt [13] and De Jager [16] were focused on incorporating the pipeline dynamics and acoustics into the model. The most recent works on the topic include: the development of parameter identification method by Backi et al. [17] or a generalization of a Moore-Greitzer model for ducted fans in near ground conditions by Jin et al. [18]. Although most attempts to surge modelling are largely based on the Greitzer model, there are other approaches not directly inheriting from it, for example, the one presented by Cousins and Davis in [19].
The simplicity of the Greitzer model, despite its advantages connected with low computational costs, limits its applicability as a surge line prediction tool. Accurate prediction of the surge onset point can be done with different methods including experiment [20] or computational fluid dynamics simulation. Such simulations for the surge and the rotating stall phenomena were performed by Sundström et al. [21], Yang et al. [22] or Kulak et al. [23]. Even this method also needs additional developments for a better surge line prediction. Liu et al. implemented a hybrid viscous body force model [24], while Huang et al. developed a 1D-3D coupled method to simulate the surge [25].
Greitzer model mimics the compression system with three interacting components: compressor, plenum, and throttle. The system is an open cycle. The conditions at the inlet to the compressor and at the outlet of the throttle are ambient. The simplified compressing system according to Greitzer is depicted in Figure 1. Plenum is a model representation of all pipelines and containers behind the compressor in the industrial system, while the throttle is a model representation of all outlet network resistance combined with losses in other network components. The compressor and the throttle are defined as pipes (with actuator disks) of lengths L c and L t and cross-sections A c and A t , respectively. The plenum is defined as a container and characterized by its volume V p . Pressure p at each component and mass flow rates m ˙ at compressor and throttle are the physical variables in time t. This results in the ordinary differential equation system. Additional assumptions of the Greitzer model are listed below [26]:
  • The flow within pipes is incompressible, inviscid, and one dimensional
  • Compression in the plenum is isentropic
  • The temperature is constant in the entire system
  • The pressure in the container is uniform
  • Valve is quasi-static
  • Gravity forces are neglected
The Greitzer model is a system of four ordinary differential equations, where the first three are resulting from conservation laws of mass and momentum for all three components of the system. The fourth equation is responsible for the response delay of the compressor. The Greitzer model [7] in the non-dimensional form reads (subscripts c, t, p denote the system components: compressor, throttle, and plenum, respectively; notation adopted from [27]):
d Φ c d t ^ = B ( Ψ c Ψ p )
d Φ t d t ^ = B G ( Ψ p Ψ t )
d Ψ p d t ^ = 1 B ( Φ c Φ t )
d Ψ c d t ^ = 1 η ( Ψ c , s s Ψ c )
where the following coefficients are applied:
  • Non-dimensional mass flow rate coefficient:
    Φ = m ˙ ρ a U t i p A c
  • Non-dimensional pressure rise coefficient:
    Ψ = 2 Δ p ρ a U t i p 2
  • Non-dimensional time coefficient:
    t ^ = t f h 2 π
  • Model parameters:
    B = U t i p 4 L c f h π
    G = A c L t A t L c
    η = N s π D 2 2 B L c
  • Compressor steady state pressure rise coefficient Ψ c , s s .
with ρ a denoting gas density, U t i p —impeller trailing edge speed, Δ p —pressure rise on a component, D 2 —rotor outlet diameter. f h is the Helmholtz resonator frequency [7]:
f h = 1 2 π a a A c V p L c
a a denotes the speed of sound, N s - number of rotations of the rotor needed for the rotating stall to form. There were several values used in the literature including N s = 0 [8], N s = 0.5 [9] and N s = 2 [11].
N s = 0 is, in fact, equivalent to not including the equation in the model. In the case of radial compressors, it is a common practice to omit this equation and limit the applicability of the model to the investigation of the surge phenomenon only. The rotating stall phenomenon in this class of compressors is more complex and this single equation does not provide a close simulation of its behaviour [11,13,26].
It is a widely used approach to additionally simplify the model by removing the equation describing the throttle dynamics. Such a solution is applied in the situation when the length of the throttle is negligible compared to other dimensions of the system. Then the value of G parameter is insignificantly small, which implies almost instant response of the throttle. As the time of response is infinitesimal, the second equation can be removed [15,28,29]. This approach reduces the number of equations to 2 and the set of model parameters to only B and f h .
The Greitzer model is not free from limitations. The meaning of model parameters: B, f h as well as the link between them and the geometry of the system, although theoretically defined, is vague for more complex systems. As reported by van Helvoirt et al. [13] the discrepancies between the physical parameters of the system and model parameters are significant and require further study. The most questionable are values of L c parameters that are often reported to be significantly larger than a physical length of the compressor duct [9].
One of the common solutions of this problem is to fit the model parameters to provide the best reproduction of the surge experimental data [9,12,26]. However, the large power systems cannot surge safely even for a short time. Without the surge pressure signal measured at a given machine, the signal fitting is not available. Therefore, without a deep understanding of the method of model parameters evaluation, the Greitzer model becomes ineffective for surge control.
Even though the Greitzer model is known for many years, there is still not much knowledge regarding the mapping between model parameters and physical parameters of the system. In a recent study conducted by Ng et al. [30] the dependency of the model on its parameters was determined with the Taguchi method. This approach provides an insight into the importance of the parameters governing the model. It is still an open question, how the model parameters are connected with the physical features of the centrifugal compressor and the compression system.
The standard non-dimensional form of the Greitzer model describes the properties of the system with the use of implicit parameters such as B or f h . This approach, although beneficial from the point of view of the generality, combines the physical parameters of different components of the compression system (compressor, plenum, and throttle) into a single parameter. For example, the B parameter depends on the compressor rotor tip speed, length of the compressor, and Helmholtz resonator frequency. The last one is clearly a function of plenum geometry. Considering parameters that describe each component separately would be helpful for a better understanding of the role of component parameters. Moreover, it would help to investigate the behaviour of different components in the analyzed system, for example, the same compressor connected to different ducts and throttles. Therefore, this paper presents a sensitivity study of the Greitzer model with respect to the component parameters rather than implicit non-dimensional parameters.

1.3. The Aim of the Study

The goal of this paper is to perform the systematical sensitivity study of the Greitzer model allowing investigating the influence of different elements of the compressor system on the model behaviour. The test includes the most popular variants—the two-equation form and the ones taking into consideration the dynamics of the valve and the response delay of the compressor. The investigation is performed with physical parameters of the compression system rather than the model parameters themselves. Therefore, the following parameters were introduced— C o , P l and T h . Those parameters group the features of each component of the compression system: compressor, plenum, throttle. Together with the N parameter, they formed the set of sensitivity study parameters. Clearly, the physical parameters are implicitly involved in the model parameters and the non-dimensionalization of operation parameters. Therefore, the results are presented in the dimensional form to capture the real influence of the physical parameters of the system on its physical dynamic behaviour. The obtained results are compared with the experimental data.

2. Methods

2.1. Investigated System

The sensitivity study was performed for the DP1.12 blower test stand described by Liskiewicz et al. [31]. It is necessary to consider a particular machine in the sensitivity study to provide the compressor operation curve. The best fit model parameters for experimental data collected at this test stand, computed and presented by Grapow in [26], are used for reference.
It is worth underlining that the system physical parameters such as dimensions are fixed for the considered test stand. In the numerical model, they are, however, varied for the sensitivity study. This is possible and meaningful due to the aforementioned vague connection between physical model parameters used by Greitzer. For example, the L c parameter and the physical length of the compressor do not always hold the same value [13].
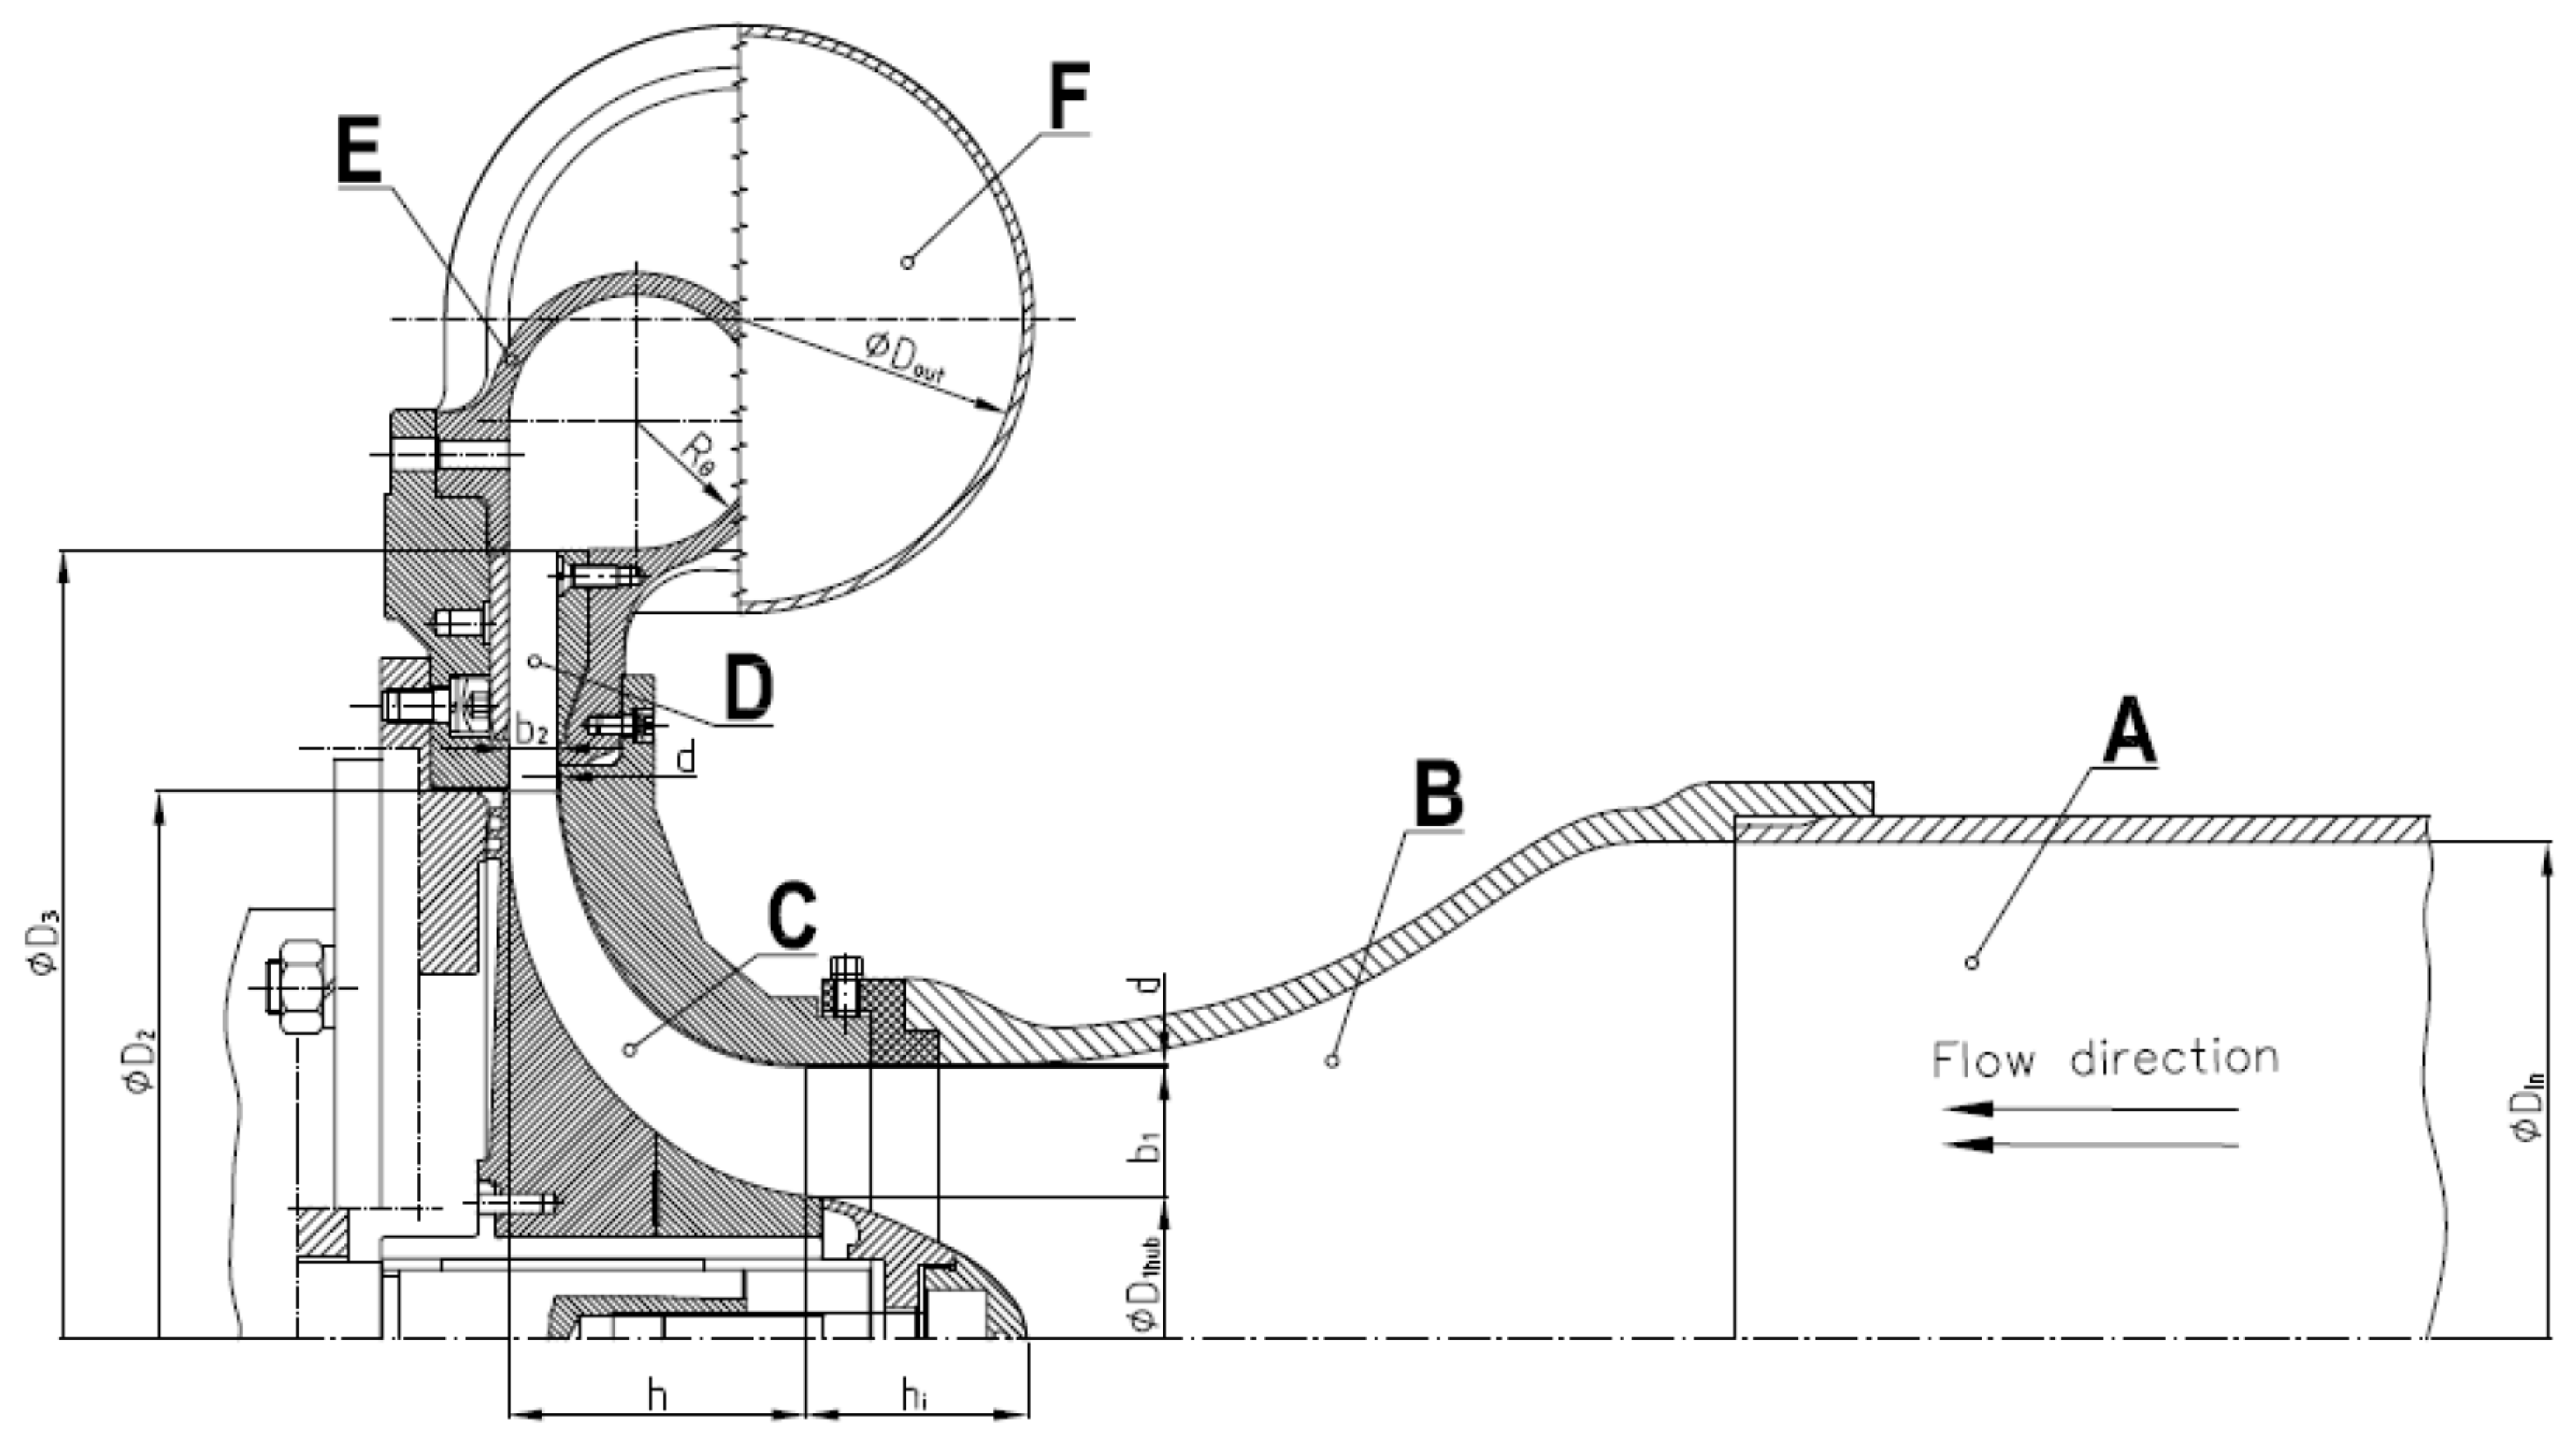
The test stand cross-section together with its main dimensions is presented in Figure 2. The air enters the system through the inlet pipe (A). Then the flow is accelerated in the Witoszynski nozzle (B). The impeller (C) is located behind the nozzle. From impeller, the flow enters a vane-less diffuser (D) and after that a circular volute (E). The outlet pipe is ended with the throttling valve. Table 1 presents the most important dimensions of the system.
The compressor was driven by an asynchronous AC motor (400 V/15 kVA). Although the design point of the blower was at mass flow rate m ˙ = 0.8 kg/s and pressure ratio P R = 1.12 , the blower was operated at lower rotational speed of f r o t = 100 Hz, with nominal mass flow rate m ˙ n = 0.75 kg/s and pressure ratio P R = 1.08 , to avoid impeller damage during the investigation of unstable operation. Although this pressure ratio is relatively low, especially for the radial compressors, in the original experiment by Greitzer [7] a compressor with a pressure ratio 1.07 was used. The operational impeller tip speed was equal to U t i p = 103 m/s. The impeller had z = 23 blades, which corresponds to the blade passing frequency of f B P = 2.3 kHz during the operation. The volume of the outlet pipe, being a plenum, was equal to V o u t = 0.0968 m 3 .
The position of the throttling valve placed at the end of the outlet pipe was described by the dimensionless throttle opening area parameter (TOA). TOA = 0 % corresponds to a fully closed valve, while TOA = 100 % corresponds to a fully open valve. For the sake of consistency of notation, the same parameter will be used to denote the operation point of the compressor.

2.2. Sensitivity Study Procedure

The simulations of the unstable phenomena were conducted using different versions of the model. They will be presented in the following subsections.

2.2.1. Two-Equation Model

The first considered version of the model is the one taking into account both simplifications mentioned in Section 1.2. The following system of two ordinary differential equations describing the dynamics of the compressor and the plenum is obtained:
d Φ c d t ^ = B ( Ψ c ( Φ c ) Ψ t )
d Ψ t d t ^ = 1 B ( Φ c Φ t ( Ψ t ) )
where the dependencies Ψ c ( Φ c ) and Φ t ( Ψ t ) are defined by the compressor performance curve and the throttle resistance curve, respectively. It is a general approach to model throttle response by a quadratic function [28]:
Ψ t = k Φ t 2
with k being chosen in a way that the curve crosses with the compressor operation curve at the considered stationary point of operation. The inverse of this relation provides the Φ t ( Ψ p ) relation. The DP1.12 compressor operation curve was elaborated based on experimental measurements presented in [31]. The applied curve fitting procedure was described in detail by Grapow et al. in [26]. It was shown there that the fourth order polynomial has significant advantages over third order polynomials widely used for the estimation of compressor operation curves. The compressor operation curve reads:
Ψ c = 13.6869 Φ c 4 26.3798 Φ c 3 + 11.0626 Φ c 2 + 0.85
The dependency of mass flow rate m ˙ on T O A is given by an experimental relation proposed and described by Liskiewicz in [27]. It reads:
m ˙ = 0.0943 · TOA 0.5758
The sensitivity analysis was done with respect to two parameters describing the components of the compression system introduced here. The model parameters B and f h depend on a list of system parameters as shown in Formulas (5) and (8), respectively. Some of them, such as impeller trailing edge speed U t i p , are well defined and also introduced to the model during non-dimensionalization. Other parameters, such as A c , L c and V p are defining the geometrical model of the compressing system shown in Figure 1. Mapping of those parameters to the real system is to be investigated here. Therefore, the two separate parameters defining the geometrical properties of the simplifies compressing system are defined as follows. The first one is the compressor parameter:
C o = A c L c
According to [7], one should consider the influence of the ratio of A c and L c on the system dynamics instead of each of them separately. The second one is the plenum parameter:
P l = a a 2 V p
The parameter P l is dependent not only on the geometrical properties of the plenum but also on the speed of sound a a . The reason for that is the consistency with the original model derivation from work of Greitzer [7].
The analysis is performed for several points of operation. The system of ordinary differential equations is solved using ODE45 Matlab routine employing explicit Runge-Kutta formula and the Dormand-Prince pair. The results of the model are a subject of quantitative analysis with the use of two tools: averaging of the signal, to evaluate a mean value of the pressure rise or mass flow rate, and the Fast Fourier Transform (FFT) [32]. In a further step, the frequency spectrum resulting from FFT is analysed to find the highest amplitude and the frequency corresponding to it, both for pressure and mass flow rate.
The initial condition for the simulation was defined as the currently considered point of operation (crossing point of the throttle and compressor curves). To assure that the initial condition is not influencing the result, we performed the FFT analysis only on the stabilized solution. It can be easily shown that the Greitzer model solution stabilizes at the same periodic solution despite the choice of the (feasible) initial condition.

2.2.2. Three-Equation Model—Compressor Response Delay

The second model analysed here takes into consideration the compressor response delay. The model reads:
d Φ c d t ^ = B ( Ψ c Ψ t )
d Ψ t d t ^ = 1 B ( Φ c Φ t ( Ψ t ) )
d Ψ c d t ^ = 1 η ( Ψ c , s s ( Φ c ) Ψ c )
where the dependencies Φ t ( Ψ t ) and Ψ c , s s ( Φ c ) are defined by Equations (10) and (11), respectively. The sensitivity analysis is performed in a similar manner as in the case of the two-equation model, with respect to C o and P l parameters, for different values of N parameter, which is involved in η (7).

2.2.3. Three-Equation Model—Valve Modelling

The third model takes into consideration the valve dynamics instead of the compressor response delay. It reads:
d Φ c d t ^ = B ( Ψ c ( Φ t ) Ψ p )
d Φ t d t ^ = B G ( Ψ p Ψ t ( Φ t ) )
d Ψ p d t ^ = 1 B ( Φ c Φ t )
with the dependencies Φ t ( Ψ t ) and Ψ c ( Φ c ) defined by Equations (10) and (11), respectively. The sensitivity analysis is performed in a similar manner as in the case of the two-equation model, with respect to C o and P l parameters, for different values of T h parameter defined as:
T h = A t L t
This parameter determines the dynamic behaviour of the throttle. The parameters A t and L t are involved in G parameter (6).

2.3. Comparison with Experiment

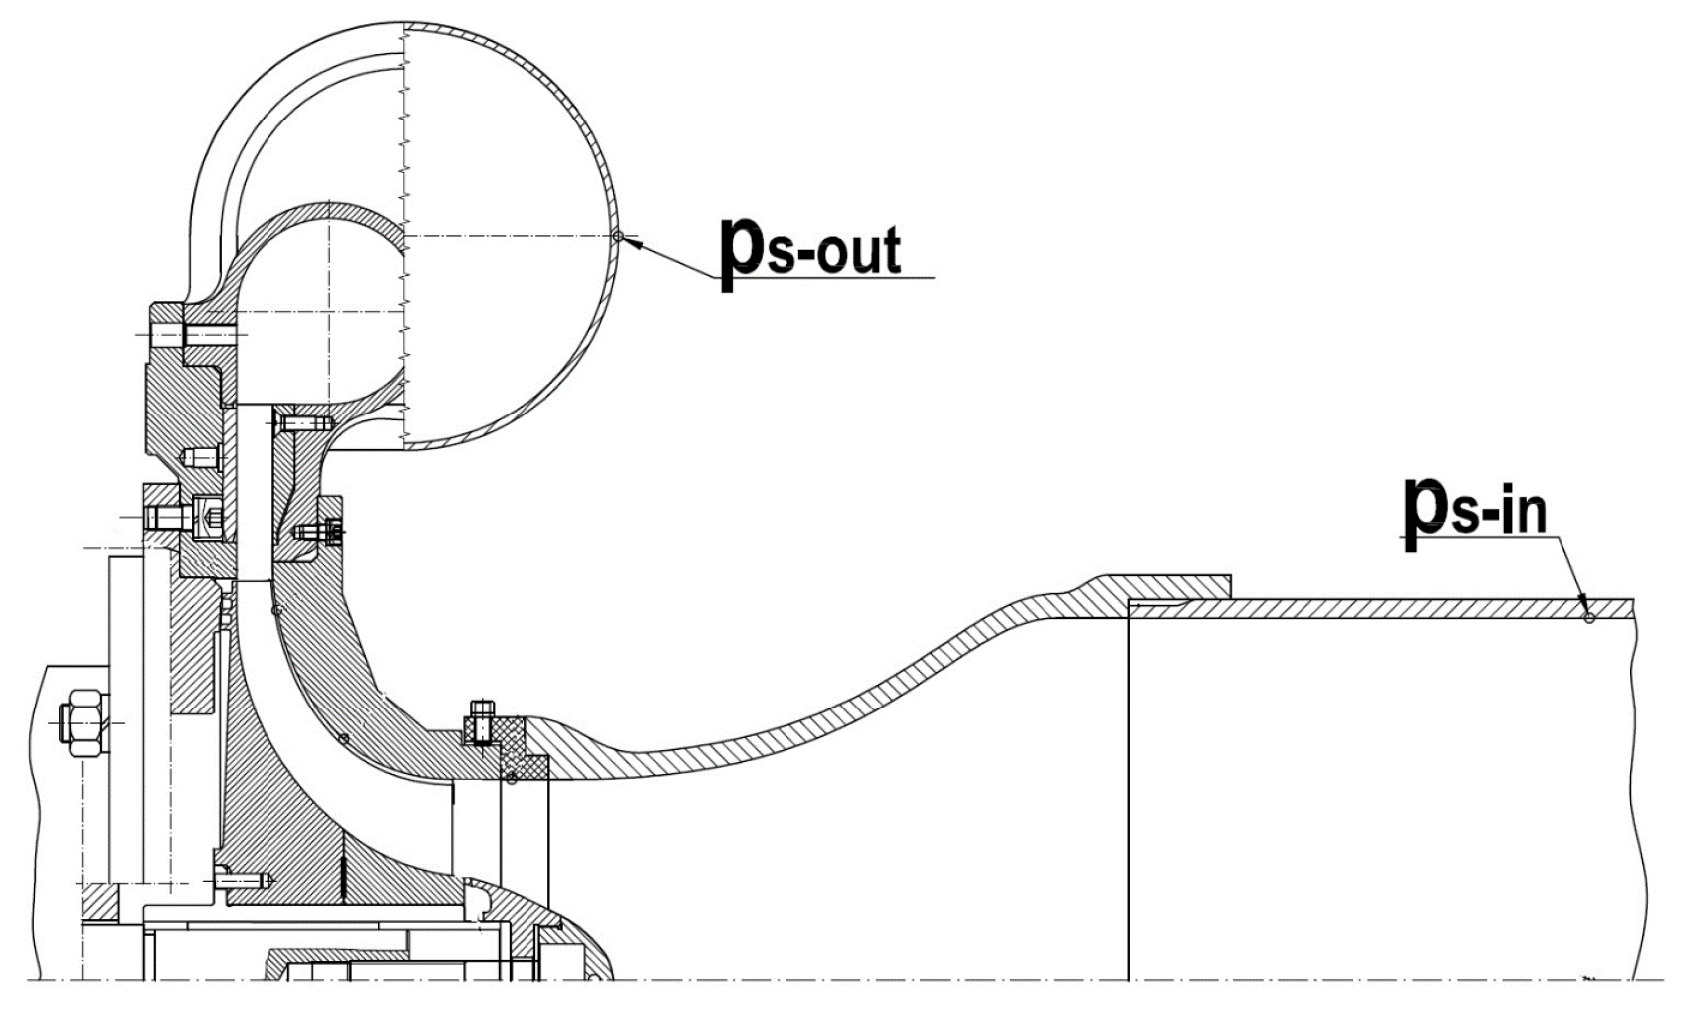
The aforementioned test stand was equipped with two dynamic sub-miniature Kulite transducers connected to the Iotech Wavebook 516/E data acquisition system. One of them was placed at the inlet of the system and the other at the volute outlet of the compressor (see Figure 3). The data were collected with sampling frequency equal to 100 kHz. The measurement period was equal to 20.97 s ( 2 21 samples).
The experimental signals were treated with the FFT algorithm to find the highest amplitude and the frequency corresponding to it. The average value of the pressure signal was not taken into consideration as it was used to determine the approximate compressor operation curve.

3. Results

3.1. Two-Equation Model

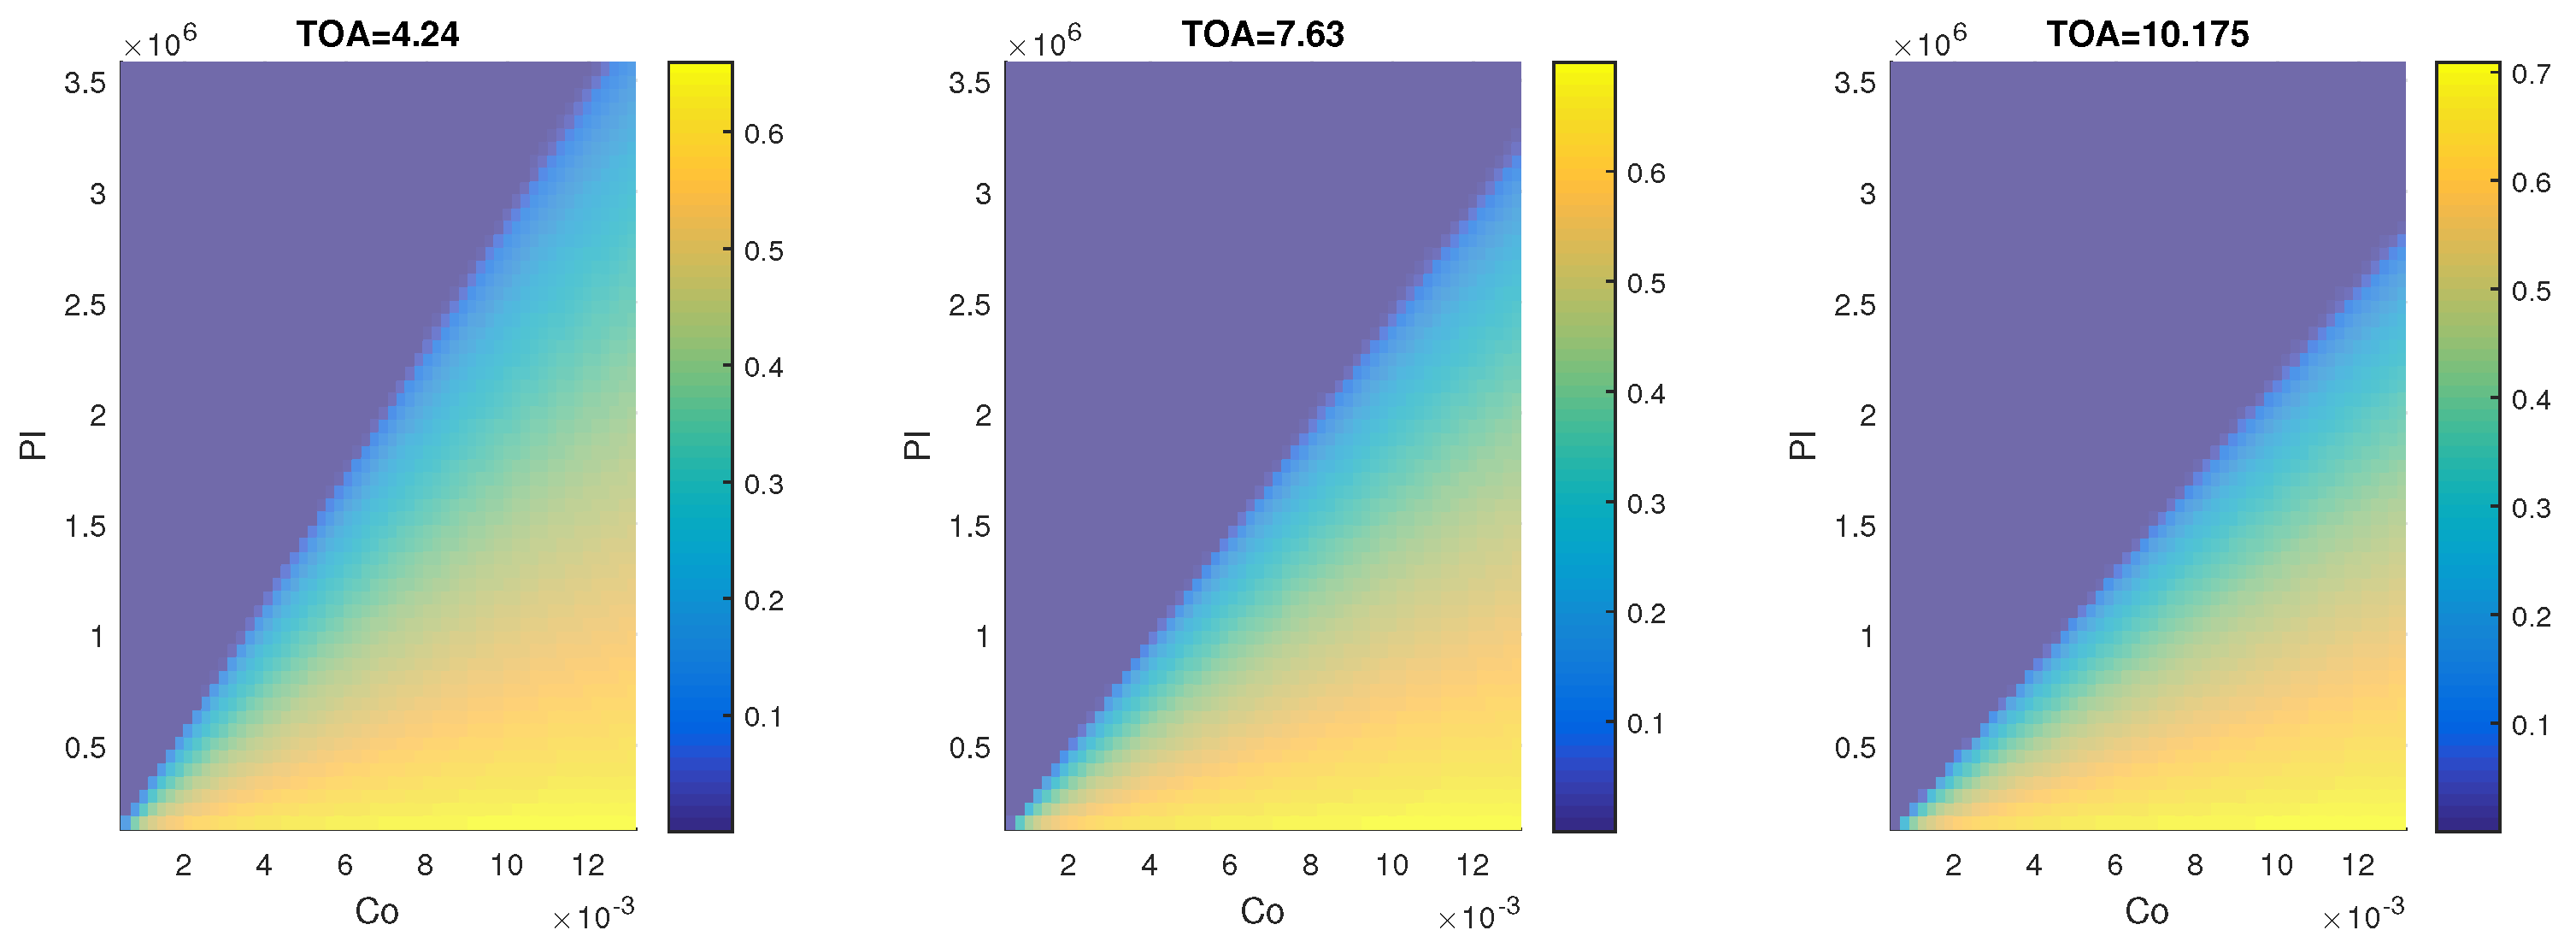
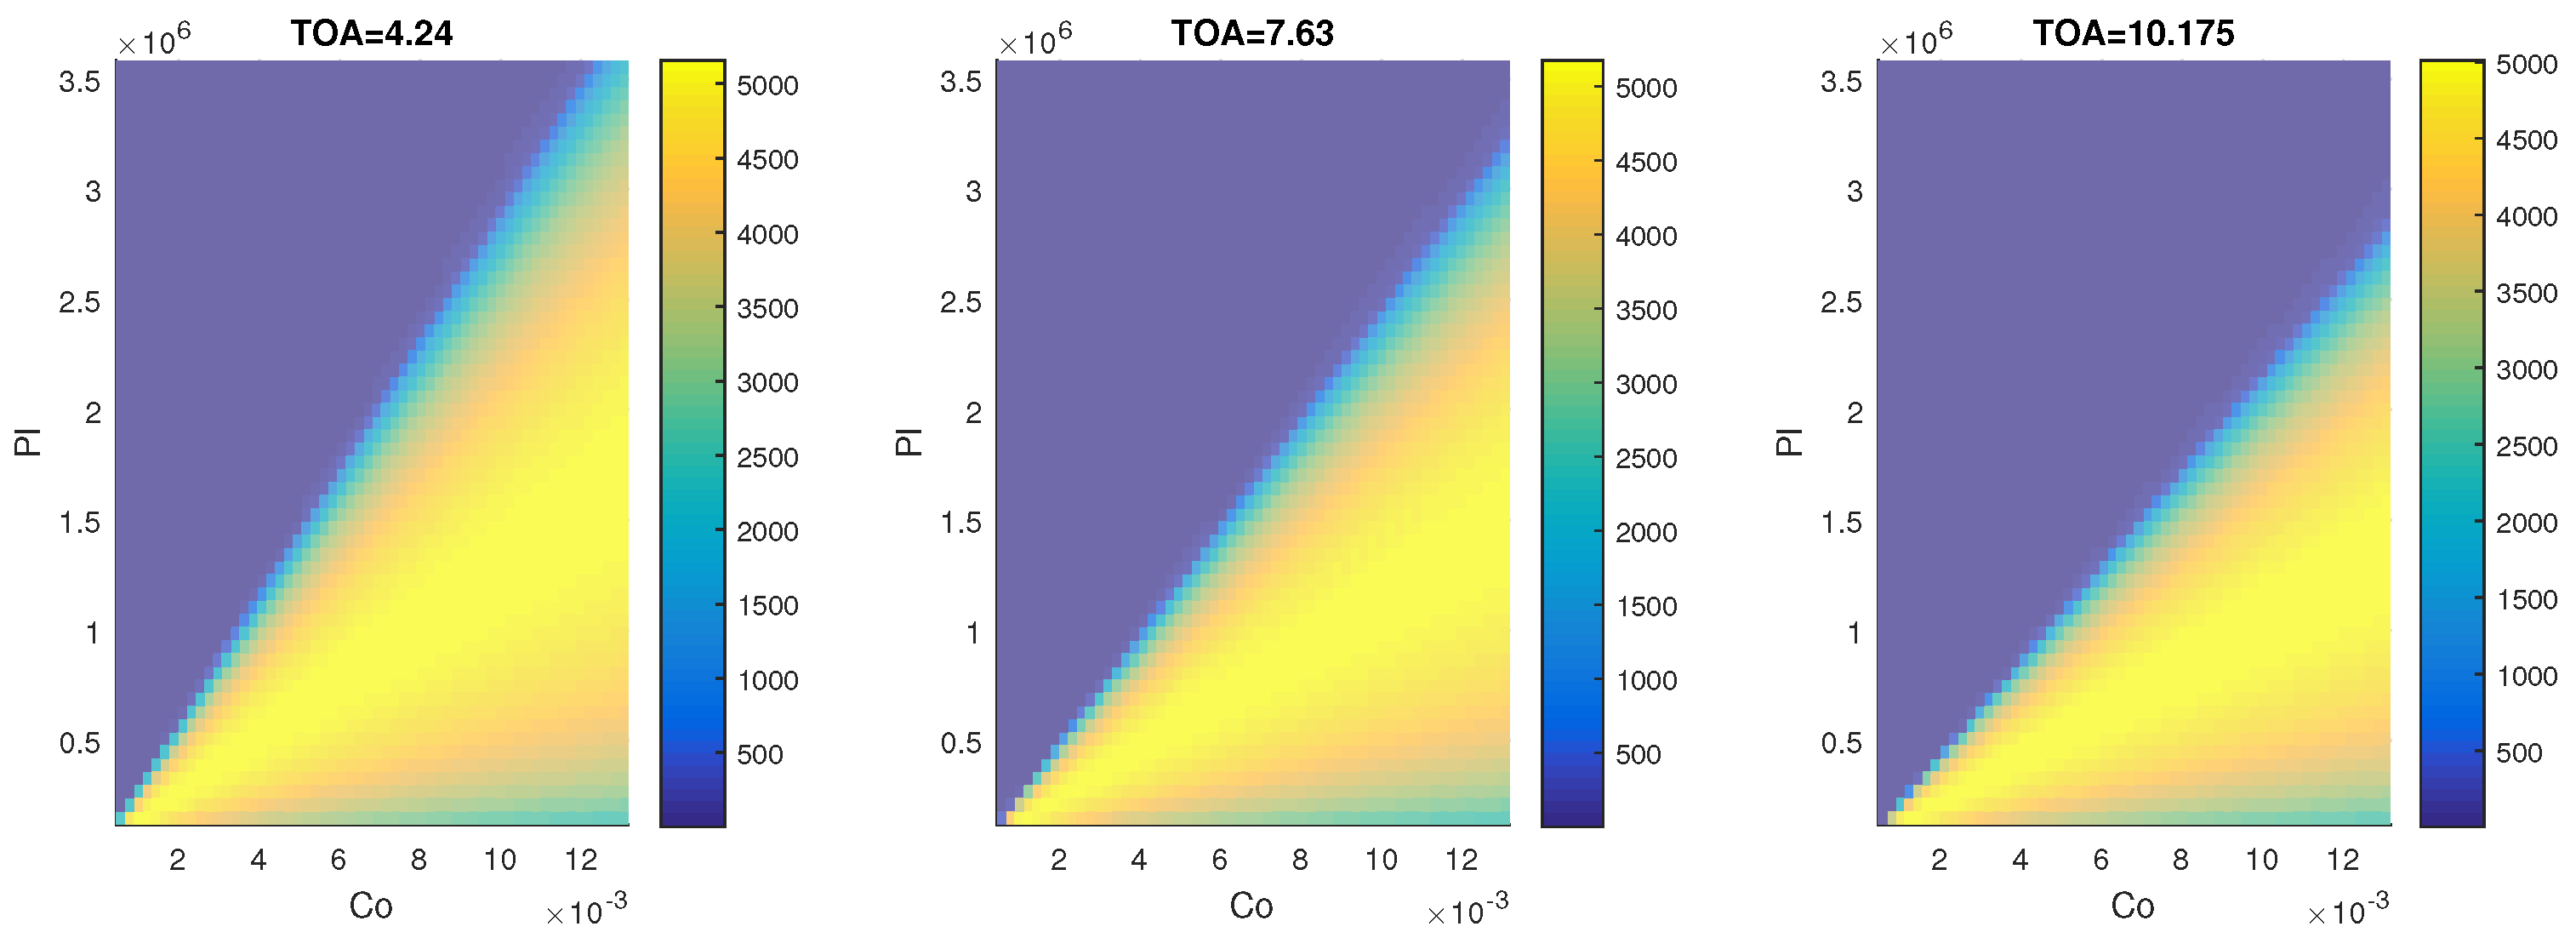
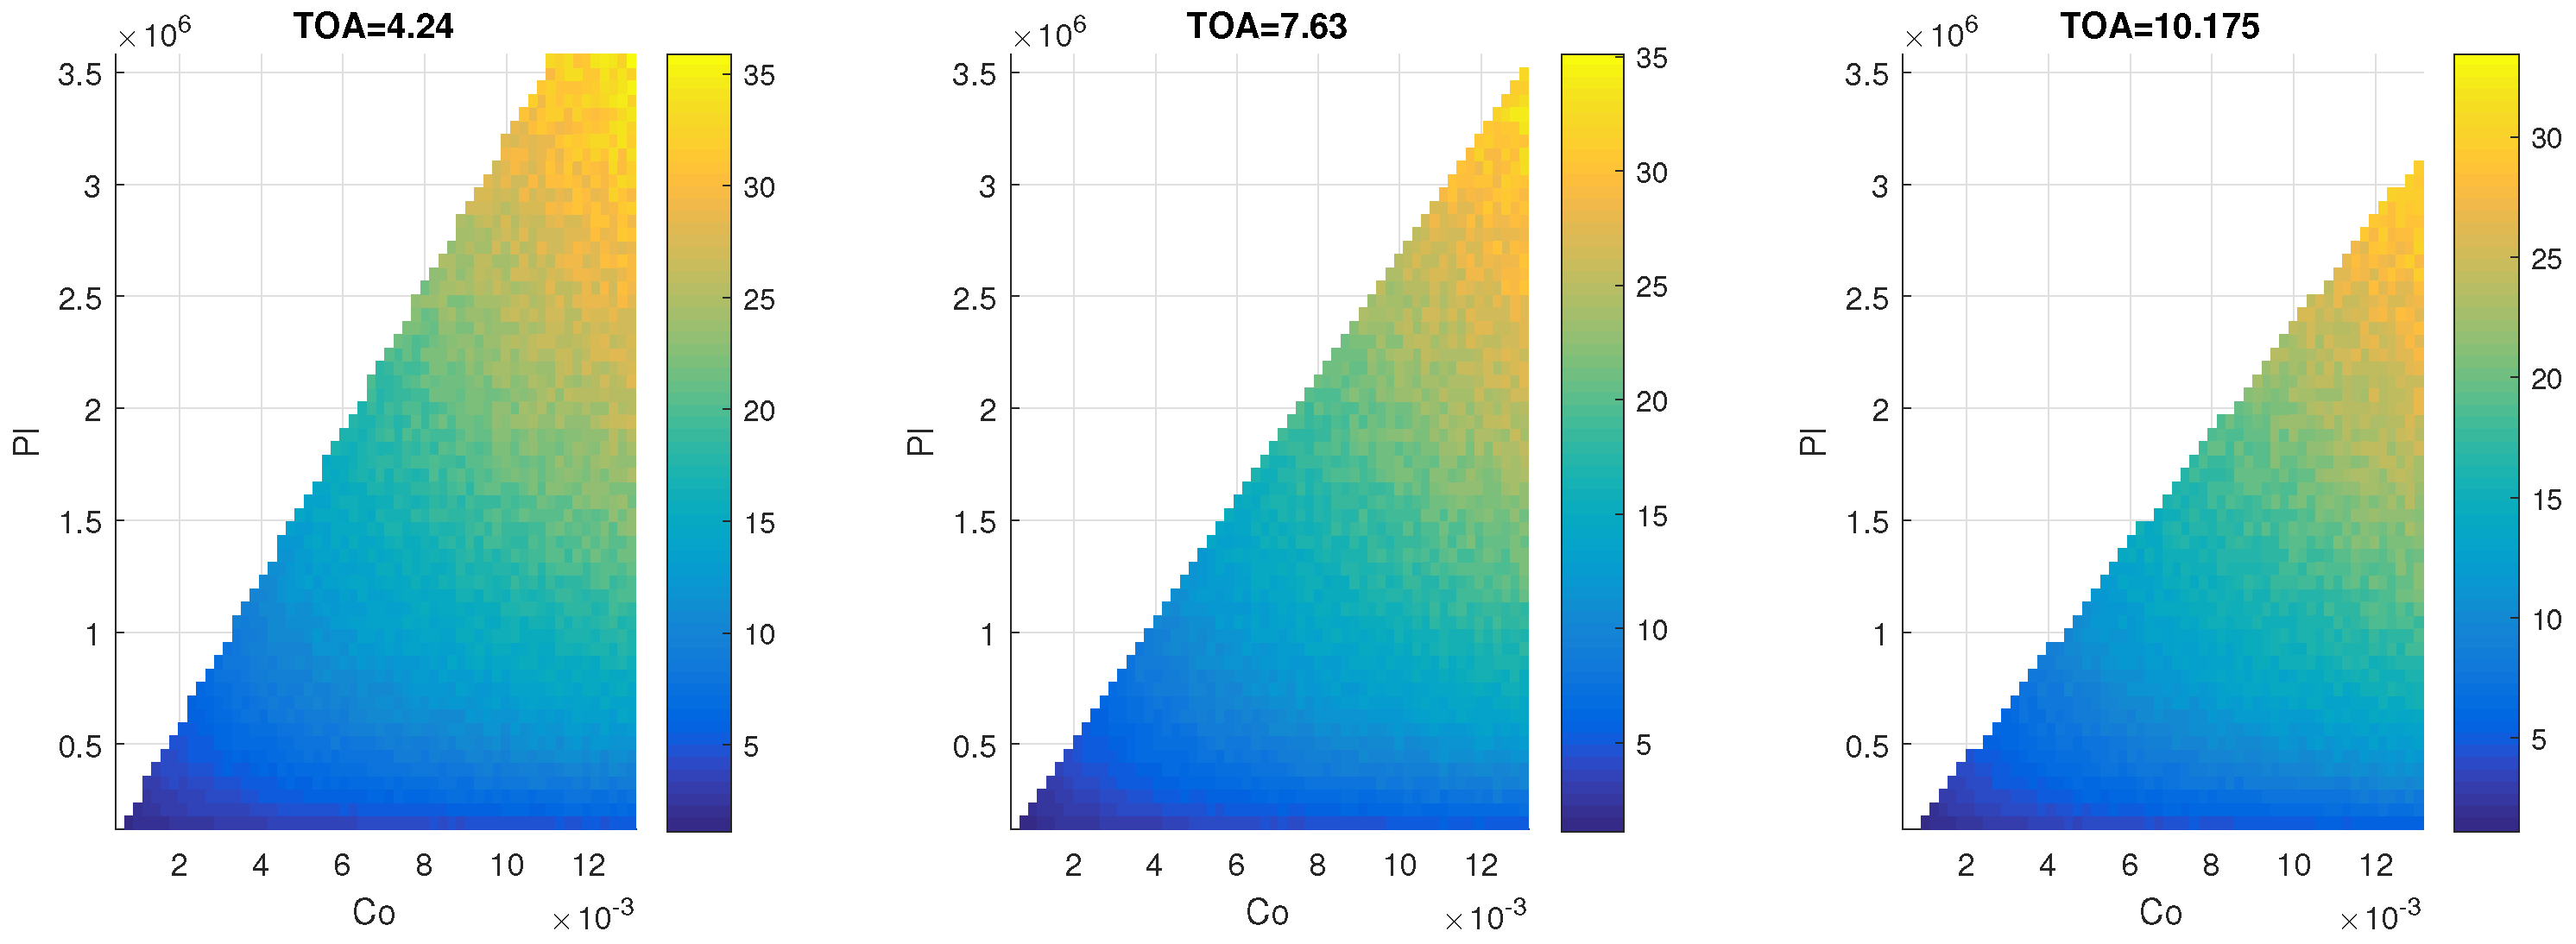
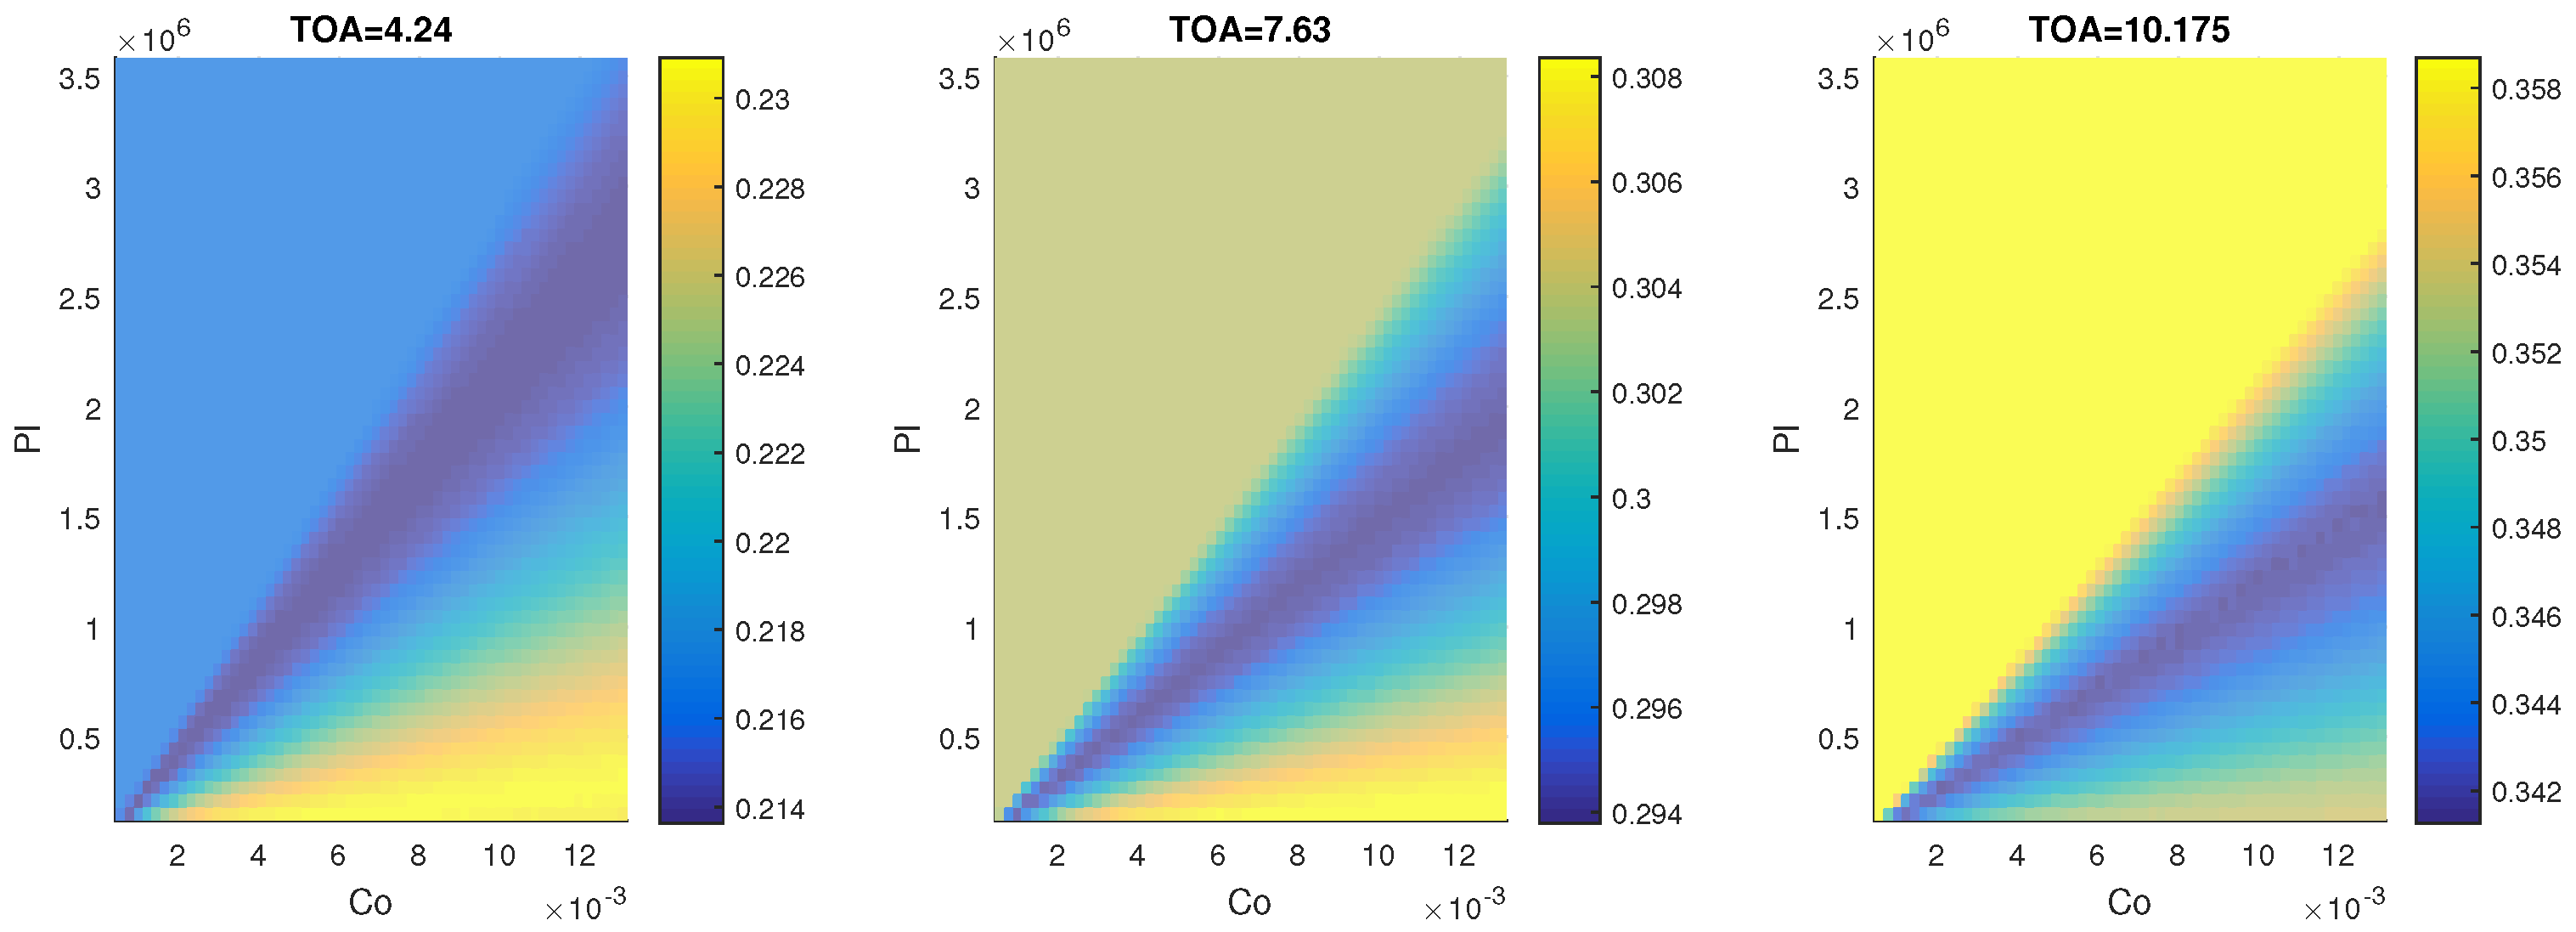
In this section, the results obtained with the use of the two-equation model are presented. Figure 4 presents the maps of the dependency of the amplitude of mass flow rate oscillations in the system as a function of C o and P l parameters for three different valve positions. Figure 5 presents the amplitudes of pressure rise in the system in a similar manner. Figure 6 presents the map for the frequency of oscillations in the system, it is not distinguished here between the mass flow rate and the pressure rise because it can be easily shown that the frequency of oscillations is the same (up to truncation error) for both state variables. The white region in the plot corresponds to the region of negligible oscillations resulting in meaningless frequencies. The Figure 7 and Figure 8 present the maps for mean values of the pressure rise and the mass flow rate, respectively.

3.2. Three-Equation Model—Compressor Response Delay

In this section, the results of the model with compressor response delay are presented. From now on, only the pressure rise is considered. There are two reasons for that. First of all, dynamic measurements of pressure rise are significantly easier to perform on the experimental rig than the mass flow rate measurements. Secondly, as can be seen comparing Figure 4 and Figure 5, the nature of the dependency on C o , P l , and T O A is similar for those state parameters.
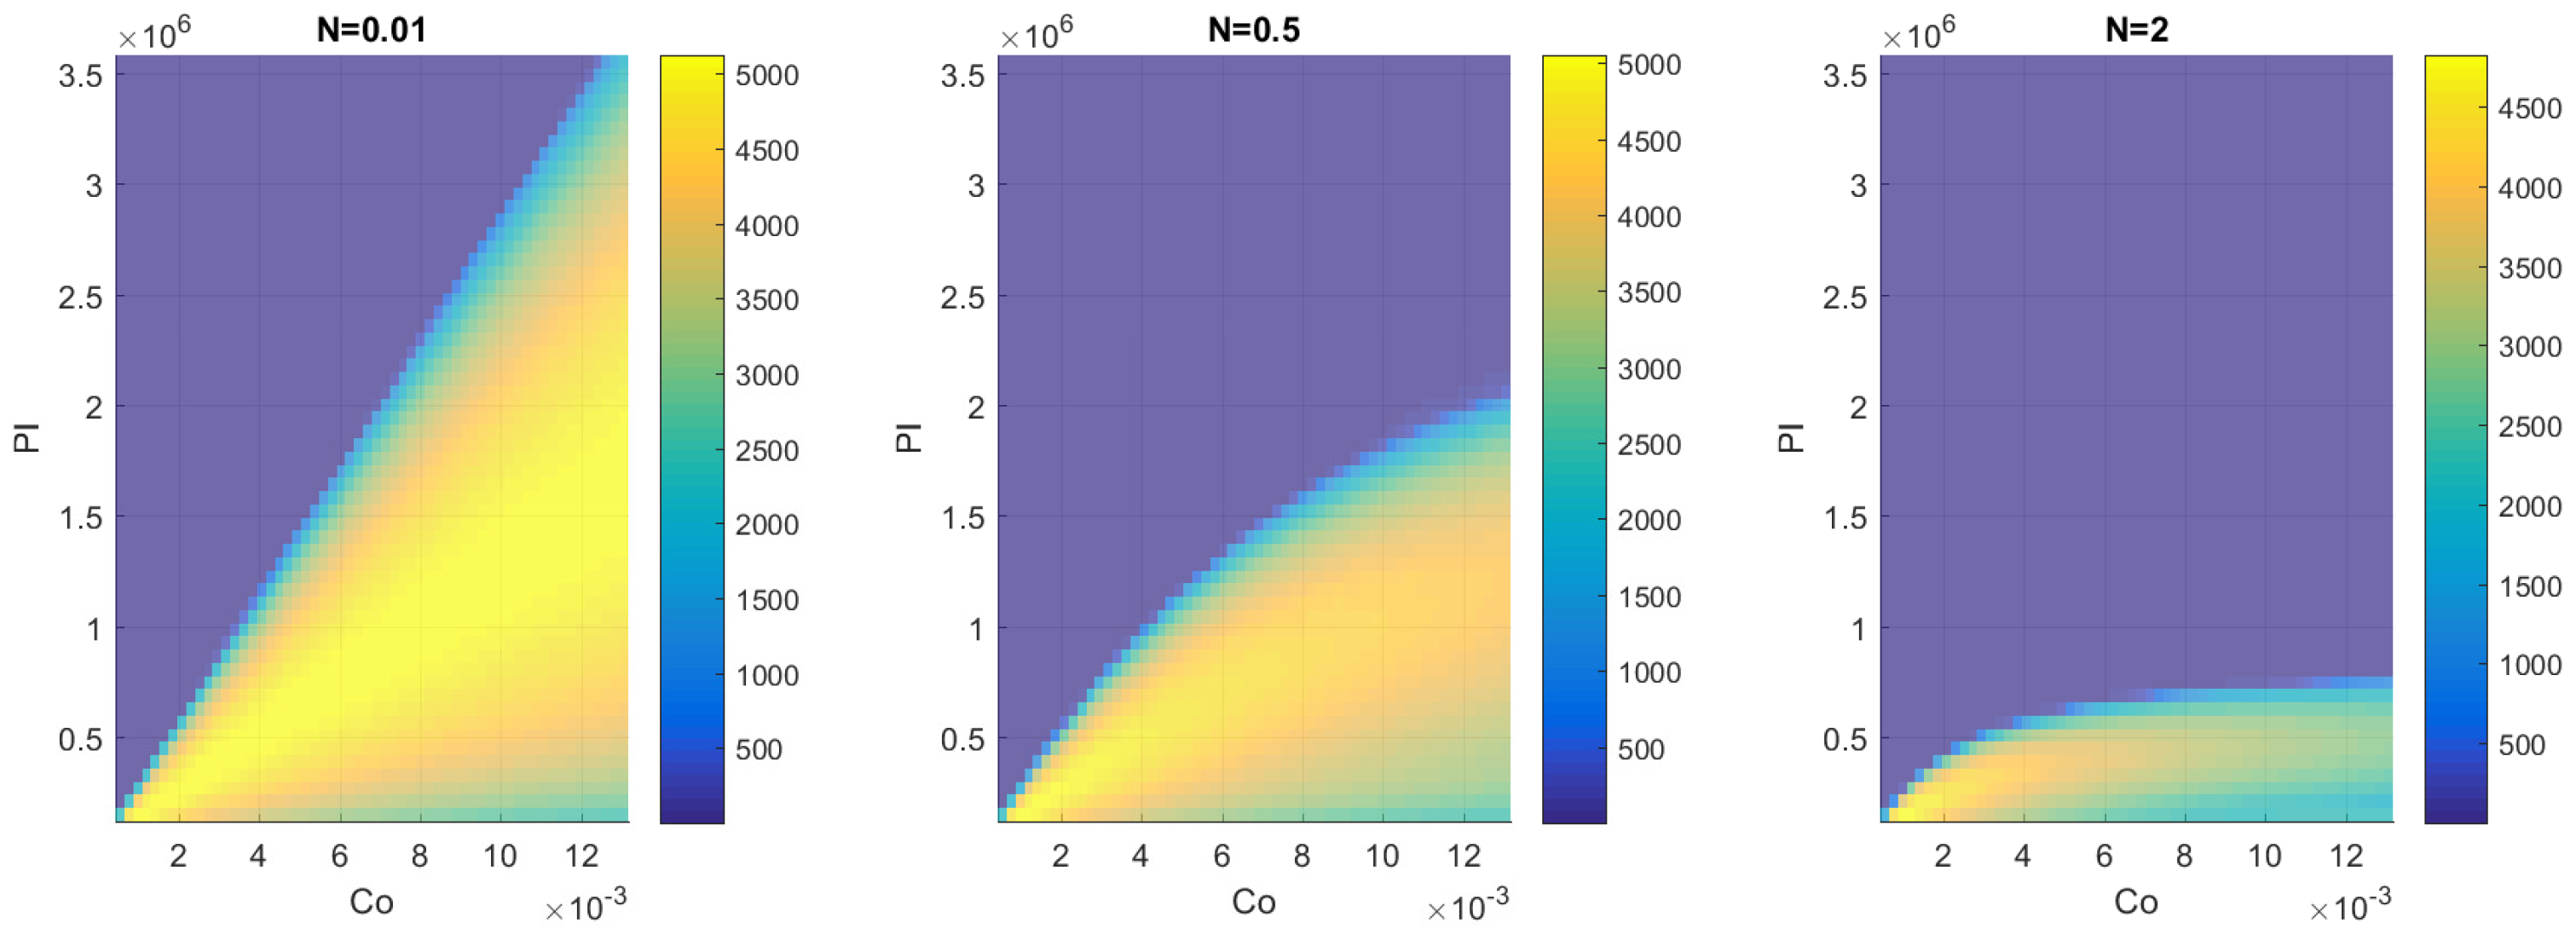
Figure 9 presents the map of the dependency of the frequency of oscillations on C o and P l for different values of N. Figure 10 presents a similar map of the amplitude of pressure rise oscillations. The white region of the plot corresponds to the region of negligible oscillations resulting in meaningless frequencies. All results were calculated for T O A = 4.24 (almost fully closed valve).

3.3. Three-Equation Model—Valve Modelling

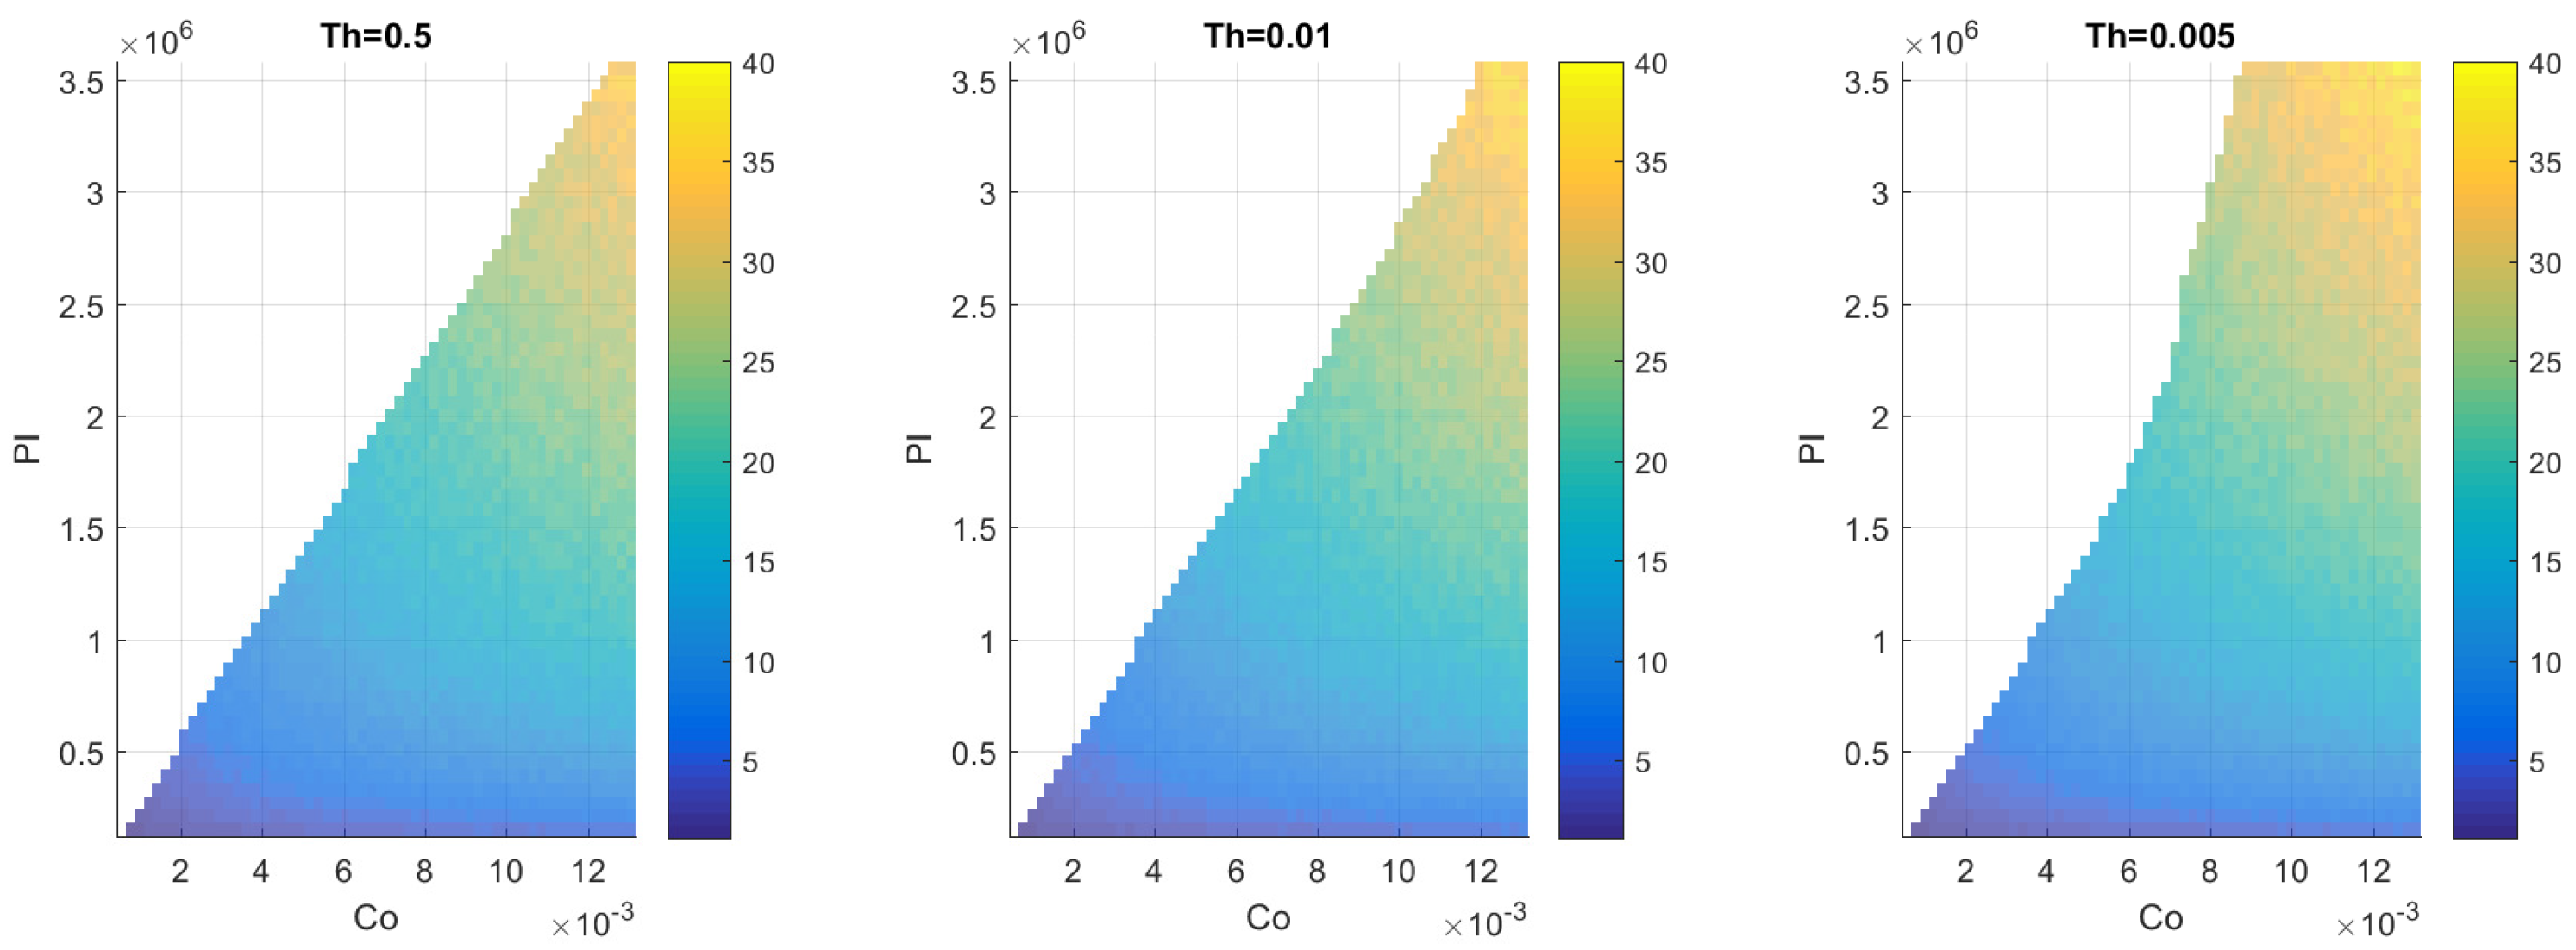
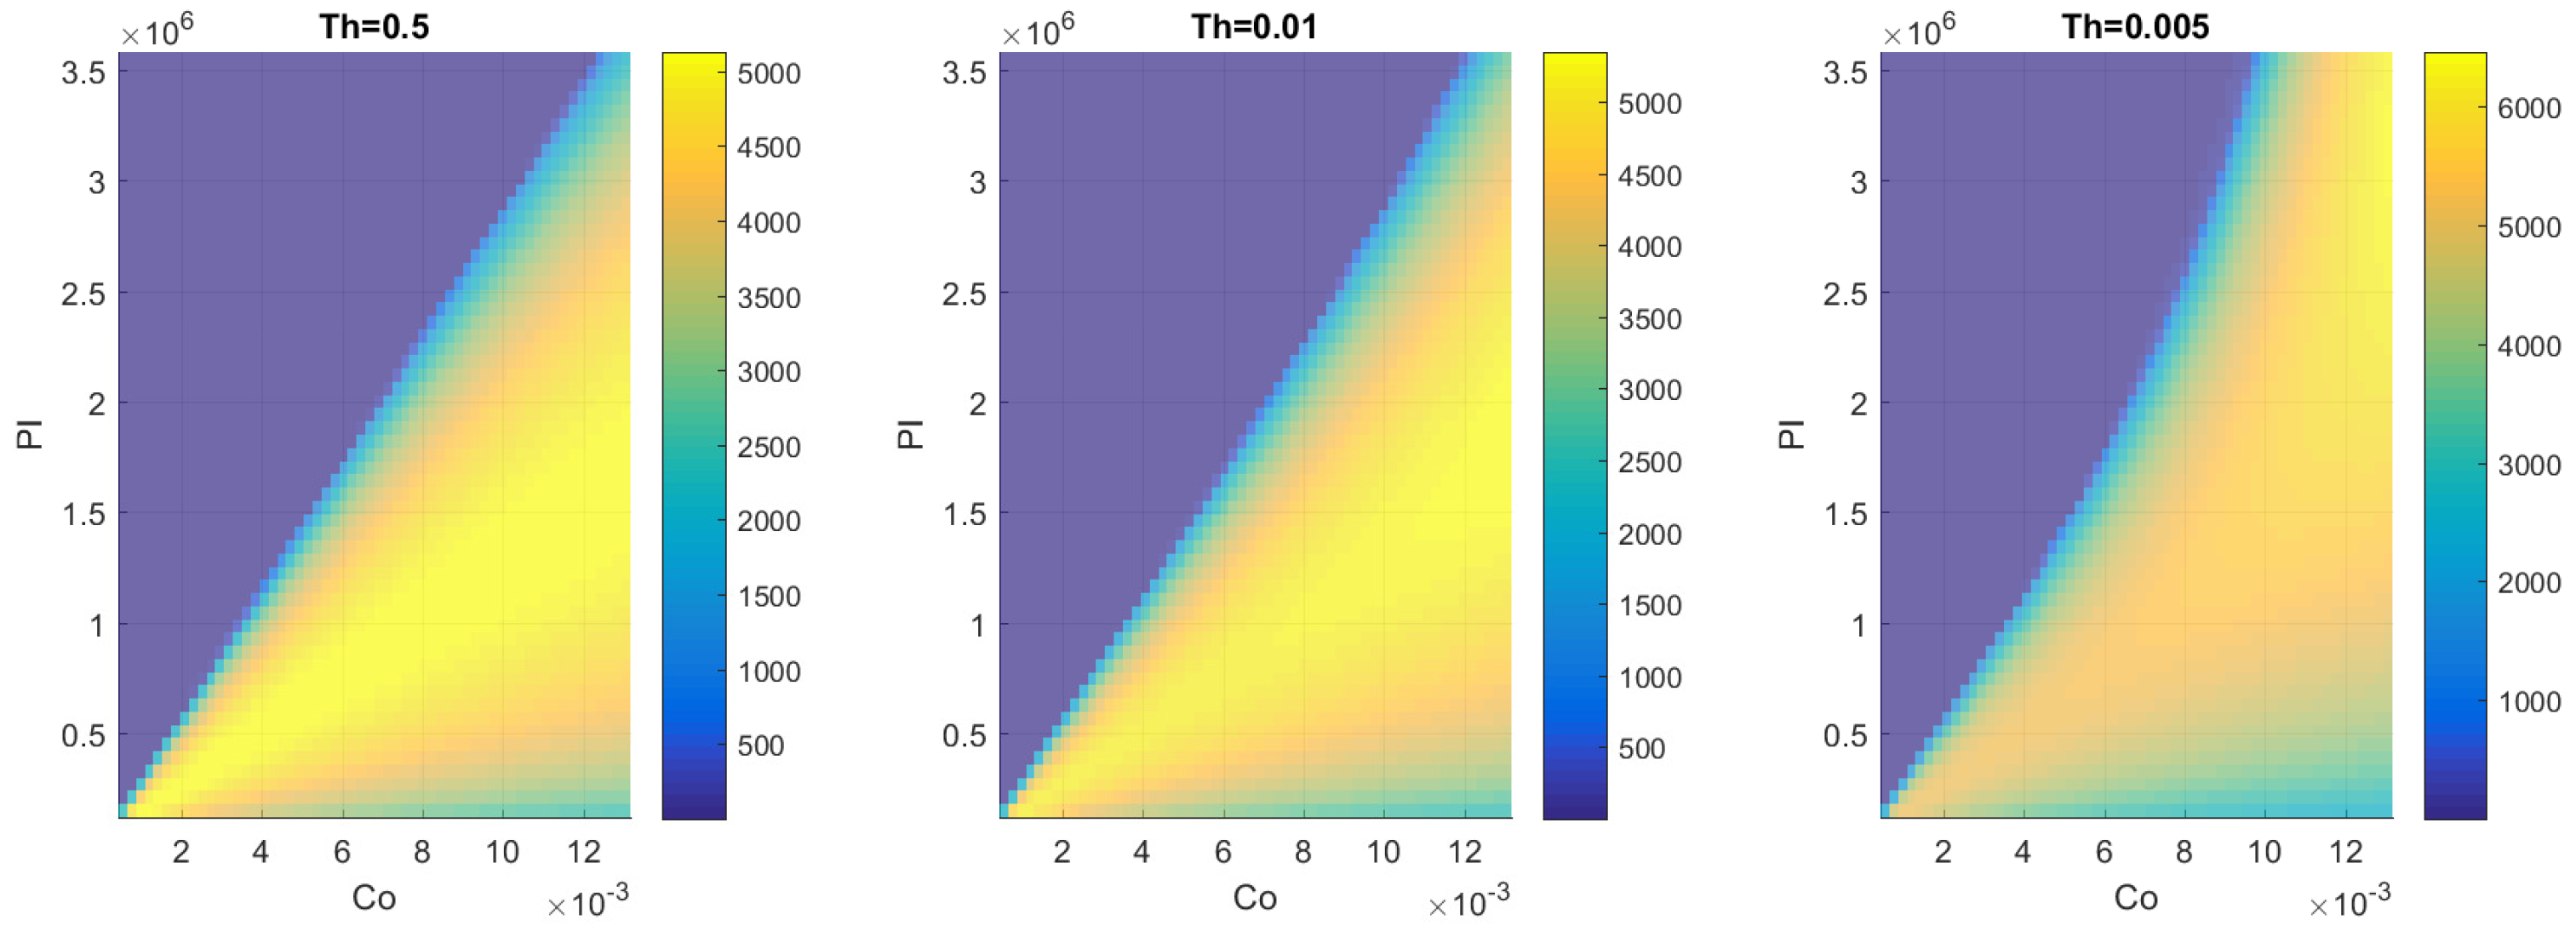
In this section, the results of the model with valve dynamics modelling are presented. Figure 11 presents the map of the dependency of the frequency of oscillations on C o and P l for different values of T h . The white region of the plot corresponds to the region of negligible oscillations resulting in meaningless frequencies. Figure 12 presents a similar map of the amplitude of pressure rise oscillations. All results were calculated for T O A = 4.24 .

3.4. Comparison with Experiment

This section presents the results of the comparison of the two-equation model with the experimental data. This model was selected for the comparison with experiment because the number of its parameters coincide with the number of features extracted from the experiment. The model has two parameters: C o and P l . The pressure oscillations signal recorded on the test stand, after the Fast Fourier Transform, provides two features: the amplitude of the strongest mode of oscillations and the corresponding frequency.
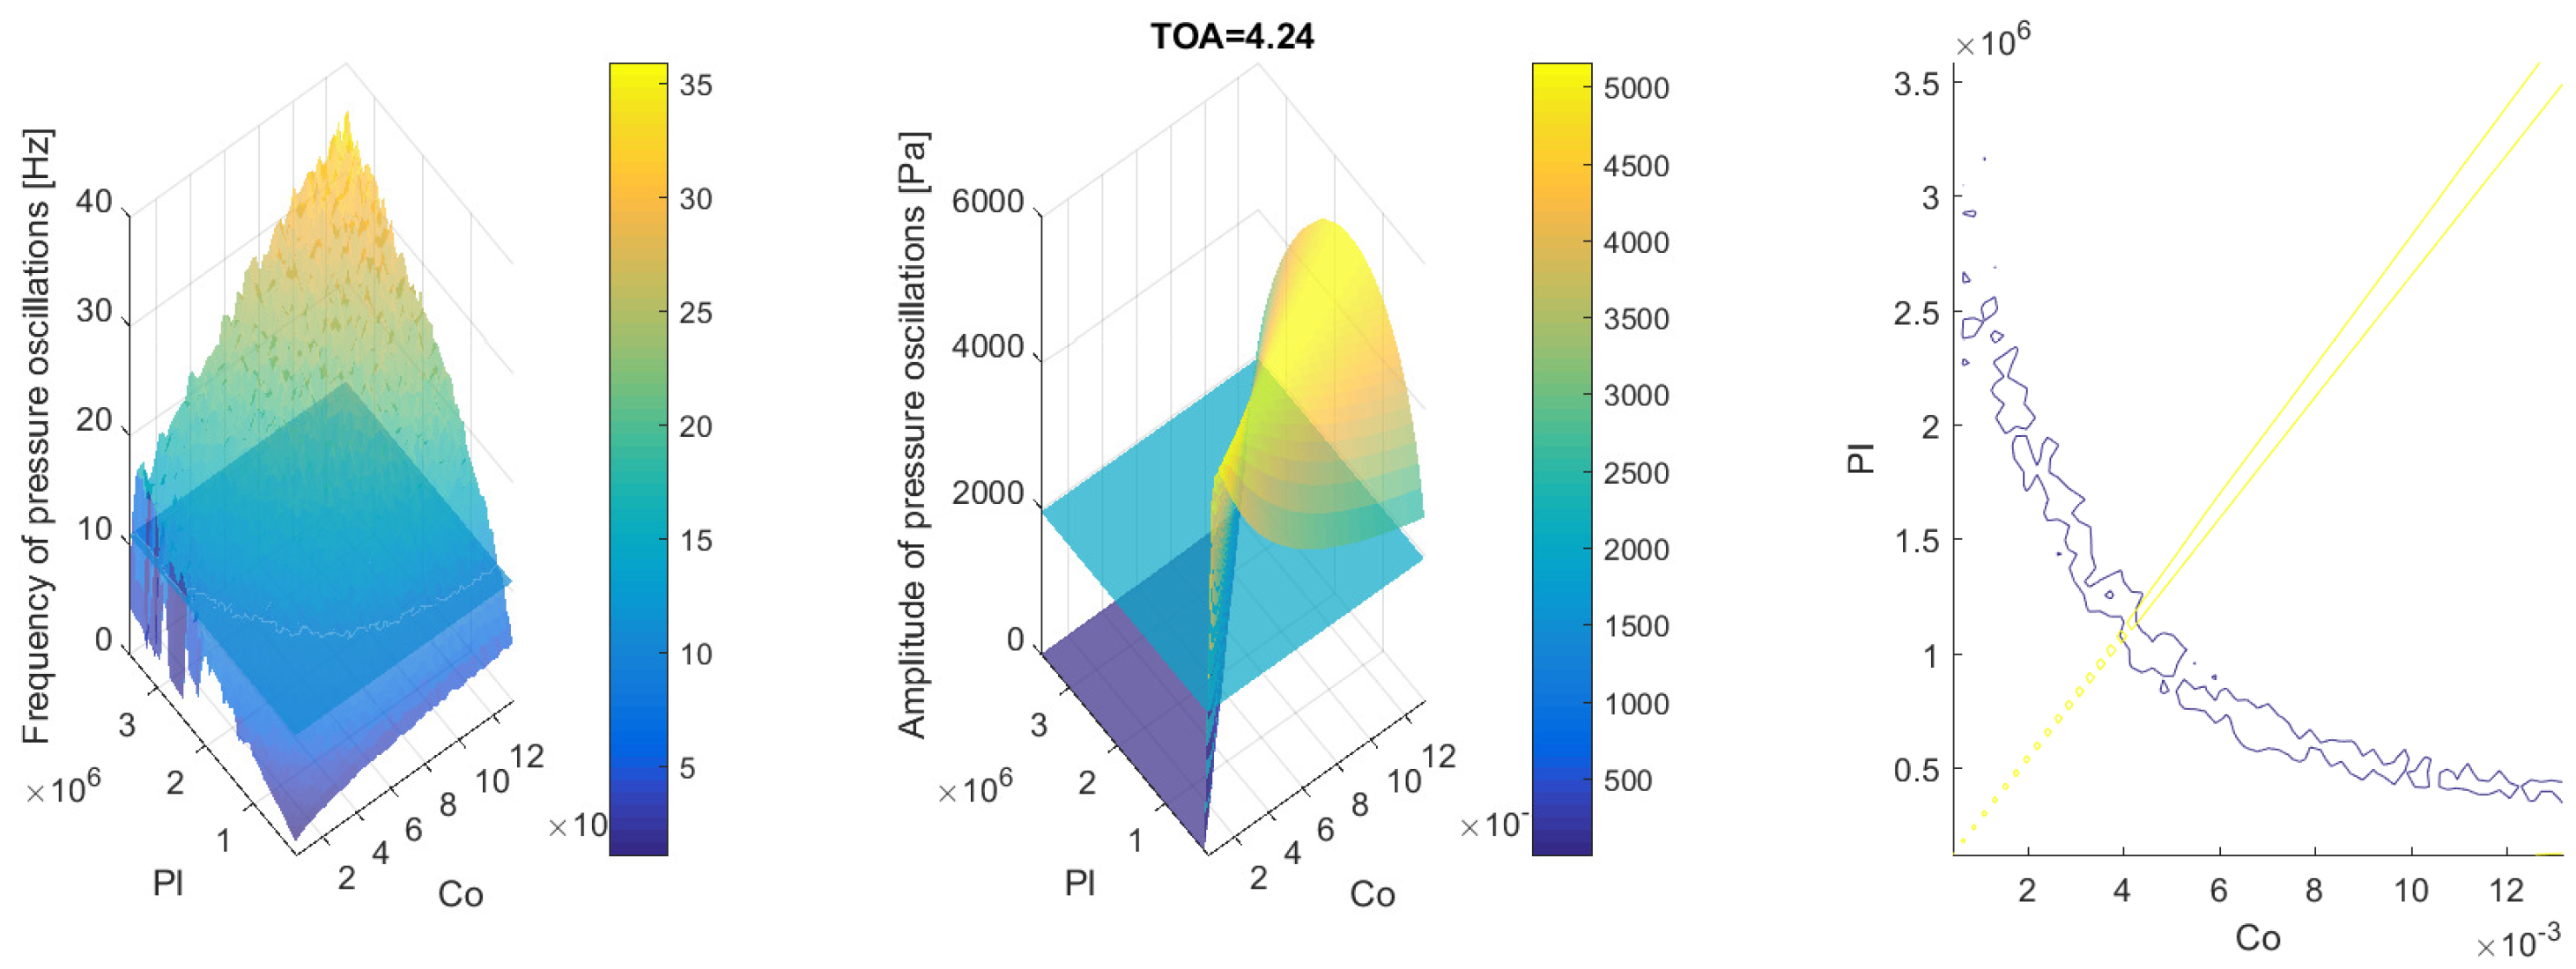
The comparison with the experiment was performed for T O A = 4.24 as it was expected to provide the most reliable data. It was selected because this was the most closed valve position for which the measurements were feasible. In the case of more open valve positions the oscillation modes resulting from surge becomes less dominant with respect to other unstable phenomena, not simulated by the Greitzer model (inlet recirculation or partially rotating stall). If the valve is opened even more, the stable operation of the compressor begins and the model is not producing informative data anymore. The Figure 13 presents the sensitivity maps identical to those presented in Figure 5 and Figure 6 with the horizontal cut at the value obtained empirically. The cut lines for pressure oscillations amplitude and frequency are presented together in the form of a contour plot of the absolute value of the difference between numerical and experimental values. The optimal model parameters C o and P l are determined by the intersection of those lines.

4. Discussion

4.1. Two-Equation Model

In Figure 4 and Figure 5 one can see that the amplitude of oscillations depends on the ratio of C o and P l parameters. There is clearly a border value of this ratio beyond which the system starts to operate in an unstable manner. This ratio corresponds to the critical value of B, where the bifurcation is observed [33]. Please note that the systems with the same compressor, characterized by C o parameter, but connected to plenums with different volumes, will behave differently. The valve position ( T O A ) significantly influences the positioning of this borderline as well as the severity of the oscillations. The more open the valve, the larger the stability area (the blue region on the map).
In Figure 6 one can see that the frequency of oscillations grows with the growth of the system parameters C o and P l . The frequency map is not significantly influenced by the valve position. The dependency of the frequency of the oscillations in the system on both parameters on top of the dependency of amplitudes on their ratio assures the uniqueness of the set of parameters resulting in the given oscillatory behaviour.
In Figure 7 and Figure 8 it can be seen that the average value of the pressure rise and the mass flow rate is not equal to the one defined as the operation point in the unstable regime. This means that the occurrence of the instabilities changes the average value of the state variables. Therefore, it can be stated that the oscillations are not symmetric with respect to the operation point. Monitoring the average values of state variables can be considered to be a way to control the stability of the machine. On the other hand, this means that measuring the state variables in the unstable regime and averaging them to determine the operating curve of the compressor in that area, although widely done, may lead to significant errors.

4.2. Three-Equation Model—Compressor Response Delay

In Figure 10 it can be seen that the growing N parameters enlarge the stability zone. It deflects the stability line to the larger C o values. The amplitude is no longer dependent purely on the ratio of C o and P l parameters. In Figure 9 one can notice that the frequency of the oscillations does not depend significantly on the N value. N = 0 corresponds to the two-equation model, to avoid numerical errors the simulation was done for a small non-zero value N = 0.01 and used for reference.

4.3. Three-Equation Model—Valve Modelling

In Figure 12 it can be seen that for the decreasing values of the T h parameter, the stability zone in the map is shrinking. The borderline between stable and unstable operation is deflected towards lower values of C o parameter. In Figure 11 one can notice that the frequency of the oscillations does not depend significantly on the T h parameter. T h = 1 corresponds to the two-equation model, to avoid numerical errors, the simulation was done for T h = 0.5 which return very similar results. Those results were used for reference.

4.4. Comparison with Experiment

In Figure 13 one can see that the parameter values resulting in the same amplitude and frequency of pressure rise oscillation as the one obtained during the experiment are C o = 4.2 × 10 3 and P l = 1.15 × 10 6 .
According to Equation (14) and assuming the speed of sound at the operating condition to be 343 m/s and the volume of the outlet pipe from Table 1, we can calculate the theoretical value of the P l parameter. This is equal to P l t h = 1.21 × 10 6 . The numerically obtained value is very close to the theoretical one. The discrepancies can be caused by the shape of the considered plenum volume. In our experiment we used a pipe with a length significantly larger than the diameter, not a container as assumed by Greitzer [7].
According to Equation (13) the C o parameter is just a ratio of the area of the compressor to its length. The meaning of those parameters is vague. If we assume that the area of the compressor parameter in the model is the area of the compressor outlet, which can be calculated using the data from Table 1, then A c = 0.015 m 2 . In such a case, to achieve C o = 4.2 × 10 3 , the length of the compressor must be equal to L c = 3.57 m . Looking at Figure 2 and Table 1 one can notice that this value is significantly larger than the length of the duct through the compressor. If we consider any other cross-section of the duct to compute the area, the results are not significantly different. According to [7], the A c L c ratio (here denoted as C o ) should be computed as an integral along the duct. This, however, will not result in the desired change of the physical value of C o parameter due to insignificant (less than an order of magnitude) variations of the duct area. One of the other reasons for this discrepancy could be a relatively low pressure ratio of the considered machine preventing the occurrence of more severe forms of surge. On the other hand, similar large values of L c were reported in the literature before for even smaller radial machines, Table 2 presents an overview of the values of L c parameter compared with the radius of the impeller for several Greitzer model applications presented in the literature. It is clearly visible that L c values are significantly larger (by at least an order of magnitude) than radii of the impellers, which is not physical. Apart from that, Van Helvoirt et al. [13] explicitly reports the necessity of increasing L c value from 0.197 m to 1.8 m and 3 m for the meaningful simulation.
Let us investigate if the additional equations with the feasible selection of parameters could allow more realistic selection of L c parameter. In the case of the throttle dynamics equation the selection of small values of T h is causing the deflection of the stability limit line to the left as presented in Figure 12. This would cause the yellow line in Figure 13 to deflects in similar manner if this model would be applied. The smaller value of C o and therefore even larger L c would be obtained. Note that the values of T h can only be positive and smaller than 1. Therefore, there is no feasible value of T h parameters that can minimize the discrepancy between L c and the real size of the compressor. In the case of the compressor delay equation the selection of N larger than one results in deflecting the stability limit line to the right as presented in Figure 10. This seems promising. Further investigation, however, shows that the frequency plots of the two equation and the compressor delay models (Figure 6 and Figure 9, respectively) do not differ significantly. The main difference is that the frequency values for the compressor delay model are slightly higher. Therefore, the blue line in Figure 13 would be lying closer to the axes of the plot. Adding to that the deflection of the yellow line to the right would result in slightly better fit in terms of L c (higher C o , meaning lower L c ). On the other hand, a good fit of the P l and the plenum volume would be lost. Therefore, adding the compressor delay equation is not a cure either.
One can conclude that the very high value of the L c parameter has no connection with any actual size of the compressor. This leaves a question of whether the L c should be purely connected with the geometrical parameter of the machine as it is often claimed [34]. In the radial machines, the radial velocity component of the gas is significantly larger than in the case of axial compressors considered originally by Greitzer [7]. Additionally, the gas is present in the rotor for a significant amount of time (larger than in case of axial compressors), even for several revolutions. This violates the assumptions made by Greitzer. It also suggests that the A c and L c parameters might need to be approximated differently for axial and radial impellers. This topic should be investigated further to allow efficient modelling of the compressing system with the use of the Greitzer model without access to the experimental data.

5. Summary

This paper presents the sensitivity study of the Greitzer model in its two-equation form as well as the versions taking into consideration the delay of the compressor response and the dynamics of the throttle. It presents the influence of several physical parameters of the system on its behaviour. Three parameters C o , P l , and T h were introduced to represent features connected with each component of the compression system (compressor, plenum, and throttle). Together with the N parameter, they formed the sensitivity study parameter set. Such an approach, considering the physical parameters connected with particular system components, instead of standard implicit non-dimensional parameters, provides a better understanding of the role of each component. It also allows us to consider the behaviour of different components in the system, for example, the same compressor connected to different ducts or throttles.
The analysis was done on the example of the DP1.12 blower. The results obtained with the numerical model were compared with the experimental data collected for the considered machine. There was an excellent match between the experiment and model in case of the plenum volume. The physical parameter describing the properties of the compressor had a value significantly different than expected. Namely the length of compressor parameter L c = 3.57 m was found suitable for the machine with impeller radius 0.33 m. The analysis of other studies presented in the literature has shown that such a situation is not unusual.
It was shown that incorporating considered additional equations will not significantly decrease the discrepancy between theoretical and determined values of C o parameter without worsening the fits of other parameters. Additionally, expanding the model by additional equations with uncertain coefficient values seems inexpedient. In the future, the presented framework of fitting the parameters and the conclusions concerning the applicability of additional equations can be used for an analysis of a variety of compressors to draw more general conclusions.

Author Contributions

Conceptualization, A.J., G.L.; methodology, A.J., G.L.; software, A.J.; validation, A.J., G.L.; formal analysis, A.J., G.L.; investigation, A.J., G.L.; resources, A.J., G.L.; writing—original draft preparation, A.J.; writing—review and editing, G.L.; visualization, A.J.; supervision, G.L.; project administration, G.L.; funding acquisition, G.L. Both authors have read and agreed to the published version of the manuscript.

Funding

This work was funded by the Polish National Centre for Research and Development (Grant No.Lider/447/L-6/14/NCBR/2015).

Acknowledgments

The authors would like to express their gratitude to W. Kryllowicz, L. Horodko, R. Magiera, K. Bialik and G. Styczen for their help with the preparation of the test stand and their assistance during measurements.

Conflicts of Interest

The authors declare no conflict of interest.

References

  1. Bloch, H.P. A Practical Guide to Compressor Technology; John Wiley & Sons: Hoboken, NJ, USA, 2006; p. 560. [Google Scholar]
  2. Emmons, H.W.; Pearson, C.E.; Grant, H.P. Compressor surge and stall propagation. Trans. ASME 1955, 138, 455–467. [Google Scholar]
  3. Day, I. Stall, surge, and 75 years of research. J. Turbomach. 2016, 138, 011001. [Google Scholar] [CrossRef]
  4. Moore, F.K.; Greitzer, E.M. A theory of post-stall transients in axial compression systems: Part II Application. J. Eng. Gas Turbines Power 1986, 108, 231–239. [Google Scholar] [CrossRef]
  5. Abed, E.H.; Houpt, P.K.; Hosny, W.M. Bifurcation analysis of surge and rotating stall in axial flow compressions. In Proceedings of the American Control Conference, San Diego, CA, USA, 23–25 May 1990; pp. 2239–2246. [Google Scholar]
  6. Liaw, D.; Chang, S. Bifurcation analysis of a centrifugal compressor. In Proceedings of the IEEE International Conference on Systems, Man and Cybernetics, Anchorage, AK, USA, 9–12 October 2011; pp. 1538–1543. [Google Scholar]
  7. Greitzer, E. Surge and Rotating Stall in Axial Flow Compressors Part I: Theoretical Compression System Model. J. Eng. Power 1976, 98, 190–198. [Google Scholar] [CrossRef]
  8. Greitzer, E. Surge and Rotating Stall in Axial Flow Compressors Part II: Experimental Results and Comparison With Theory. J. Eng. Power 1976, 98, 199–211. [Google Scholar] [CrossRef]
  9. Hansen, K.E.; Jorgensen, P.; Larsen, P.S. Experimental and theoretical study of surge in a small centrifugal compressor. J. Fluids Eng. 1981, 103, 391–395. [Google Scholar] [CrossRef]
  10. Moore, F.; Greitzer, E. A theory of post-stall transients in axial compression systems: Part I Development of equations. J. Eng. Gas Turbines Power 1986, 108, 68–76. [Google Scholar] [CrossRef]
  11. Meuleman, C.; Willems, F.; de Lange, R.; de Jager, B. Surge in a low-speed radial compressor. In Proceedings of the 43rd International Gas Turbine and Aeroengine Congress, ASME, Stockholm, Sweden, 2–5 June 1998. [Google Scholar]
  12. Fink, D.A.; Cumpsty, N.A.; Greitzer, E.M. Surge dynamics in a free-spool centrifugal compressor system. In Proceedings of the ASME 1991 International Gas Turbine and Aeroengine Congress and Exposition, Orlando, FL, USA, 3–6 June 1991. [Google Scholar]
  13. Van Helvoirt, J.; de Jager, B.; Steinbuch, M.; Smeulers, J. Stability parameter identification for a centrifugal compression system. In Proceedings of the 2004 43rd IEEE Conference on Decision and Control (CDC) (IEEE Cat. No.04CH37601), Nassau, Bahamas, 14–17 December 2004; Volume 4, pp. 3400–3405. [Google Scholar]
  14. Willems, F.; Heemels, W.; De Jager, B.; Stoorvogel, A.A. Positive feedback stabilization of centrifugal compressor surge. Automatica 2002, 38, 311–318. [Google Scholar] [CrossRef]
  15. Yoon, S.Y.; Lin, Z.; Goyne, C.; Allaire, P.E. An enhanced Greitzer compressor model with pipeline dynamics included. In Proceedings of the American Control Conference (ACC), San Francisco, CA, USA, 29 June–1 July 2011; pp. 4731–4736. [Google Scholar]
  16. Van Helvoirt, J.; De Jager, B. Dynamic model including piping acoustics of a centrifugal compression system. J. Sound Vib. 2007, 302, 361–378. [Google Scholar] [CrossRef]
  17. Backi, C.J.; Gravdahl, J.T.; Skogestad, S. Simple method for parameter identification of a nonlinear Greitzer compressor model. IFAC-PapersOnLine 2018, 51, 198–203. [Google Scholar] [CrossRef]
  18. Jin, Y.; Fu, Y.; Qian, Y.; Zhang, Y. A Moore-Greitzer Model for Ducted Fans in Ground Effect. J. Appl. Fluid Mech. 2020, 13, 693–701. [Google Scholar] [CrossRef]
  19. Cousins, W.T.; Davis, M.W. The Influence of the Characteristics of a Centrifugal Compressor on System Stability and Distortion Response. In Proceedings of the ASME Turbo Expo 2012: Turbine Technical Conference and Exposition. American Society of Mechanical Engineers, Copenhagen, Denmark, 11–15 June 2012; pp. 37–49. [Google Scholar]
  20. Liu, A.; Zheng, X. Methods of surge point judgment for compressor experiments. Exp. Therm. Fluid Sci. 2013, 51, 20–213. [Google Scholar] [CrossRef]
  21. Sundström, E.; Semlitsch, B.; Mihăescu, M. Generation mechanisms of rotating stall and surge in centrifugal compressors. Flow Turbul. Combust. 2018, 100, 705–719. [Google Scholar] [CrossRef] [PubMed] [Green Version]
  22. Yang, Z.; Guang, X.; Zhiheng, W.; Pengfei, Z. Numerical investigation of deep surge in a centrifugal compressor with vaned diffuser and large plenum. Proc. Inst. Mech. Eng. Part A J. Power Energy 2020, 234, 143–155. [Google Scholar] [CrossRef]
  23. Kulak, M.; Grapow, F.; Liśkiewicz, G. Numerical analysis of centrifugal compressor operating in near-surge conditions. JPhCS 2018, 1101, 012017. [Google Scholar] [CrossRef]
  24. Liu, Z.; Zhao, Q.; Xiang, X.; Zhao, W.; Zhou, X. A hybrid viscous body force model for low-speed centrifugal compressors. Proc. Inst. Mech. Eng. Part A J. Power Energy 2020. [Google Scholar] [CrossRef]
  25. Huang, Q.; Zhang, M.; Zheng, X. Compressor surge based on a 1D-3D coupled method—Part 1: Method establishment. Aerosp. Sci. Technol. 2019, 90, 342–356. [Google Scholar] [CrossRef]
  26. Grapow, F.; Liśkiewicz, G. Compressor modeling using Greitzer model validated by pressure oscillations. Trans. Inst. Fluid-Flow Mach. 2016, 133, 69–89. [Google Scholar]
  27. Liśkiewicz, G. Numerical Model of the Flow Phenomena Preceding Surge in the Centrifugal Blower and Assessment of Its Applicability in Designing Anti-Surge Devices. Ph.D. Thesis, University of Strathclyde, Glasgow, Scotland, 2014. [Google Scholar]
  28. Gravdahl, J.T.; Egeland, O. Compressor Surge and Rotating Stall: Modeling and Control; Springer Science & Business Media: Berlin, Germany, 2012. [Google Scholar]
  29. Willems, F.; de Jager, B. Modeling and control of compressor flow instabilities. IEEE Control Syst. 1999, 19, 8–18. [Google Scholar]
  30. Ng, Y.E.; Liu, N. Parametric study of Greitzer’s instability flow model through compressor system using Taguchi method. In Compressor Instability with Integral Methods; Springer: Berlin, Germany, 2007; pp. 107–129. [Google Scholar]
  31. Liśkiewicz, G.; Horodko, L.; Stickland, M.; Kryłłowicz, W. Identification of phenomena preceding blower surge by means of pressure spectral maps. Exp. Therm. Fluid Sci. 2014, 54, 267–278. [Google Scholar] [CrossRef]
  32. Brigham, E.O.; Morrow, R. The fast Fourier transform. Spectr. IEEE 1967, 4, 63–70. [Google Scholar] [CrossRef]
  33. Hos, C.; Champneys, A.; Kullmann, L. Bifurcation analysis of surge and rotating stall in the Moore–Greitzer compression system. IMA J. Appl. Math. 2003, 68, 205–228. [Google Scholar] [CrossRef] [Green Version]
  34. Van den Braembussche, R. Design and Analysis of Centrifugal Compressors; John Wiley & Sons: Hoboken, NJ, USA, 2019. [Google Scholar]
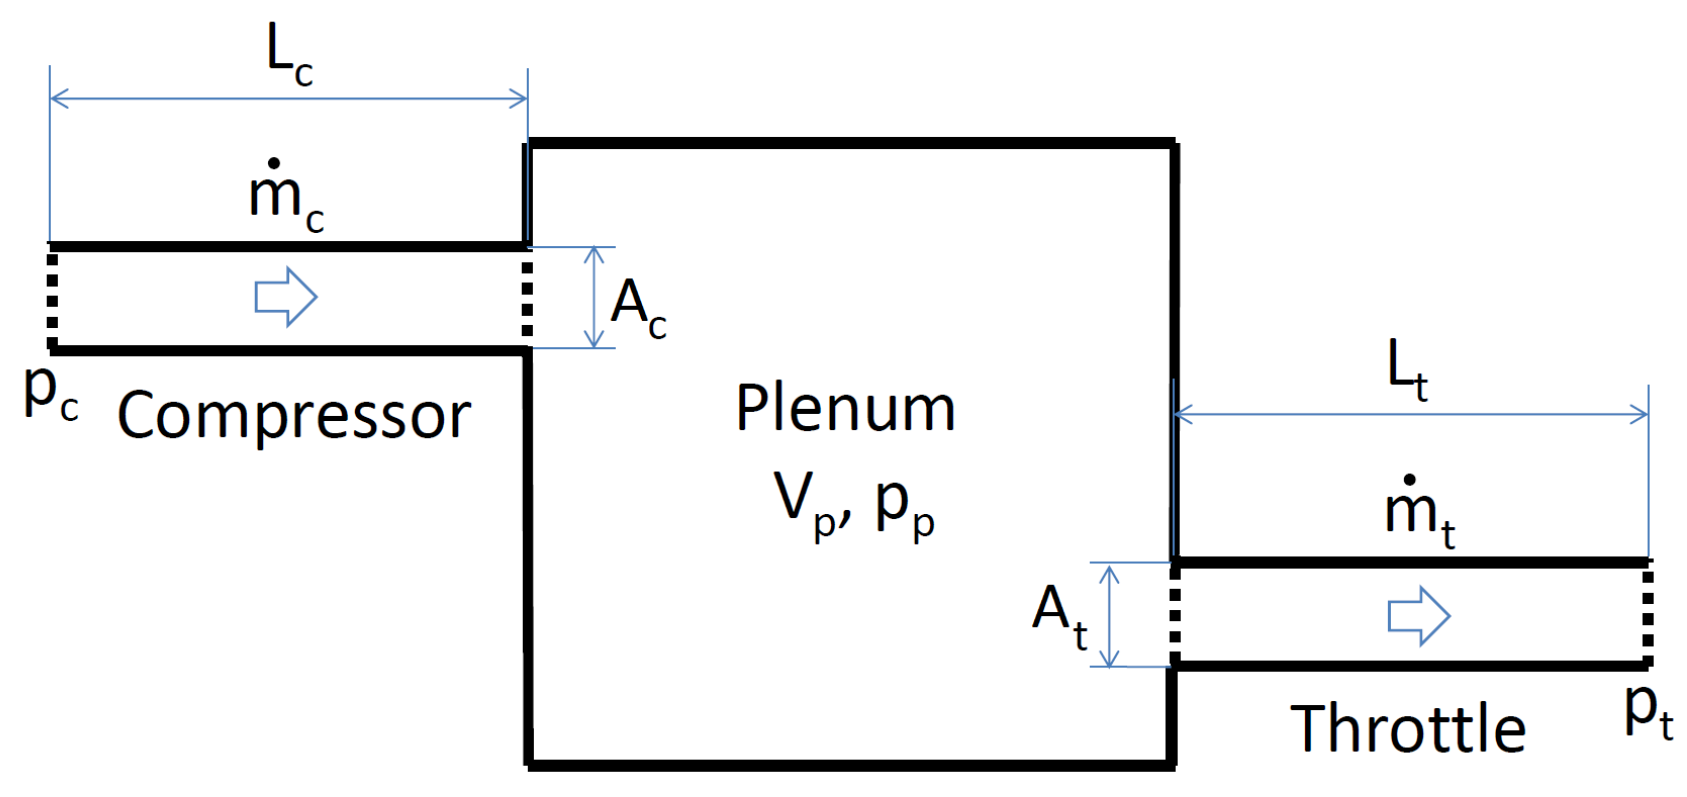
Figure 1. Compressing system in Greitzer model [27].
Energies 13 05111 g001
Figure 2. Cross-section of the blower used in the study. (A)—inlet pipe, (B)—Witoszynski nozzle, (C)—impeller, (D)—vane-less diffuser, (E)—circular volute, (F)—outlet pipe. Dimensions presented in the figure are defined in Table 1.
Energies 13 05111 g002
Figure 3. Cross-section of the blower with indicated positions of pressure gauges.
Energies 13 05111 g003
Figure 4. Amplitude of the mass flow rate oscillations as a function of C o and P l for different values of T O A .
Energies 13 05111 g004
Figure 5. Amplitude of the pressure rise oscillations as a function of C o and P l for different values of T O A .
Energies 13 05111 g005
Figure 6. Frequency of oscillations as a function of C o and P l for different values of T O A .
Energies 13 05111 g006
Figure 7. Average value of the pressure rise oscillations as a function of C o and P l for different values of T O A .
Energies 13 05111 g007
Figure 8. Average value of the mass flow rate oscillations as a function of C o and P l for different values of T O A .
Energies 13 05111 g008
Figure 9. Frequency of oscillations as a function of C o and P l for different values of N for T O A = 4.24 .
Energies 13 05111 g009
Figure 10. Average value of the pressure rise oscillations as a function of C o and P l for different values of N for T O A = 4.24 .
Energies 13 05111 g010
Figure 11. Frequency of oscillations as a function of C o and P l for different values of T h for T O A = 4.24 .
Energies 13 05111 g011
Figure 12. Average value of pressure rise oscillations as a function of C o and P l for different values of T h for T O A = 4.24 .
Energies 13 05111 g012
Figure 13. Comparison of experimental and numerical results. Horizontal surfaces on left and central plots correspond to values measured at the test stand, their cutting curves with numerical results are presented on the figure to the right.
Energies 13 05111 g013
Table 1. Table of the most important dimensions of the test rig.
ParameterNotationValue
Inlet pipe diameter D i n 300 mm
Rotor inlet diameter at hub D 1 h u b 86.3 mm
Rotor inlet span b 1 38.9 mm
Rotor outlet diameter D 2 330 mm
Rotor outlet span b 2 14.5 mm
Diffuser outlet diameter D 3 476 mm
Volute tongue gap δ g 5 mm
Diameter of outlet pipe D o u t 150 mm
Length of the outlet pipel 5.5 m
Volume of the outlet pipe V o u t 0.0968 m 3
Table 2. Comparison of values of L c parameters and radii of impellers for several Greitzer model applications presented in the literature.
SourceImpeller Radius L c
[9] 0.092 m 1.22 m
[13] 0.284 m 1.8 m/3 m
[15] 0.25 m 5.1 m
[16] 0.3 m 10.6 m