Article

Energy Analysis and Exergy Optimization of Photovoltaic-Thermal Collector

INSA Strasbourg ICUBE, University of Strasbourg, 67000 Strasbourg, France
*
Author to whom correspondence should be addressed.
Energies 2020, 13(19), 5106; https://doi.org/10.3390/en13195106
Submission received: 8 September 2020 / Revised: 24 September 2020 / Accepted: 28 September 2020 / Published: 1 October 2020

Abstract

:
A photovoltaic-thermal (PVT) collector is a solar-based micro-cogeneration system which generates simultaneously heat and power for buildings. The novelty of this paper is to conduct energy and exergy analysis on PVT collector performance under two different European climate conditions. The performance of the PVT collector is compared to a photovoltaic (PV) panel. Finally, the PVT design is optimized in terms of thermal and electrical exergy efficiencies. The optimized PVT designs are compared to the PV panel performance as well. The main focus is to find out if the PVT is still competitive with the PV panel electrical output, after maximizing its thermal exergy efficiency. The PVT collector is modelled into Matlab/Simulink to evaluate its performance under varying weather conditions. The PV panel is modelled with the CARNOT toolbox library. The optimization is conducted using Matlab gamultiobj-function based on the non-dominated sorting genetic algorithm-II (NSGA-II). The results indicated 7.7% higher annual energy production in Strasbourg. However, the exergy analysis revealed a better quality of thermal energy in Tampere with 72.9% higher thermal exergy production. The electrical output of the PVT is higher than from the PV during the summer months. The thermal exergy- driven PVT design is still competitive compared to the PV panel electrical output.

1. Introduction

Micro combined heat and power (µ-CHP) systems are operating in the building sector in order to produce heat and electricity simultaneously. The European Parliament has defined micro-cogeneration to be the units up to an electrical output of 50 kW [1]. Solar energy can be counted to be an inexhaustible source of energy, and it is mostly deployed in the building sector in terms of photovoltaic (PV) panels and thermal collectors [2]. This separated production of electricity and heat can be combined by the technology called photovoltaic-thermal (PVT). The PVT collector is a renewable solar-based micro-cogeneration unit which produces electricity by the PV module and useful heat by cooling the PV module with a coolant circulation. This leads to increased overall system efficiency but also to increased electrical efficiency of the PV cell due to the decreased operating temperature of the PV module [2].
Different kinds of PVT configuration have been developed and modelled in the literature. Zhang et al. [3] presented different practical applications of PVT technologies. They argued that the air-based PVT is the most commonly used and installed PVT technology, achieving the maximum thermal efficiency of 39% and electrical efficiency of 8%. The second very popular technology is the water-based PVT of which popularity is increasing due to its ability to increase electrical efficiency and better thermal energy utilization. Next to these two popular technologies, they brought a refrigerant-based PVT which has the potential to replace air- and water-based technologies because it can significantly improve the solar utilization rate compared to air- and water-based technologies. The fourth interesting technology is a heat-pipe-based PVT which is seen as a next-generation technology in terms of heat removal from the PV panel and its effective use. For the future technology, they also marked the integration of the phase change material to the PVT in order to increase energy efficiency. To increase the efficiency of the PVT collector, using nanofluids as heat transfer fluid have been investigated in [4,5].
The aforementioned PVT technologies face a challenge in that the electrical efficiency decreases as the operating temperature increases. On the other hand, higher operating temperature increases thermal efficiency. The novel PVT technologies are investigated and developed in [6,7] to solve this problem by thermally decouple the electrical and thermal units of the collector. These PVT systems use a spectral liquid beam splitter which divides the solar spectrum into different wavelength bands in front of the PV panel. These bands are then used separately by electrical and thermal units, and the liquid operates as cooling fluid [6].
The performance of the PVT system can be analyzed in terms of energy and exergy analysis. The latter is based on the second law of thermodynamics, and it takes into account also the quality of various kinds of energy. The exergy method helps to understand how useful the produced heat is in terms of mechanical work at the temperature in which the heat is available [8].
In the literature, several papers about the exergy analysis of CHP-systems and PVT collectors have been published. For example, Feidt et al. [9,10] used the exergy analysis to analyze the performance of different CHP-systems and proposed it to be essential for the optimization of the systems. Evola and Marletta [11] studied the energy and exergy performance of the glazed PVT collector. They conducted analyses based on the simulations for a water-based PVT collector. They optimized the coolant inlet temperature to maximize the overall exergy efficiency of the collector. They found that low inlet temperature leads to very high overall energy efficiency but in terms of exergy analysis, this is not recommended. The optimized inlet temperature and overall exergy efficiency varied between 30–42 °C and 14–15%, respectively, depending on the mass flow rate and the weather conditions.
The operation of the PVT collector is highly dynamic and influenced on the time-varying weather conditions. Due to this steady-state analysis of the PVT performance is not sufficient, but a dynamic model has to be implemented to evaluate the performance of the collector. In the literature, a range of theoretical PVT models has been introduced and validated based on the experimental data and literature [12,13,14]. Da Silva and Fernandes [15] conducted the dynamic simulations of the PVT collector combined with thermal storage. They implemented a dynamic model of the PVT system into the modular environment of Simulink in Matlab. The model was validated based on the literature and showed good agreement.
The PVT collector performance is highly dependent on the weather. Because of that, it is important to study the PVT performance in different locations with different climate conditions. In terms of energy analysis, the energy yield of the PVT collector is strongly depending on the solar irradiation of the considered location. However, in terms of exergy analysis, the ambient temperature around the PVT collector also has a big role. Barbu et al. [16] studied the energy performance of a residential PVT system under two similar climate conditions: Bucharest, Romania, and Strasbourg, France. Despite the similar climate conditions, their results indicated 10–12% better energy performance in Bucharest compared to Strasbourg. The study showed that the performance of the PVT is highly dependent on the local weather conditions and estimations of the performance are difficult to make before studying it locally. The PVT performance in different locations was studied in [17,18] as well.
Due to cooling underneath the PV module, the higher electrical output could be expected from the PVT collector than the PV panel. However, the PVT collector is not always fully packed with the PV, which may lead to lower electrical output despite higher cell efficiency. Abdul-Ganiyu et al. [19] undertook an experimental comparison of the water-based PVT collector and PV panel performance in Ghana. Their results indicated that the annual electrical output from the PVT was 149.92 kWh/m2 and from the PV 194.79 kWh/m2. The PV cell operating temperatures were lower in the PVT over a year. In their study, the PV panel had a higher rated power than the PVT collector. However, a numerical comparison between the PVT and PV is required to find out the impact of different PVT variables, such as the mass flow rate, packing factor and inlet temperature, on the comparison.
The multi-objective optimization techniques are used to solve optimization problems where the objectives are conflicting between each other. In terms of the PVT collector performance, the electrical efficiency suffers if the thermal efficiency is maximized and the other way round. Due to this, the PVT collector optimization should be done with the multi-objective optimization techniques that take into account the conflicting nature of the PVT operation. Tamayo Vera et al. [2,20] studied the multi-objective optimization of a water-based PVT collector performance parameters with the non-dominated sorting genetic algorithm-II (NSGA-II). They derived a Pareto optimal set, which illustrates the trade-off between solutions. The decision variables for multi-objective optimization problems of the PVT collector were the mass flow rate, packing factor and air gap thickness. They found that the solutions that simultaneously maximize both electrical and thermal efficiencies had a mass flow rate of 0.008 kg/s, packing factor of 0.6 and air gap of 8 cm. The air-based PVT collector was optimized using NSGA-II in [21]. Conti et al. [22] used multi-objective optimization to minimize the total costs and non-renewable primary energy consumption of a hybrid energy system, including PVT collectors in a nearly zero-energy building. The exergy efficiency of the PVT collector was optimized using the genetic algorithm in [23]. However, to the best of the author’s knowledge, there is no work focusing on the multi-objective optimization of the PVT collector’s thermal and electrical exergy efficiencies to maximize the quality of the produced energy. In the literature, there is also a lack of work to compare the optimized PVT designs with the PV panel performance.
In this given framework, a research contribution is provided by this paper by analyzing the water-based PVT collector’s energy and exergy performance under two different climate conditions. Compared to the previous work in the literature [16,17,18], this paper takes into account the northern location of Europe to be an opportunity for the PVT market by making a comparative analysis between the northern location of Tampere, Finland and southern location of Strasbourg, France. In France, PVT technology is more commonly in use than in Finland. Additionally, the PVT performance is compared to the PV panel in terms of the PV cell operating temperature and electrical output in both locations. The impact of different variables, such as the PVT packing factor, mass flow rate and inlet temperature, on the comparison, is investigated. The further contribution of this paper is to study the multi-objective optimization method of the PVT collector design with the genetic algorithm to optimize electrical and thermal exergy efficiencies and to understand how different PVT variables behave in the optimized design configurations. The Pareto optimal set of design solutions is derived. The contribution is extended to compare selected optimized PVT design configurations with the PV panel performance and to find out if the PVT is still competitive with the PV panel electrical output, after maximizing its thermal exergy efficiency.
First, the PVT collector and considered climate conditions are described. Next, the mathematical model of the PVT collector is presented. The covering equations of the model are implemented in Matlab/Simulink, which is a programming environment for numerical computation and data analysis. The PV panel is modelled to Simulink as a PV generator-block using the CARNOT Toolbox Version 7.0 developed by Solar-Institute Jülich of the FH Aachen, Jülich, Germany [24]. The energy and exergy analyses are conducted for the described PVT collector under two different climate conditions, and the results are discussed. The PVT collector and PV panel performance are compared. The multi-objective optimization of the PVT collector is conducted, and the Pareto optimal set is derived. Finally, the performance of the selected optimized PVT design configurations were compared to the PV panel.

2. Methodology

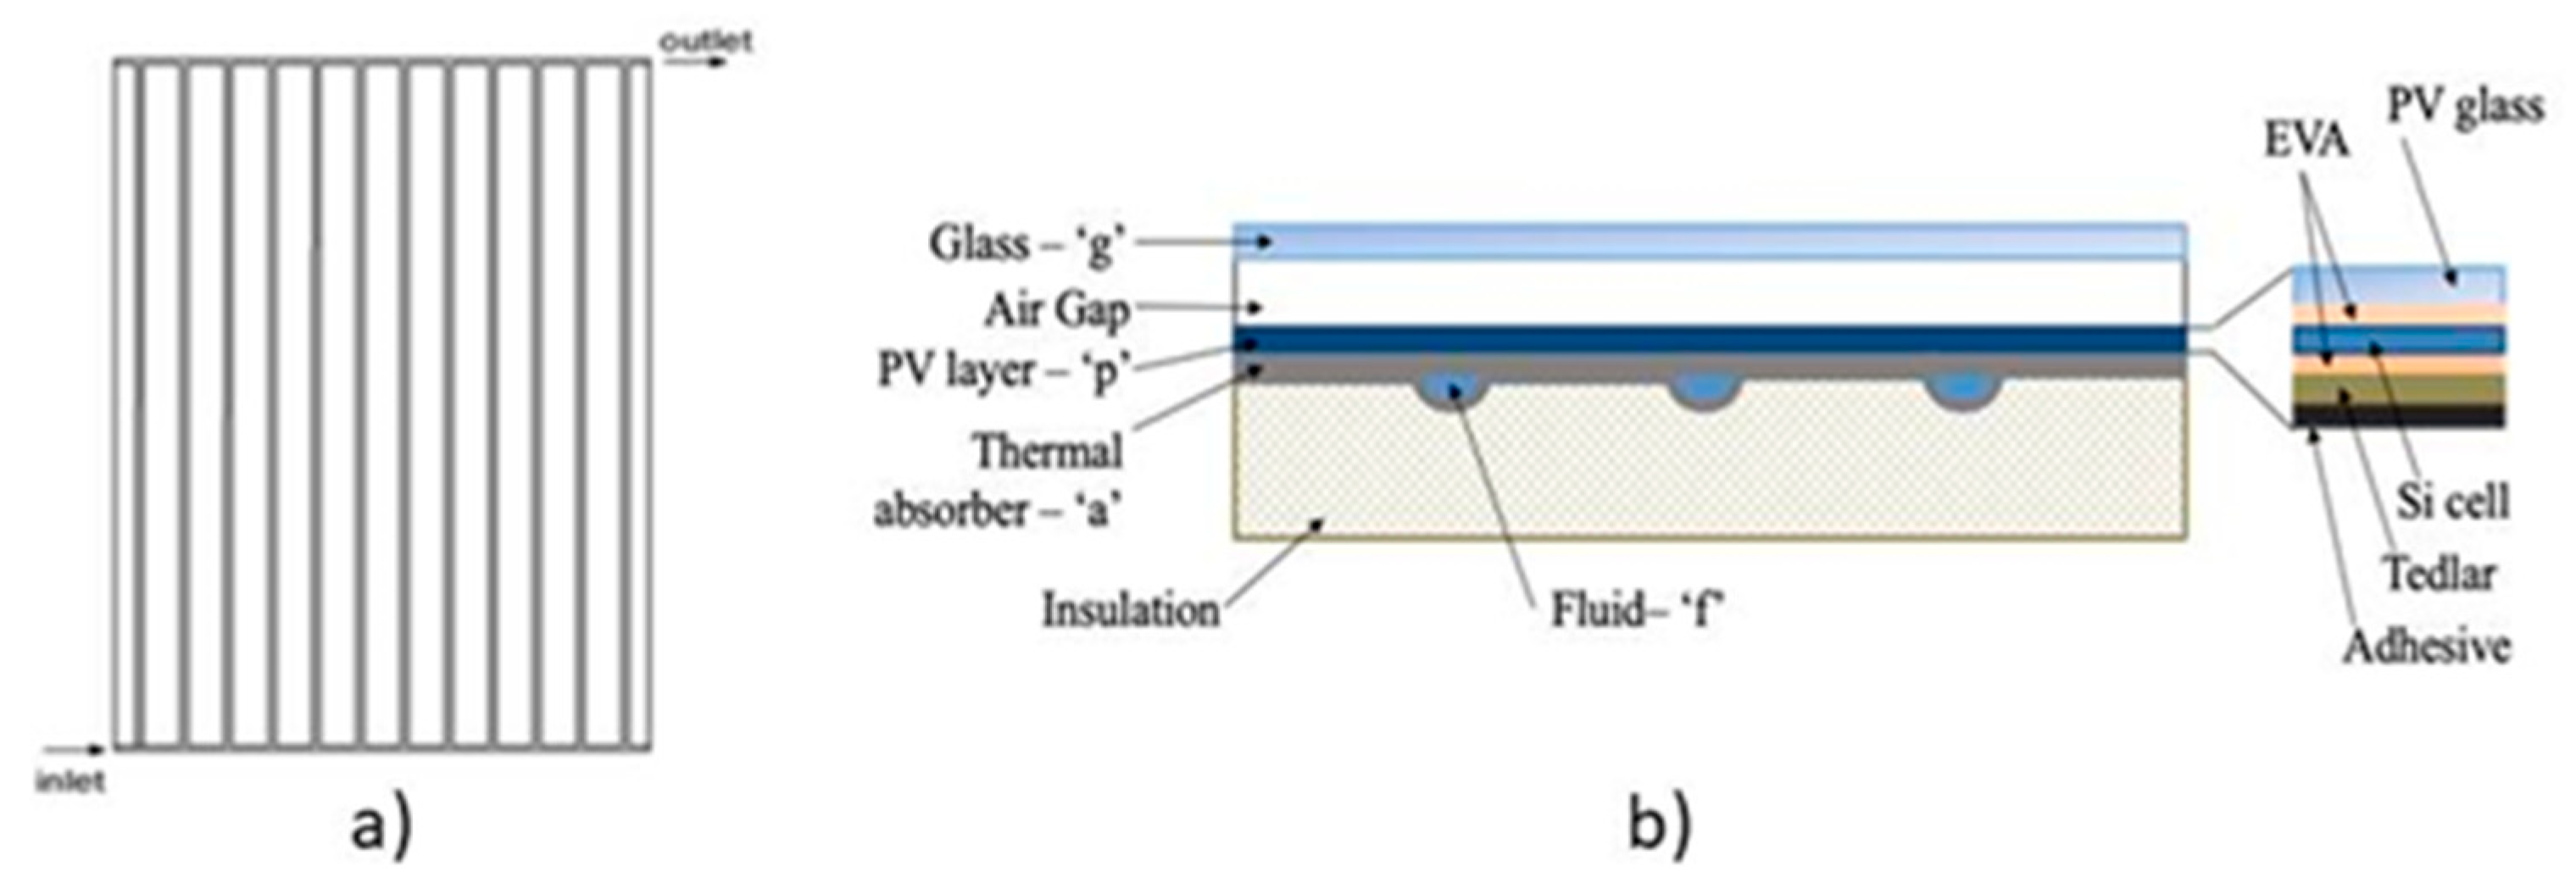
2.1. Description of Photovoltaic-Thermal (PVT) Collector

A water-cooled PVT collector with a sheet and tube heat exchanger is simulated and analyzed in this study. Figure 1 shows the geometry and cross-section of the PVT collector [16]. The collector consists of glazing, air gap, PV panel, absorber plate with tubes, working fluid and insulation. The cover glass limits the heat losses to the environment and the air gap of 2 cm between the glass and PV panel enhances the heat transfer. The PV layer consists of PV glass, EVA (ethylene vinyl acetate) films, silicon PV cells, protective Tedlar and bonding adhesive. The thermal absorber is a copper plate with the boned parallel water tubes. [13] The last layer is few centimeters thick insulation which prevents the heat losses to the environment. The water-based PVT collector is investigated because they achieve higher overall efficiency than air-based collectors due to the higher heat capacity of water [25]. High-efficiency PV cells are still relatively expensive, and in this study, the PVT collector has a polycrystalline silicon PV cell with a reference electrical efficiency (ηSTC) of 17.3% at the reference operating temperature (Tref) of 25 °C. The packing factor (rc) and the temperature coefficient (βT) are 0.804 and 0.405%/K, respectively. The diameter of the tubes is 9 mm, and the number is 10. The tilt angle of the PVT collector is 30°, which is only used to estimate transmittance of the cover glass in this study. Regarding to [14] the influence of the tilt angle on the transmittance is irrelevant. The inlet temperature of the water-glycol coolant fluid is 20 °C. Table 1 summarizes the main geometrical, thermo-physical, optical properties and the parameters of the PVT collector used in the simulation and analyses.
The following assumptions are taken into account in the mathematical modelling:
  • The temperature distribution is uniform in the layers.
  • It is assumed that there are no heat losses through the edges.
  • The optical and thermal properties of the materials and fluids are constant.
  • No surrounding shading or dust is taken into account.
  • The thermal resistance between the layers is negligible.
  • The ambient temperature is equal around the PVT collector.

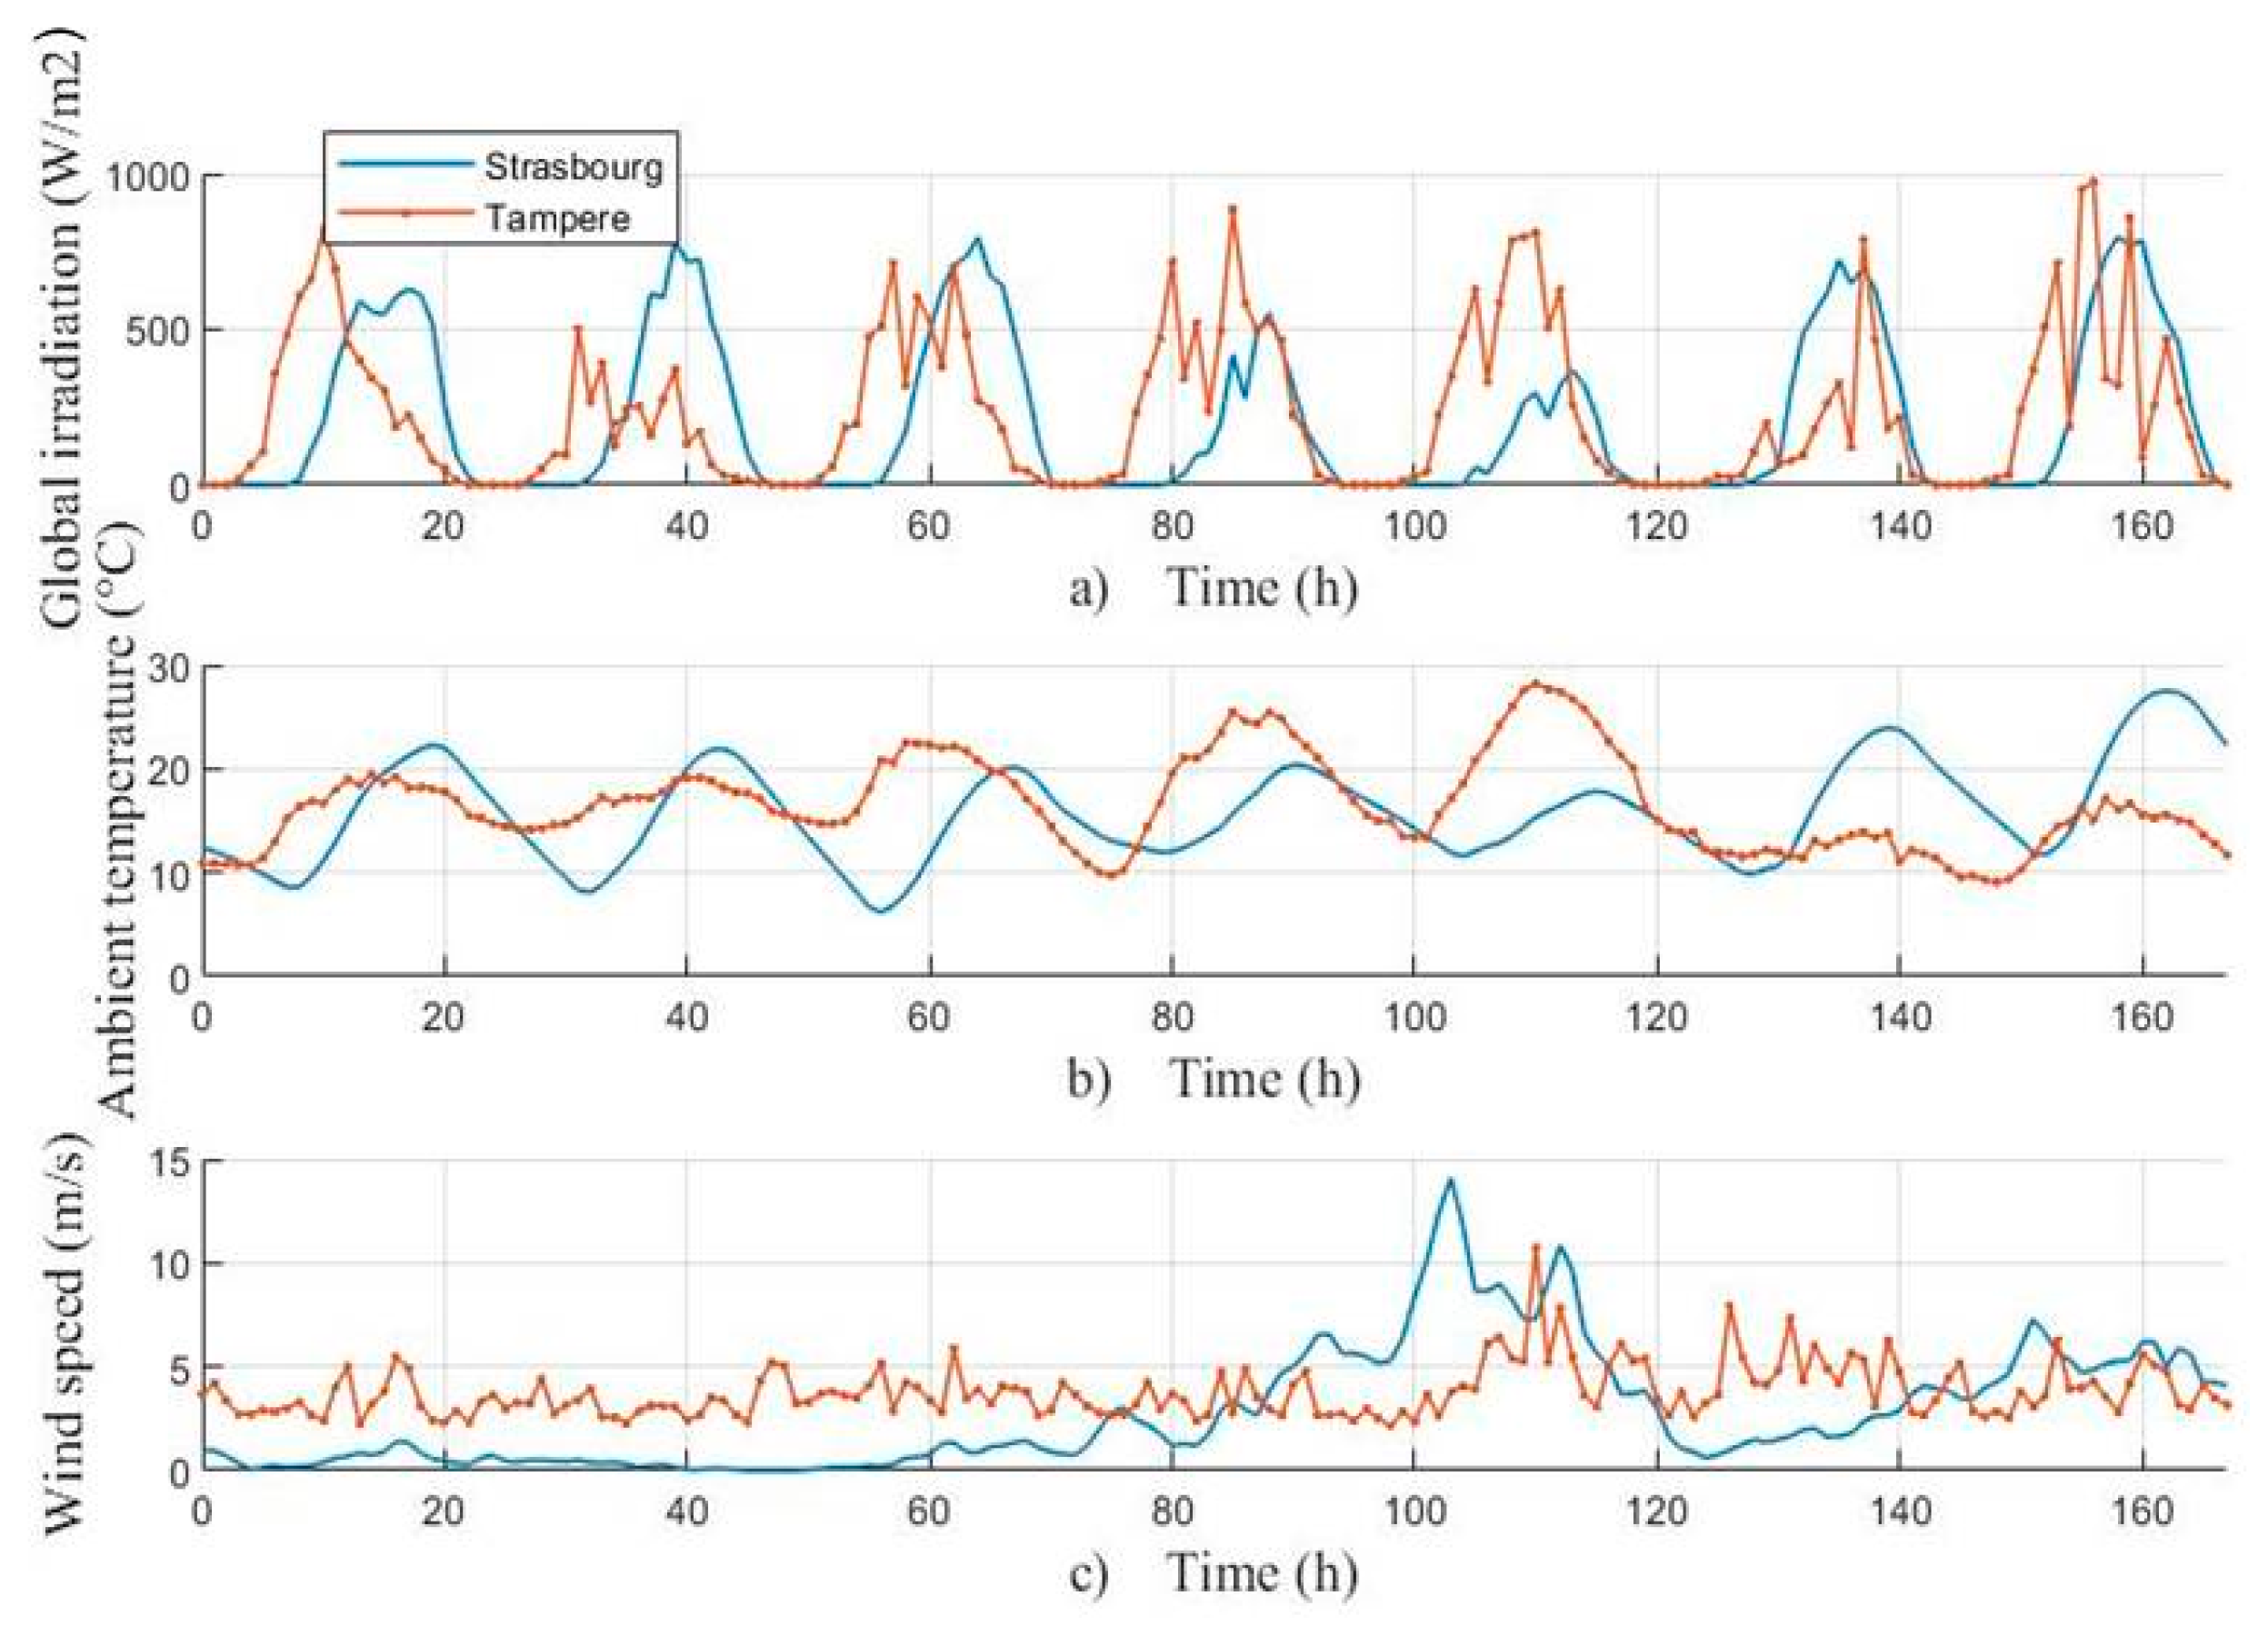
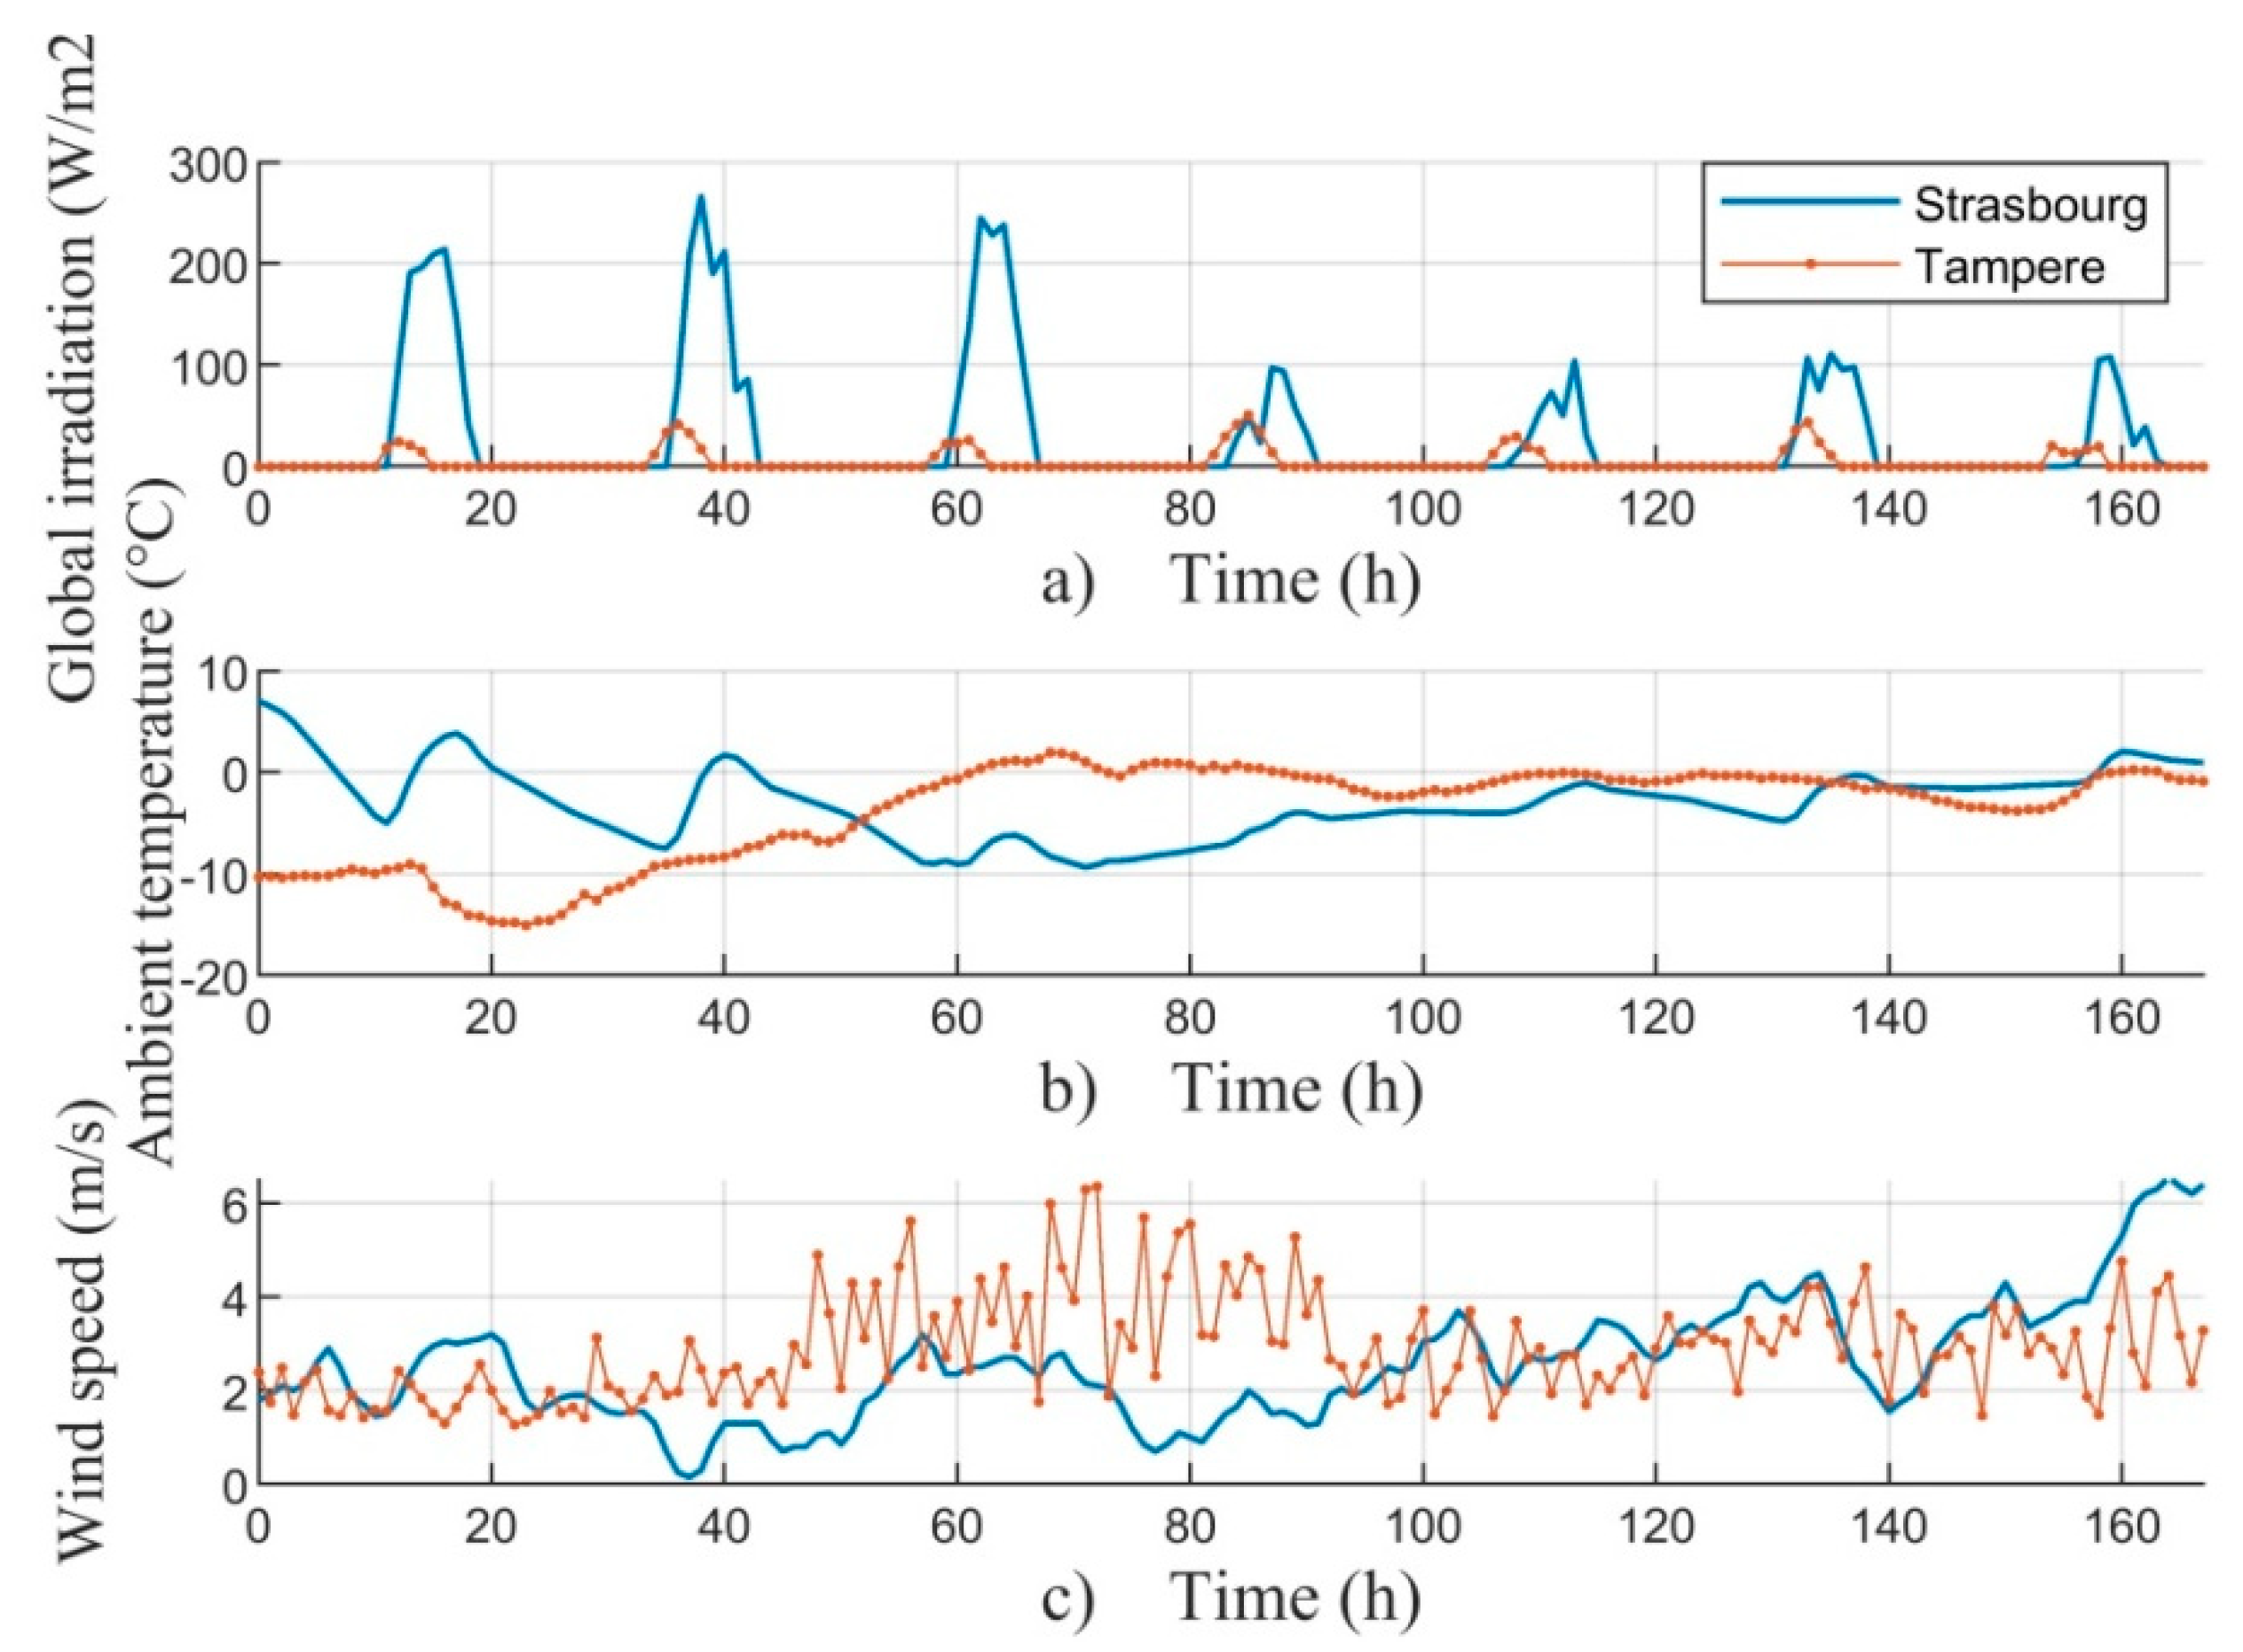
2.2. Meteorological Data

The behavior of the PVT collector depends strongly on the meteorological conditions. The main influence weather parameters are the solar irradiation, ambient temperature and wind speed. The solar irradiation influences strongly on the electrical output of the PVT and it heats up the material layers of the collector through radiative heat transfer. The ambient temperature and wind speed influence on the temperatures of the PVT layers through the convective and conductive heat transfer. The wind speed influences strongly the heat losses through the surface and back of the PVT collector. In this paper, two different climate conditions are compared, and the behavior of the PVT collector and PV panel under these conditions is investigated.
The selected meteorological conditions are at Tampere, Finland, and Strasbourg, France. Tampere is the second largest city of Finland and the largest inland city in the Nordic countries. It is located 180 km to the north from the capital city Helsinki. According to Köppen climate classification Tampere has a typical subarctic climate border, which means that the ambient temperature is above 10 °C only 3 months in a year. Tampere also borders on an isolated warm-summer humid continental climate, which means that the winters are cold and summers are cool to warm.
Strasbourg is located in the Central Europe in Northern France at the border with Germany. It is the largest city of the Grand Est region of France. According to Köppen climate classification Strasbourg has oceanic and semi-continental climate. This means warm and relatively sunny summers and cool winters.
The hourly yearly meteorological data of Tampere is obtained from the experimental measuring center of Tampere University. The similar data for Strasbourg is obtained from the Meteonorm Database.
The following figures present samples of the hourly climate data of Tampere and Strasbourg. Figure 2 shows the solar irradiation, ambient temperature and wind speed, respectively, during a summer week in Tampere and Strasbourg.
In Figure 2a can be seen that during the summer period the solar irradiation in Tampere can reach the same maximum values around 800 W/m2 than in Strasbourg.
Figure 2b presents the ambient temperature, and it can be seen again that in Tampere temperatures as high as in Strasbourg can be reached.
Figure 2c shows that the wind speed is more stable in Tampere and stays the most of the time between 2.5 m/s to 5 m/s. In Strasbourg the wind speed is really low the most of the week with values below 2.5 m/s but also really high values, over 5 m/s, during some periods of the week.
Figure 3 shows the solar irradiation, ambient temperature and wind speed, respectively, during a winter week in Tampere and Strasbourg.
Figure 3a shows the solar radiation at the end of December, which is the darkest time of the year. It can be seen that the solar irradiation in Tampere is almost non-existent and the PVT collector can produce neither electricity nor heat.
Figure 3b presents the ambient temperature, which reaches negative values in both Tampere and Strasbourg.
Figure 3c presents the wind speed, which is slightly slower in Tampere during the winter period than the summer period. On the other hand, in Strasbourg the wind speed is higher in winter than in the summer period. The wind speed influences on the convective heat losses of the PVT collector. The slow wind speed during the summer period can be seen as a benefit in terms of the heat production due to reduced convective heat losses.
Table 2 shows the monthly average outdoor temperatures in Tampere and Strasbourg based on the statistics in [26,27].

2.3. Mathematical Model

A dynamic numerical model of the glazed flat-plate water-cooled PVT collector is presented in this paper. The model is used to assess the energy and exergy performance of the PVT collector under different climate conditions.
The PVT collector is modelled a layer by layer in order to see the temperatures of each layer and the coolant fluid outlet temperature. In this paper the study of the energy and exergy performance is conducted by looking at the control volume in Figure 4. The considered control volume composed of a glass layer, PV panel, absorber plate, a grid of tubes for the coolant fluid flow and insulation.

2.3.1. Numerical Model of PVT for Energy Analysis

The energy analysis of the PVT collector is based on the first law of thermodynamics and energy performance of the system can be evaluated based on the analysis. The analysis takes into account the thermal and electrical efficiency of the PVT collector and thermal and electrical energy produced by the collector during a certain time period.
The energy balance equations are developed and solved for each layer and the coolant fluid, and for dynamic energy analysis [13].
The governing equations are based on the variation of internal energy in a physical body:
mc dT dt = dU dt ,
The energy balance for the glass layer “g” considers on the right hand side the heat losses to the environment consisting of the forced convective heat transfer due to wind (Qg-e,CV) and radiative losses (Qg-e,RD). On the other hand, there is the convective and radiative heat transfer from the glass to the PV layer in the air gap (Qg-pv,CV and Qg-pv,RD) and heat absorbed by the glass Qg [13].
m g c g dT g dt = Q g e , CV + Q g e , RD + Q g pv , CV + Q g pv , RD + Q g   = h g e , CV A ( T e T g ) + h g e , RD A ( T sky T g ) + h g pv , CV A ( T pv T g ) + h g pv , RD A ( T pv T g ) + A α g G irr ,
The heat transfer coefficient of forced convection (hg-e,CV) is expressed through the correlation proposed by [28] and is widely used for numerical PVT models. The correlation covers the wind speed from 0 to 10 m/s.
h g e , CV = { 5.7 + 3.8 v w       for   v w < 5 m s 6.47 + v w 0.78       for   v w > 5 m s         ,        
The heat transfer coefficient of the radiative heat loss (hg-e,RD) is calculated based on the emissivity of glass (εg), the Stefan–Boltzmann constant (σ = 5.67 × 10⁻⁸ W/m2/K4) and the equivalent radiative temperature of the sky (Tsky). The temperature of the sky can be calculated as a linear function of the ambient temperature and the sky cloud coverage in octaves (N) [25]. If clear sky conditions are assumed or there is no data available on the cloud coverage, Equation (5) can be further simplified to Equation (6), with less than 1% effect on the thermal and electrical output of the system [29,30].
h g e , RD = ε g σ ( T g 2 + T sky 2 ) ( T g + T sky ) ,
T sky = 0.0552 T e 1.5 + 2.652 N ,
T sky = 0.0552 T e 1.5 ,
The thermal coefficient of the gap (hg-pv,CV) takes into account the convective heat transfer in the air gap.
h g pv , CV = Nu air k air H gap ,
The Nusselt number correlation for inclined plates, tilt angles from 0 to 60, is given by [31]. Hgap and kair are the thickness of the air gap between glazing and PV layer and thermal conductivity of air, respectively. The radiative coefficient between the glass and the PV panel (hg-pv,RD) is expressed below:
h g pv , RD = 1 1 ε pv + 1 ε g 1 σ ( T g 2 + T pv 2 ) ( T g + T pv ) ,
The thermal balance of the PV layer “pv” considers the convective and radiative heat transfer to the PV layer (Qpv−g,CV and Qpv−g,RD) from the glass layer, the conductive heat transfer to the absorber layer (Qpv−a,CD) through the adhesive layer and the conductive heat transfer through the adhesive layer to the tube at the tube bonding position, the heat absorbed by the PV layer (Qpv), and electricity production (E).
m pv c pv dT pv dt = Q pv g , CV + Q pv g , RD + Q pv a , CD + Q pv t , CD + Q pv E   = =   h g pv , CV A ( T g T pv ) + h pv g , RD A ( T g T pv ) + h pv a , CD A pv a ( T a T pv ) + h pv t , CD A pv t ( T t T pv ) +   G irr ( α τ ) pv G irr r c η EL ( T ) ,
The heat transfer coefficient in the air gap and the radiation coefficient are calculated in Equations (7) and (8). (ατ)pv is the effective absorbance. In Equation (9):
h pv a , CD = k adh   H adh   ,
A pv a = A ( 1 D o   W ) ,
h pv t , CD A pv t = H pv L   x pv 2 k pv + H adh k adh H pv D o   ,
x pv = W   4
The PV converts a fraction of the solar radiation into the electricity. However, this also increases the operation temperature Tpv, which causes a reduction of the electrical efficiency of the PV cell. Due to this, the electrical efficiency of the PV depends linearly on the temperature Tpv, the temperature coefficient βPV and on the efficiency at standard conditions Tref. The efficiency is calculated according to the following relation:
η EL ( T ) = η STC [ 1 β PV ( T pv T ref ) ] ,
The thermal balance of the absorber layer “a” considers the conductive heat transfer to the PV layer (Qa−pv,CD), the heat transfer to the fluid (Qa−f) and the heat loss to the exterior through the insulation (Qa−e,CD).
m a c a dT a dt = Q a pv , CD + Q a t + Q a i , CD = =   h a pv , CD A a ( T pv T a ) + h a t A a t ( T t T a ) + h a i , CD A a i ( T i T a ) ,
where,
A a i = A ( W D o   W ) ,
A a t = H a L ,
h a t = 2 k i x a ,
h a i = 2 k i H i ,
x a = ( W D o ) 4
The heat transfer coefficient to the PV layer (ha−pv,CD) is the same as in Equation (10).
The energy balance for the tube bonding “t” considers the conductive heat transfer between the absorber plate (Qt-a,CD), PV layer (Qt-pv,CD), insulation (Qt-i,CD) and the coolant fluid (Qt-f).
m t c t dT t dt = Q t pv , CD + Q t a , CD + Q t i , CD + Q t f = =   h t pv , CD A pv t ( T pv T t ) + h t a A a t ( T a T t ) + h t i , CD A t i ( T i T t ) + h t f A t f ( T f T t ) ,
where,
A t f = π D i L ,
A t i = ( π 2 + 1 ) D o L ,
The heat transfer coefficient of the fluid depends on the type of flow (laminar or turbulent) [32].
h t f = { 4.36 k f D H ,         for   Re < 230 0.023 k f D H Re 0.8 Pr 0.4 ,    for   Re > 2300 2 k f D H ,          for   m ˙   = 0   kg / s
The energy balance for the insulation “i” considers the heat transfer from the absorber plate, tube and to the environment due to conductive and convective heat loss.
m i c i dT i dt = Q i a , CD + Q i t , CD + Q t e , CD + CV = =   h a i , CD A a i ( T a T i ) + h t i , CD A t i ( T t T i ) + h i e , CD + CV A ( T e T i ) ,
The energy balance for the coolant fluid “f” considers the thermal energy coming from the tube (Qf−t) and the heat accumulated by the fluid (Qf) as follows:
m f c f dT f dt = Q f a + Q f =   h t f A t f ( T a T f ) +   m ˙   c f ( T f , in T f , out ) ,
The heat transfer coefficient of the coolant fluid (ht-f) is calculated in Equation (24). Tf is the mean temperature of the fluid. The mass flow rate of the fluid in the channels is   m ˙ (kg/s) and Tf,in and Tf,out are the inlet and outlet temperatures of the fluid, respectively.
T f = 0.5 T f , in + 0.5 T f , out ,
The full derivation of the governing equations is presented by Chow [13]. The Equations (2), (9), (15), (21), (25) and (26) are implemented to assess the energy performance of the PVT collector. The following thermal, electrical and overall efficiencies can be calculated:
η el = E AG irr ,
η th = m ˙   c f ( T fout T fin ) AG irr ,
η overall =   m ˙   c f ( T fout T fin ) + E   AG irr

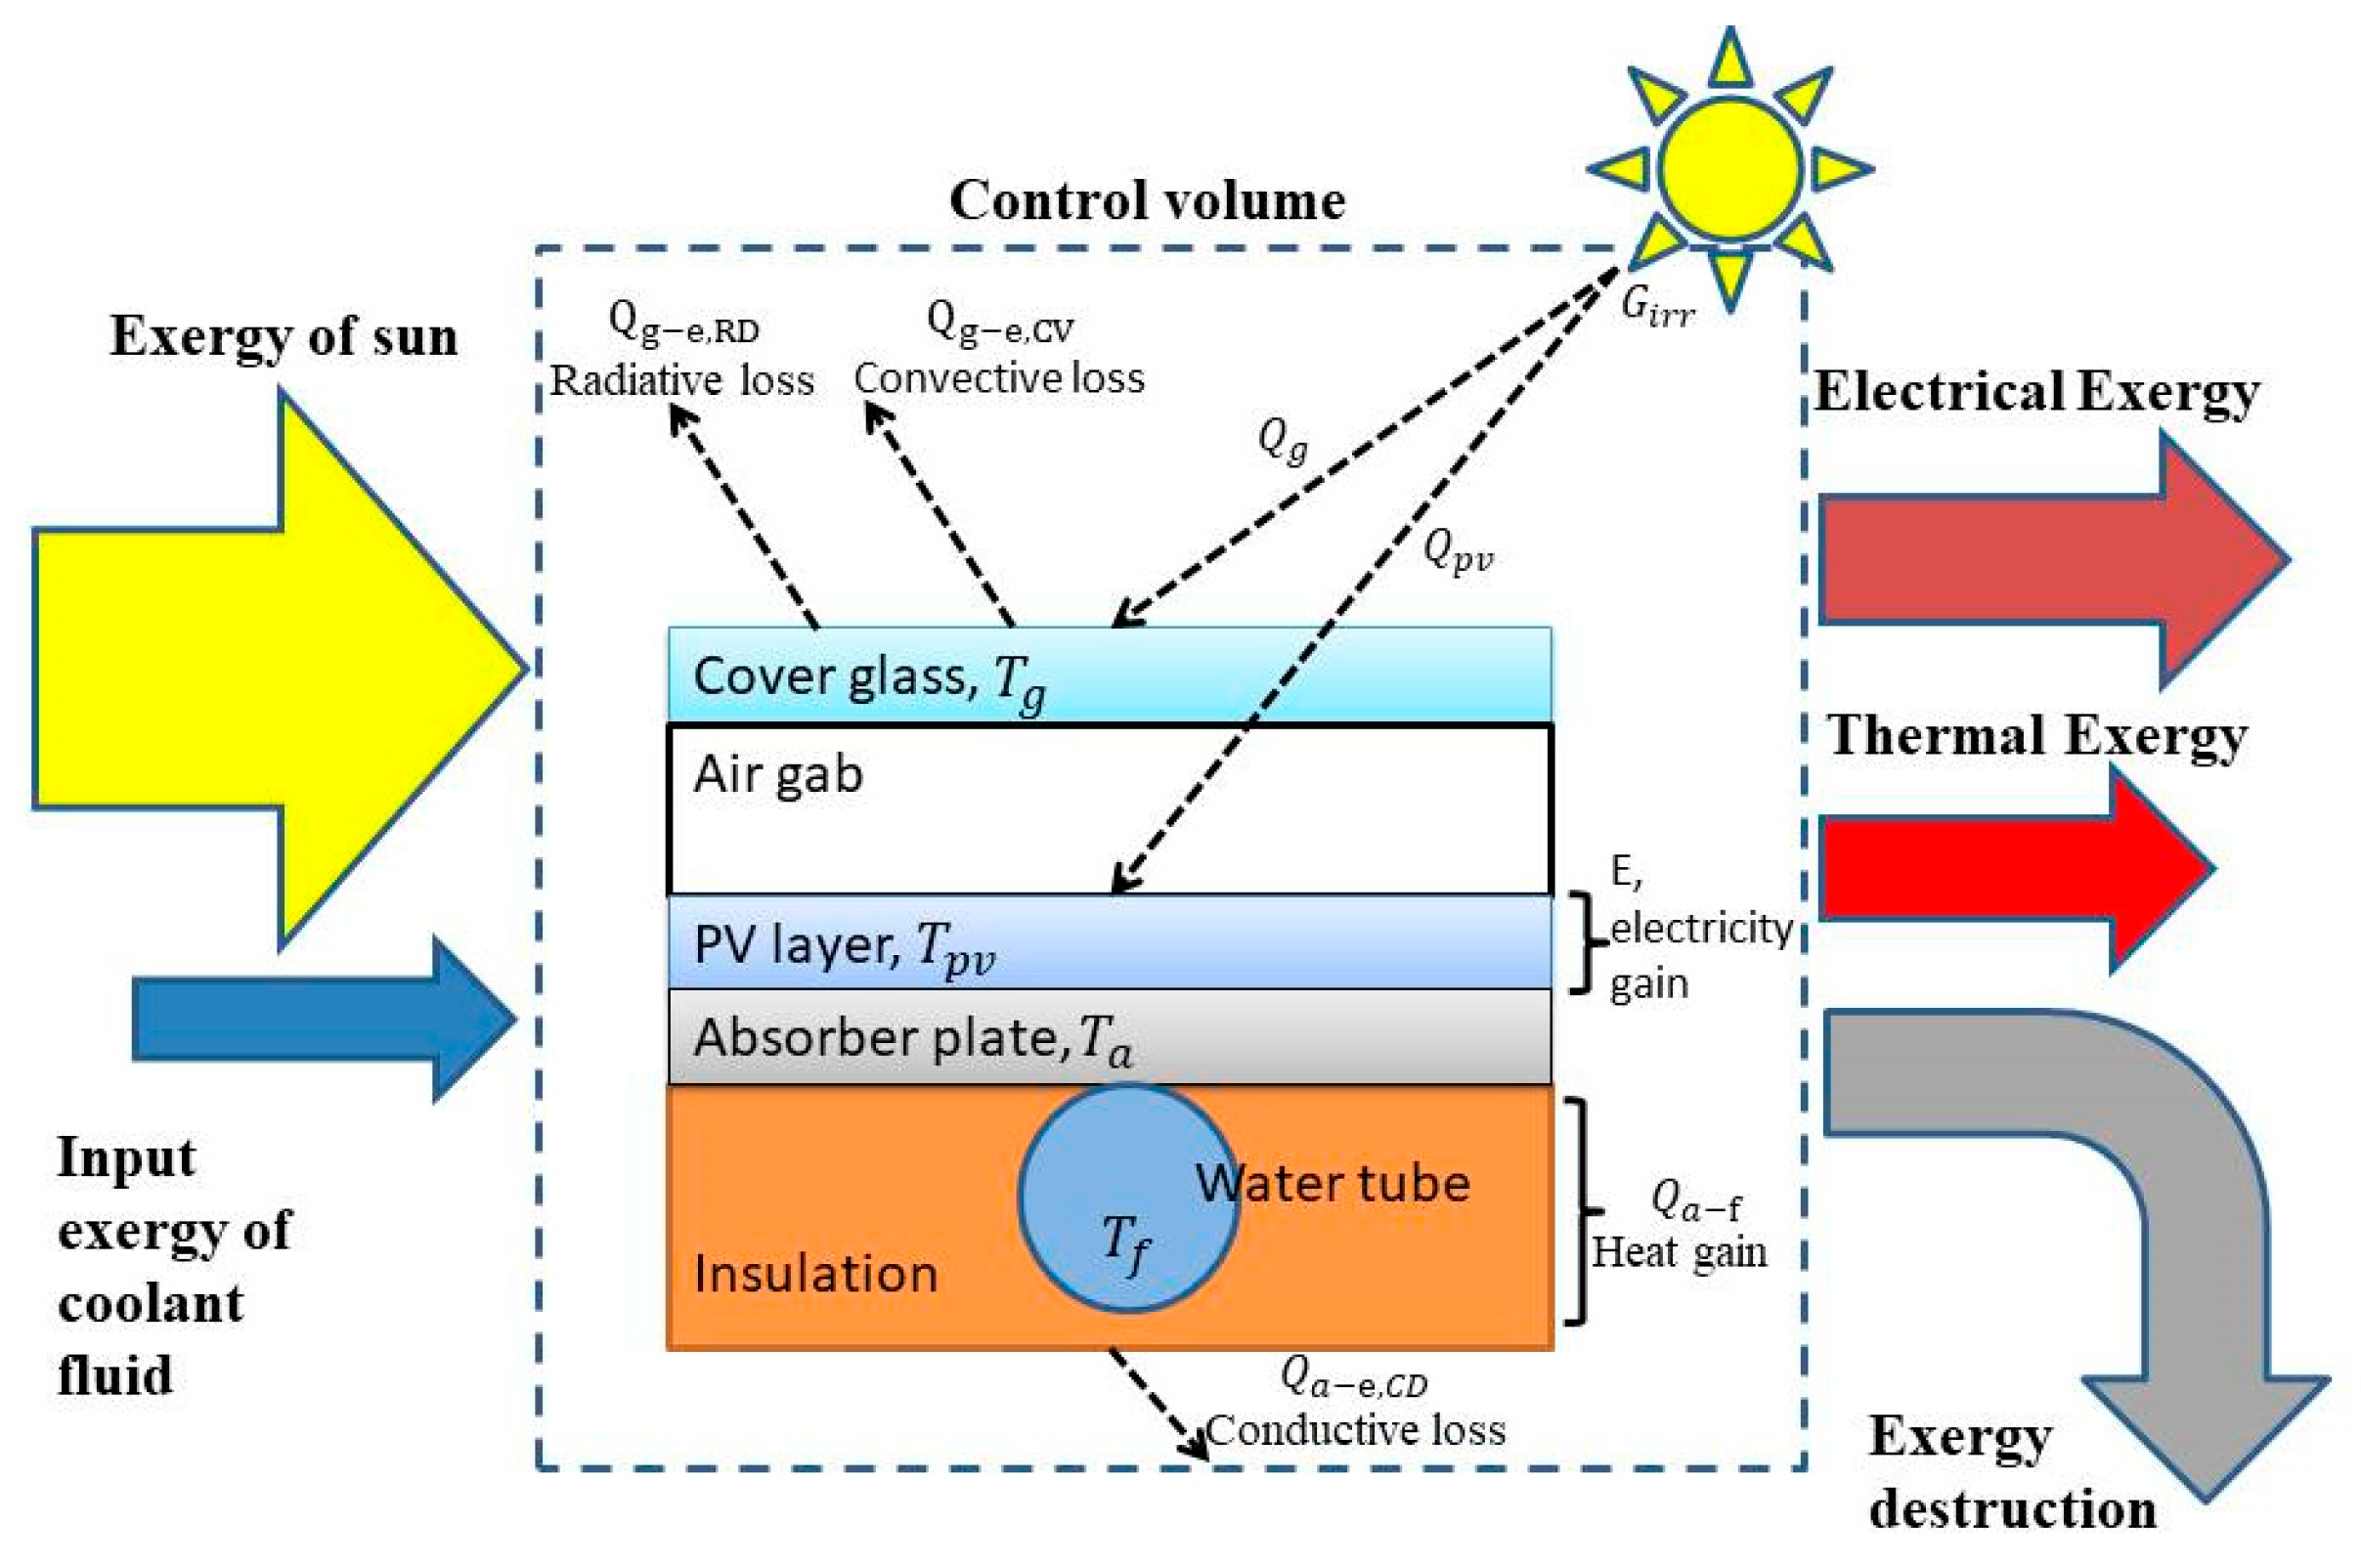
2.3.2. Numerical Model for Exergy Analysis

Compared to energy analysis the exergy analysis is based on the Second Law of Thermodynamics and takes into account the quality of energy. The exergy balance of the system can be expressed as follows:
Ex in ( Ex th + Ex el ) =   Ex d ,
In the case of PVT collector the exergy flow to the system (Exin) comes from solar irradiation. However, solar irradiation is not seen as pure exergy and due to this a conversation coefficient is included in the calculation of the PVT incoming exergy [10]:
Ex in =   AN c G irr ( 1 4 3 T 0 T sol + 1 3 ( T 0 T sol ) 4 ) ,
In Equation (32) Tsol is the solar temperature and T0 is the reference temperature which according to the literature should be a constant, for example, T0 = 20 °C, T0 = 25 °C or the average temperature of the month. In this study, the monthly average outdoor temperatures, presented in Section 2.2, were used in the exergy analysis as reference temperatures. Nc is the number of the collectors.
Electric energy is seen as pure exergy, but the exergy content of thermal energy depends on the temperature at which the heat is made available. In the model, the exergy of thermal (Exth) and electric (Exel) energy are respectively calculated as follows [5]:
Ex th =   m ˙   c f [ ( T out T in ) T 0 ln T out T in ] ,
Ex el =   η pv G irr rA
where ηpv presents the PV cell efficiency and r is a packing factor which is a ratio of PV cell area to the collector area. By Equations (32)–(34) both thermal (ξth) and electrical exergy (ξel) efficiencies and the overall exergy efficiency (ξ) of the PVT collector can be calculated as follows:
ξ th =   Ex th Ex in ,
ξ el =   Ex el Ex in ,
ξ overall =   Ex el + Ex th Ex in

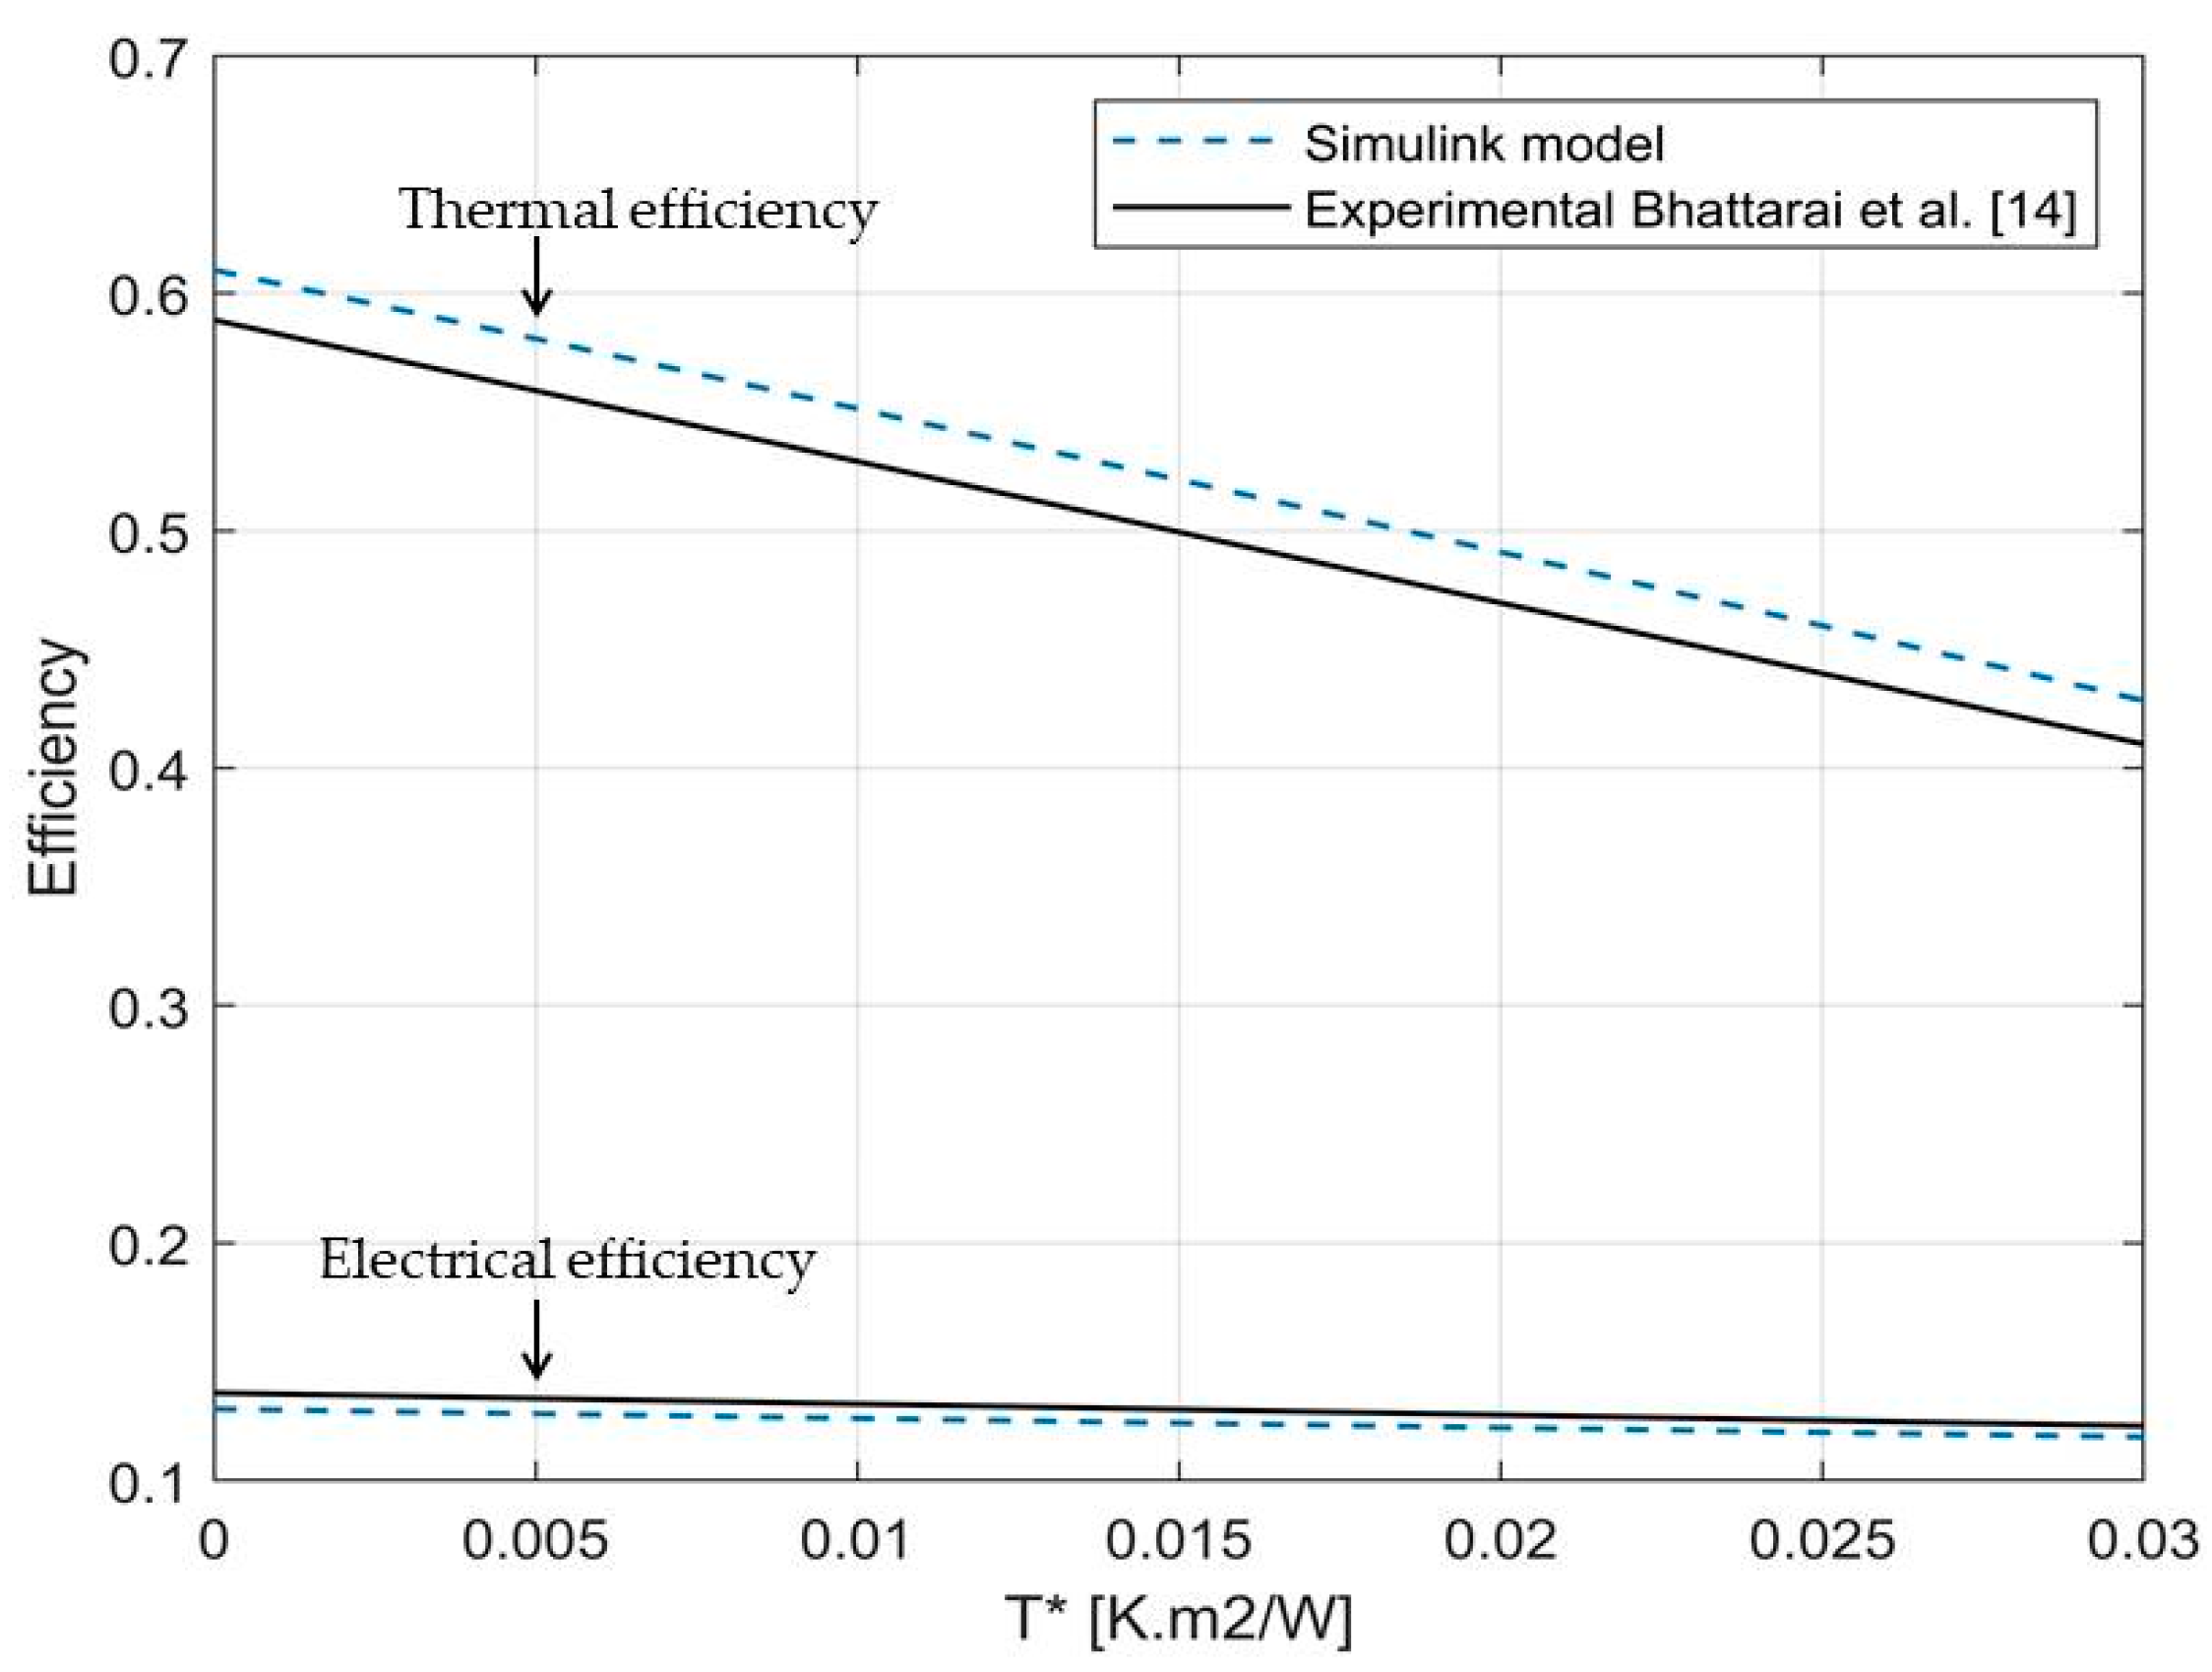
2.3.3. Model Validation

In order to conduct the energy and exergy analysis and design optimization of the PVT, the implemented numerical model was validated by comparing the model results to the experimental data shown in [14] in the same steady-state condition: solar radiation 800 W/m2, ambient temperature 30 °C and wind speed 1 m/s, and is presented in Figure 5. The model is in good agreement with the experimental data of the reference.
The numerical PVT model was used to plot the variation of the electrical and thermal efficiencies against the reduced temperature in Equation (38).
T * =   T in T e G irr ,
The reduced temperature takes into account that the thermal efficiency depends on inlet and environment temperature and global solar irradiation.
The PVT thermal efficiency of 58.87% and electrical efficiency of 13.69% under zero reduced temperature conditions were reported in [14]. In Figure 5, the corresponding values from the Simulink model are 60.97% and 13.01%. The good agreement with the experimental data allows the model to be used for the energy and exergy analysis and optimization in this study.

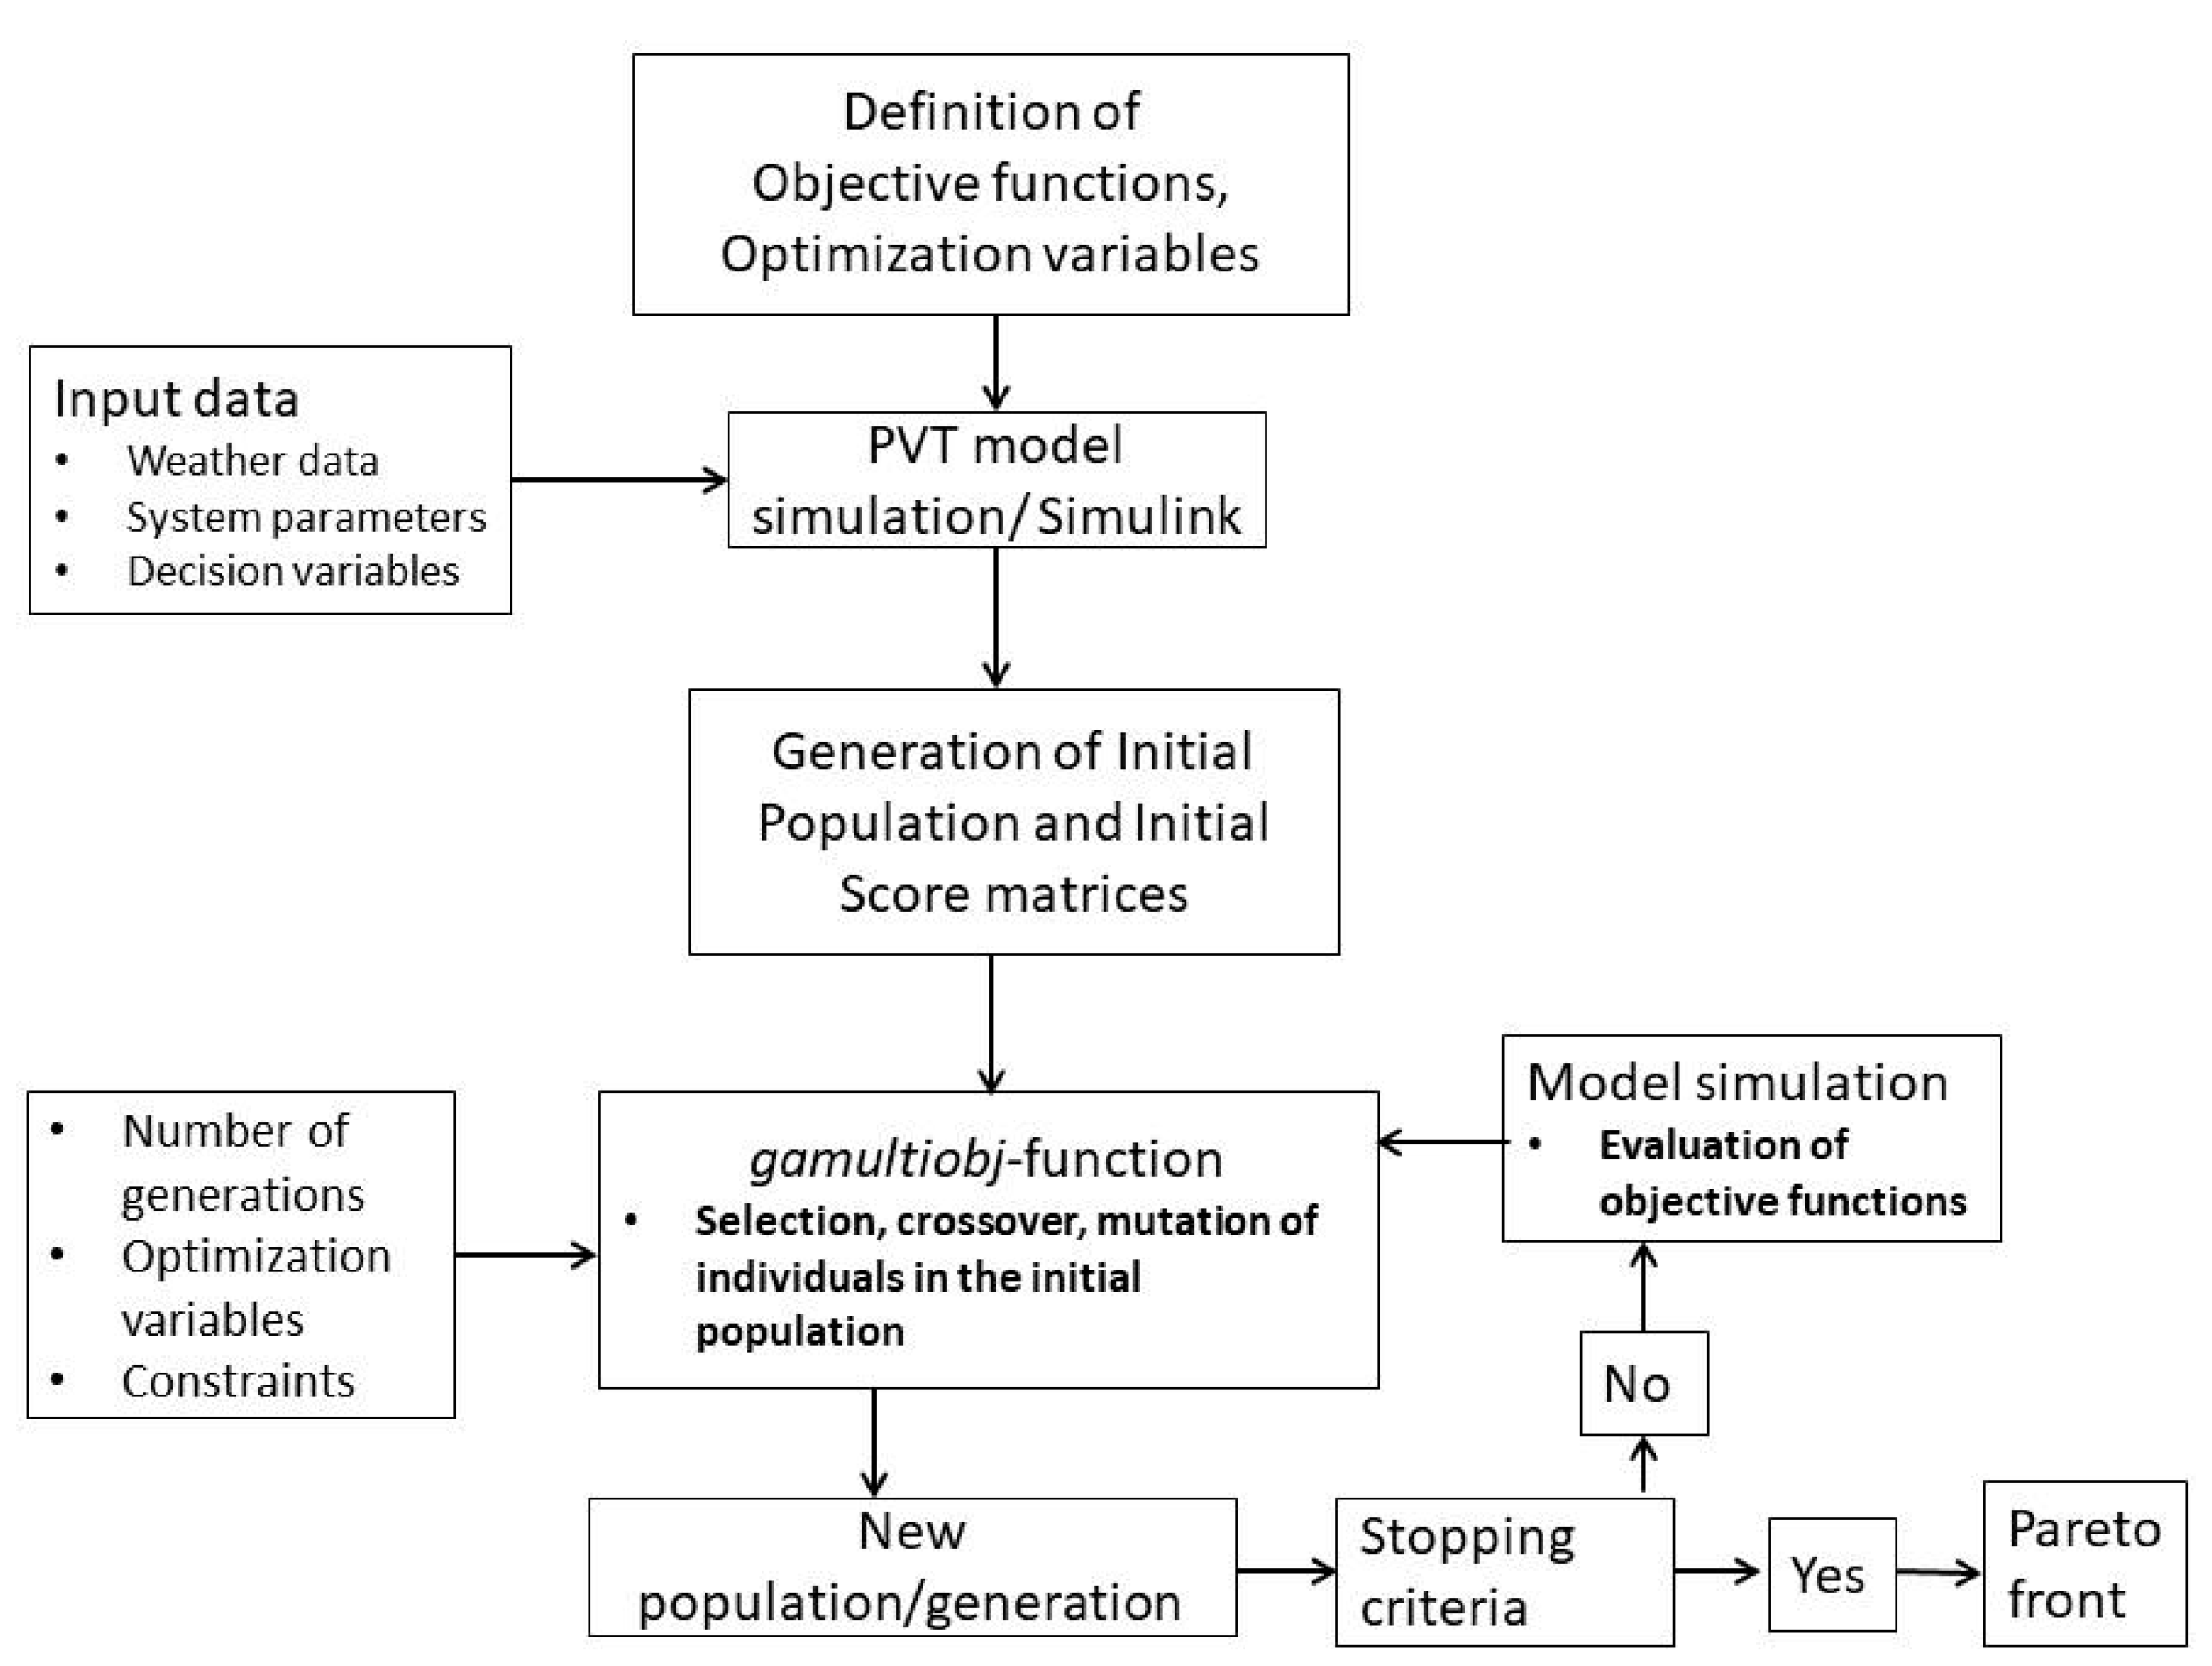
3. Multi-Objective Optimization of PVT Collector

The energy and exergy performance analyses based on the simulations of the PVT model show a conflict between performance parameters, such as thermal and electrical energy and exergy efficiencies, as functions of various decision variables. The electrical efficiency of the PV panel decreases when the operating temperature of the collector increases. On the other hand, increased operating temperature leads to the higher thermal energy and exergy efficiency. This means that both efficiencies cannot be directly maximized at the same time, but a solution has to be found, which satisfies both trade-off objectives (electrical and thermal exergy efficiencies in this study) at the same time. The thermal simulations of the PVT system alone do not provide a set of optimal solutions of decision variables in terms of thermal and electrical exergy efficiencies. This set can be found by using the multi-objective optimization (MOO) technique with an evolutionary algorithm.

Multi-Objective Optimization Using Gamultiobj Function

In this study, the Matlab function called gamultiobj of the Global Optimization Toolbox is used to run the multi-objective optimization of the PVT collector design. The gamultiobj function creates a set of optimal solutions in the space of decision variables on the Pareto front. The function uses a controlled, elitist genetic algorithm, which is a variant of NSGA-II [33]. Generally, the multi-objective optimization problem of two or more conflicting objectives is described mathematically as follows [2]:
Minimized/Maximized fm(x), m = 1, 2, …, M;
Subject to gj(x) ≥ 0, j = 1, 2, …, J;
hk(x) = 0, k = 1, 2, …, K;
xi(L) ≤ x ≤ xi(U), i = 1, 2, …, n;
In this formulation, the objective functions are minimized or maximized subject to certain constraints.
In this work, the overall electrical and thermal exergy efficiencies are two objectives to be optimized. Due to the fact that the NSGA-II is a minimization tool, the objective functions are multiplied by (−1) in order to get the maximum values [2]. The 2-dimensional optimization problem of the exergy efficiencies is formulated as follows:
To minimize:
f 1 ( x ) =   Ex el Ex in =   η STC [ 1 β PV ( T pv T ref ) ] G irr A pv AN c G irr ( 1 4 3 T 0 T sol + 1 3 ( T 0 T sol ) 4 ) = ξ el ,
f 2 ( x ) =   Ex th Ex in =     m ˙ c f [ ( T out T in ) T 0 ln T out T in ] AN c G irr ( 1 4 3 T 0 T sol + 1 3 ( T 0 T sol ) 4 ) = ξ th
where ξel and ξth are the electrical and thermal exergy efficiencies, respectively.
The optimization decision variables were selected based on the sensitivity analysis, which has shown the most sensible parameters of the PVT collector operation in terms of exergy efficiencies. These parameters are the cooling-water mass flow, inlet temperature, air gap thickness between the cover glass and PV module and insulation thickness. Table 3 presents the decision variables to be optimized and their upper and lower bounds to be used in the optimization.

4. Results and Discussion

First, the dynamic model is used to evaluate annual energy and exergy performance of the PVT collector under two different climate conditions described in Section 2. The main performance differences between two selected climate conditions are revealed and assessed. Additionally, a comparison between the PVT and PV panel performance under the described climate conditions is conducted. The main focus of the comparison is on the electrical output, operating temperature and on the impact of the PVT packing factor. Secondly, the results of the multi-objective optimization are presented and discussed. The selected optimized PVT designs are compared to the PV panel performance.

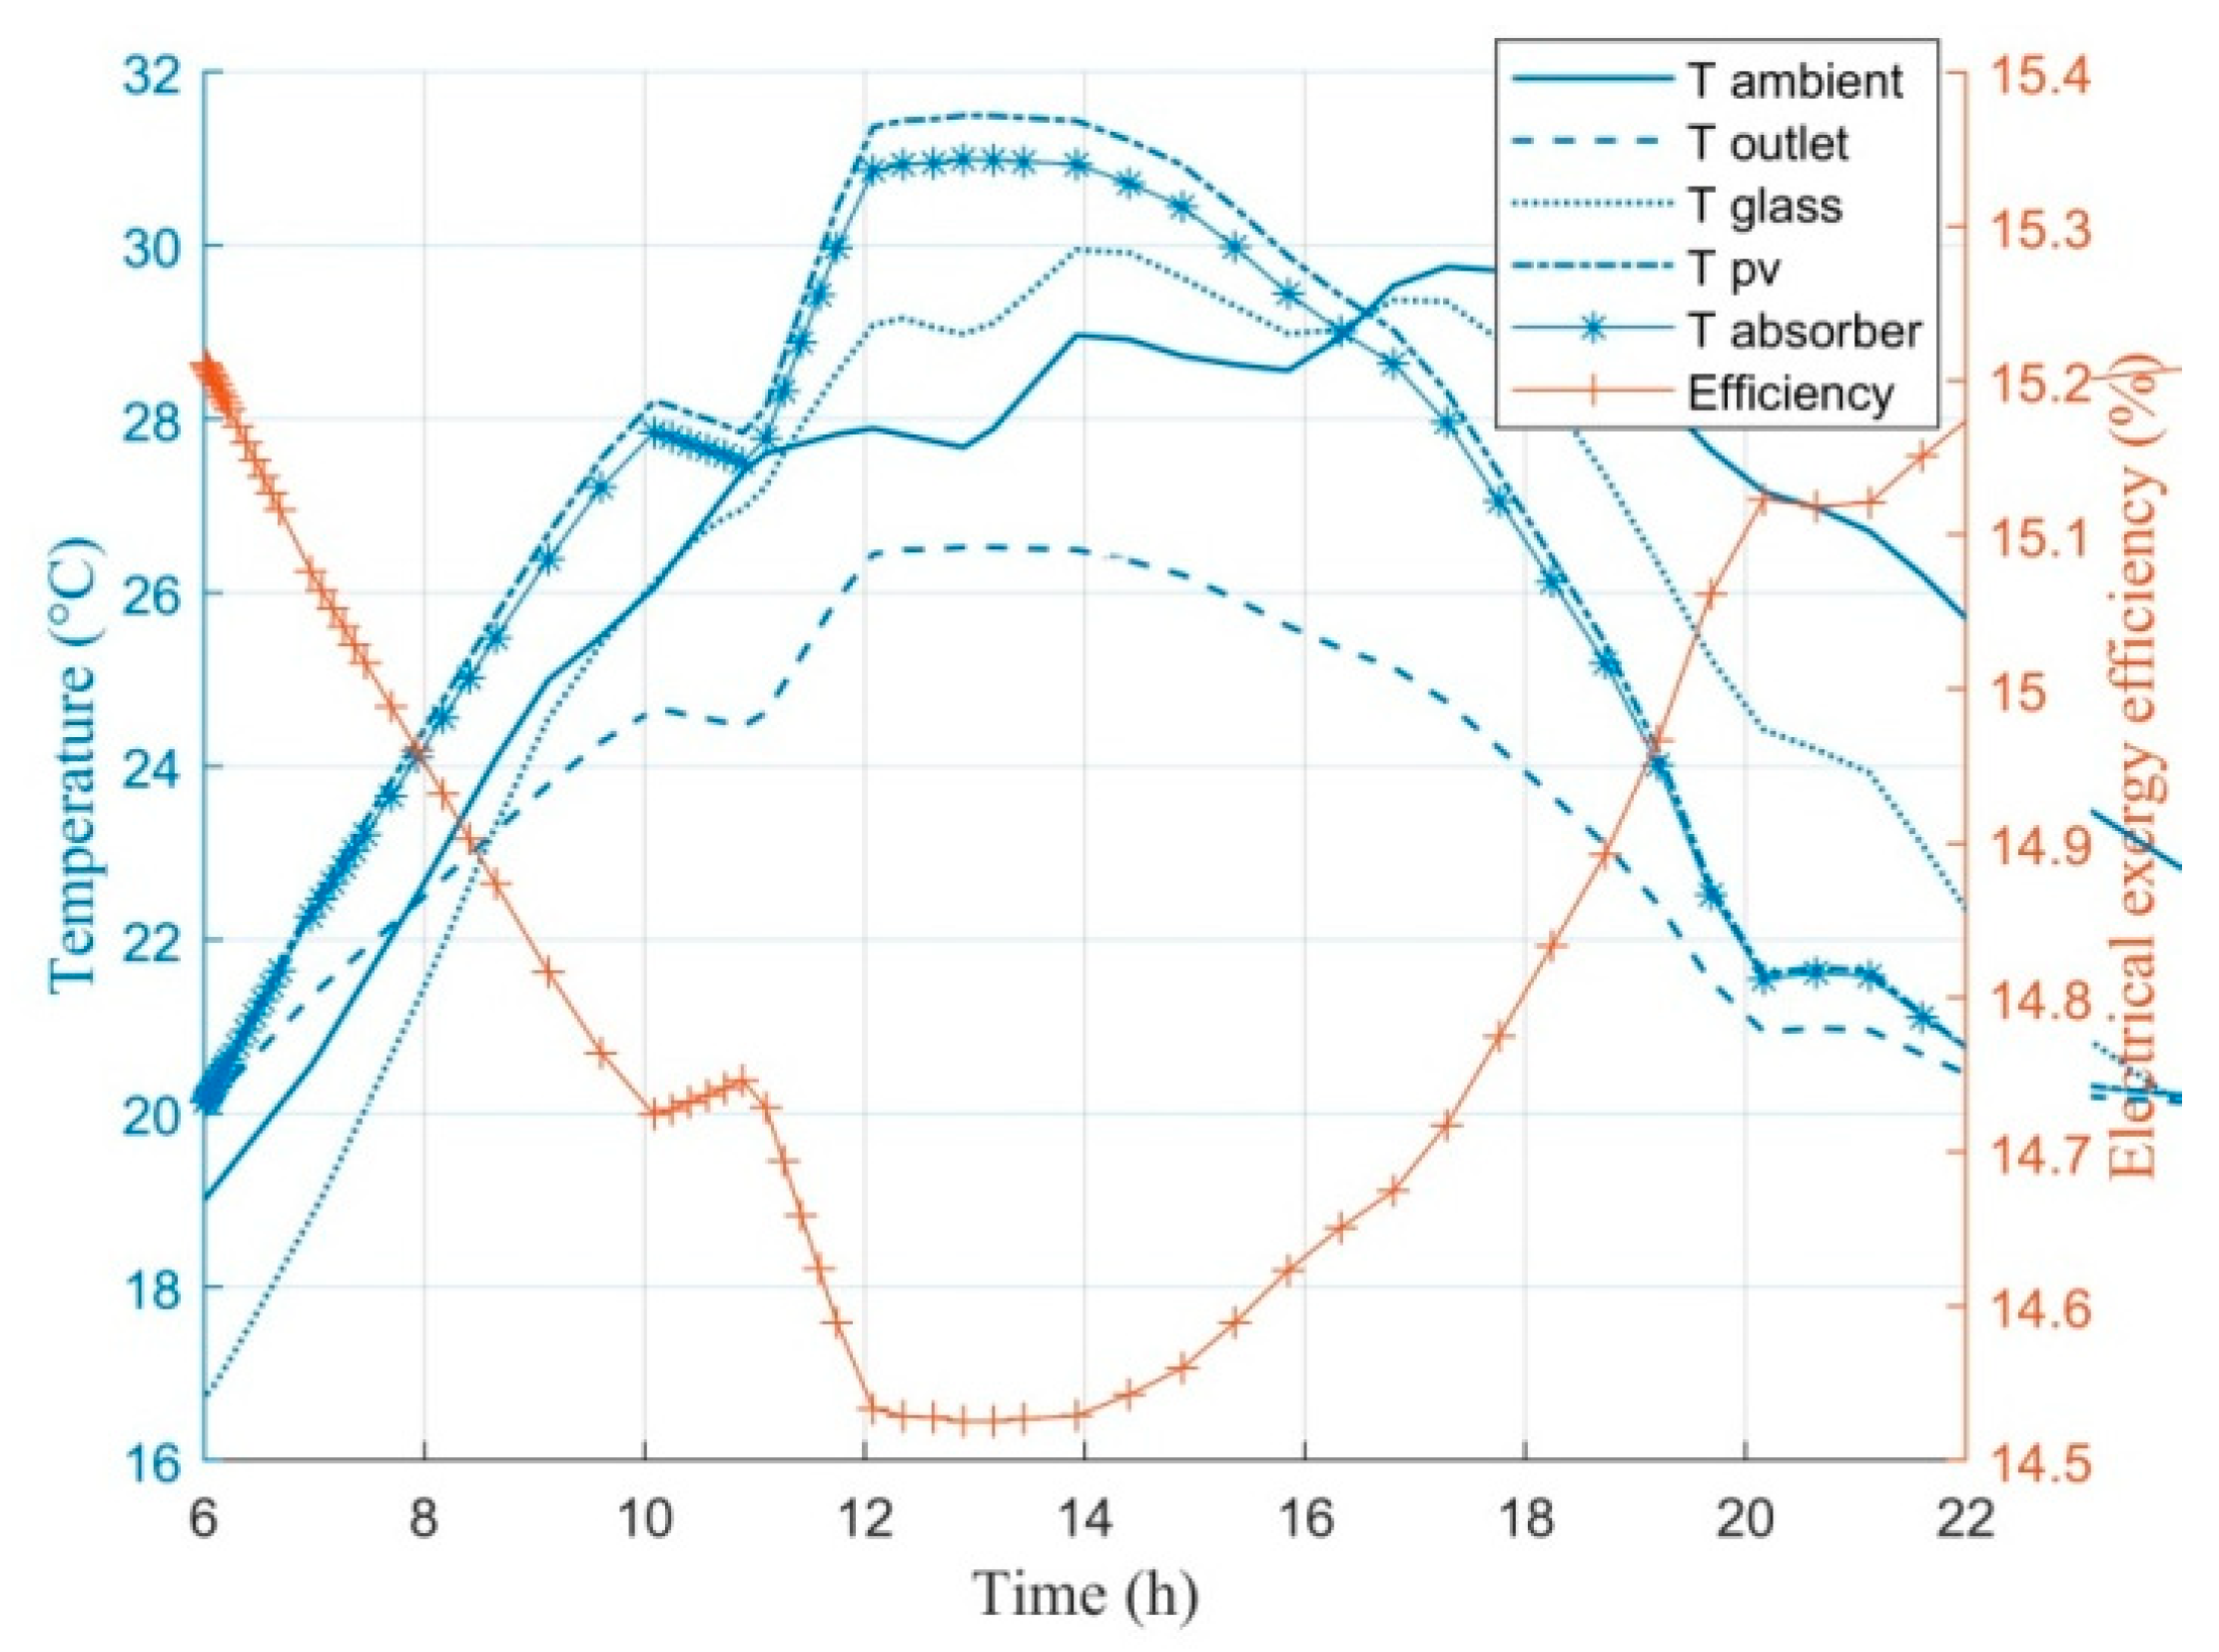
4.1. Simulation Results

Hourly simulations were conducted with the dynamic PVT model. The electrical power output of the PVT collector was illustrated during the summer and winter weeks. The summer week was selected to present a good summer week in Tampere and Strasbourg. Because of the northern location of Tampere, the selected summer week in Tampere was at the end of June, and in Strasbourg in the beginning of August. The winter week was in both cases at the end of December.
Figure 6 presents generated electrical power, which reached the same maximum level, around 200 W, in the northern and southern locations during the summer week. However, during the winter week, solar irradiation is almost non-existent in the northern location because of the polar night and the electrical power generation is zero. In the southern location, there is still the possibility for electric power generation during the winter week.
The PV cell efficiency is influenced by its operating temperature. The electrical exergy efficiency is always slightly higher than the electrical energy efficiency because solar irradiation is not seen as pure exergy but is reduced by the factor in Equation (32). Figure 7 shows the simulation of the PVT layer temperatures over a day and how the electrical efficiency decreased when ambient, collector surface and coolant fluid outlet temperatures increased, and vice versa. On the other hand, an increase in the collector temperature results in the higher thermal efficiency due to the better heat transfer to the coolant fluid. In other words, when operating a PVT collector, both electrical and thermal efficiencies cannot be maximized at the same time.
Next, the annual energy and exergy production and efficiencies were simulated and analyzed monthly. The thermal exergy generation and efficiency are influenced by the ambient temperature. To evaluate these parameters fairly under the different climate conditions, the reference temperature for the exergy analysis was selected to be an average outdoor temperature of the considered month based on the statistics. The monthly average temperatures for Tampere were taken from [26] and Strasbourg from [27].
Figure 8 shows the monthly thermal and electrical efficiencies in Tampere and Strasbourg over a year. It reveals that the monthly electrical efficiency reached 0.4–6.8% higher values in the northern location due to the cooler climate conditions and lower PV operating temperature. However, during the summer months, the efficiency was 13.8% in both locations. The thermal efficiency did not realise zero values in Strasbourg, but in Tampere, the thermal energy production was zero during January, November and December. The thermal efficiency varied the most between two locations in mid-summer. In June the thermal efficiency suffered due to the rainy summer weather of the northern location. In the southern location, the summer weather was more stable, and there was no sign of a significant drop in efficiency.
The energy performance results show that there was no significant difference between the northern and southern location in terms of maximum thermal and electrical efficiencies. Next, the analysis of the exergy efficiencies is conducted to reveal the quality of the energy produced in the northern and southern location.
The monthly thermal and electrical exergy efficiencies in Tampere and Strasbourg are shown in Figure 9. The results show that although the thermal efficiency in Tampere and Strasbourg followed a similar shape over the year, the thermal exergy efficiency did not show the same trend between the locations. The comparison of Figure 9a,b reveals that the highest thermal exergy efficiency of 2.47% was reached in Tampere in May and in Strasbourg already in March 1.62% although the highest thermal efficiencies of 62% and 58.4%, respectively, were reached in both locations in July. The thermal exergy efficiencies were significantly lower than the thermal energy efficiencies. That means the PVT collector can convert the available solar energy well into useful heat, but it happens close to the reference ambient temperature. The useful heat has low quality in terms of its ability to do mechanical work.
After reaching the highest point, the thermal exergy efficiency decreased in both locations due to increased ambient temperature of the summer weather conditions. After the summer months June, July and August, the thermal exergy efficiency increased to the same level than before the summer months in the southern location but in the northern location the efficiency did not increase after summer months due to decreasing ambient temperature and amount of solar irradiation.
The thermal exergy efficiency was 44–255% higher in Tampere between April and September than in Strasbourg due to good solar irradiation level but relatively lower monthly average outdoor temperatures presented in Table 2. The study of the thermal exergy efficiency revealed that thermal energy produced has higher quality in the northern location than the southern.
The electrical exergy efficiency behaved similarly to the electrical energy efficiency and achieved slightly higher values in the northern location than the southern due to the lower ambient temperature and lower PV cell operating temperature. However, during the summer months, the electrical exergy efficiency reached the same values in both locations.
Table 4 summarizes the annual energy and exergy production in Tampere and Strasbourg. The thermal energy production and solar gain in Strasbourg were 8.4% and 6.2%, respectively, higher than in Tampere. However, the thermal energy produced in the northern location was of “higher quality” because the thermal exergy production in Tampere was 72.9% higher than in Strasbourg.
Although the results showed that the electrical energy and exergy efficiencies were slightly higher in Tampere most of the year, the yearly produced electrical energy and exergy were 5.8% higher in Strasbourg than in Tampere due to the 6.2% higher solar irradiation to the collector area in Strasbourg.
The total annual energy production was 7.8% higher in Strasbourg than in Tampere. However, the results show that the total exergy production was only 1.27% higher in Strasbourg than in Tampere, although the solar exergy gain was 6% higher.

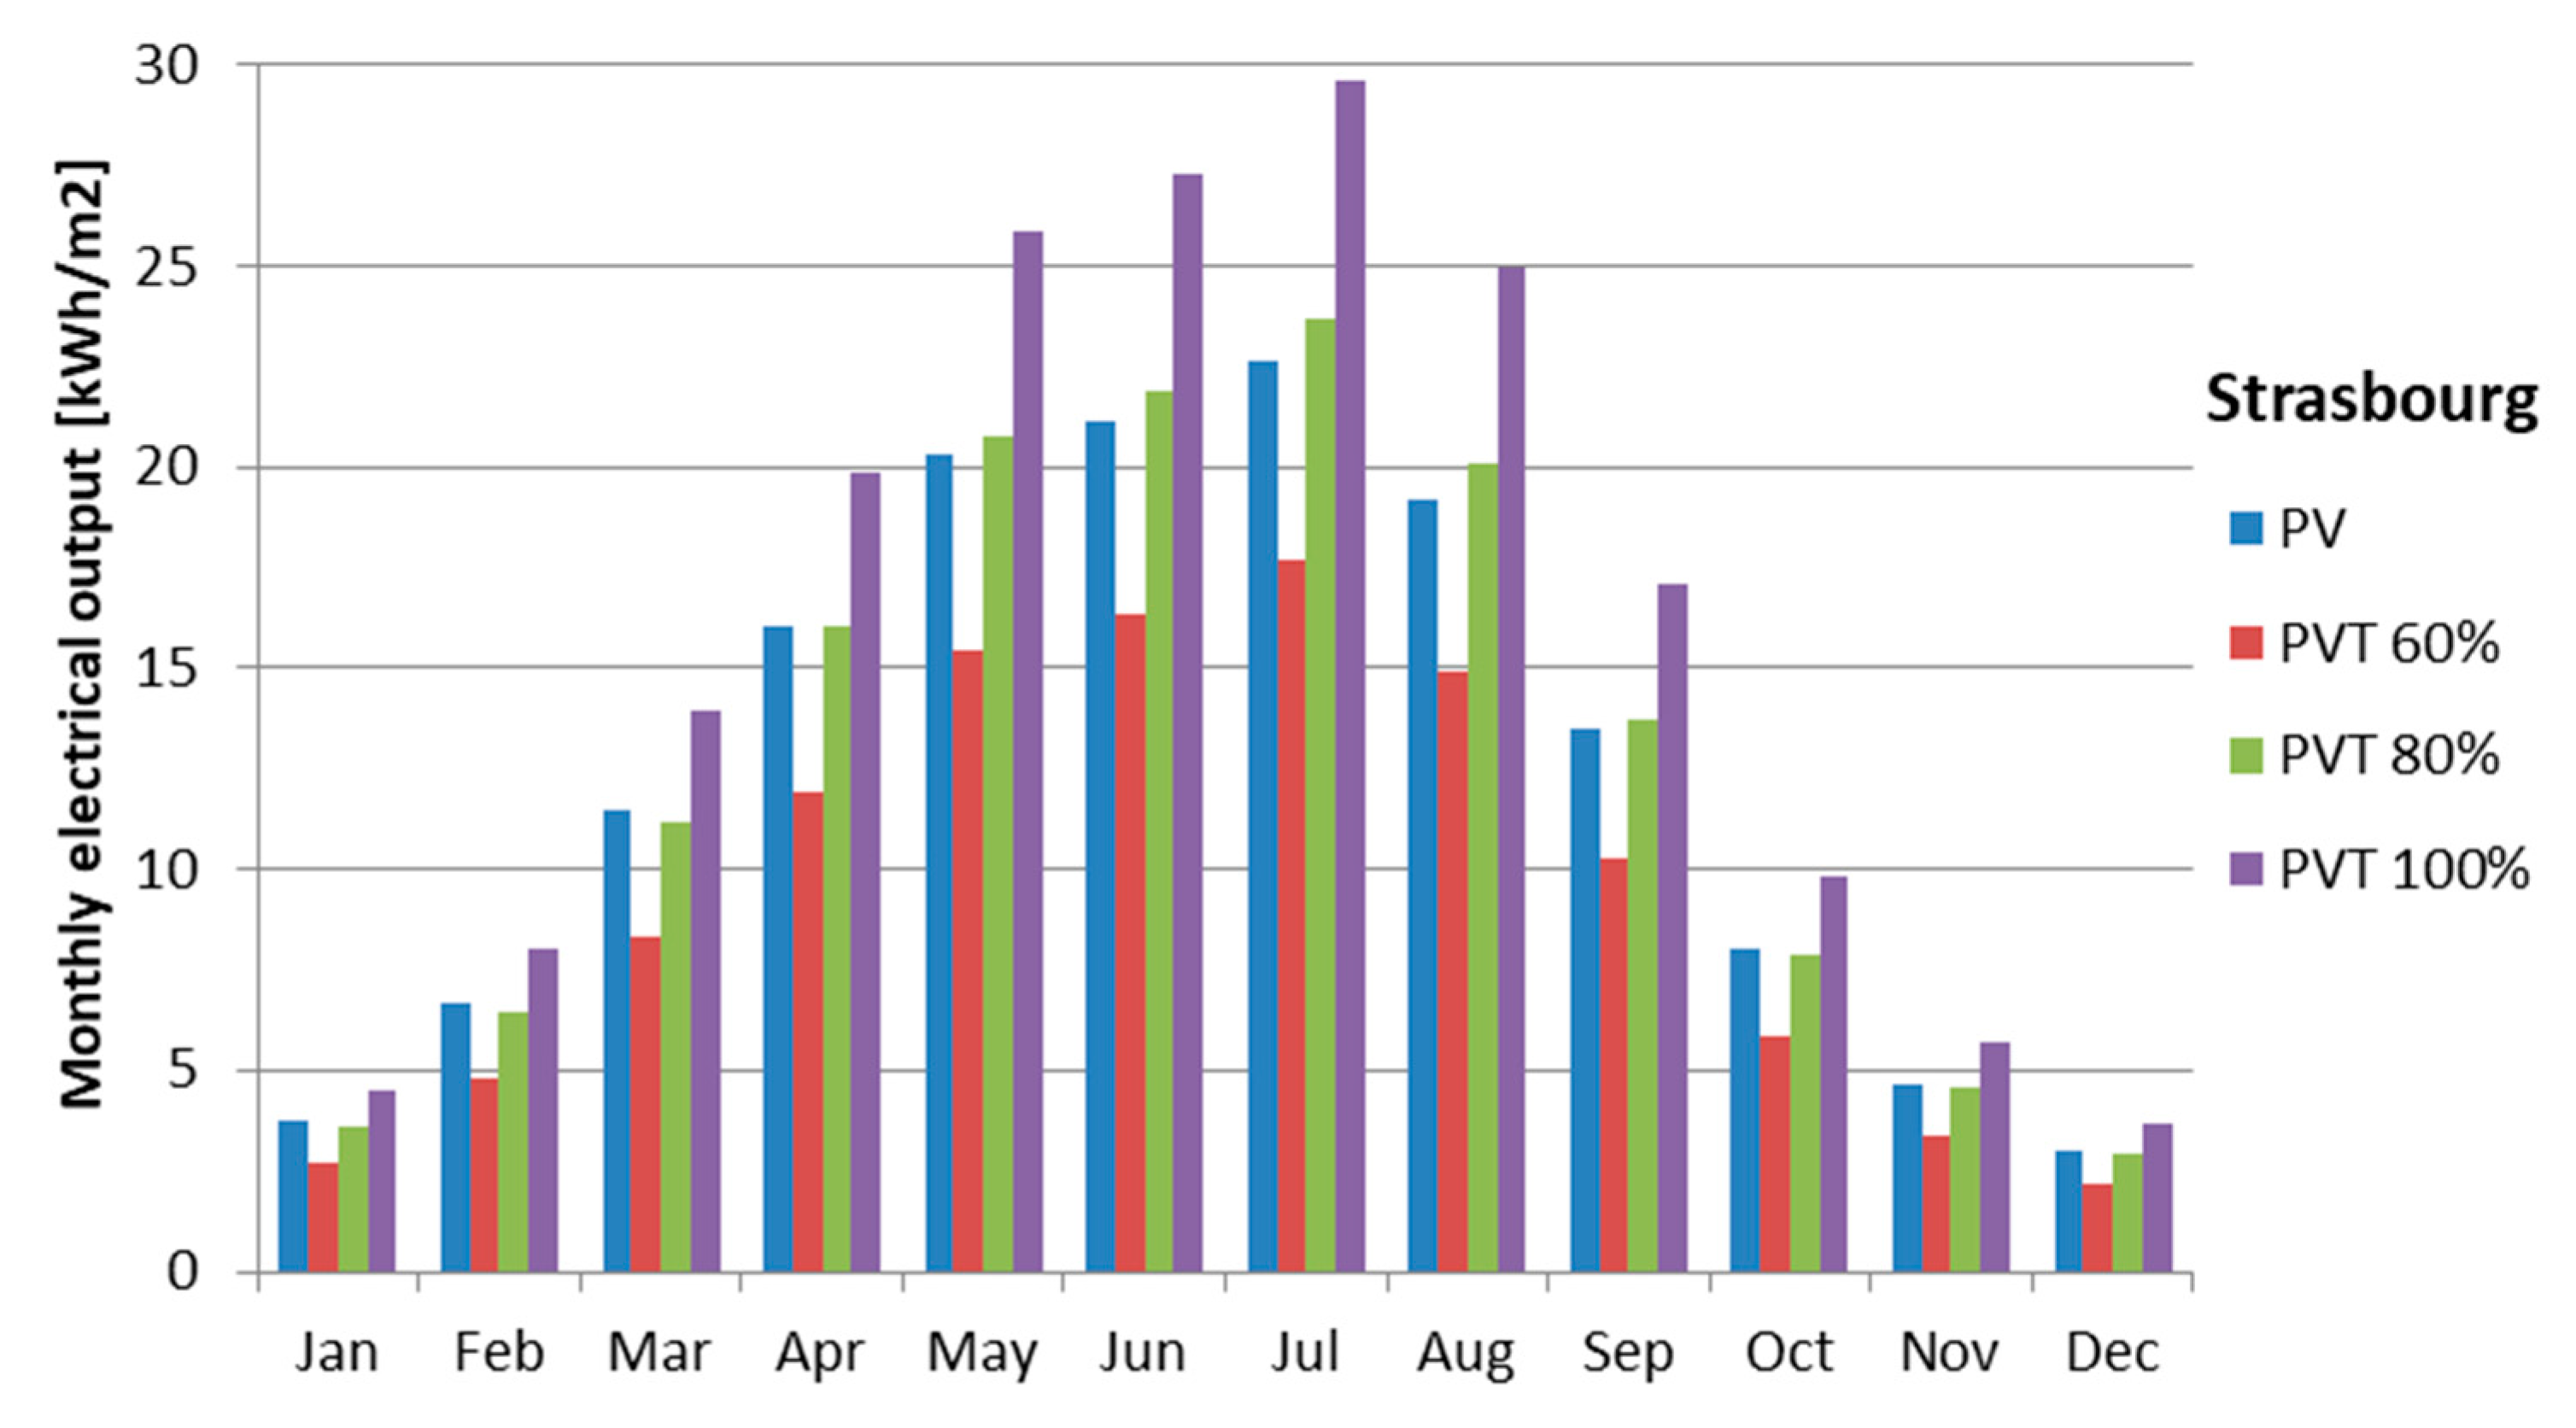
4.2. Comparison between PVT Collector and Photovoltaic (PV) Panel

A comparison between the PVT collector and PV panel was conducted using simulation models. The PV panel was simulated with the PV generator-block of the open-source CARNOT Toolbox [24]. The PV panel and PVT collector had the same area of 2 m2 and the same reference cell efficiency of 17.3%.
Implementing a water-based cooling system underneath the PV layer of the PVT collector reduces the PV cell operating temperature and enhances its efficiency. Figure 10 presents the PV cell operating temperatures and efficiencies during three selected summer days in Tampere and Strasbourg. The corresponding weather conditions are presented in Figure 2 in Section 2.
Over the summer days in Figure 10, the PV cell operating temperatures were significantly higher within the PV panel than in the PVT collector. In both locations, the maximum operating temperature of the PV was around 48 °C and of the PVT collector 30 °C. Due to the cooling effect of the water mass flow underneath the PV layer in the PVT collector, the maximum increase in the electrical efficiency was around 1.1 percentage point during the second summer day in Strasbourg.
Despite the same PVT collector and PV panel area, the electrical energy production of the PVT collector is influenced by the packing factor (rc) of the collector. However, this is not a case in the PV panels that are fully covered with the PV cells. Because of the packing factor, the better cell efficiency in the PVT collector does not always lead to higher electricity production compared to the PV panel.
The impact of the packing factor on the PV cell operating temperature and electrical energy production of the PVT collector was studied in comparison to the PV panel. Figure 11 presents the monthly maximum temperatures of the PV panel and PVT collector with the different packing factors of 0.6, 0.8 (base case) and 1 in Tampere and Strasbourg.
The results in Figure 11 indicate that the packing factor had only a slight influence on the PV cell operating temperature of the PVT collector. The PVT with the packing factor of 0.6 had 1% to 5% higher maximum operating temperatures over year than the fully packed collector. In both locations, the monthly maximum PV cell operating temperatures of the PV panel were significantly higher, from 11 to 27 °C, from April to September/October than in the PVT collector. The maximum operating temperature of the PV panel in both locations was around 60 °C and 35 °C for the PVT collector.
Figure 12 and Figure 13 present the monthly electrical output of the PV panel and the PVT collector with different packing factors in Tampere and Strasbourg, respectively.
A typical PVT collector has a packing factor of 0.8, and that is used as a base case in this study. With this typical design, the monthly electrical output of the PV and PVT were only slightly different in both locations. The PV panel had higher electrical output during winter and spring months from January to April and October to December because of the lower ambient temperatures. However, during the warmer months from May to September, the electrical output of the PVT was higher than PV due to higher ambient temperatures, solar radiation and the cooling effect of the PVT.
In Tampere, the maximum PVT electrical output was 34 kWh/m2 in May and in Strasbourg 29.5 kWh/m2 in July. The annual electrical output of the PV panel and base case PVT collector was 142.7 kWh/m2 and 144.4 kWh/m2, respectively, in Tampere. This result indicates that although the packing factor of the PVT was 80%, 1.2% higher electrical output was reached because of the cooling effect underneath the PV cells. In Strasbourg, the annual electrical output of the base case PVT collector was 1.5% higher than from the PV panel resulting in 152.8 kWh/m2 and 150.5 kWh/m2 electrical energy yield, respectively. In Strasbourg, the annual electrical output of the fully packed PVT collector was 190.2 kWh/m2, which is 26.4% more electrical output than from the PV panel. In Tampere, the fully packed PVT produced annually 180.1 kWh/m2, which is 26.2% more electrical output than from the PV panel.

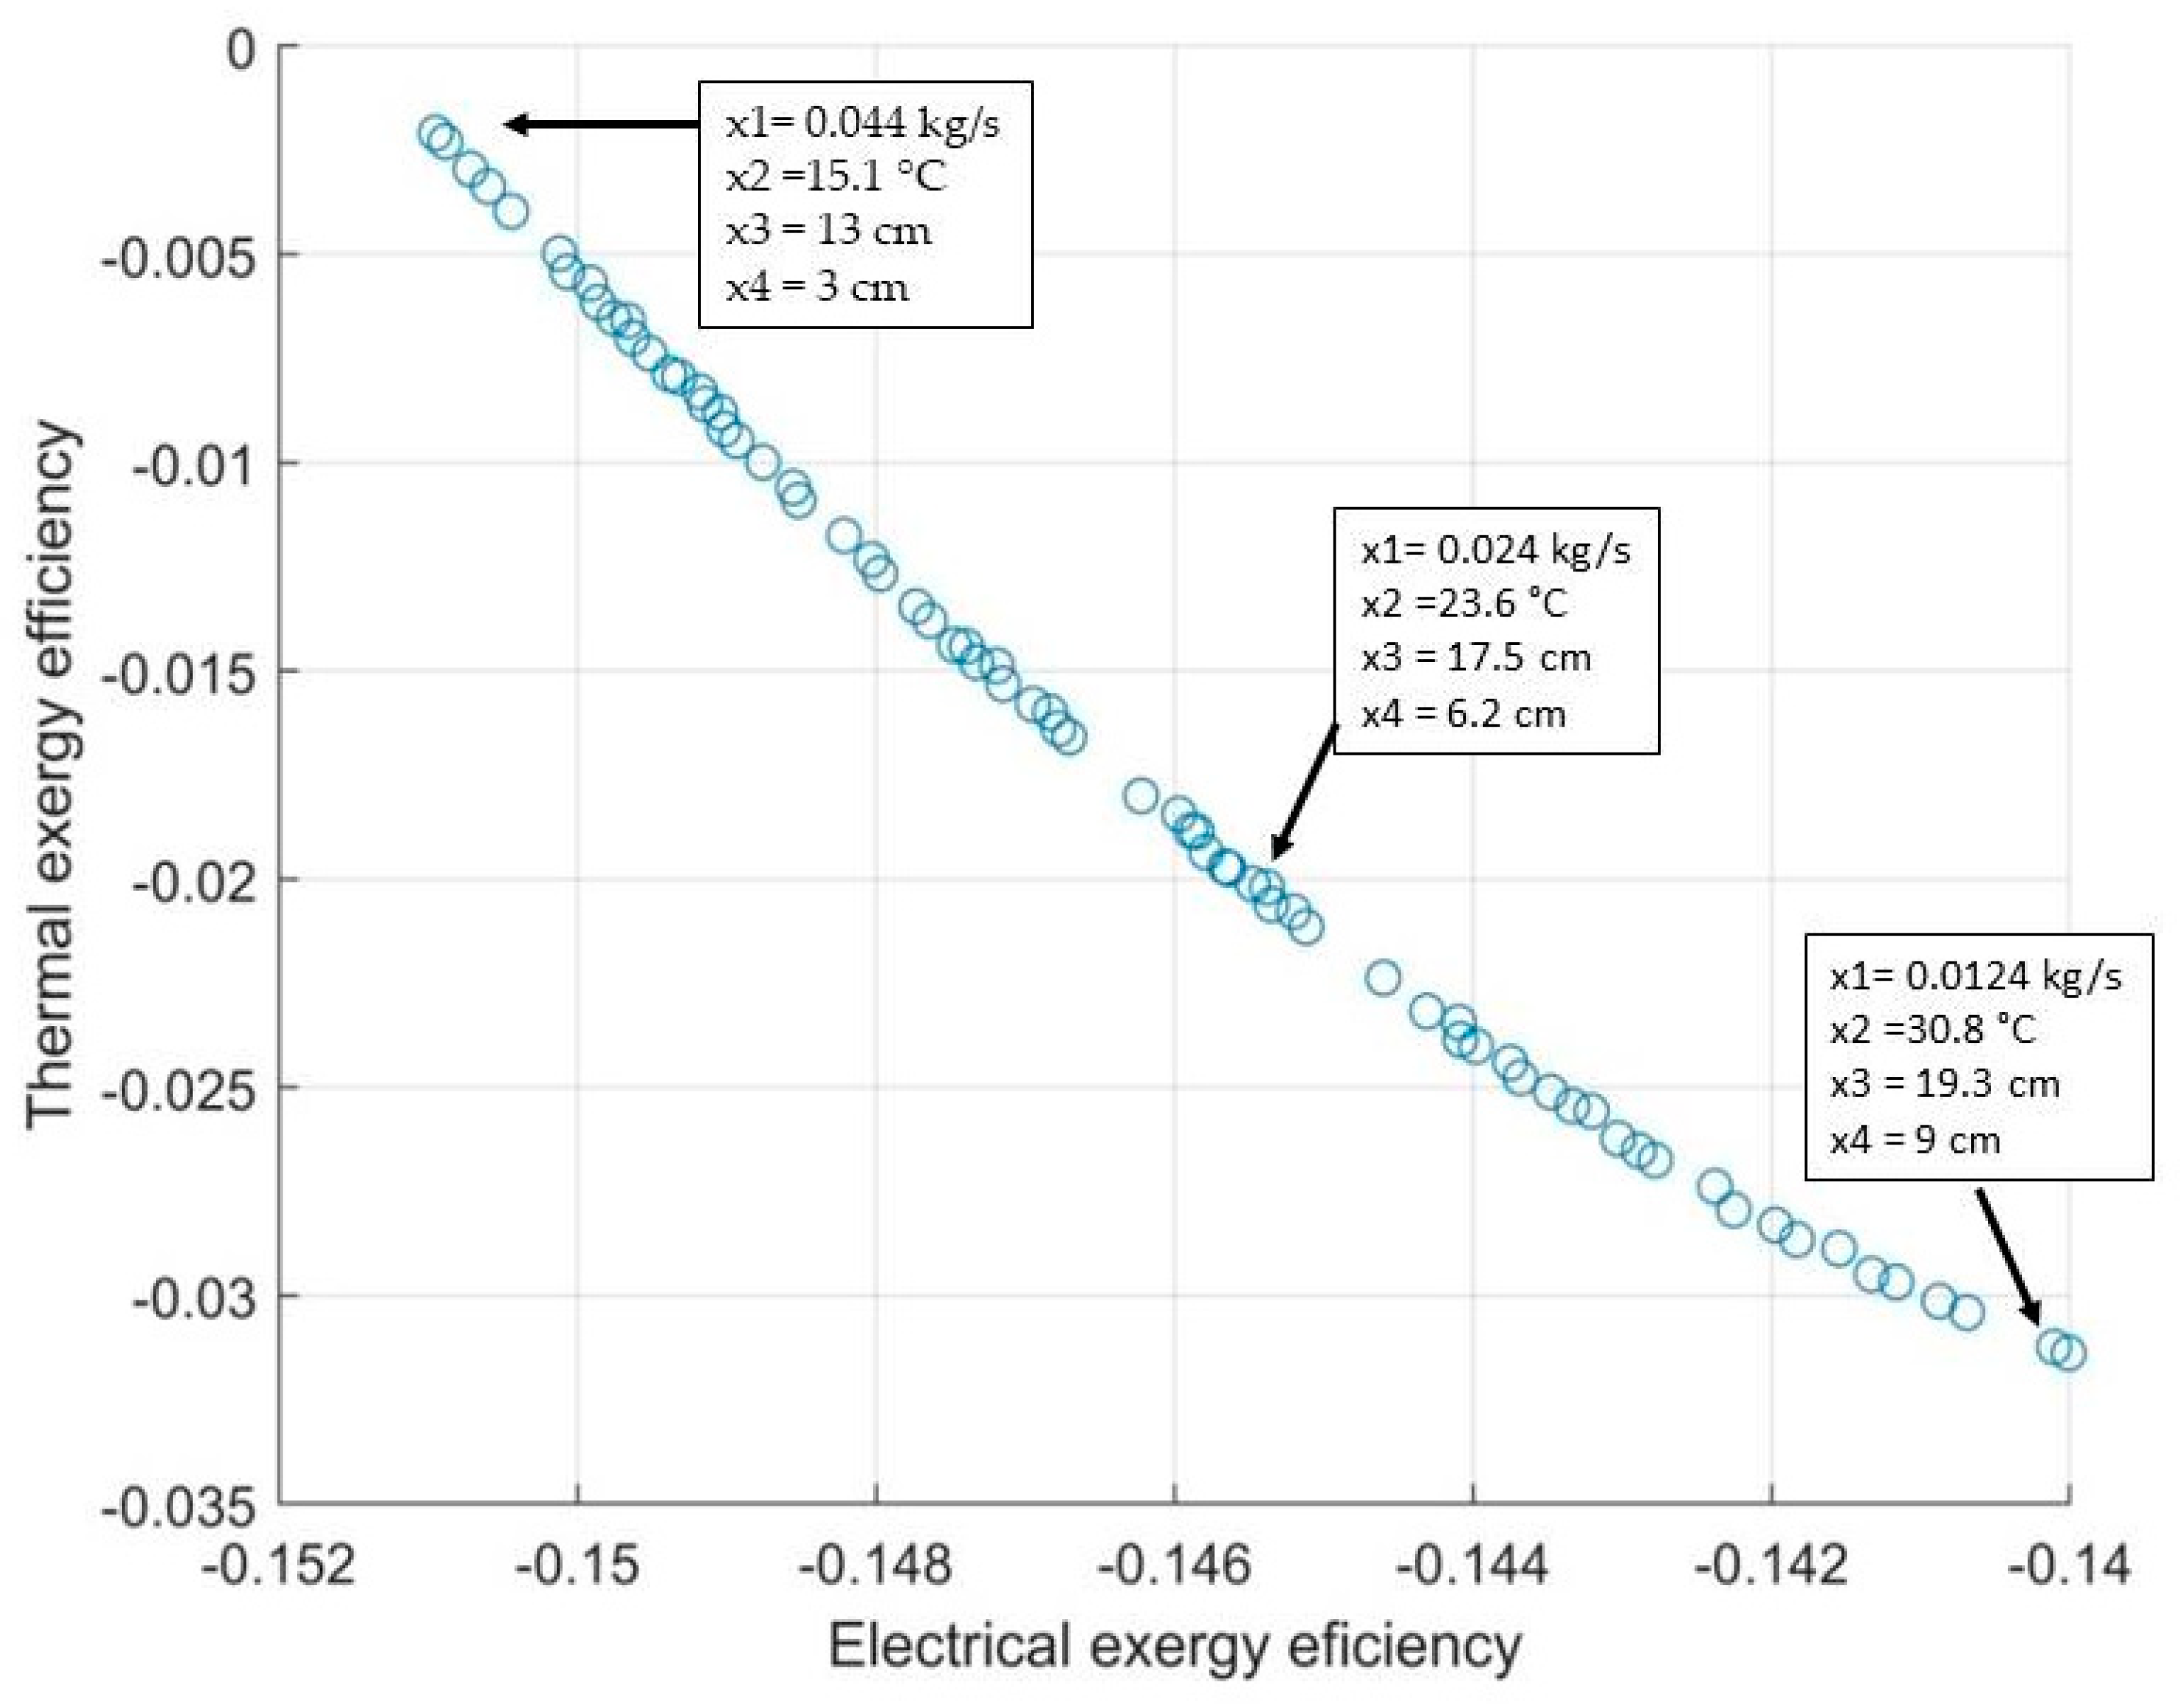
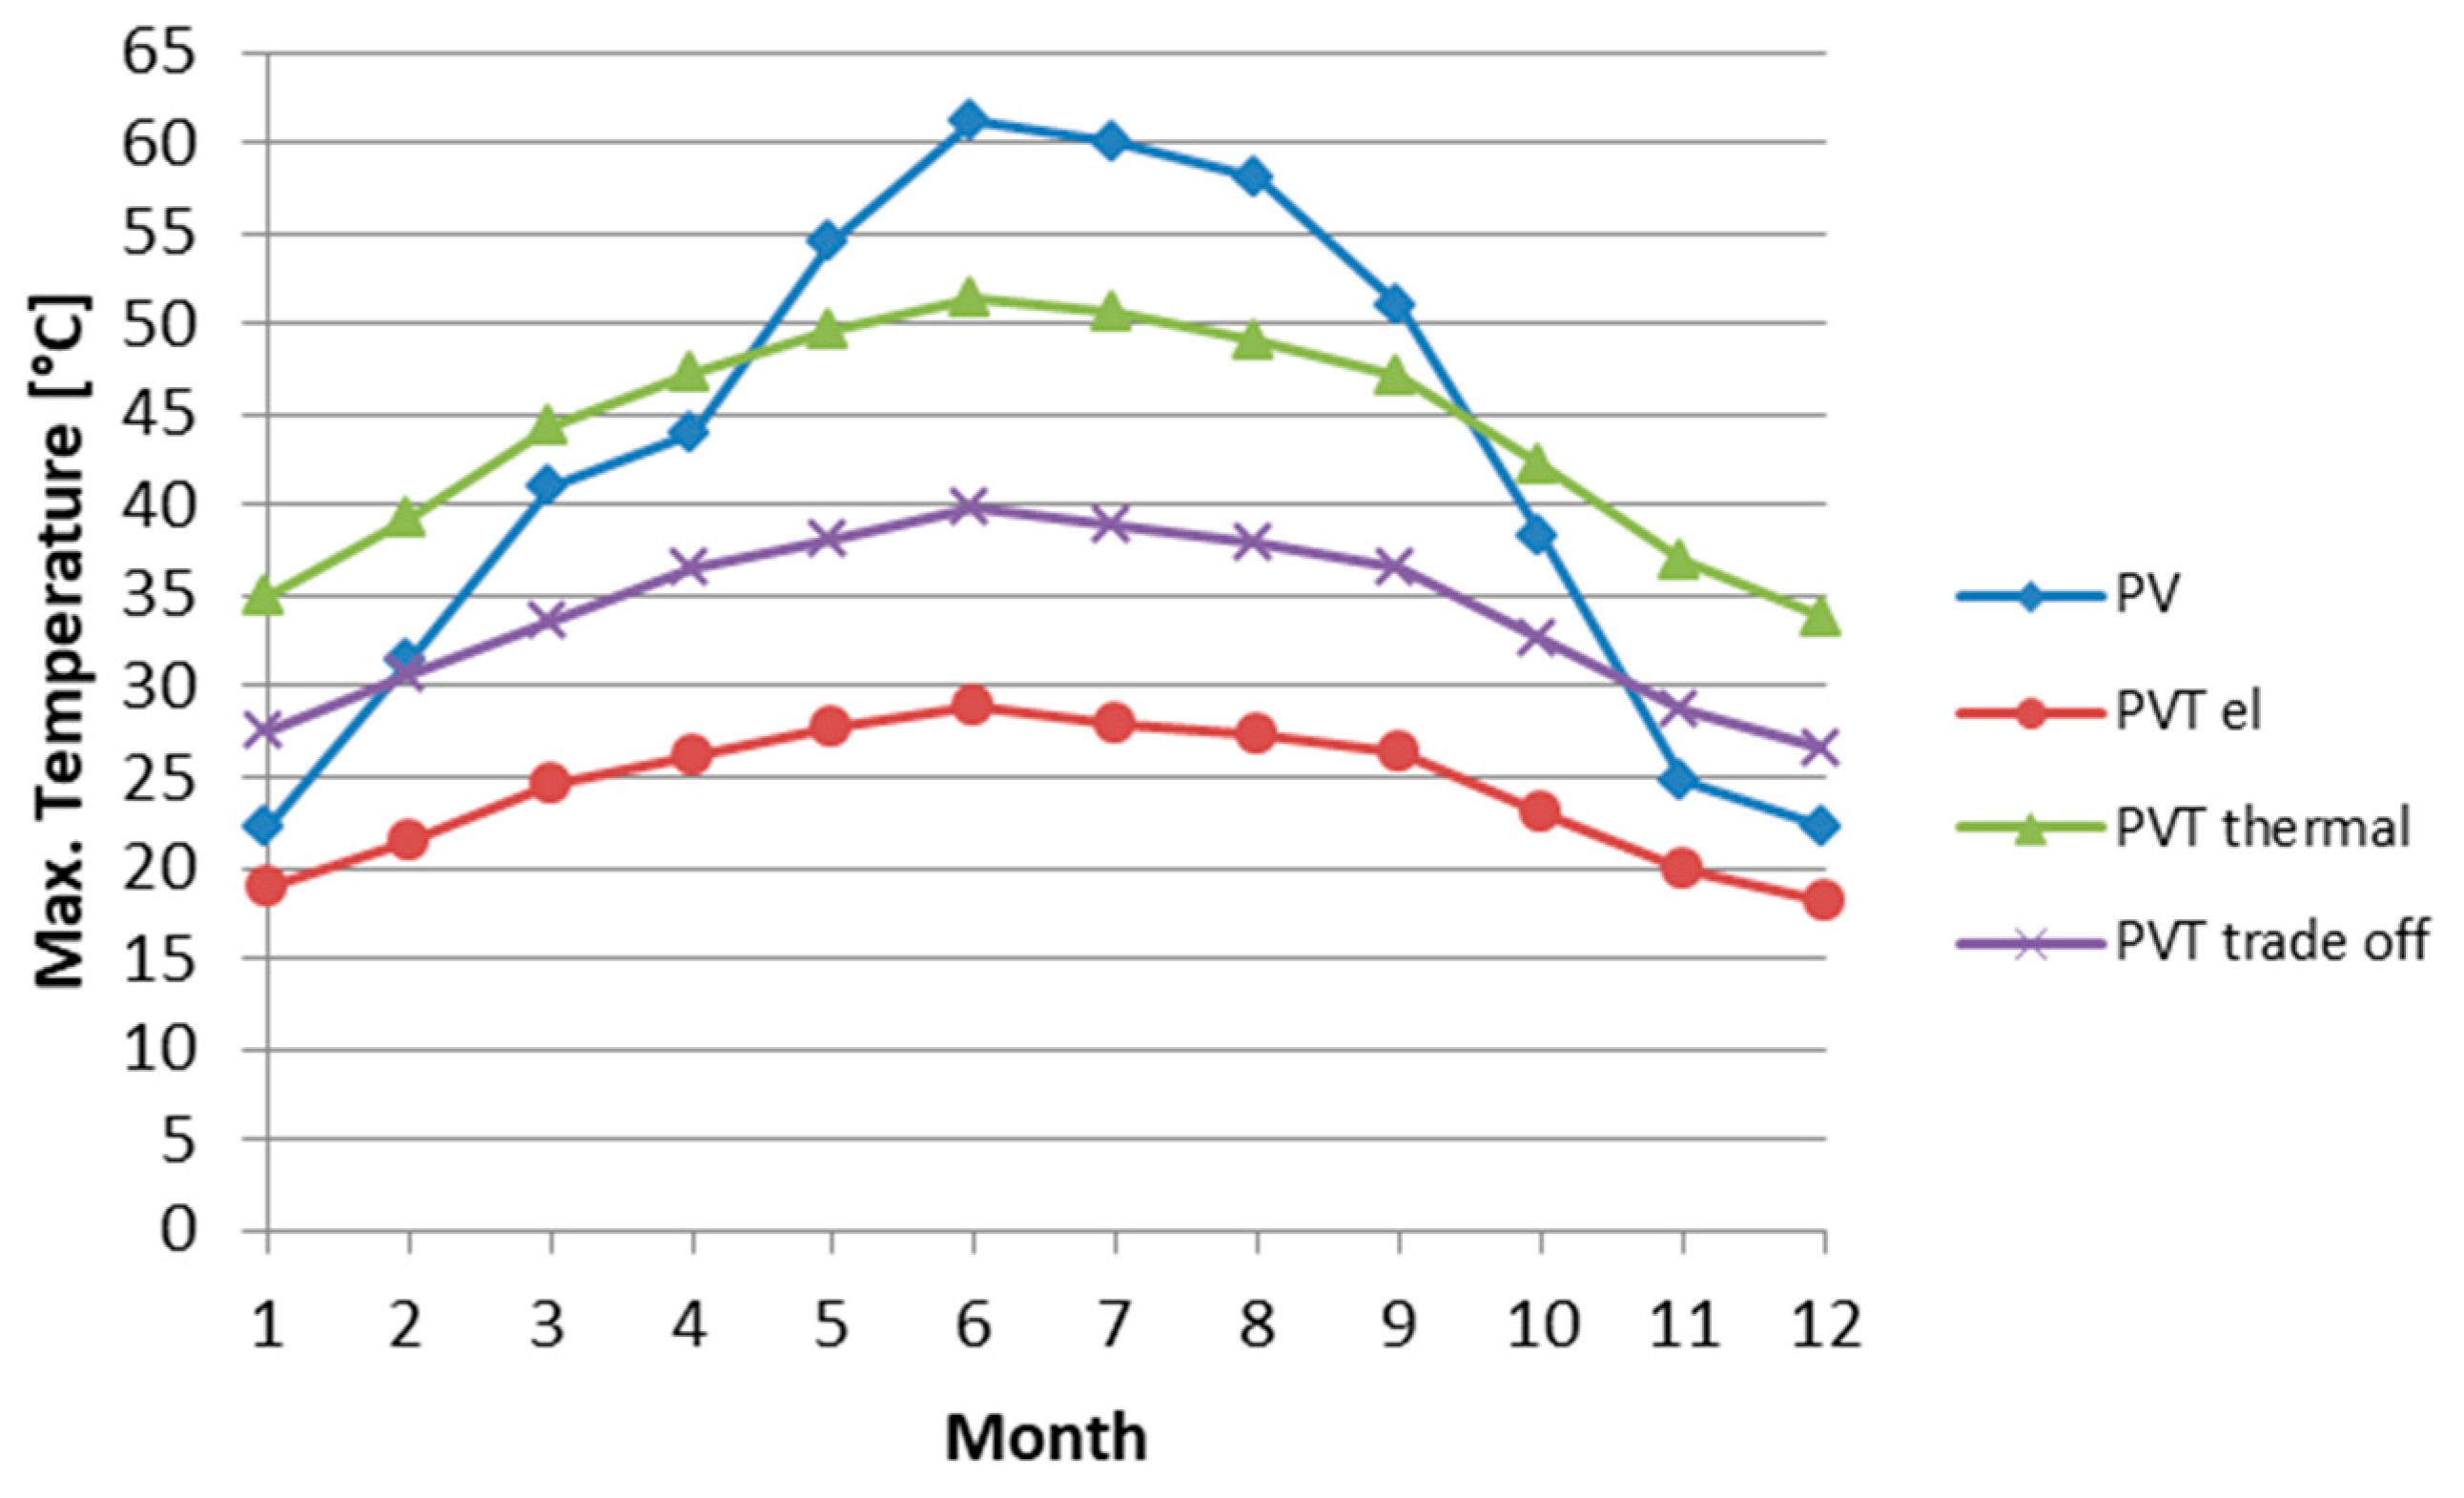
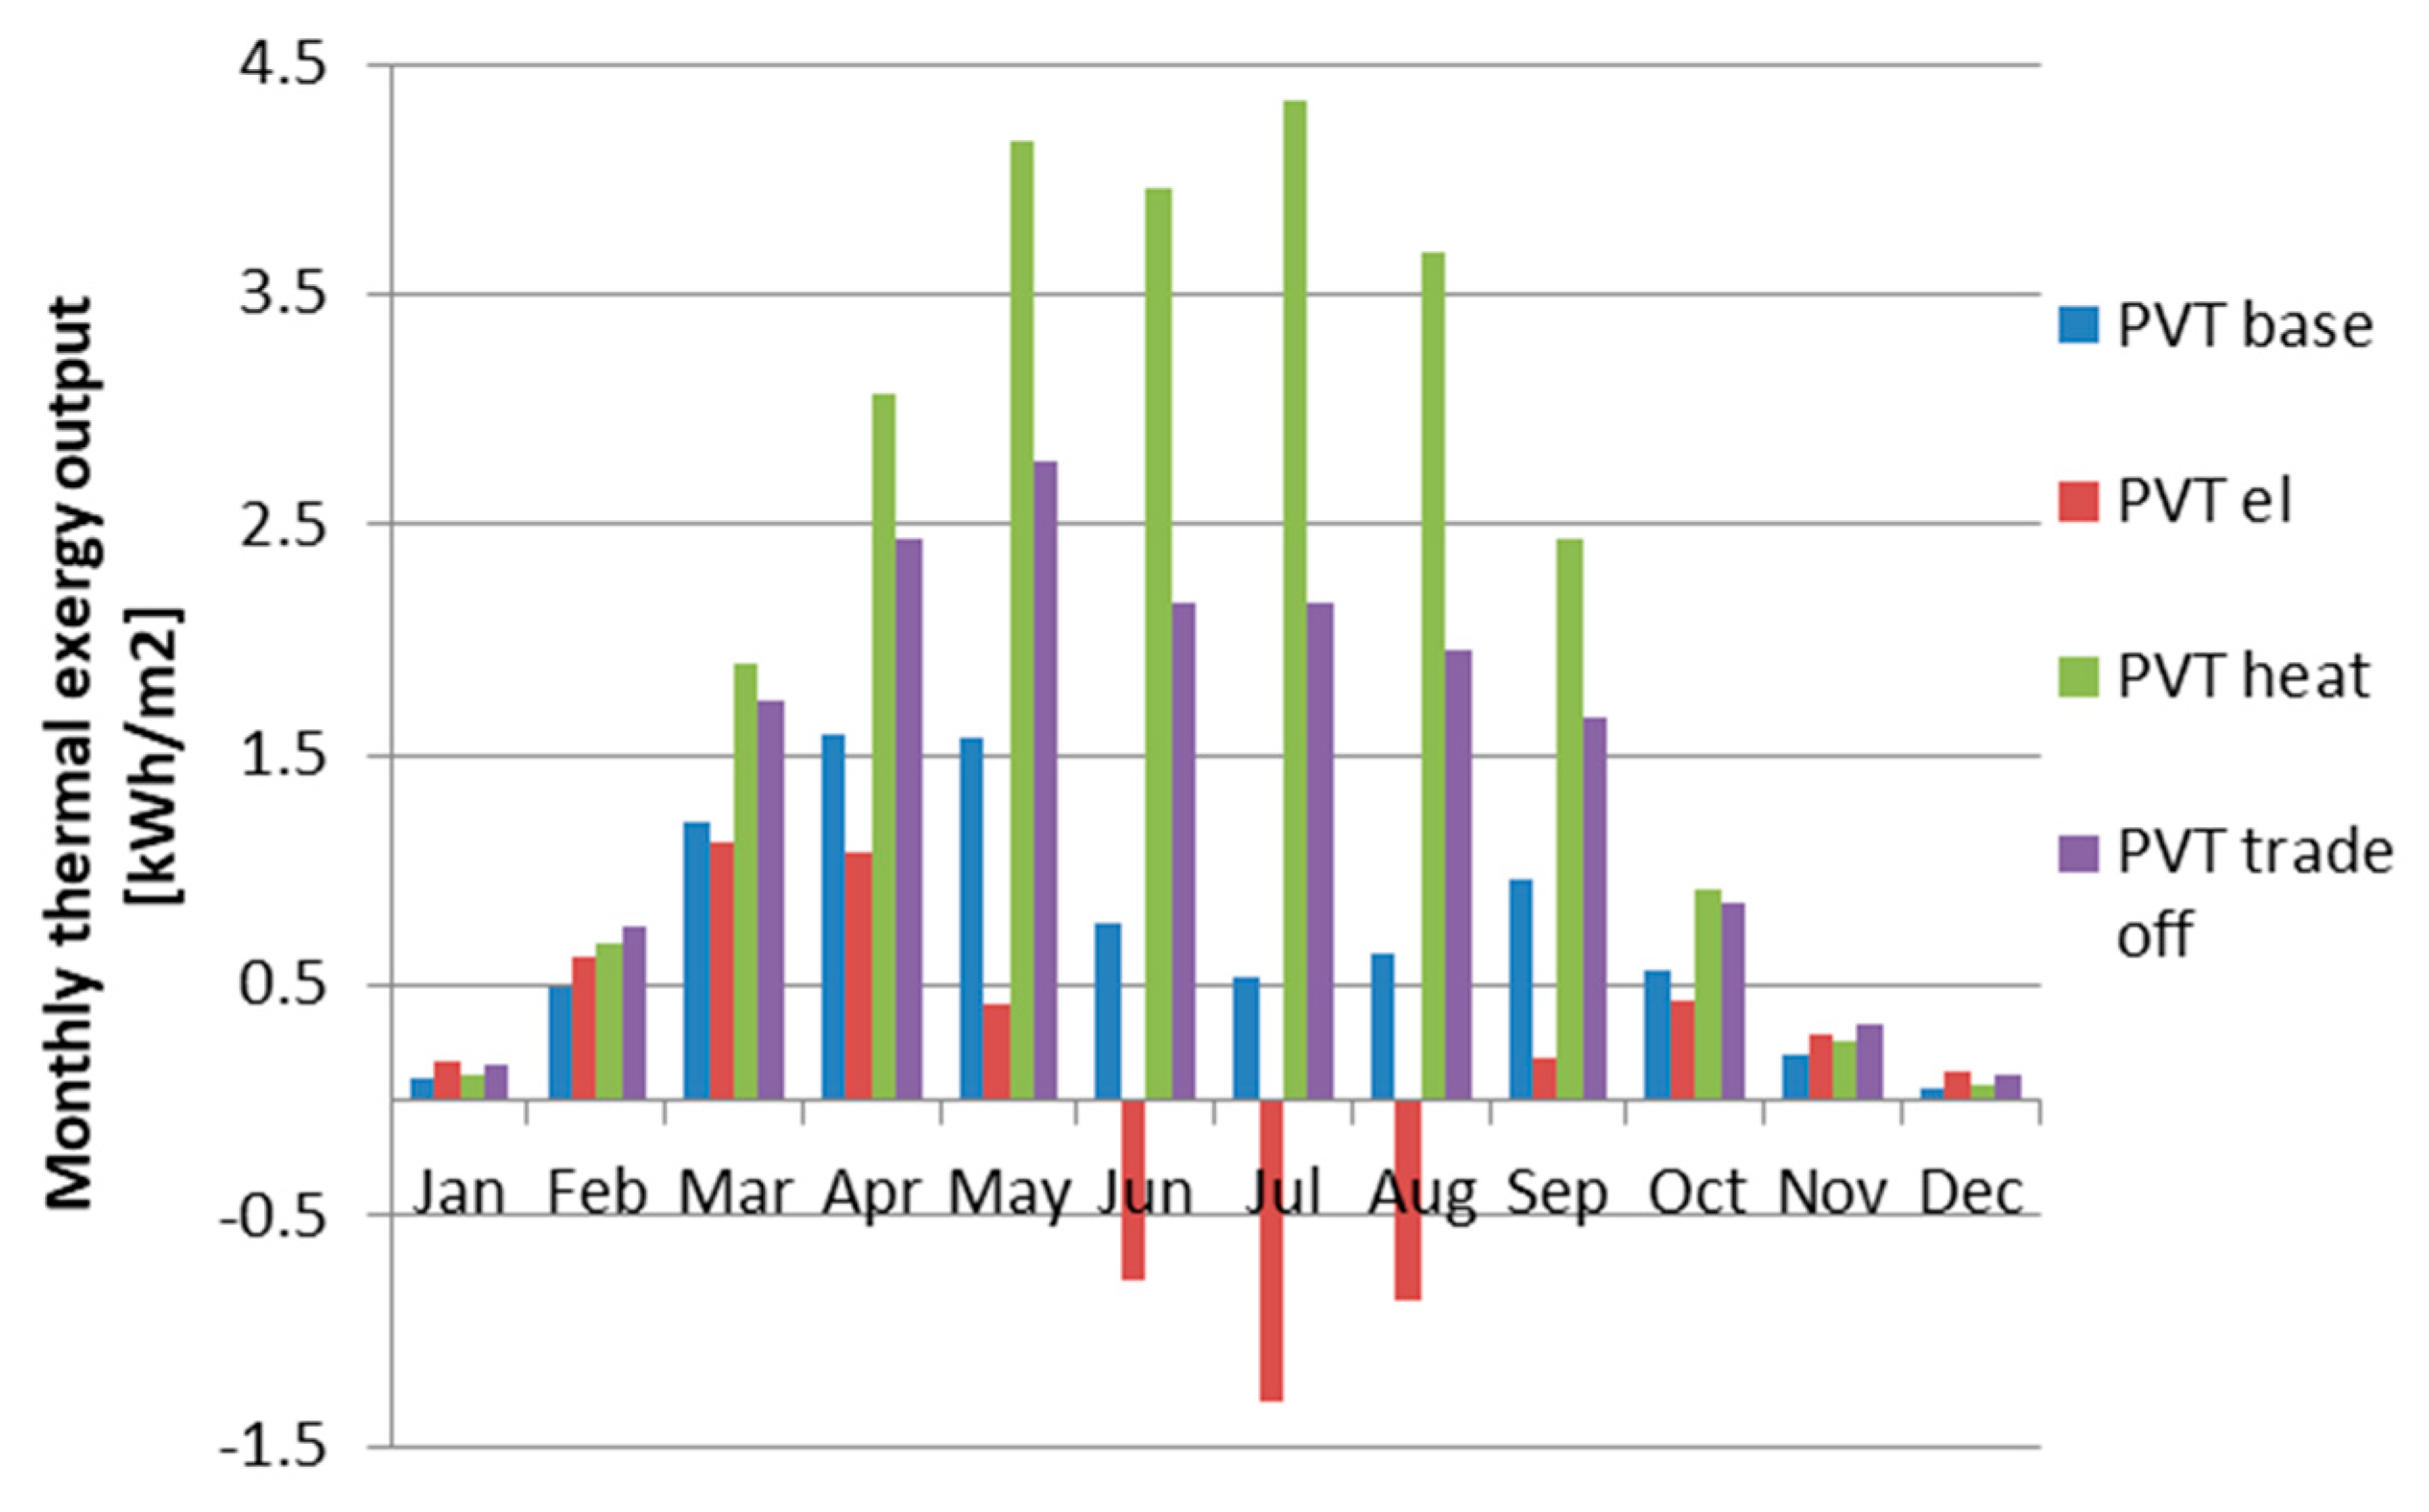
4.3. Multi-Objective Optimization

The simulation-based multi-objective optimization process was conducted. The main objective was to find different optimal design solutions for the PVT collector depending on its operational purpose, which can be defined by the user. Additionally, the objective was to study the impact of the decision variables, such as water mass flow rate and inlet temperature, on the comparison between the PV panel and PVT collector electrical output and PV cell operating temperature.
First, the selected decision variables were varied and the initial population and score matrixes for the genetic algorithm were generated by the simulation model. These matrices were given for the gamultiobj-function, which started the iterative process by evaluating the fitness function with the simulation model and making selection, crossover and mutation of the population. Based on this process, a new population or generation was created. The new generations were created as long as a stopping criterion was met. The criterion was the number of generations. The multi-objective optimization process is described in Figure 14.
The optimization was conducted with steady-state weather conditions that were defined to be the following: solar irradiation of 500 W/m2, ambient temperature of 16 °C and wind speed of 2 m/s. These conditions present average weather conditions in Tampere and Strasbourg during the best PVT operation months. The selected decision variables of the optimization are discussed in Section 4. The other parameters are presented in Section 2. The relation of the variables to the electrical and thermal exergy efficiencies are shown in Figure 15.
Figure 15 presents the sensitivity of the decision variables to the electrical and thermal exergy efficiencies. The main findings of the sensitivity analysis are following. Increasing the mass flow rate of the coolant fluid increases the electrical exergy efficiency due to increasing cooling effect. First, the electrical exergy efficiency increases strongly. On the other hand, if the coolant mass flow is increased too much, the thermal efficiency is decreased. Increasing the inlet temperature of the coolant fluid increases the thermal exergy efficiency at a certain point. However, the electrical efficiency suffers when increasing the inlet temperature due to the higher operating temperature. The insulation and air gap thickness have a strong influence on the thermal exergy efficiency until 10 cm.
Figure 15 shows that all decisions variables can reach an optimal value at certain point but they are also depending on each other. Conducting a multi-objective optimization takes into account the relation between these variables and the optimal solution may be different than when investigating a single variable.
After studying the sensitivity of the selected decision variables, the thermal and electrical exergy efficiencies were selected to be objective functions and the optimization problem was solved using the gamultiobj function of Matlab Global Optimization Toolbox. The function is based on NSGA-II algorithm. In this study, the set of the optimal solutions called Pareto front is obtained with the generation number of 160 and the population size of 192.
Figure 16 shows the obtained Pareto front of the solutions derived with the defined weather conditions. The decision variables are also shown for three selected solution points. The values of the variables showed the same behavior as in Figure 15a–d. From the Pareto front three solution levels were derived depending on the priority of the PVT operation:
  • Electric-driven: the priority is to maximize electricity production within the Pareto optimal;
  • Thermal exergy-driven: the priority is to maximize thermal exergy production within the Pareto optimal;
  • Trade-off solution: the priority is to produce optimally electricity and thermal exergy within the Pareto optimal front.
Based on the Pareto front in Figure 16, the electric-driven solution was characterized by the high mass flow rate of 158.4 kg/h, thinner air gap thickness of 13 cm, low inlet temperature of 15.1 °C and insulation thickness of 3 cm. The thermal exergy-driven solution was characterized by the low mass flow rate of 44.6 kg/h, high inlet temperature of 30.8 °C, thick air gap thickness of 19.3 cm and thicker insulation thickness of 9 cm. The trade-off solution was similarly characterized than thermal exergy solution, but the mass flow rate was higher, resulting as 86.4 kg/h, and lower inlet temperature of 23 °C was allowed.
To see how the decision variables, such as mass flow and inlet temperature, influence the comparison between PVT collector and PV panel, three different optimal PVT designs, shown in Figure 16, were simulated under the climate conditions of Strasbourg. The results were compared with the PV panel performance. Figure 17 shows the monthly maximum PV cell operating temperatures in the PVT collectors and the PV panel.
Figure 17 shows that the lowest maximum PV cell temperatures were reached if the electric- driven design was selected. The maximum temperature was only 29 °C during the summer period. At the same time, the PV panel reached its maximum temperature of 61.2 °C. The lowest maximum PV cell temperatures were reached due to the high mass flow of 158.4 kg/h and low inlet temperature of 15.1 °C. On the other hand, if the mass flow was decreased, and the inlet temperature increased to maximize thermal exergy production, the significantly higher PV cell operating temperatures with a maximum of 51 °C resulted. That is shown in Figure 17 with the thermal exergy-driven PVT design. However, the maximum cell temperatures were still around 10 °C lower during the summer period than in the PV panel. During the beginning and end of the year, the PV cell operating temperatures were higher in the PVT than in PV because of the heat production in the lower ambient temperature.
Figure 18 shows how different decision variables influence the electricity production of the PVT collector compared to the PV panel.
The results show that the high mass flow rate and low inlet temperature resulted in the higher electrical output during the warmest months from April to September compared to the PV panel electrical output. The annual electricity production of the PV panel was 150.5 kWh/m2, and the electric-driven PVT design produced 155.1 kWh/m2, which is 3% more, although the packing factor was 0.8. The annual electrical output of the trade-off design was 149.1 kWh/m2, which is only 1% less than from the PV panel.
If the mass flow was reduced and the inlet temperature increased significantly, the electrical output was lower than in the PV panel during each month. The annual production was 144.2 kWh/m2, which is 4.2% less than from the PV panel. However, the production was not significantly lower than from the PV output if taking into account the beneficial thermal output of the PVT collector as well. Based on the simulation results in Section 4.2, it could be assumed that the fully packed thermal exergy-driven PVT design could produce higher electrical output than the PV panel.
Figure 19 presents the produced thermal exergy of the base case PVT and three optimal PVT designs of the Pareto front.
Produced thermal exergy indicates the quality of the produced thermal energy and its ability to do mechanical work at the reference ambient temperature. Figure 19 shows that the produced thermal exergy was even negative in the case of the electric-driven PVT design in which the mass flow rate was high, inlet temperature low and the insulation thinner. This means that the thermal energy was produced really close to or even below the reference ambient temperature and that leads to poor quality of the produced thermal energy.
As a conclusion, the optimization results indicated that maximizing the thermal exergy efficiency of the PVT collector results in the high inlet temperature, low mass flow rate and thicker insulation. These variables resulted in increasing PV cell operating temperatures that were, however, still lower than in the PV panel during the warmest months. The electricity yield was 4.2% lower, but as a fully packed PVT collector, the electrical output would be higher than from the PV panel. For a PVT building application, these results show that optimizing the high-quality energy output of the PVT collector allows the higher inlet temperature and low mass flow rate from heat storage and still the electrical output is competitive compared to the PV panel.

5. Conclusions

The objective and novelty of this study were to conduct energy and exergy analysis of the PVT performance under two different European climate conditions in Tampere, Finland and Strasbourg, France. The dynamic model of the water-cooled PVT collector was implemented in Matlab/Simulink to assess the collector performance under varying weather conditions. Additionally, the objective was to conduct a numerical comparison between the PVT collector and PV panel in terms of the PV cell operating temperature, efficiency and electrical output. In the first comparison, the packing factor of the PVT collector was varying, and its influence on the operating temperature and electrical output was investigated.
The main findings of the energy and exergy analyses were:
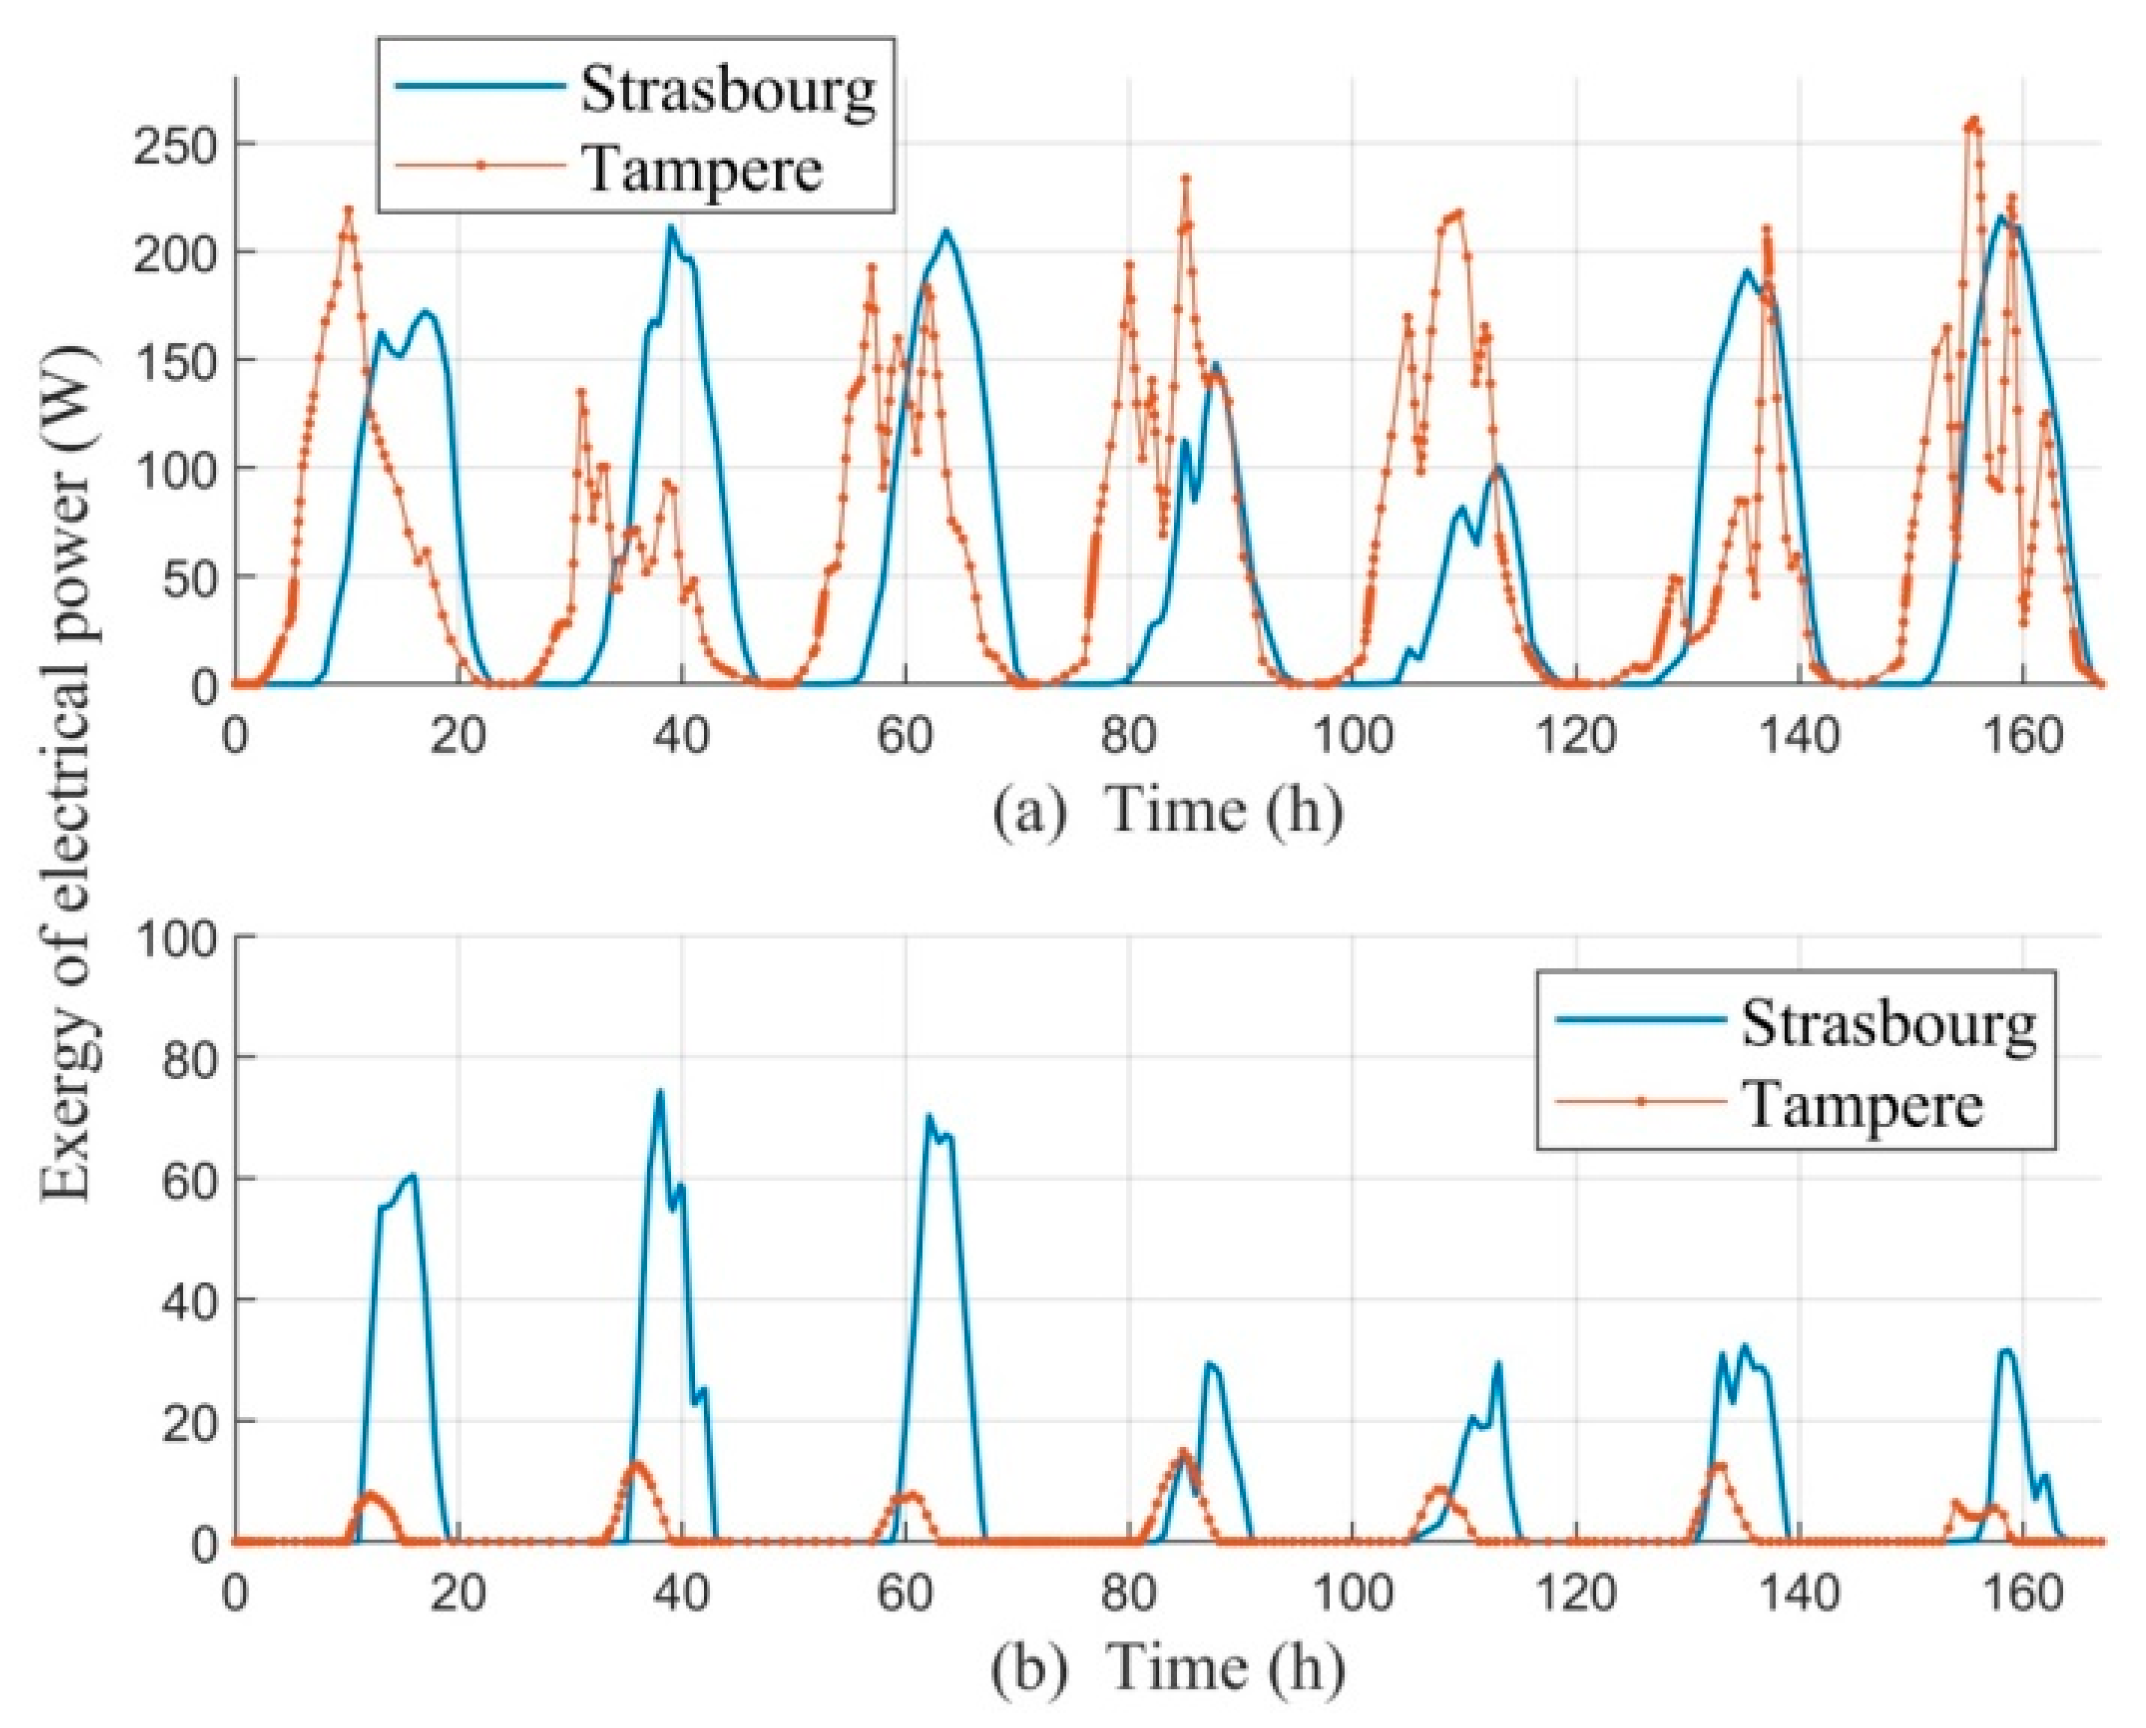
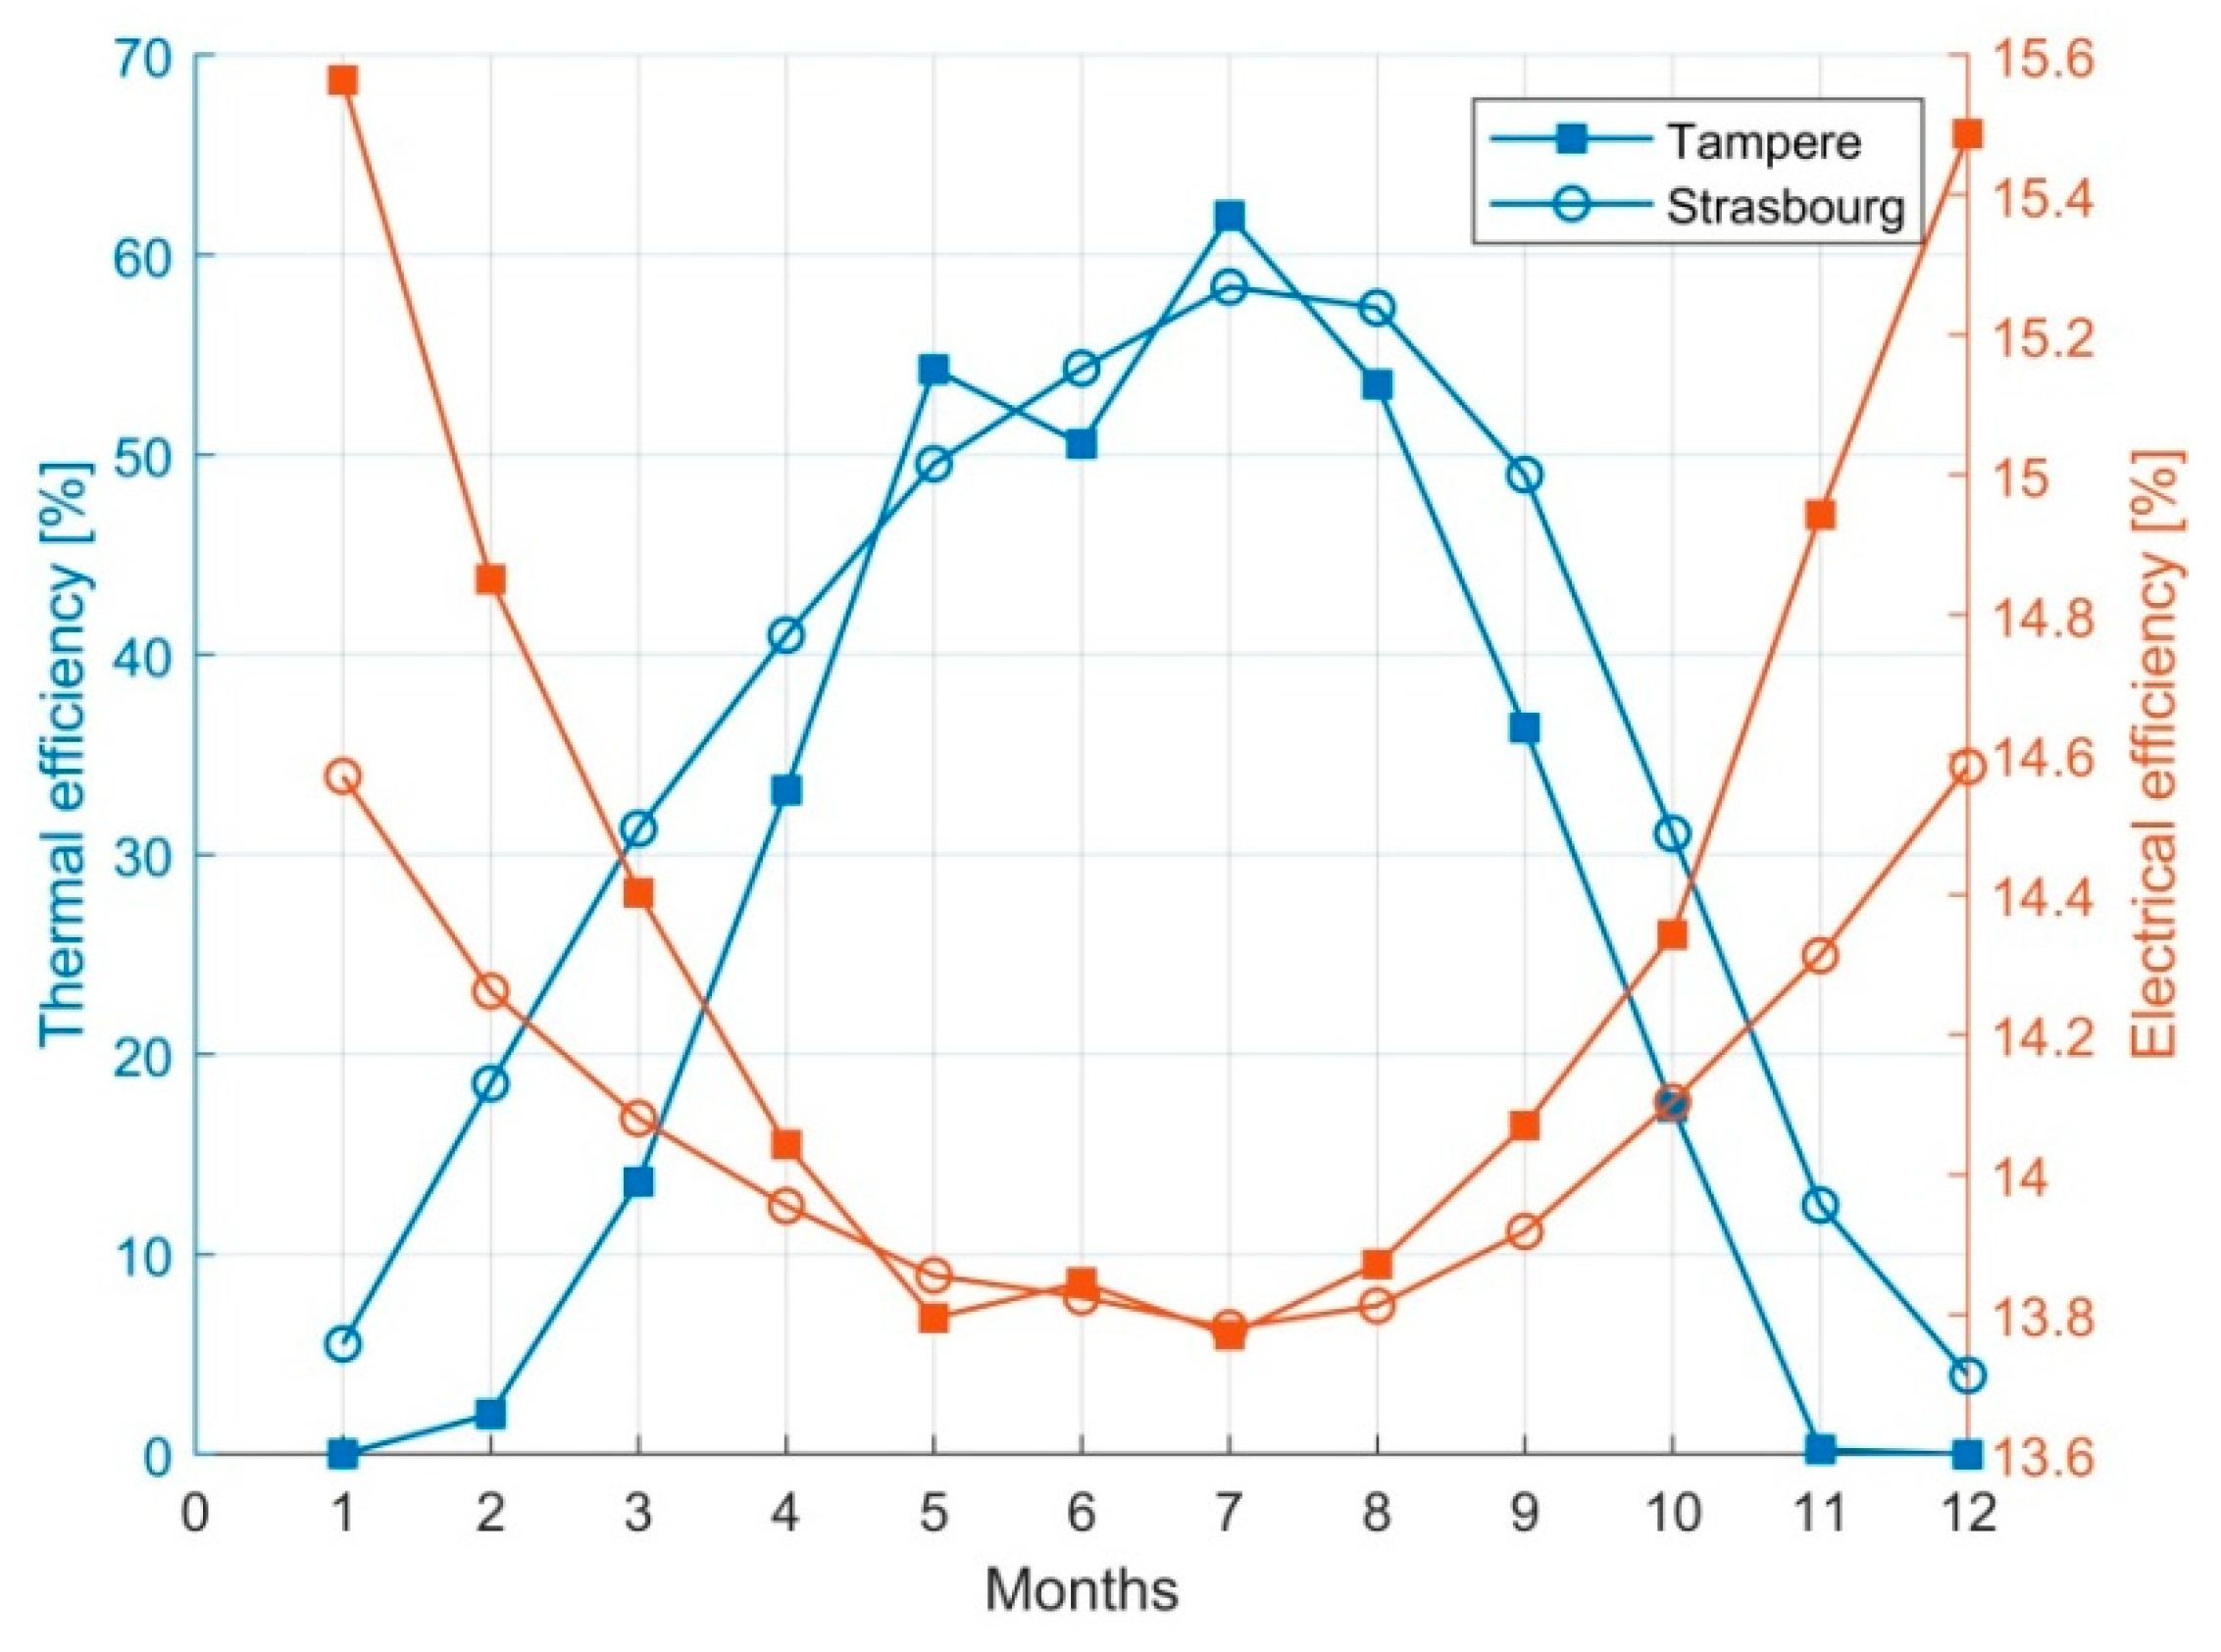
  • Despite the northern location of Tampere, the similar electric power generation conditions were reached during the summer period than in Strasbourg.
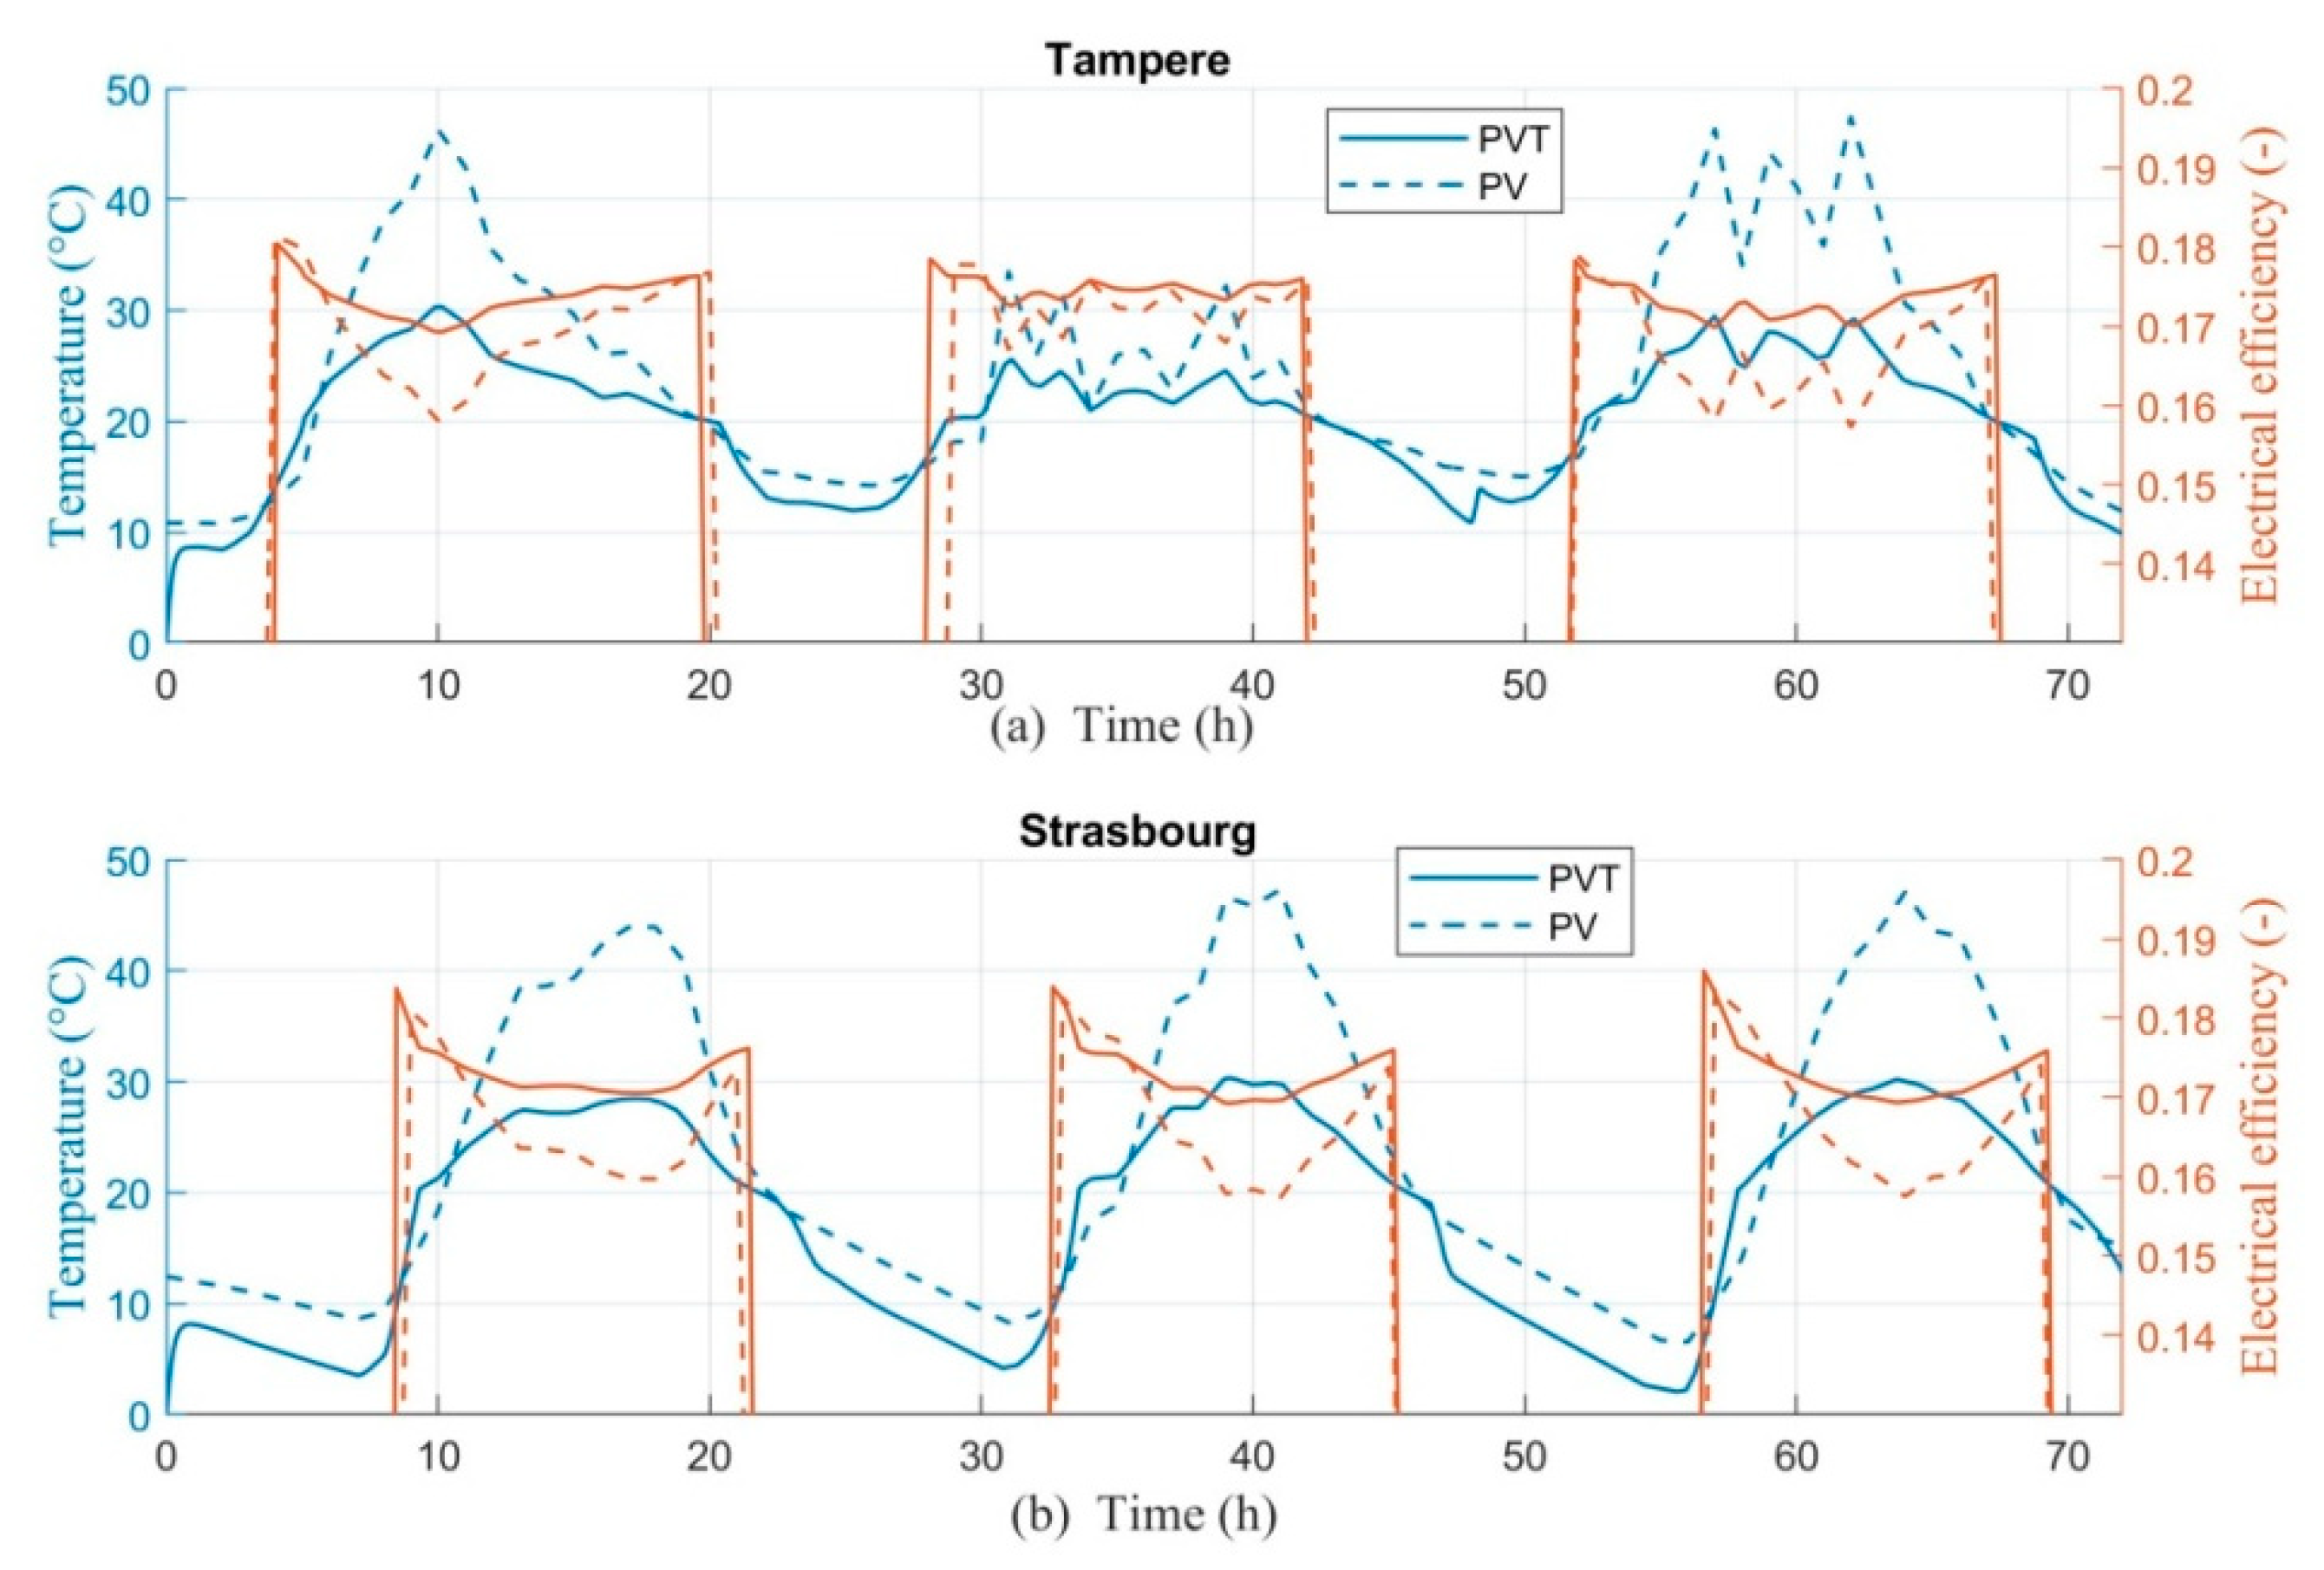
  • The monthly electrical efficiency reached 0.4–6.8% higher values in the northern location due to the cooler ambient conditions and lower PV cell operating temperature. However, during the summer months, the electrical efficiency was 13.8% in both locations.
  • The annual thermal and electrical energy production and solar gain were 8.4%, 5.8% and 6.2%, respectively, higher in Strasbourg than Tampere. The total annual energy production was 7.7% higher in Strasbourg.
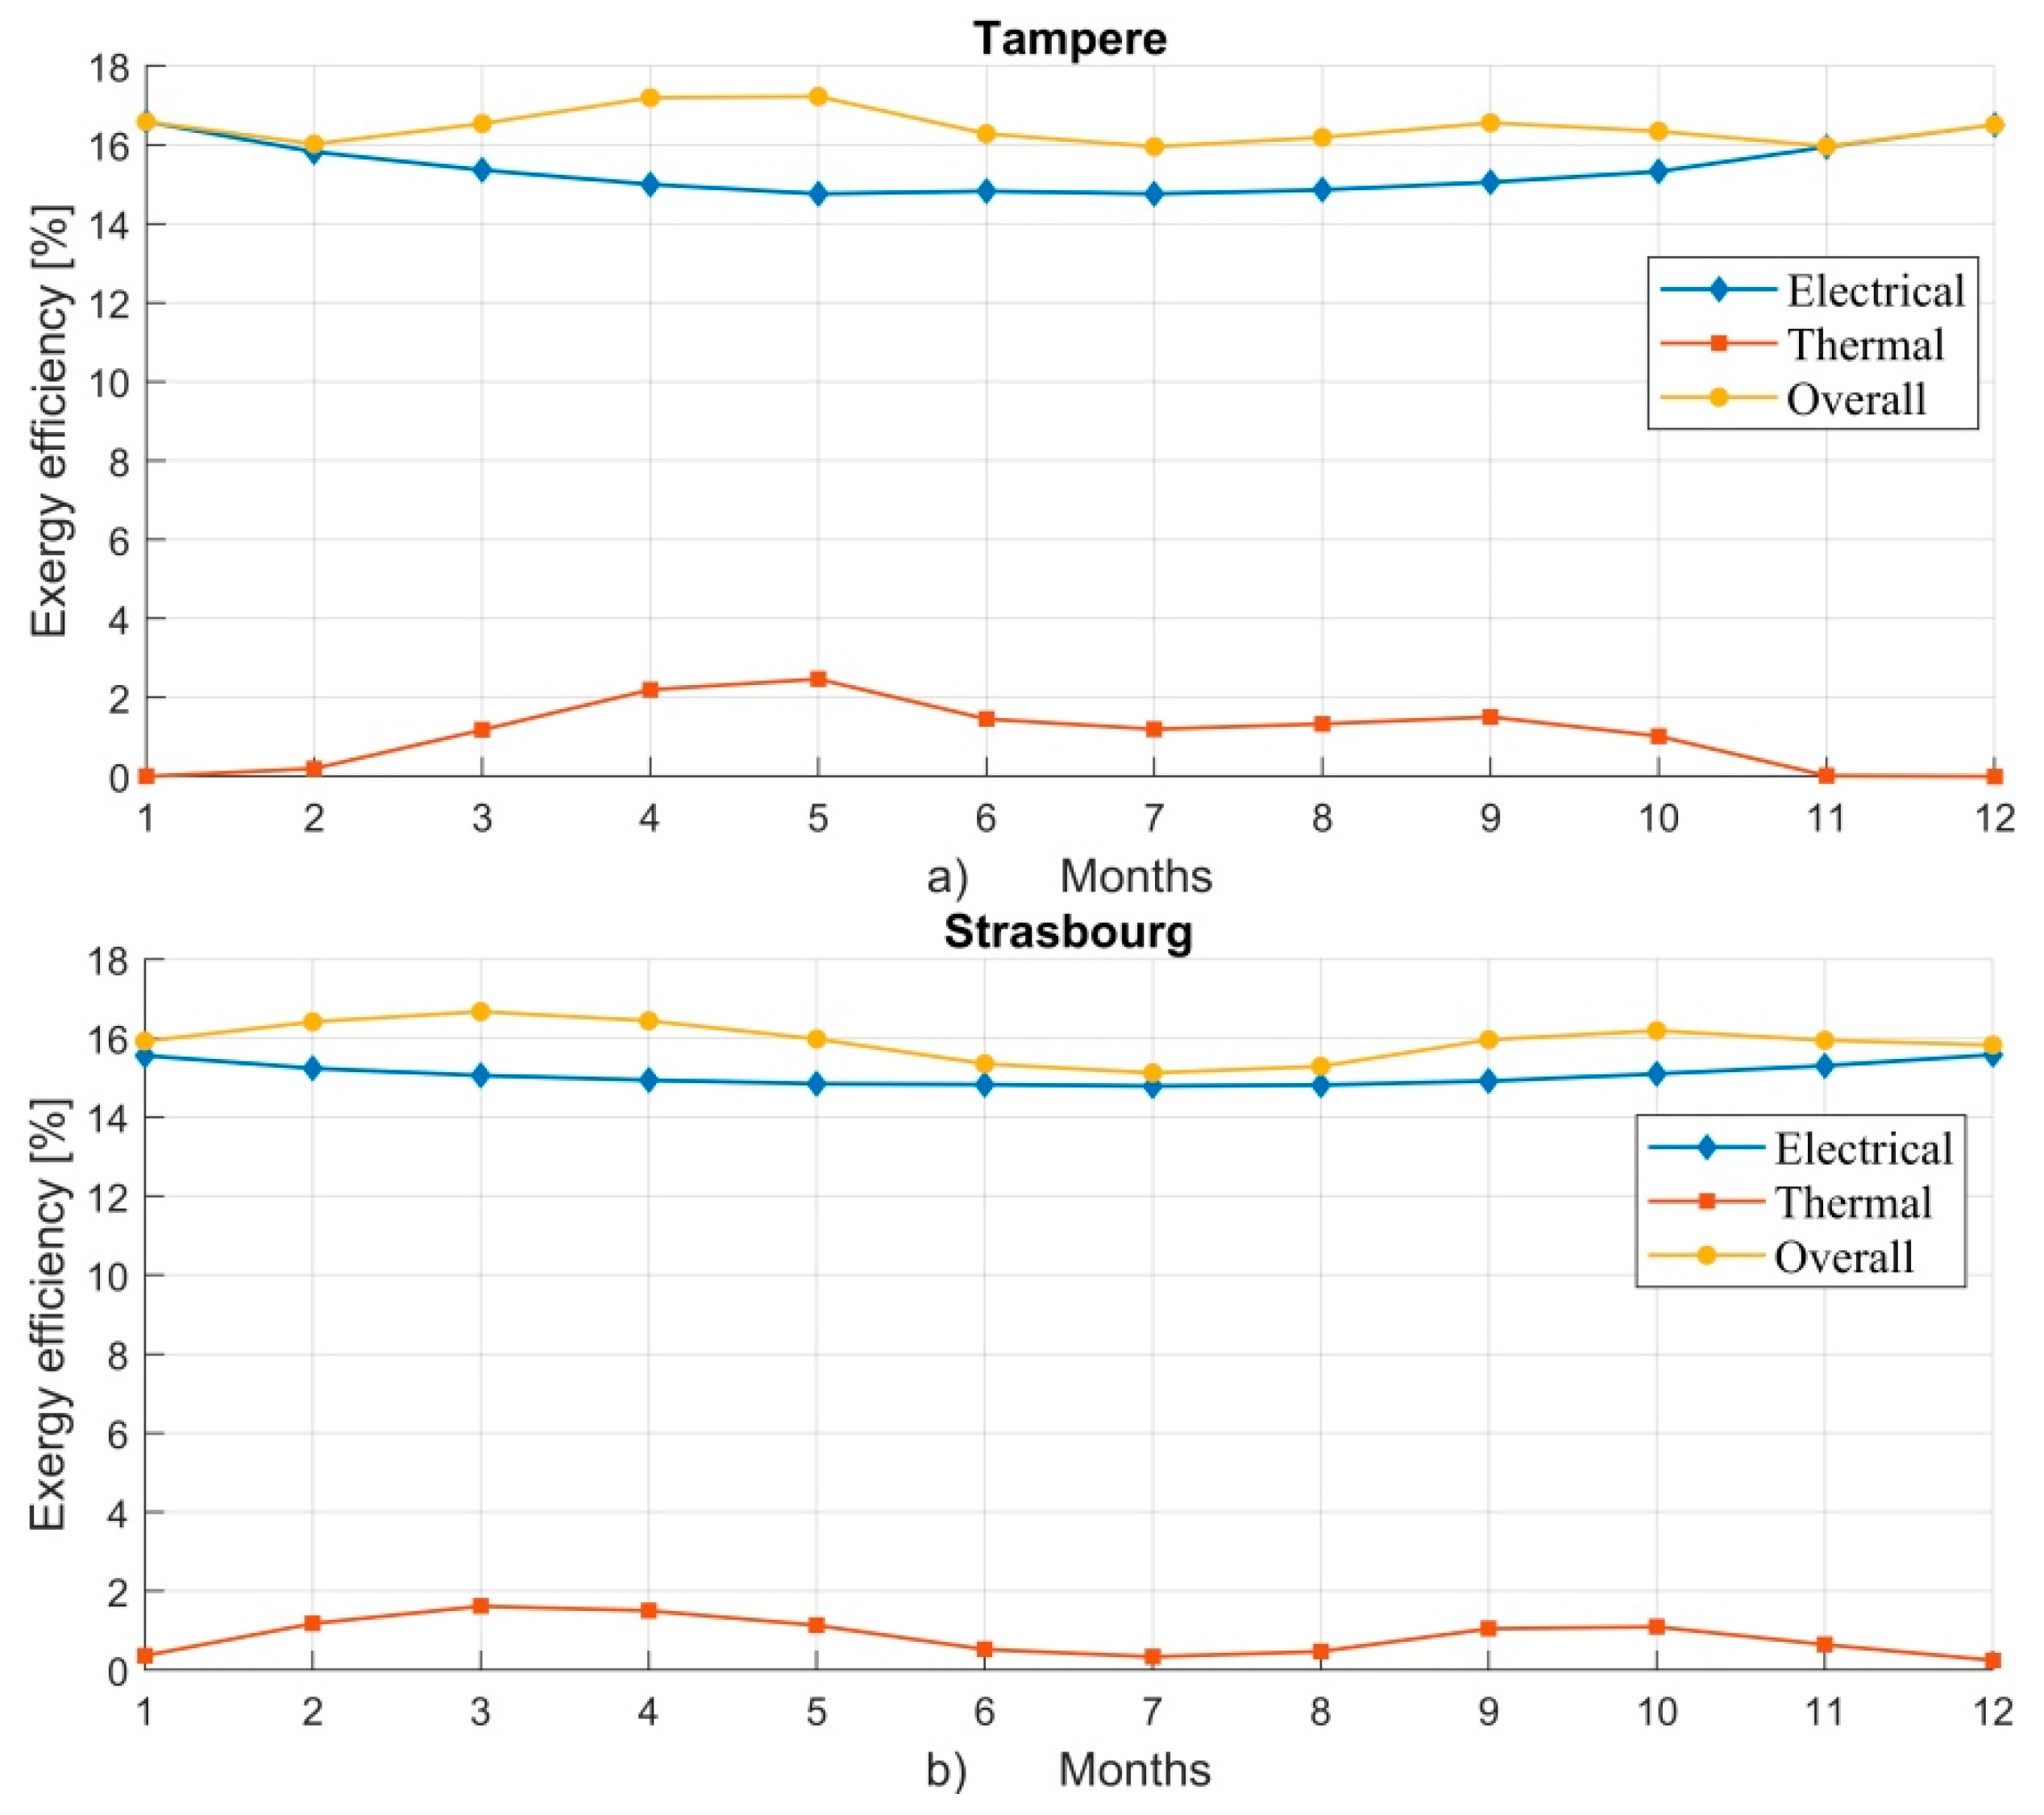
  • Based on the exergy analysis, the thermal energy produced in the northern location of Tampere was of “higher quality” because the thermal exergy production in Tampere was 72.9% higher than Strasbourg. However, the total exergy production was 1.27% higher in Strasbourg than Tampere because of 5.8% higher electrical exergy production.
  • The climate conditions with high solar irradiation but relatively low temperatures are favorable for thermal exergy production.
The results of the analyses lead to the conclusion that in terms of exergy efficiency, the PVT collector should be considered in thermal energy production, especially in the northern locations, such as Finland. In the southern locations with higher average outdoor temperatures, the low-grade thermal energy production is less efficient due to the smaller temperature difference between the produced heat and ambient temperature.
The comparison between the PVT and PV performance resulted in the following main findings:
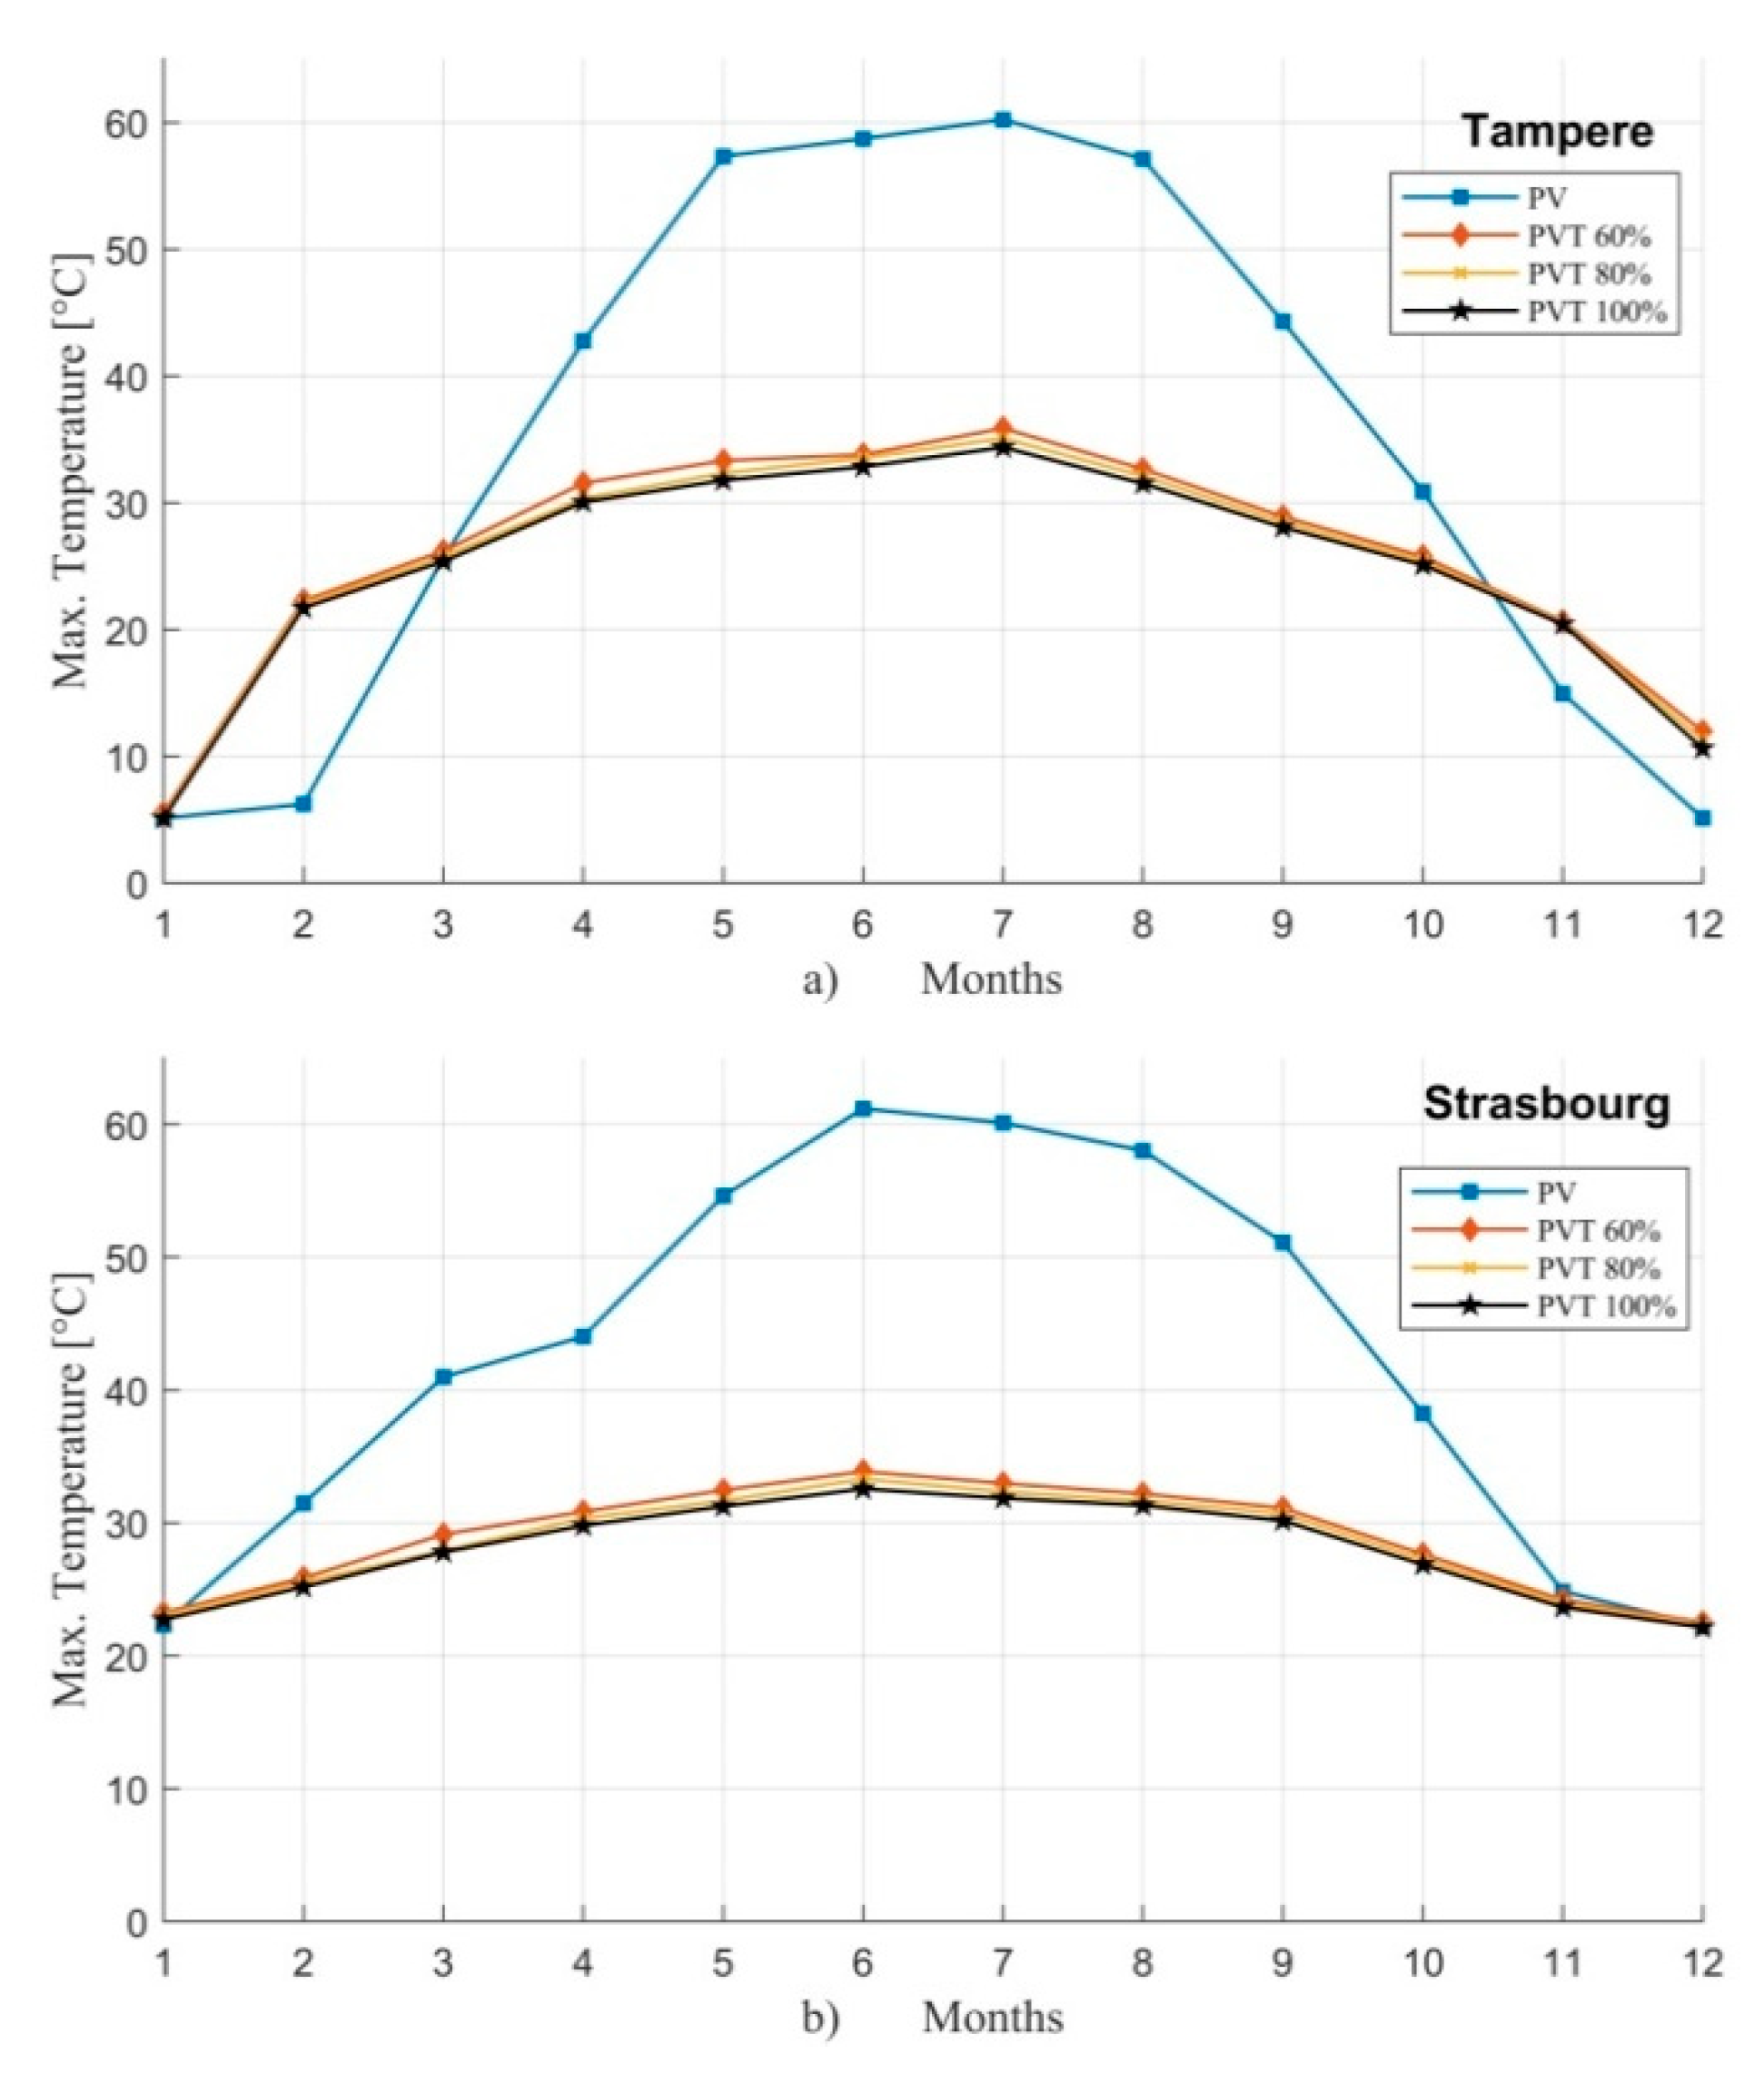
  • In both locations, the monthly maximum PVT operating temperatures were lower than in the PV panel. The maximum operating temperature of the PVT was around 32–35 °C and of the PV 60–61 °C. The lower operating temperatures resulted in around 1%-unit higher cell efficiency in the PVT compared to the PV panel.
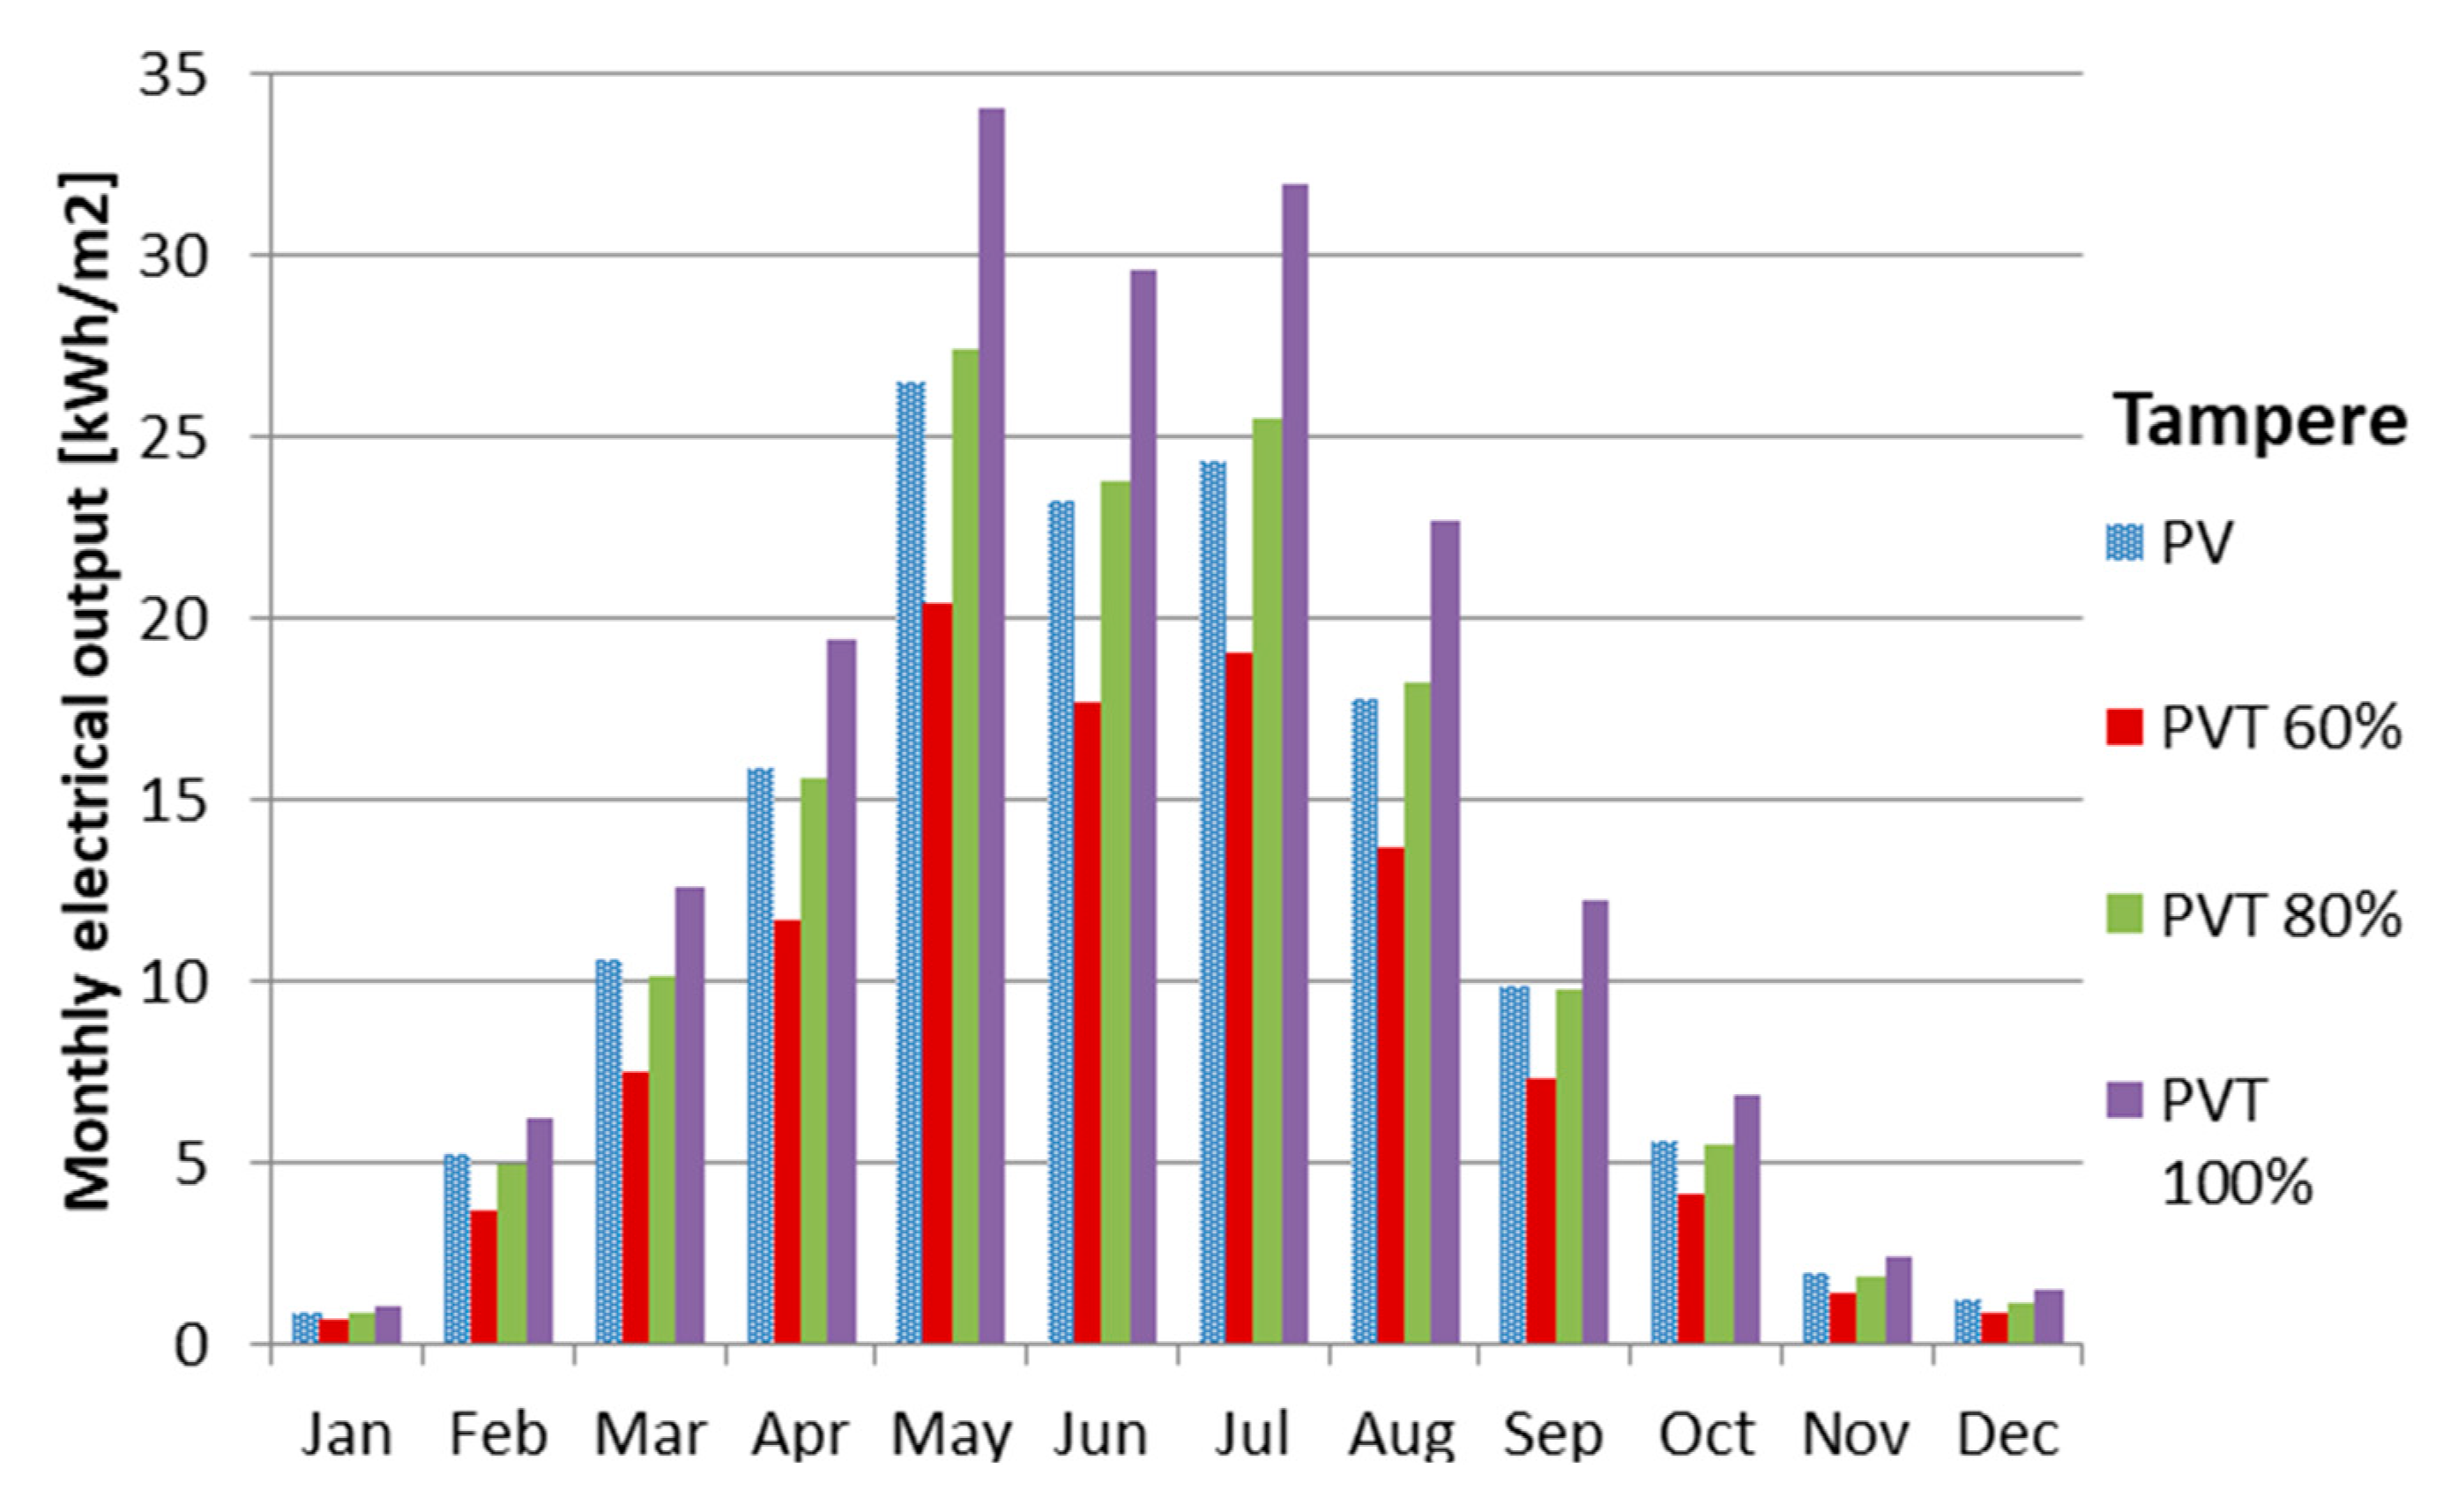
  • The electrical output was significantly influenced by the PVT packing factor. The fully packed PVT collector resulted in the 26% higher annual electrical output than the PV panel.
  • The PVT collector had a higher electrical output during the summer months compared to the PV panel.
  • The annual PVT electrical output is competitive with the PV panel.
The other contribution of this paper was to propose an approach to derive optimized designs for different operational purposes of the PVT collector. The multi-objective optimization approach, based on the genetic algorithm, suitable for the PVT collector design optimization, was demonstrated in this paper. The Pareto front was derived for the defined optimization problem and used to define the optimal design solutions for three different operational purposes. The derived PVT design solutions were compared to the PV panel. The main focus was to find out if the PVT was still competitive with the PV panel electrical output, after maximizing its thermal exergy efficiency within the Pareto front.
Maximizing the thermal exergy efficiency resulted in the low mass flow rate, high inlet temperature and thicker insulation. These variables also increased the PV cell operating temperature, which reduces the PV cell efficiency. However, the results indicated that the yearly PVT electrical output was only 4.2% lower than from the PV panel. In this case, the PVT collector was 80% covered. Based on the simulation results with the different packing factors, the fully packed PVT collector can result in higher electrical output than from the PV panel. This fact makes the thermal exergy- driven PVT collector competitive compared to the PV panel in the building applications that require high-quality electrical and thermal output.
In the literature, Evola and Marletta [11] found that the optimal PVT inlet temperature was around 40 °C in terms of the thermal exergy efficiency. However, the multi-objective optimization results of this study showed that the inlet temperature can be lower than 40 °C to optimize thermal exergy efficiency if the design parameters, such as air gap thickness and insulation were adjusted as well. In the Pareto front, the maximum inlet temperature was 30 °C. The results showed that compared to the typical PVT configuration, used in the energy and exergy analysis of this study, the optimization gave a new collector configuration with much lower mass flow rate, and thicker air gap and insulation. The use of a lower mass flow rate has a benefit of required lower pumping power in a building application with heat storage.
The optimization results revealed that the multi-objective optimization with the genetic algorithm can be used to define the optimal design of the PVT collector for different operational purposes.
In future work, an investigation of using the design optimization approach with the genetic algorithm to the dynamic hybrid system model including PVT collectors, energy storage and demand-side with an electric car will be conducted. A 3E (energy, exergy, economic) analysis of a hybrid system should be conducted based on yearly simulations.

Author Contributions

Conceptualization, S.K. and M.S.; methodology, S.K.; software, S.K.; validation, M.S.; formal analysis, S.K.; investigation, S.K.; resources, S.K. and M.S.; data curation, S.K.; writing—original draft preparation, S.K.; writing—review and editing, S.K. and M.S.; visualization, S.K.; supervision, M.S.; project administration, M.S.; funding acquisition, M.S. All authors have read and agreed to the published version of the manuscript.

Funding

This research was funded by Interreg V Rhin supérieur ACA-MODES project.

Acknowledgments

The authors would like to thank Interreg V Rhin supérieur ACA-MODES project for their support and funding of this research.

Conflicts of Interest

The authors declare no conflict of interest.

Nomenclature

Aarea, m2
cspecific heat, J/(kg K)
Ddiameter, m
EDC power, energy, W
Exexergy, W
Gsolar irradiation density, W/m2
Hthickness, m
hheat transfer coefficient, W/(m2 K)
kthermal conductivity, W/(mK)
Llength, m
Mnumber of objectives
mmass, kg
m ˙ mass flow rate, kg/s
Nnumber of collectors
NuNusselt number
Ppower, W
PrPrandlt number
Qheat flux, W
ReReynolds number
rpacking factor
Ttemperature, °C, K
T*reduced temperature, K m2/W
Uinternal energy, J
vwind speed, m/s
Wtube spacing, m
Greek symbols
ηefficiency
αabsorbance
(ατ)effective absorbance
βtemperature coefficient, %/K
εemissivity
ξexergy efficiency
τtransmittance
ρdensity, kg/m3
σStefan–Boltzmann constant, W/m2/K4
Subscripts
aabsorber
adhadhesive layer
ccollector
CDconduction
CVconvection
ddestruction
eenvironment
elelectrical
ffluid
finfluid inlet
foutfluid outlet
gglass cover
gapair gap
irrirradiation
oouter
pvphotovoltaic
PVgphotovoltaic glass
RDradiation
solsolar
tedtedlar layer
ththermal
tottotal
0reference

References

  1. Martinez, S.; Michaux, G.; Salagnac, P.; Faure, J. Numerical Investigation of Energy Potential and Performance of a Residential Building—Integrated Solar—Chp System. In Proceedings of the System Simulation in Buildings 2018: SSB20182018, Liège, Belgium, 10–12 December 2018; pp. 1–20. [Google Scholar]
  2. Vera, J.T.; Laukkanen, T.; Sirén, K. Performance evaluation and multi-objective optimization of hybrid photovoltaic-thermal collectors. Sol. Energy 2014, 102, 223–233. [Google Scholar] [CrossRef]
  3. Zhang, X.; Zhao, X.; Smith, S.; Xu, J.; Yu, X. Review of R&D progress and practical application of the solar photovoltaic/thermal (PV/T) technologies. Renew. Sustain. Energy Rev. 2012, 16, 599–617. [Google Scholar] [CrossRef]
  4. Lee, J.H.; Hwang, S.G.; Lee, G.H. Efficiency improvement of a photovoltaic thermal (PVT) system using nanofluids. Energies 2019, 12, 491. [Google Scholar] [CrossRef] [Green Version]
  5. Farzanehnia, A.; Sardarabadi, M. Exergy Its Application—Toward Green Energy Production and Sustainable Environment. In Exergy in Photovoltaic/Thermal Nanofluid-Based Collector Systems; IntechOpen: London, UK, 2019. [Google Scholar] [CrossRef] [Green Version]
  6. Han, X.; Chen, X.; Wang, Q.; Alelyani, S.M.; Qu, J. Investigation of CoSO4-based Ag nanofluids as spectral beam splitters for hybrid PV/T applications. Sol. Energy 2019, 177, 387–394. [Google Scholar] [CrossRef]
  7. Walshe, J.; Carron, P.M.; McLoughlin, C.; McCormack, S.; Doran, J.; Amarandei, G. Nanofluid Development Using Silver Nanoparticles and Organic-Luminescent Molecules for Solar-Thermal and Hybrid Photovoltaic-Thermal Applications. Nanomaterials 2020, 10, 1201. [Google Scholar] [CrossRef]
  8. Yazdanpanahi, J.; Sarhaddi, F.; Adeli, M.M. Experimental investigation of exergy efficiency of a solar photovoltaic thermal (PVT) water collector based on exergy losses. Sol. Energy 2015, 118, 197–208. [Google Scholar] [CrossRef]
  9. Feidt, M.; Costea, M. Energy and Exergy Analysis and Optimization of Combined Heat and Power Systems. Comparison of Various Systems. Energies 2012, 5, 3701–3722. [Google Scholar] [CrossRef] [Green Version]
  10. Feidt, M. Two examples of exergy optimization regarding the “thermo-frigopump” and combined heat and power systems. Entropy 2013, 15, 544–558. [Google Scholar] [CrossRef]
  11. Evola, G.; Marletta, L. Exergy and thermoeconomic optimization of a water-cooled glazed hybrid photovoltaic/thermal (PVT) collector. Sol. Energy 2014, 107, 12–25. [Google Scholar] [CrossRef]
  12. Calise, F.; Figaj, R.D.; Vanoli, L. Experimental and Numerical Analyses of a Flat Plate Photovoltaic/Thermal Solar Collector. Energies 2017, 10, 491. [Google Scholar] [CrossRef] [Green Version]
  13. Chow, T.T. Performance analysis of photovoltaic-thermal collector by explicit dynamic model. Sol. Energy 2003, 75, 143–152. [Google Scholar] [CrossRef]
  14. Bhattarai, S.; Oh, J.H.; Euh, S.H.; Kafle, G.K.; Kim, D.H. Simulation and model validation of sheet and tube type photovoltaic thermal solar system and conventional solar collecting system in transient states. Sol. Energy Mater. Sol. Cells 2012, 103, 184–193. [Google Scholar] [CrossRef]
  15. Da Silva, R.M.; Fernandes, J.L.M. Hybrid photovoltaic/thermal (PV/T) solar systems simulation with Simulink/Matlab. Sol. Energy 2010, 84, 1985–1996. [Google Scholar] [CrossRef]
  16. Barbu, M.; Darie, G.; Siroux, M. Analysis of a residential photovoltaic-thermal (PVT) system in two similar climate conditions. Energies 2019, 12, 3595. [Google Scholar] [CrossRef] [Green Version]
  17. Dubey, S.; Tiwari, G.N. Analysis of PV/T flat plate water collectors connected in series. Sol. Energy 2009, 83, 1485–1498. [Google Scholar] [CrossRef]
  18. Herrando, M.; Ramos, A.; Freeman, J.; Zabalza, I.; Markides, C.N. Technoeconomic modelling and optimisation of solar combined heat and power systems based on flat-box PVT collectors for domestic applications. Energy Convers. Manag. 2018, 175, 67–85. [Google Scholar] [CrossRef]
  19. Abdul-Ganiyu, S.; Quansah, D.A.; Ramde, E.W.; Seidu, R.; Adaramola, M.S. Investigation of solar photovoltaic-thermal (PVT) and solar photovoltaic (PV) performance: A case study in Ghana. Energies 2020, 13, 2701. [Google Scholar] [CrossRef]
  20. Vera, J.T.; Laukkanen, T.; Sirén, K. Multi-objective optimization of hybrid photovoltaic-thermal collectors integrated in a DHW heating system. Energy Build. 2014, 74, 78–90. [Google Scholar] [CrossRef]
  21. Ouhsiane, L.; Siroux, M.; El Ganaoui, M.; Mimet, A. Multi-Objective Optimization of Hybrid PVT Solar Panels. In Proceedings of the 2018 International Conference on the Industrial and Commercial Use of Energy (ICUE 2018), Cape Town, South Africa, 2–7 October 2018. [Google Scholar] [CrossRef]
  22. Conti, P.; Schito, E.; Testi, D. Cost-benefit analysis of hybrid photovoltaic/thermal collectors in a nearly zero-energy building. Energies 2019, 12, 1582. [Google Scholar] [CrossRef] [Green Version]
  23. Sobhnamayan, F.; Sarhaddi, F.; Alavi, M.A.; Farahat, S.; Yazdanpanahi, J. Optimization of a solar photovoltaic thermal (PV/T) water collector based on exergy concept. Renew. Energy 2014, 68, 356–365. [Google Scholar] [CrossRef]
  24. Wohlfeil, A. CARNOT Toolbox. FH Aachen. Available online: https://fh-aachen.sciebo.de/index.php/s/0hxub0iIJrui3ED (accessed on 12 August 2020).
  25. Aste, N.; Leonforte, F.; Del Pero, C. Design, modeling and performance monitoring of a photovoltaic-thermal (PVT) water collector. Sol. Energy 2015, 112, 85–99. [Google Scholar] [CrossRef]
  26. Ilmatieteen Laitos Kuukausitilastot—Ilmatieteen Laitos. Available online: https://www.ilmatieteenlaitos.fi/kuukausitilastot (accessed on 12 August 2020).
  27. Prevision-meteo.ch. Relevés Mensuels de Strasbourg pour L’année en Cours. Available online: https://www.prevision-meteo.ch/climat/mensuel/strasbourg (accessed on 12 August 2020).
  28. McAdams, W.H. Heat Transmission, 3rd ed.; McGraw-Hill: New York, NY, USA, 1954. [Google Scholar]
  29. Guarracino, I.; Mellor, A.; Ekins-Daukes, N.J.; Markides, C.N. Dynamic coupled thermal-and-electrical modelling of sheet-and-tube hybrid photovoltaic/thermal (PVT) collectors. Appl. Therm. Eng. 2016, 101, 778–795. [Google Scholar] [CrossRef] [Green Version]
  30. Touafek, K.; Khelifa, A.; Adouane, M. Theoretical and experimental study of sheet and tubes hybrid PVT collector. Energy Convers. Manag. 2014, 80, 71–77. [Google Scholar] [CrossRef]
  31. Hollands, K.G.T.; Unny, T.E.; Raithby, G.D.; Konicek, L. Free Convective Heat Transfer Across Inclined Air Layers. Am. Soc. Mech. Eng. 1975, 98, 189–193. [Google Scholar] [CrossRef]
  32. Incropera, F. Fundamentals of Heat and Mass Transfer; John Wiley and Sons: Hoboken, NJ, USA, 2011. [Google Scholar]
  33. Kalyanmoy, D. Multi-Objective Optimization using Evolutionary Algorithms; John Wiley and Sons: Chichester, UK, 2001. [Google Scholar]
Figure 1. The PVT collector: (a) direct flow collector geometry; (b) cross section of the PVT collector [16].
Energies 13 05106 g001
Figure 2. Climate conditions during the summer week in Tampere and Strasbourg: (a) solar irradiation; (b) ambient temperature; (c) wind speed.
Energies 13 05106 g002
Figure 3. Climate conditions during the winter week in Tampere and Strasbourg: (a) solar irradiation; (b) ambient temperature; (c) wind speed.
Energies 13 05106 g003
Figure 4. The control volume and exergy flows of the PVT collector model.
Energies 13 05106 g004
Figure 5. Simulated thermal and electrical efficiencies as a function of the reduced temperature.
Energies 13 05106 g005
Figure 6. Exergy of electrical power during: (a) summer week; (b) winter week.
Energies 13 05106 g006
Figure 7. The electrical exergy efficiency, PVT surface, fluid outlet and ambient temperature during a summer day.
Energies 13 05106 g007
Figure 8. Monthly electrical and thermal efficiencies over year in Tampere and Strasbourg.
Energies 13 05106 g008
Figure 9. Thermal, electrical and overall monthly exergy efficiencies in (a) Tampere and (b) Strasbourg.
Energies 13 05106 g009
Figure 10. The PV cell operating temperatures and electrical efficiency (a) in Tampere and (b) in Strasbourg during the three summer days.
Energies 13 05106 g010
Figure 11. Monthly maximum PV cell operating temperatures of the PV panel and PVT collector with different packing factors in (a) Tampere and (b) Strasbourg.
Energies 13 05106 g011
Figure 12. Monthly electrical output of the PV panel and PVT collector with different packing factors in Tampere, Finland.
Energies 13 05106 g012
Figure 13. Monthly electrical output of the PV panel and PVT collector with different packing factors in Strasbourg, France.
Energies 13 05106 g013
Figure 14. The simulation based multi-objective optimization process.
Energies 13 05106 g014
Figure 15. The sensitivity of the decision variables to electrical and thermal exergy efficiencies: (a) mass flow rate, (b) inlet temperature, (c) air gap thickness and (d) insulation thickness.
Energies 13 05106 g015
Figure 16. The Pareto optimal front in the objective space of the electrical and thermal exergy efficiencies.
Energies 13 05106 g016
Figure 17. Monthly maximum PV cell operating temperatures in the PV panel and optimal PVT designs.
Energies 13 05106 g017
Figure 18. Monthly electrical output of the PV panel and three optimal PVT designs.
Energies 13 05106 g018
Figure 19. Monthly thermal exergy of different PVT designs.
Energies 13 05106 g019
Table 1. The geometrical, thermo-physical and optical properties of the photovoltaic-thermal (PVT) collector.
PropertyGlassAir GapPVThermal AbsorberFluidInsulationUnit
Emissivity (ε)0.88-0.96----
Absorbance (α)0.1-0.9----
Transmittance (τ)0.93------
Thickness (H)0.0040.020.00020.0002-0.015m
Area (A)221.62-2m2
Mass flow----0.044-kg/s
Density (ρ)2200-23302702105020kg/m3
Specific heat (c)670-9008003605670J/(kgK)
Thermal conductivity (k)1.1-1403100.6150.034W/(mK)
Table 2. The monthly average outdoor temperatures used in the exergy analysis.
MonthTampere, Average Temperature [°C]Strasbourg, Average Temperature [°C]
January−6.42.3
February−6.93.3
March−2.87.0
April3.311.5
May9.715.7
June14.119.4
July16.920.6
August1519.8
September9.815.8
October4.611.3
November−0.66.5
December−4.53.3
Table 3. Decision variables for multi-objective optimization problem.
SymbolDecision VariableBoundsUnit
m ˙ Fluid mass flow rate0.0083 ≤ x(1) ≤ 0.044kg/s
TinInlet temperature15 ≤ x(2) ≤ 45°C
HgapAir gap thickness0.02 ≤ x(3) ≤ 0.25m
HiInsulation thickness0.015 ≤ x(4) ≤ 0.09m
Table 4. Simulation results of the energy and exergy analysis.
ProductionStrasbourg [kWh/year]Tampere [kWh/year]
Eth992.1915.5
Eel305.5288.8
Ein2191.82064.8
Exth17.430.1
Exel305.5288.8
Exin2046.21930

