1. Introduction
Understanding the mechanical properties of lithium-ion batteries and how each subcomponent can contribute to the failure of the overall system by causing a short circuit is one of the subjects of interest in the broad field of research on the mechanical integrity of lithium-ion batteries. The short-circuiting of a battery can be due to the physical deformation of the battery which causes damage of subcomponents inside the protective casing or due to defects and impurities created during production. In the future, lithium-ion battery-powered vehicles are expected to replace vehicles with the combustion engine. Thus, the damage that may be sustained from a road accident must be considered when designing an electric car, because even a slight deformation of the battery may cause short-circuiting with potentially catastrophic consequences. There is a high necessity of knowledge and understanding of the mechanical properties of the lithium-ion battery subcomponents during loading for the development of safe electric car designs and to improve the fidelity of electric car crash simulations.
The current research on the mechanical integrity of the battery system in vehicles encompasses all possible scales, from the micro-scale, which ranges from the molecular to the nano-scale [
1,
2,
3] representative volume element [
4], to the macro-scale modeling, such as a full-scale model of a single battery [
5] and battery homogenization for modeling the whole protection system or the whole vehicle upon dynamic loading [
6,
7,
8]. Furthermore, the characterization of each separate battery subcomponent has been conducted to provide more information on their mechanical properties and their failure mechanisms, such as the study on the separator that has been performed [
9]; the comprehensive work on battery subcomponents [
4] upon static loading; the characterization of the casing’s mechanical properties [
10]; and the study on the cathode and anode [
11].
However, there are only a few studies available on the mechanical properties of lithium-ion battery subcomponents subjected to dynamic loadings, such as in a pouch-type battery [
12] and cylindrical battery in the lateral direction [
13]. This is due to the limited availability of a reliable testing device that can perform dynamic loading onto each of the lithium-ion battery subcomponents. One of the most commonly used testing devices for dynamic loading is the split Hopkinson pressure bar.
There is an abundance of research literature on the split Hopkinson pressure bar for a compression test, such as small strain measurement on metal performed by Chen et al. [
14], numerical simulation of a split Hopkinson pressure bar for compression testing by Jusuf et al. [
15], numerical simulation of bar straightness in a compression test using split Hopkinson pressure bar by Afdhal et al. [
16], and the design guide for building a split Hopkinson pressure bar written by Chen et al. [
17]. For the tension test, a modified version known as split Hopkinson tensile bar (SHTB) is used, and there are many variants of the device that have been reported [
18,
19,
20,
21,
22].
This research is focused on four main topics related to the dynamic characterization of Li-ion battery components, which are as follows: (1) the design of a testing device and testing technique, (2) numerical studies of the dynamic tensile test of steel casing, aluminum foil, and copper foil, (3) simulation of the dynamic compression of homogenized jellyroll using a split Hopkinson pressure bar (SHPB) device, and (4) simulation of an axial impact test on a homogenized battery model. The split Hopkinson bar is commonly used to obtain the stress–strain curve of materials under several strain rate values. In this research, the SHPB setup was simulated to obtain the stress–strain curve of a homogenized jellyroll under several strain rates, and the SHTB setup was simulated to obtain the stress–strain curve from three different materials, which are steel, aluminum, and copper. Then, the result obtained was used to develop the numerical model of the homogenized battery and simulated undergoing axial impact.
The design of the SHTB was based on the design proposed by Huh et al [
23]. This design was chosen due to its simplicity in design and no major modification required to the available setup. Then, the design of the SHTB and the specimen were simulated to determine whether they can provide a reliable signal. Since the thickness of the lithium-ion battery subcomponents ranges from 10 to 250 μm, a new stacking method was introduced by stacking multiple thin-foil specimens to amplify the generated strain. The result of the simulation using the stacked specimens was compared to a single-layer specimen with the same total thickness as the stacked specimens in order to observe deviations in the result obtained from the stacked specimens and the single-layer specimen.
The SHPB simulation of the jellyroll was performed, since there has been no reported study on the strain rate effect in the axial loading direction for the cylindrical battery. This study will provide the results of the simulation of the SHPB test using two material models, Fu-Chang foam and modified crushable foam, and the unloading effect is also simulated by varying the values of hysteretic unit to control the unloading curve in the simulation.
A homogenized model of a Li-ion battery was developed using the jellyroll model from the SHPB simulation and the steel mechanical properties used in the SHTB simulation. The battery model was subjected to three different impact speeds, which were 1, 5, and 10 m/s. The force–displacement relationship was observed to see the effect of loading speed. The model and its result served as predictions for the future experiment using the 18650 NCA Li-ion battery.
2. Design of the Split Hopkinson Tension Bar
The split Hopkinson bar default configuration consists of a striker bar, an incident bar, and a transmitter bar. In the compression configuration, the striker bar, which is mounted on a gas gun, is shot to the incident bar to generate a strain wave. The strain wave, or in this case, the incident wave (), travels along the incident bar, and the wave is transmitted to the transmitter bar through a specimen in between the incident bar and the transmitter bar. The moment the wave reaches the boundary between the incident bar and the specimen, the wave is divided into two new waves. The first wave is reflected, which is known as the reflected wave (), and it moves along the incident bar, while the second wave traverses through the specimen to the transmitter bar, which is known as the transmitted wave (). If the striker, the incident bar, and the transmitter bar are made of the same material and have the same cross-section, and the specimen has an impedance that matches with the bars, then the sum of the reflected wave and the transmitted wave must be equal to the initial incident wave, as shown in Equation (1).
The calculation of strain rate
, strain ε, and specimen stress σ can be seen in Equations (2)–(4):
where E is the Young modulus of the bar, A is the cross-section area of the specimen, A
0 is the cross-section area of the bar, C is the speed of the elastic wave on the bar, and L
SP is the length of the specimen.
For the dynamic tensile test simulation, the procedure is the same as for the dynamic compression except that the loading configuration on the bars is modified. Instead of compressing the incident bar, the striker bar impacts in such a way that the load on the specimen is in the tensile load direction. One way to achieve this is by designing a striker bar with a hollow cross-section, thus allowing the striker bar to glide along the incident bar. The incident bar is equipped with an anvil to trap the momentum of the striker bar and convert it into a tensile strain wave. The same as in the compression configuration, the strain wave then travels to the transmitter bar through the specimen. The equations to calculate the stress and the strain are the same as Equations (1)–(4), with the exception of Equation (2), of which the result must be reversed to obtain a positive strain rate.
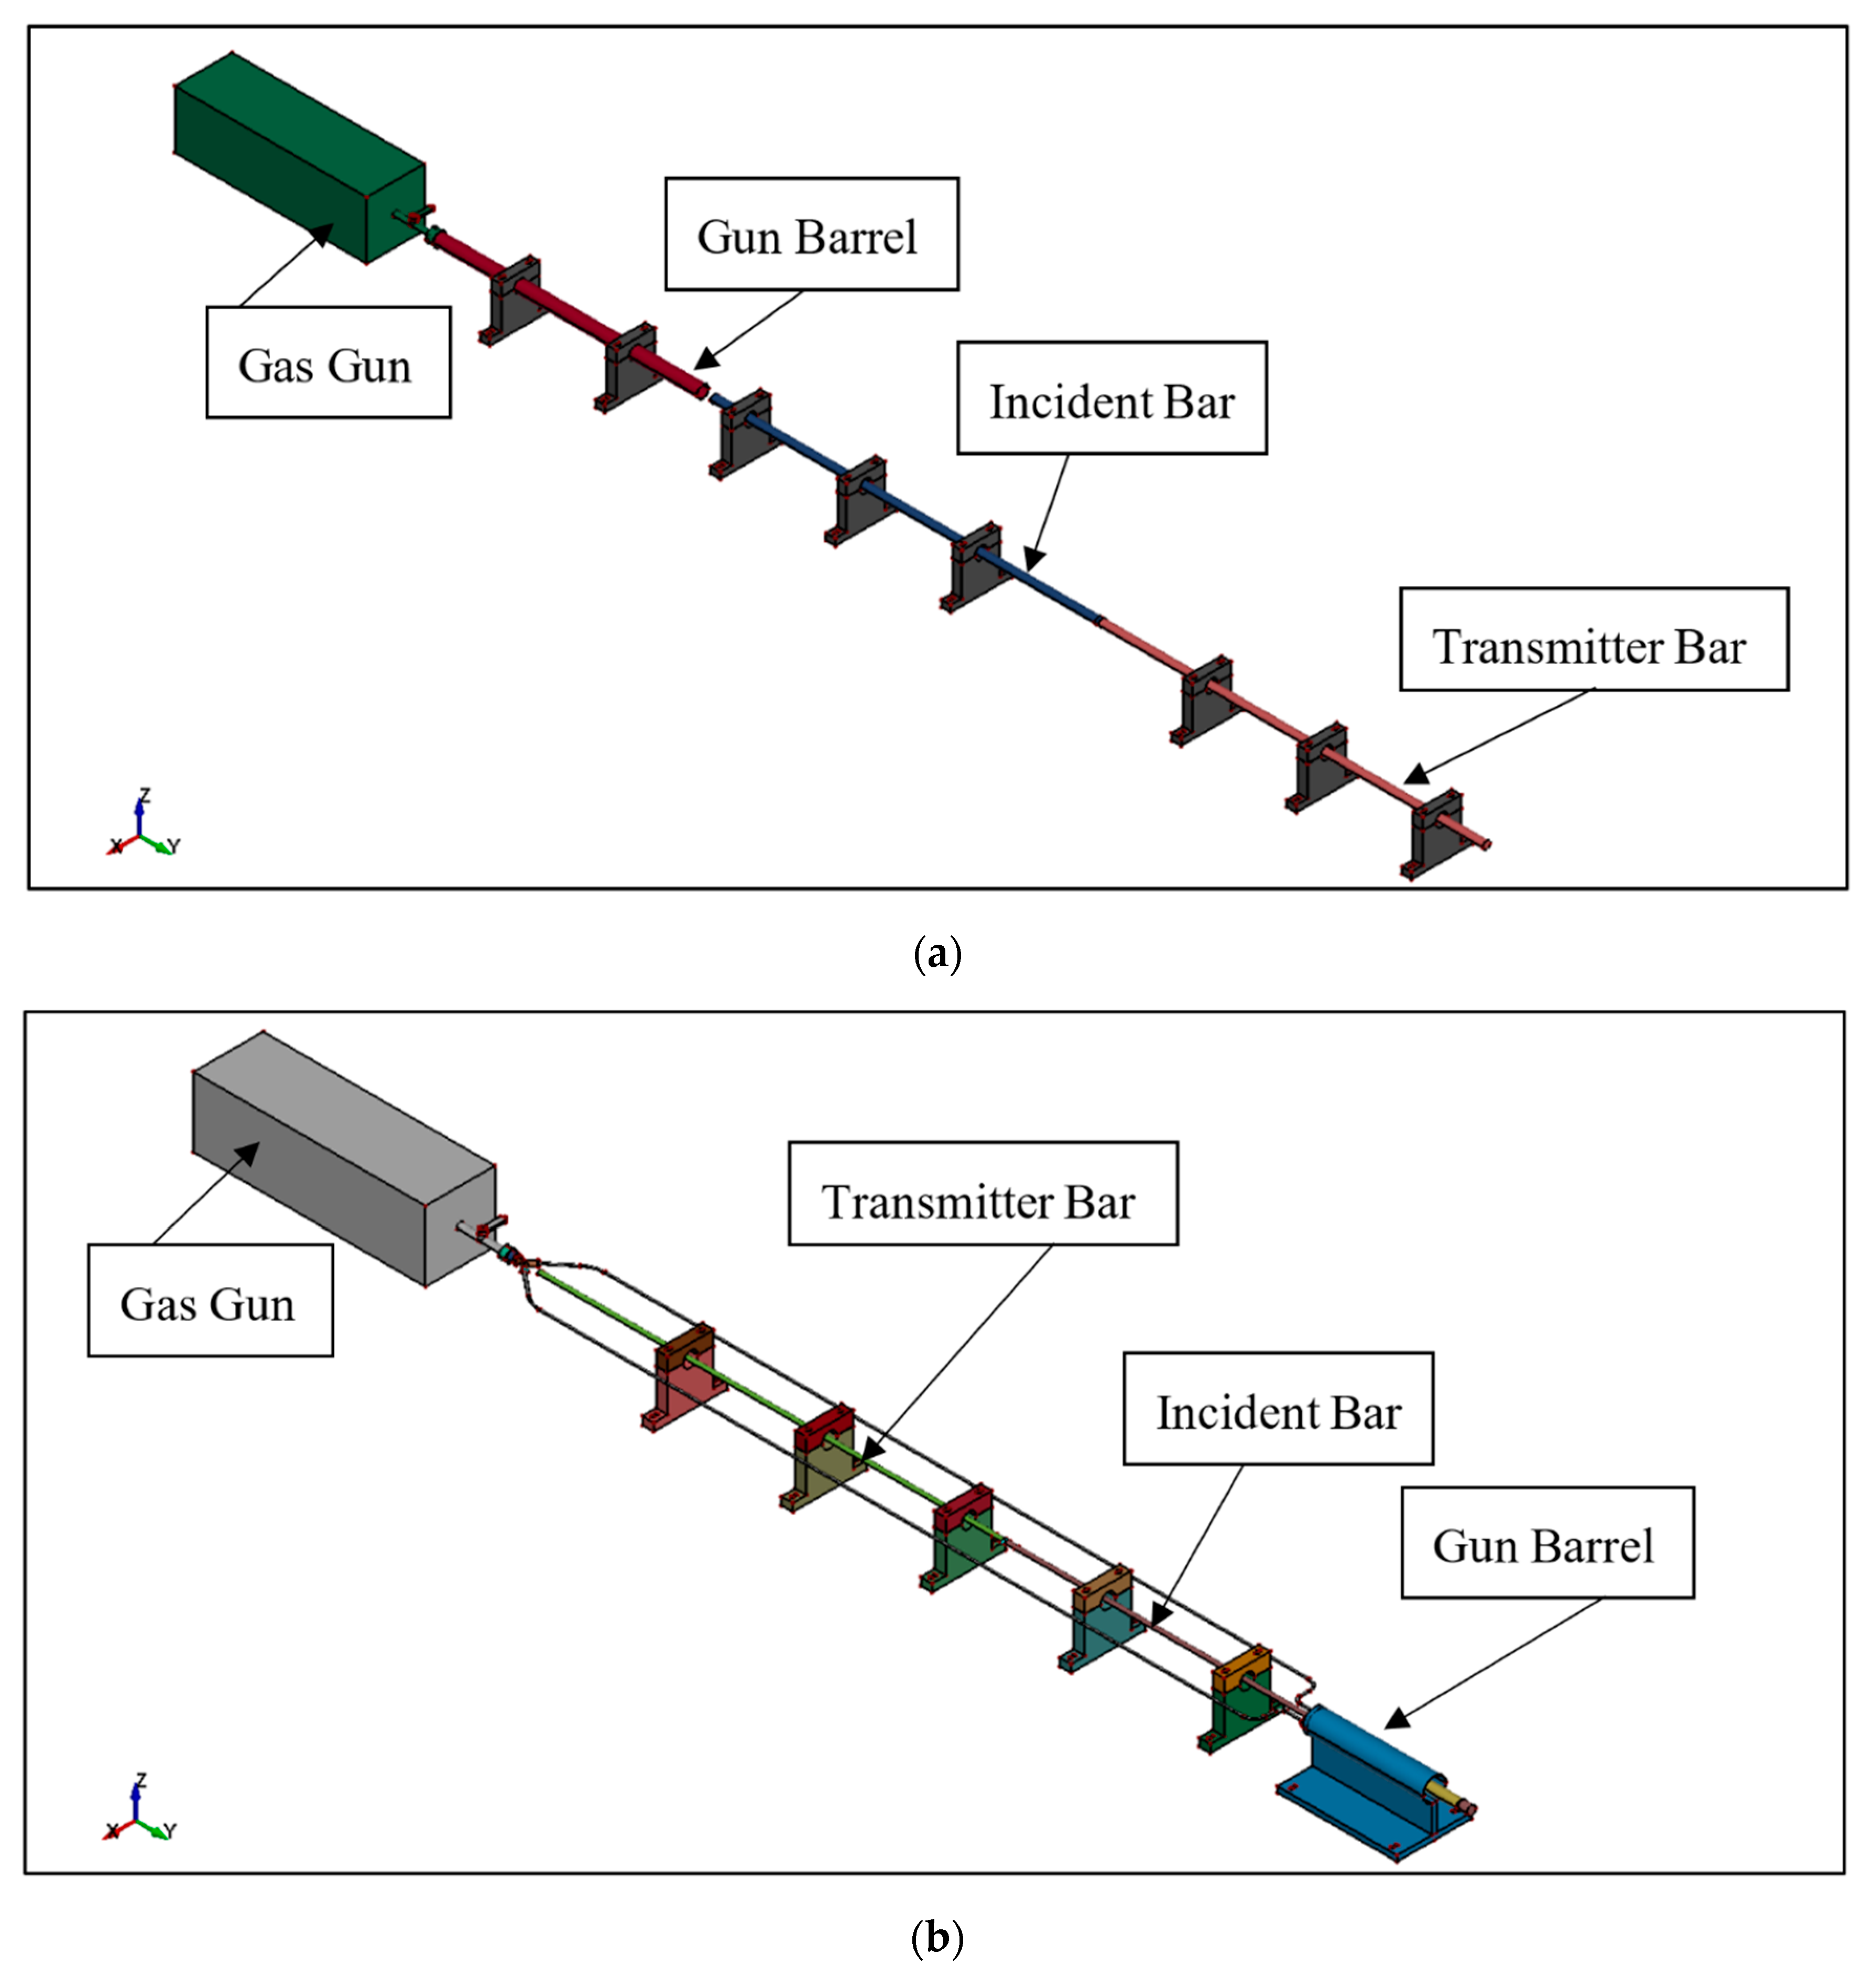
For the SHTB device to be able to perform in tension, a new gun barrel design is needed in order to accommodate the gas gun setup and to hold the new striker bar, as shown in
Figure 1. The hollow striker bar is required to act as a puller to the incident bar instead of a pusher, thus generating tension load. Overall, there is no major modification to the current configuration other than the replacement of the gun barrel, while the other SHPB components, such as the gas gun, the firing mechanism, and the housing, remain the same. The canister system and the gun barrel in
Figure 1b are connected to a hose that delivers gas from the canister to the gun barrel upon firing.
The transmitter bar was designed as a hollow bar, whereas the incident bar remains a solid cylindrical bar, as suggested by Chen et al. [
17]. The thickness of the specimens may impose a challenge in terms of data acquisition as both copper and aluminum foil have a thickness in the range of 10–30 microns. Another modification was performed to the transmitter bar to accommodate the thin-specimen configuration, which usually produces a low strain wave signal. This low signal can be amplified by designing a reduced cross-section for the transmitter bar. The strain rate equation is then modified, as shown in Equation (5).
where ε is the strain, C
0 is the speed of the elastic wave on the bar, l
0 is the length of the specimen, A
i is the cross-section area of the incident bar, A
t is the cross-section area of the transmitter bar,
is the incident wave, and
is the reflected wave.
Due to the change of the transmitter bar’s cross-section, Equation (1) is no longer valid. Therefore, the applicable equations to characterize the tensile strain wave are Equations (3)–(5).
Another method to amplify the signal is by using a material with low stiffness for the bars. The lower material stiffness will produce a lower wave impedance, which in turn creates a signal with higher amplitude compared to a material with high stiffness. In this study, polymethylmethacrylate (PMMA) was used to capture the signal from the aluminum and copper thin foils, as both materials are too thin to work with the standard split Hopkinson tension bar setup with solid bars.
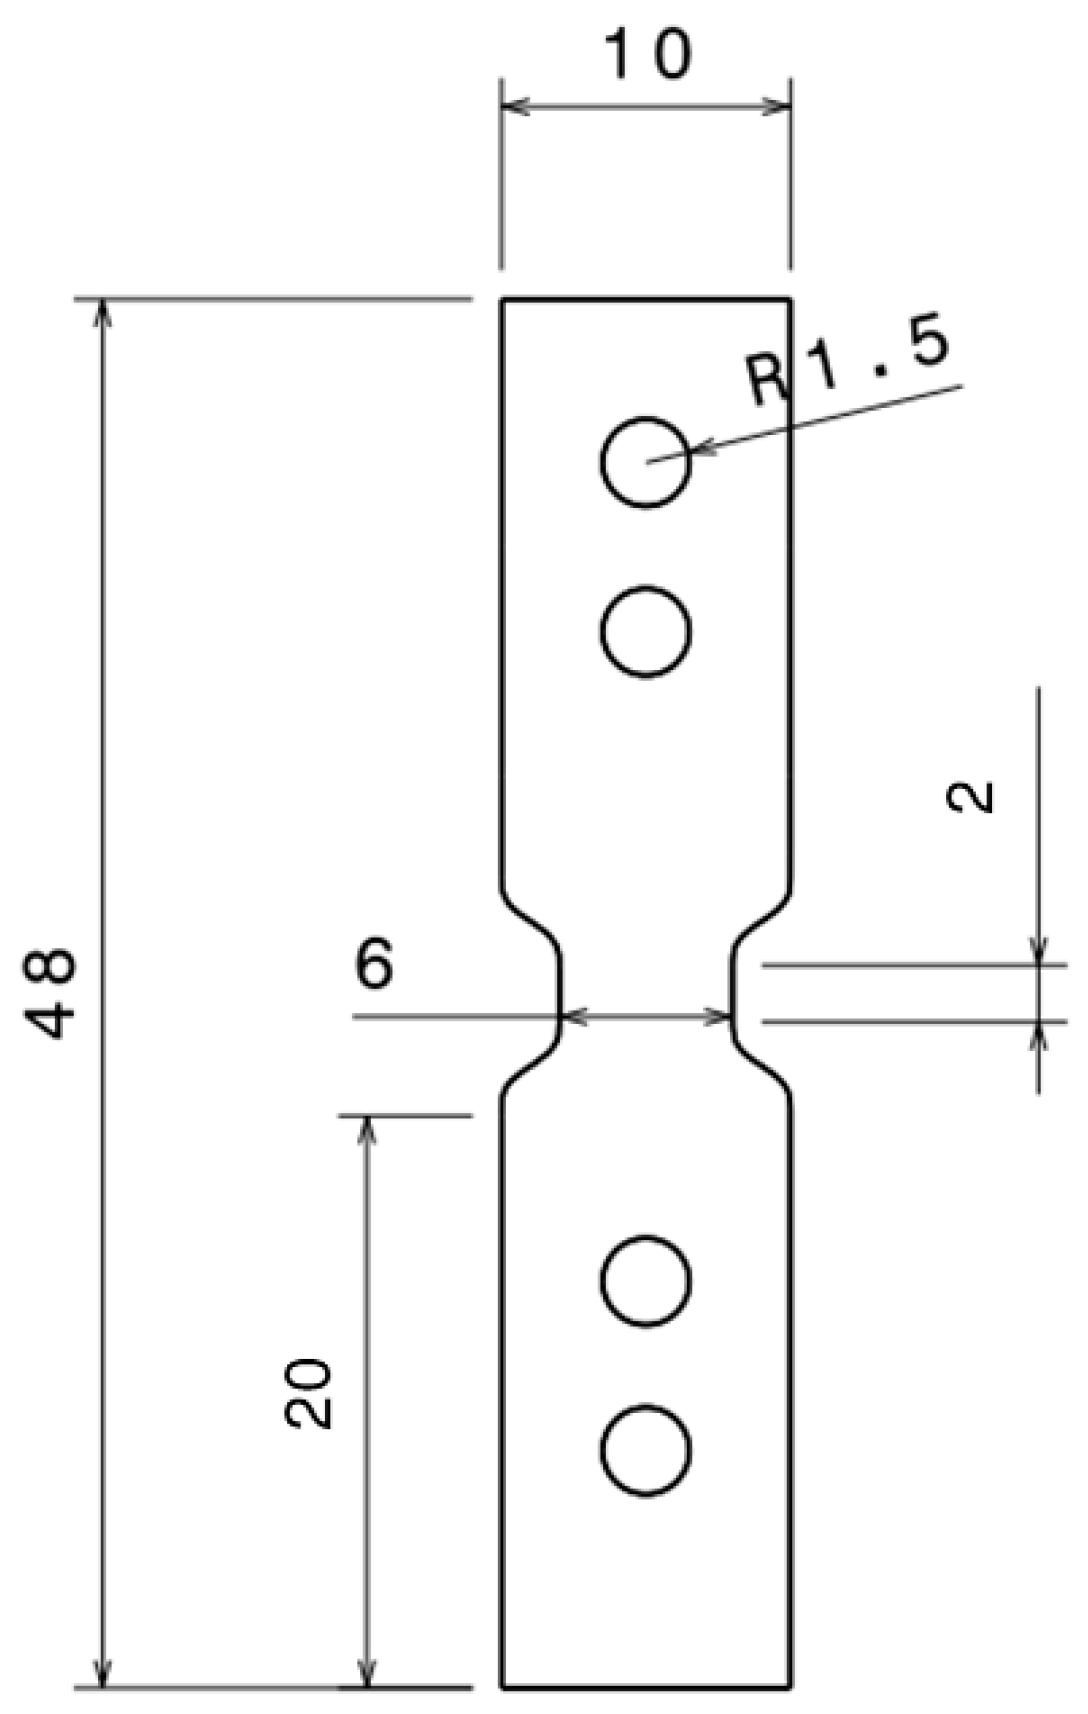
The specimen dimensions used in this study were also based on the design by Huh et. al. [
23]. A schematic of the design is shown in
Figure 2. The thickness of each material specimen is given in
Table 1.
3. Simulation Procedure
3.1. Dynamic Tensile Test Simulation
The dynamic tensile test simulation of aluminum, steel, and copper using SHTB was performed using LS-DYNA explicit solver. The bars and bolts are modeled with ELFORM 1 for the elements with an average mesh size of 5 mm. The bars and the joint material were modeled using an elastic material card. Two materials are used for the bars, AISI 4340, which is used for the steel specimen, and PMMA, which is used for the aluminum and copper foil. The AISI 4340 has a Young modulus value of 205 GPa, a density value of 7850 kg/mm3, and a Poisson ratio value of 0.29. The PMMA used in the simulation has a Young modulus value of 5.7 GPa, a density of 1190 kg/mm3, and a Poisson ratio value of 0.34.
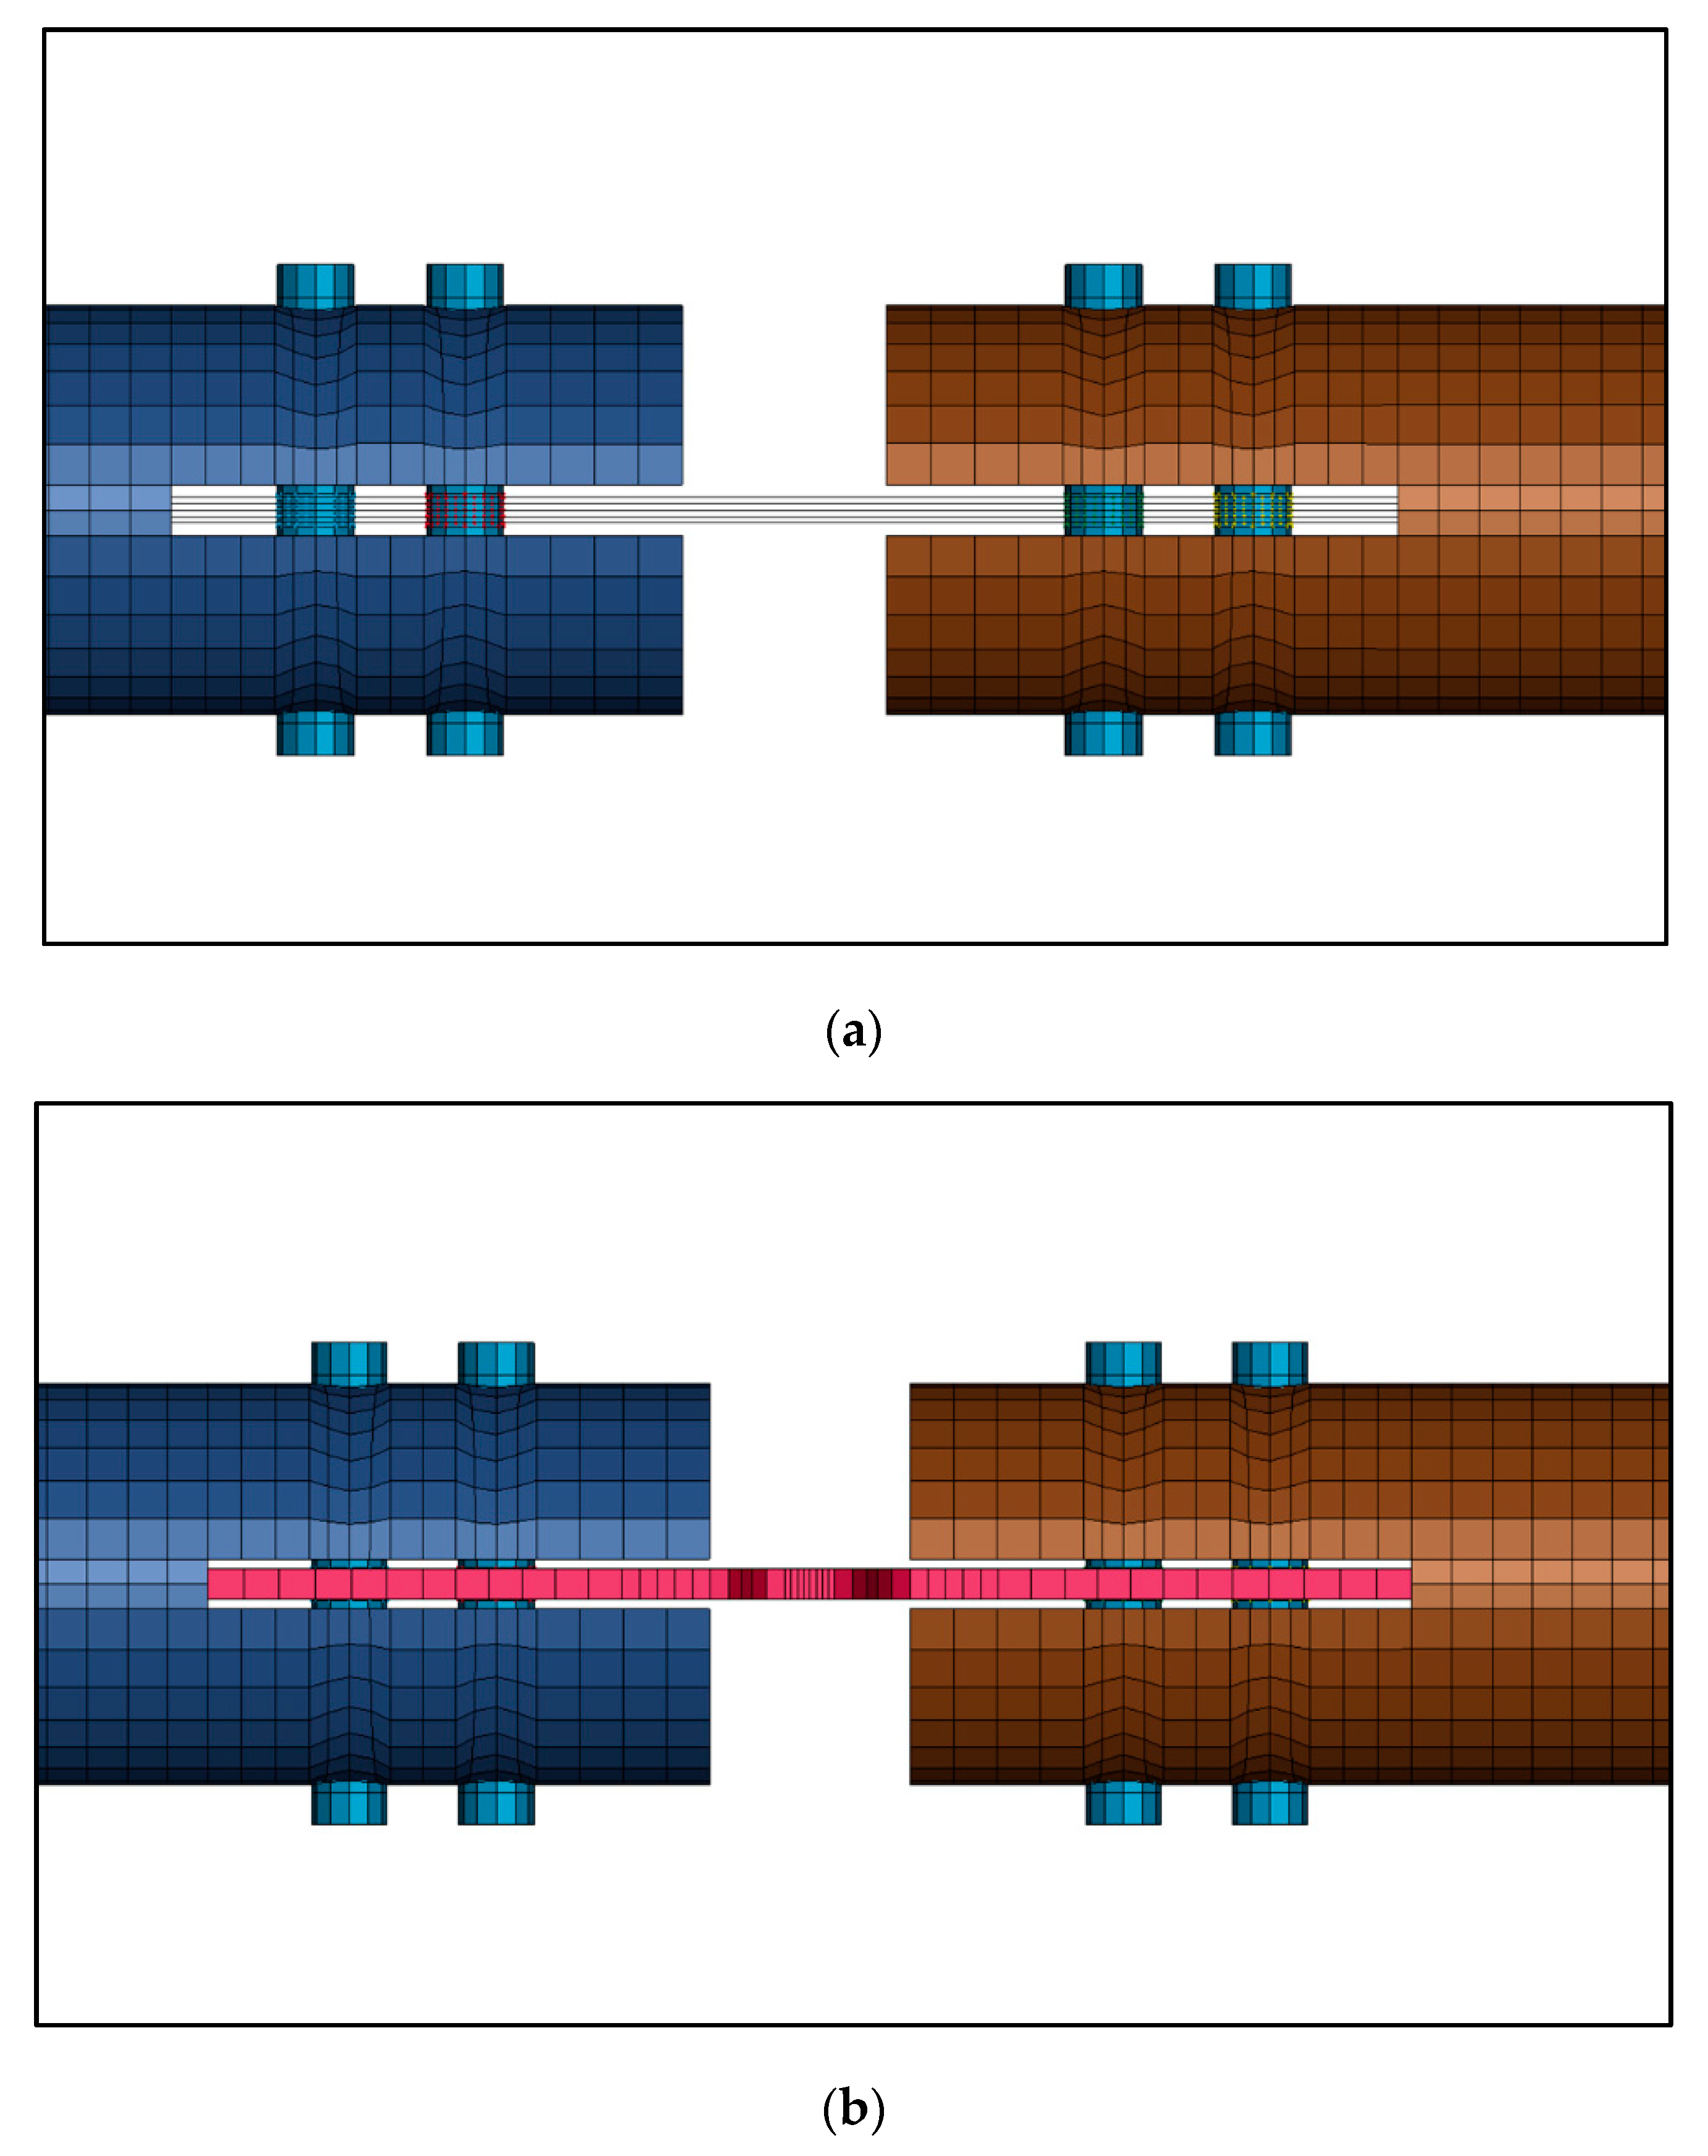
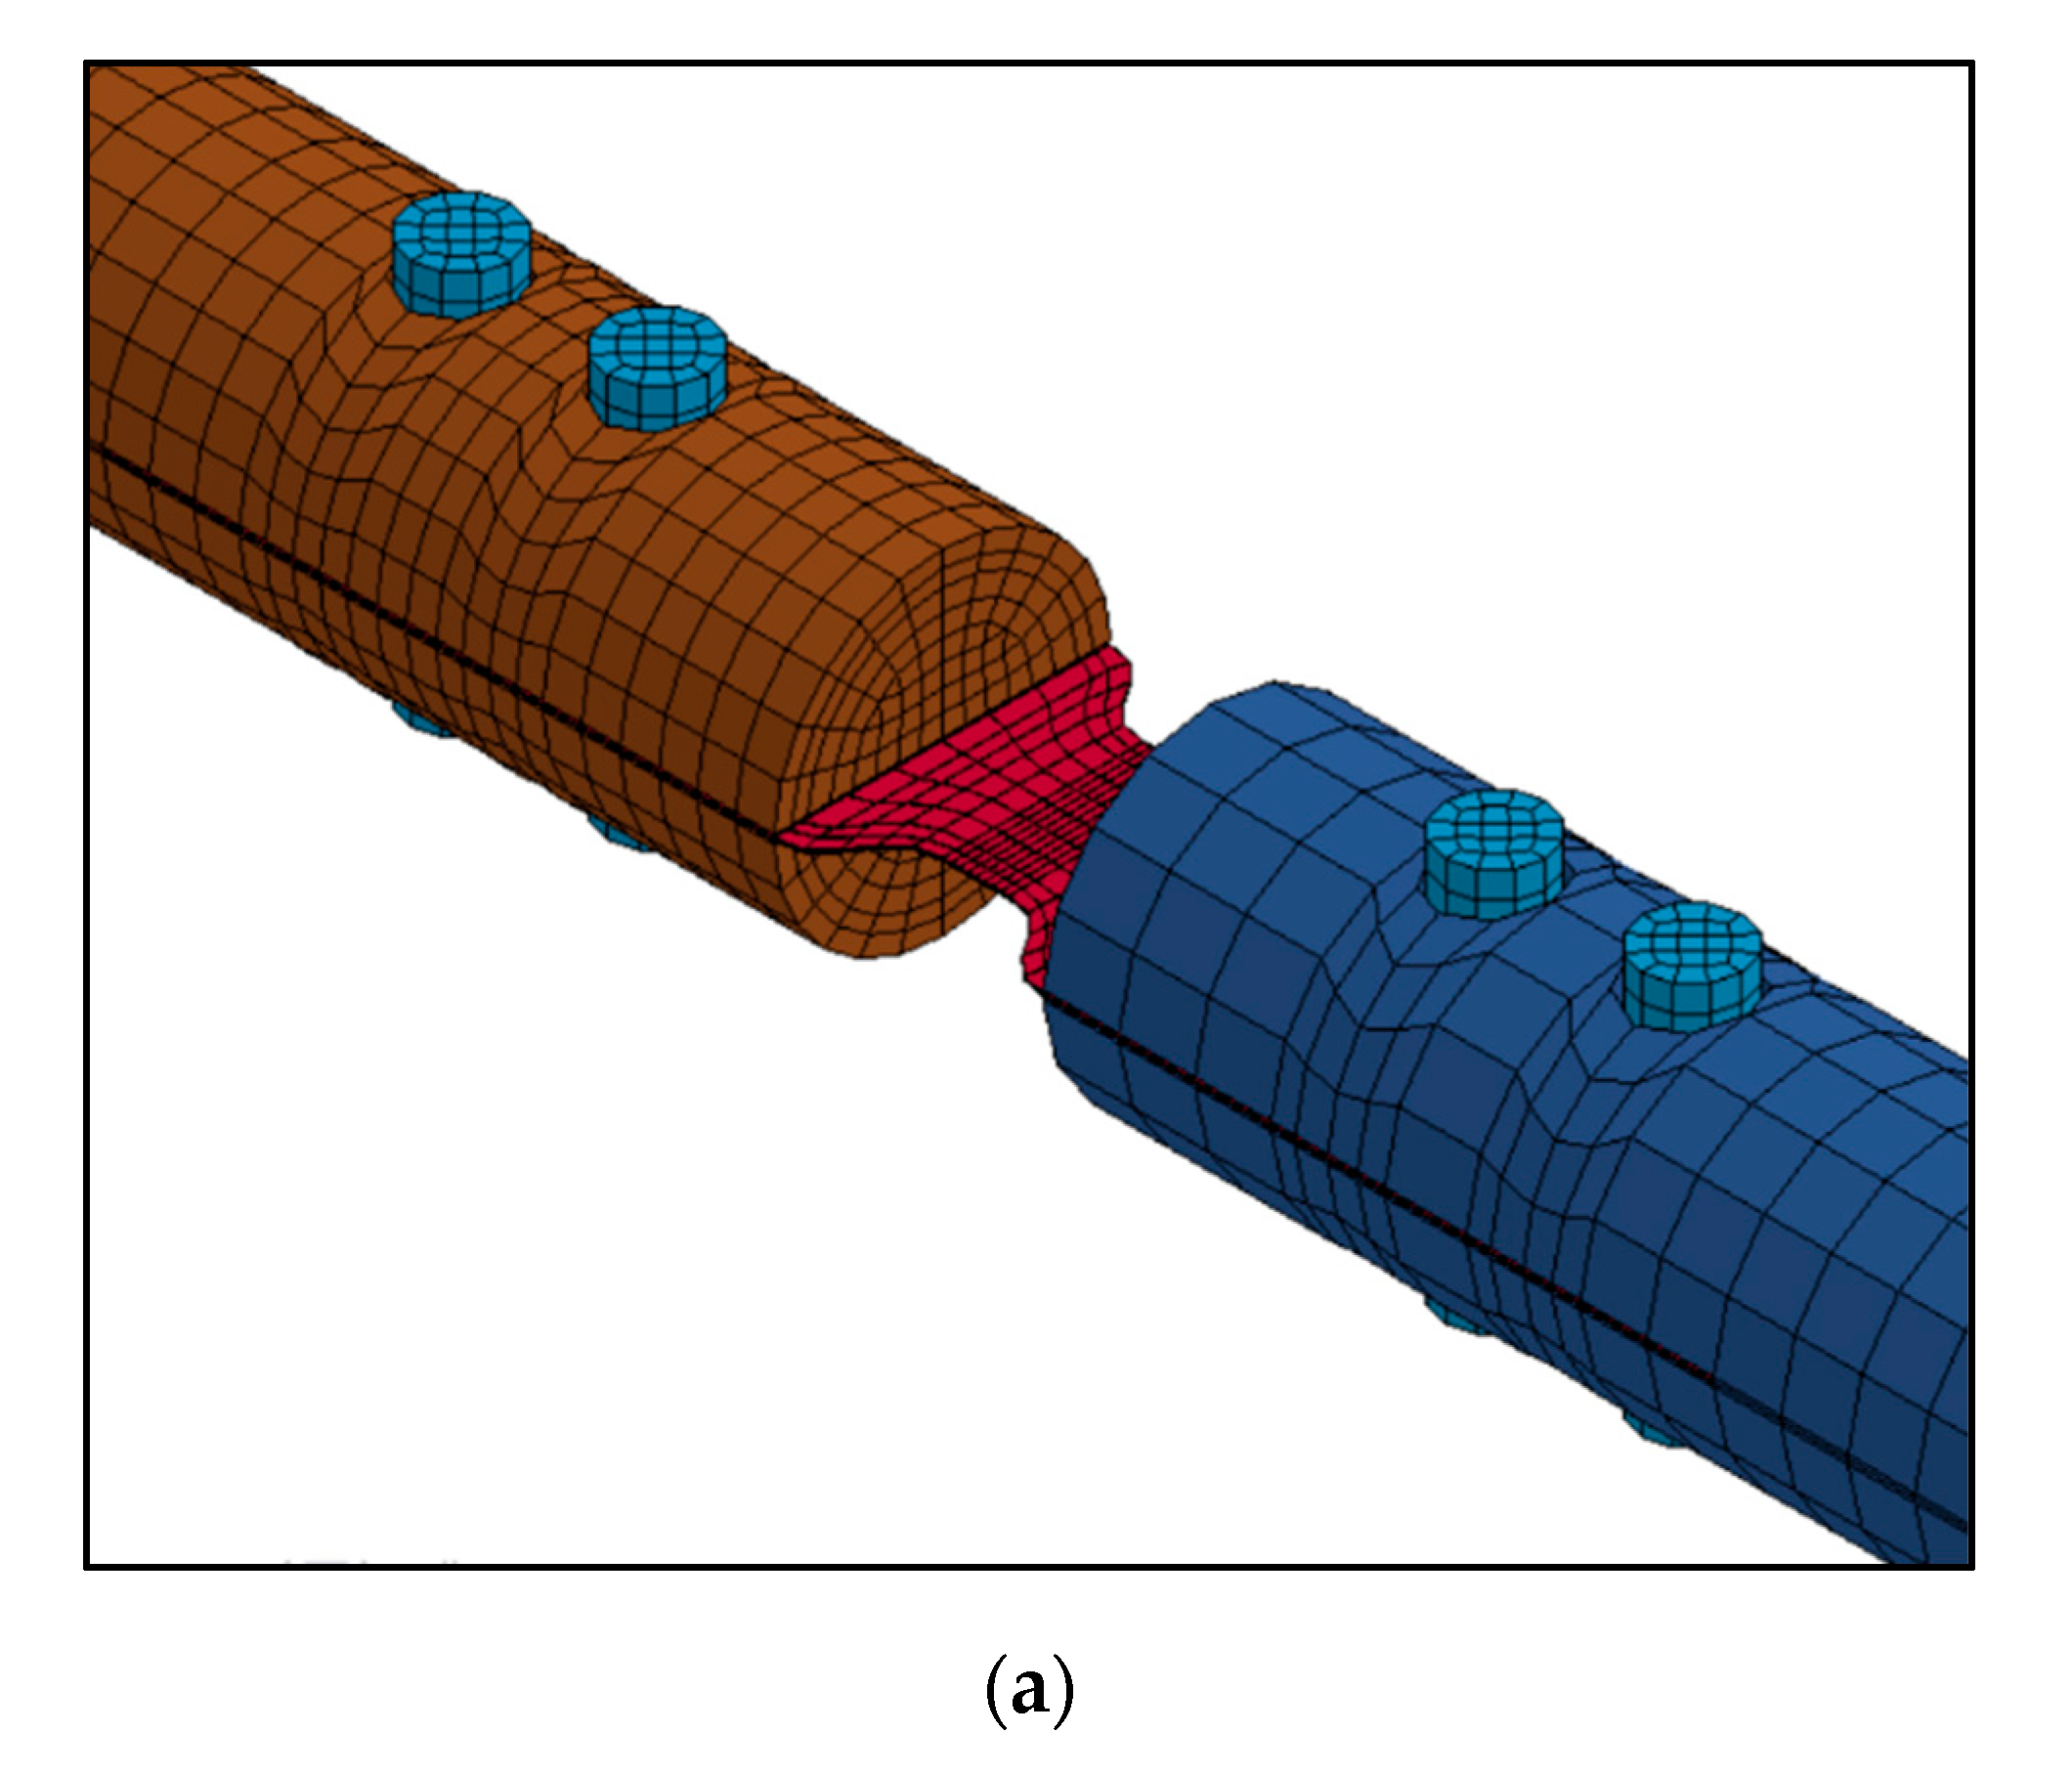
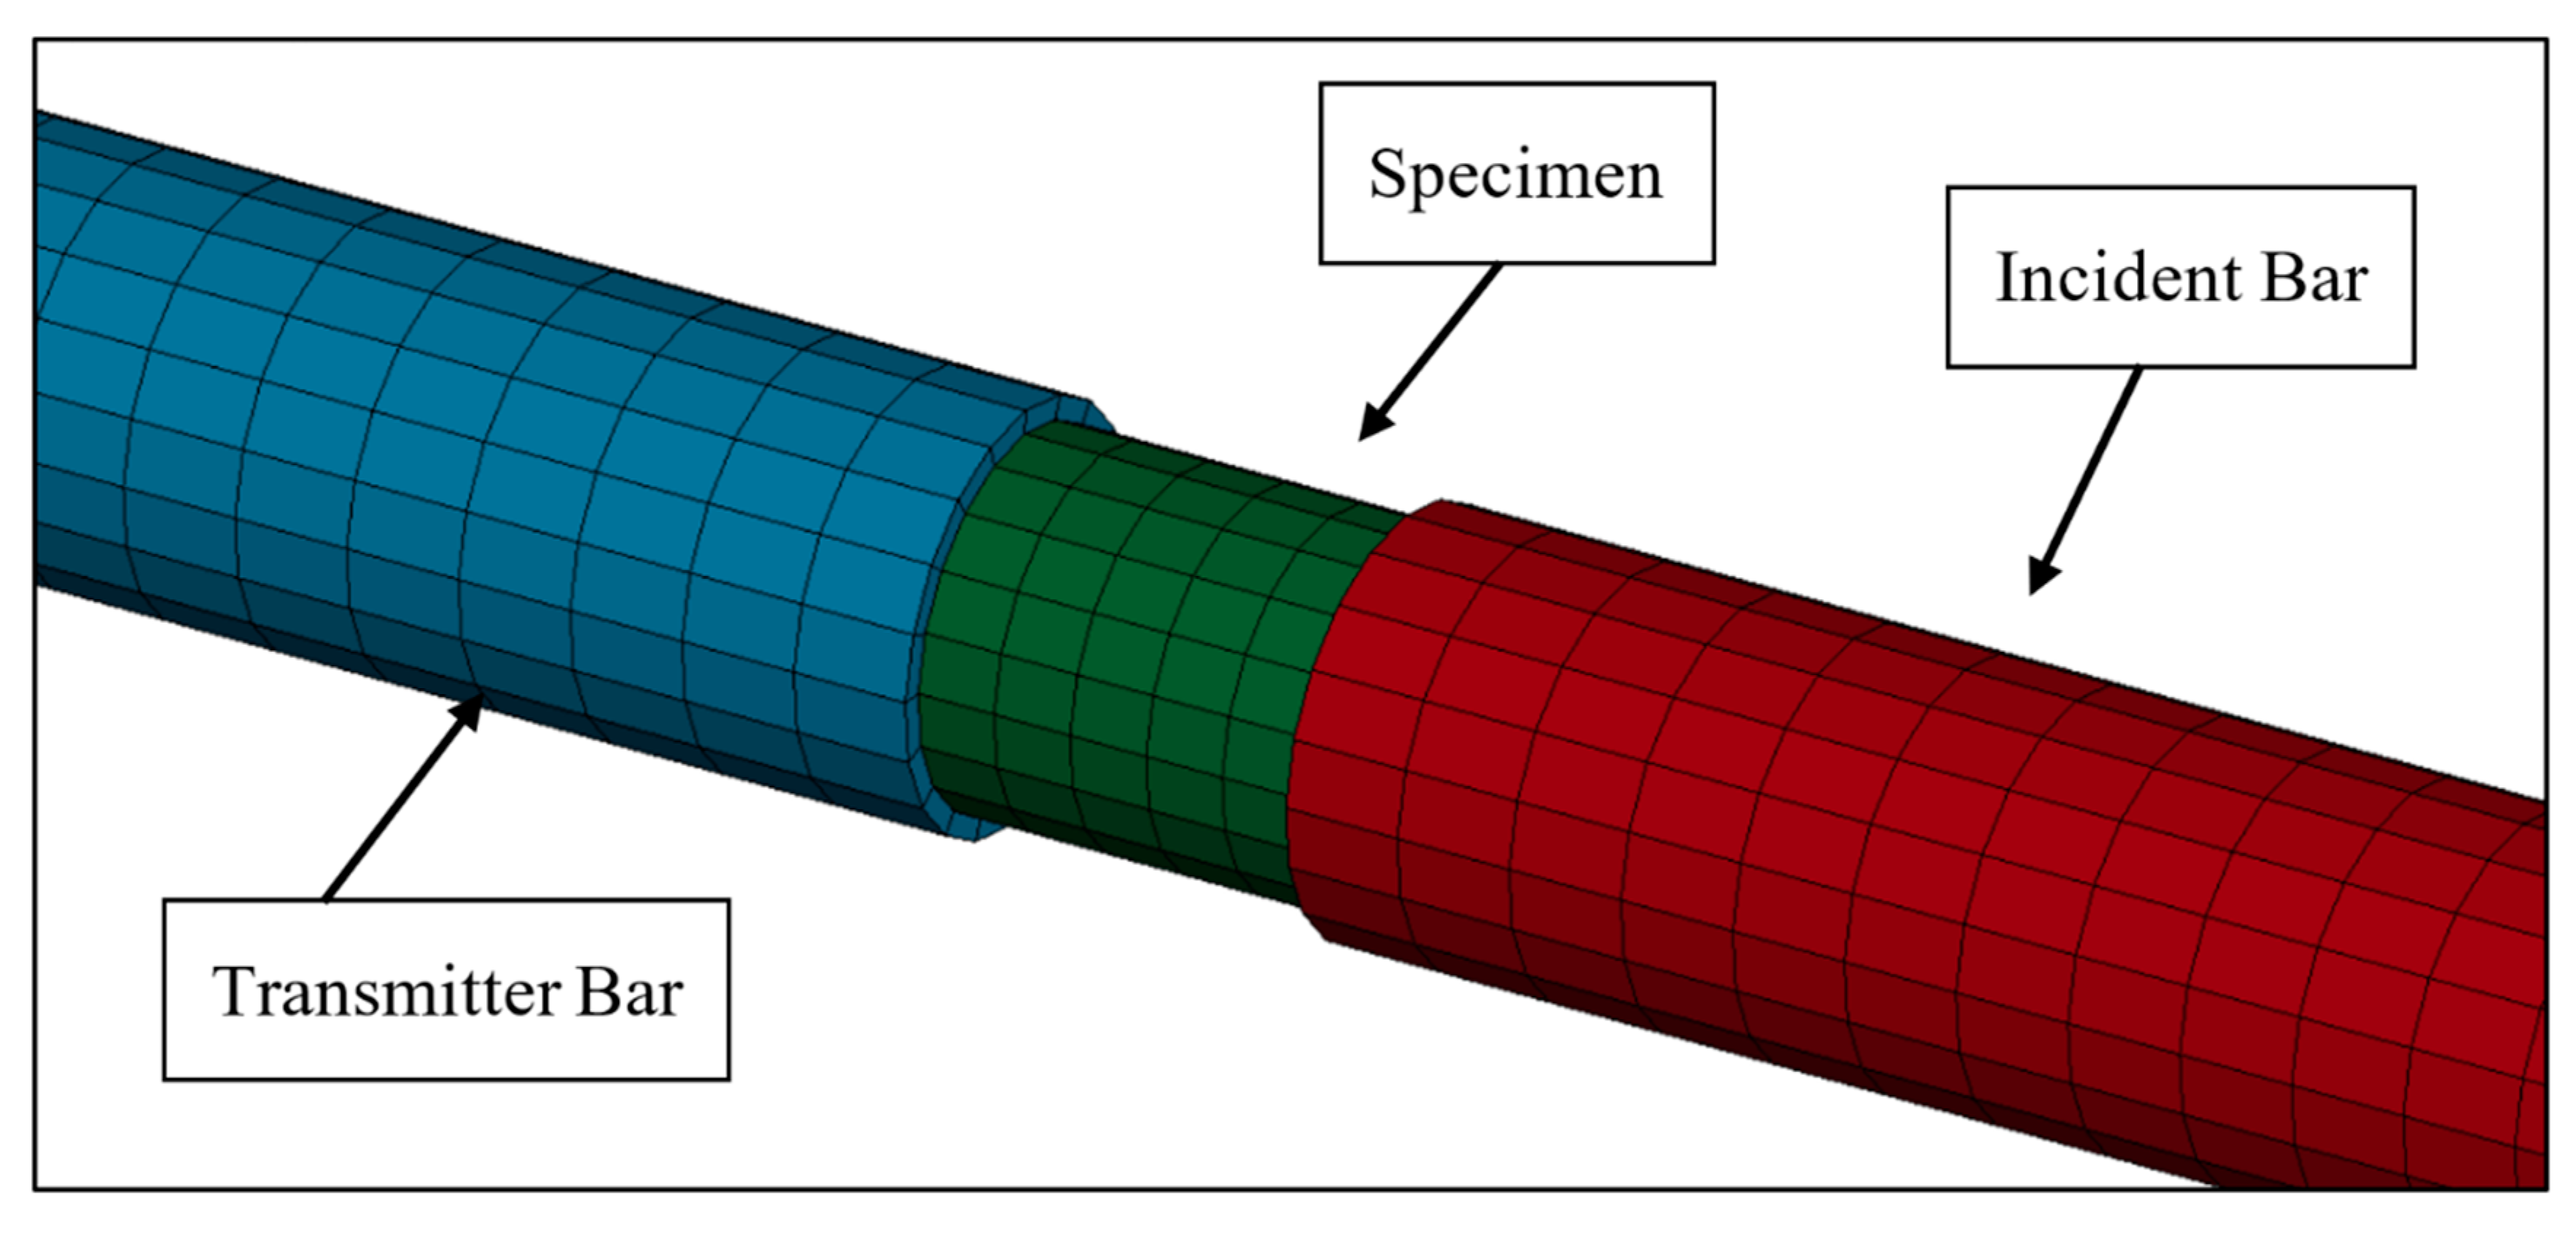
The SHTB main components are the incident bar, the transmitter bar, and the striker bar. Since the SHTB firing setup is dependent on the SHPB setup, added components and modifications are required. Conversion of the impact from the striker bar into a tensile loading on the incident bar can be done by modifying the striker bar to be hollow and designing it to glide on the surface of the incident. A momentum trap is added at the end of the incident bar to absorb the momentum from the striker bar and convert it into a tensile load. The setup for the hollow striker bar and the momentum trap is shown in
Figure 3. The incident and the transmitter bar are also modified so that the sheet or foil specimen could be held tightly on the bar. A grip opening and two bolts were added on each of the incident and transmitter bars, as shown in
Figure 3. The transmitter bar used for the aluminum and copper foil is modified, since the foil specimen produces low strain signals and requires additional amplification. The hollow section was added from the three centimeters of the front tip to the back tip of the transmitter bar, as shown in
Figure 4. The dimensions for the SHTB components are listed in
Table 2.
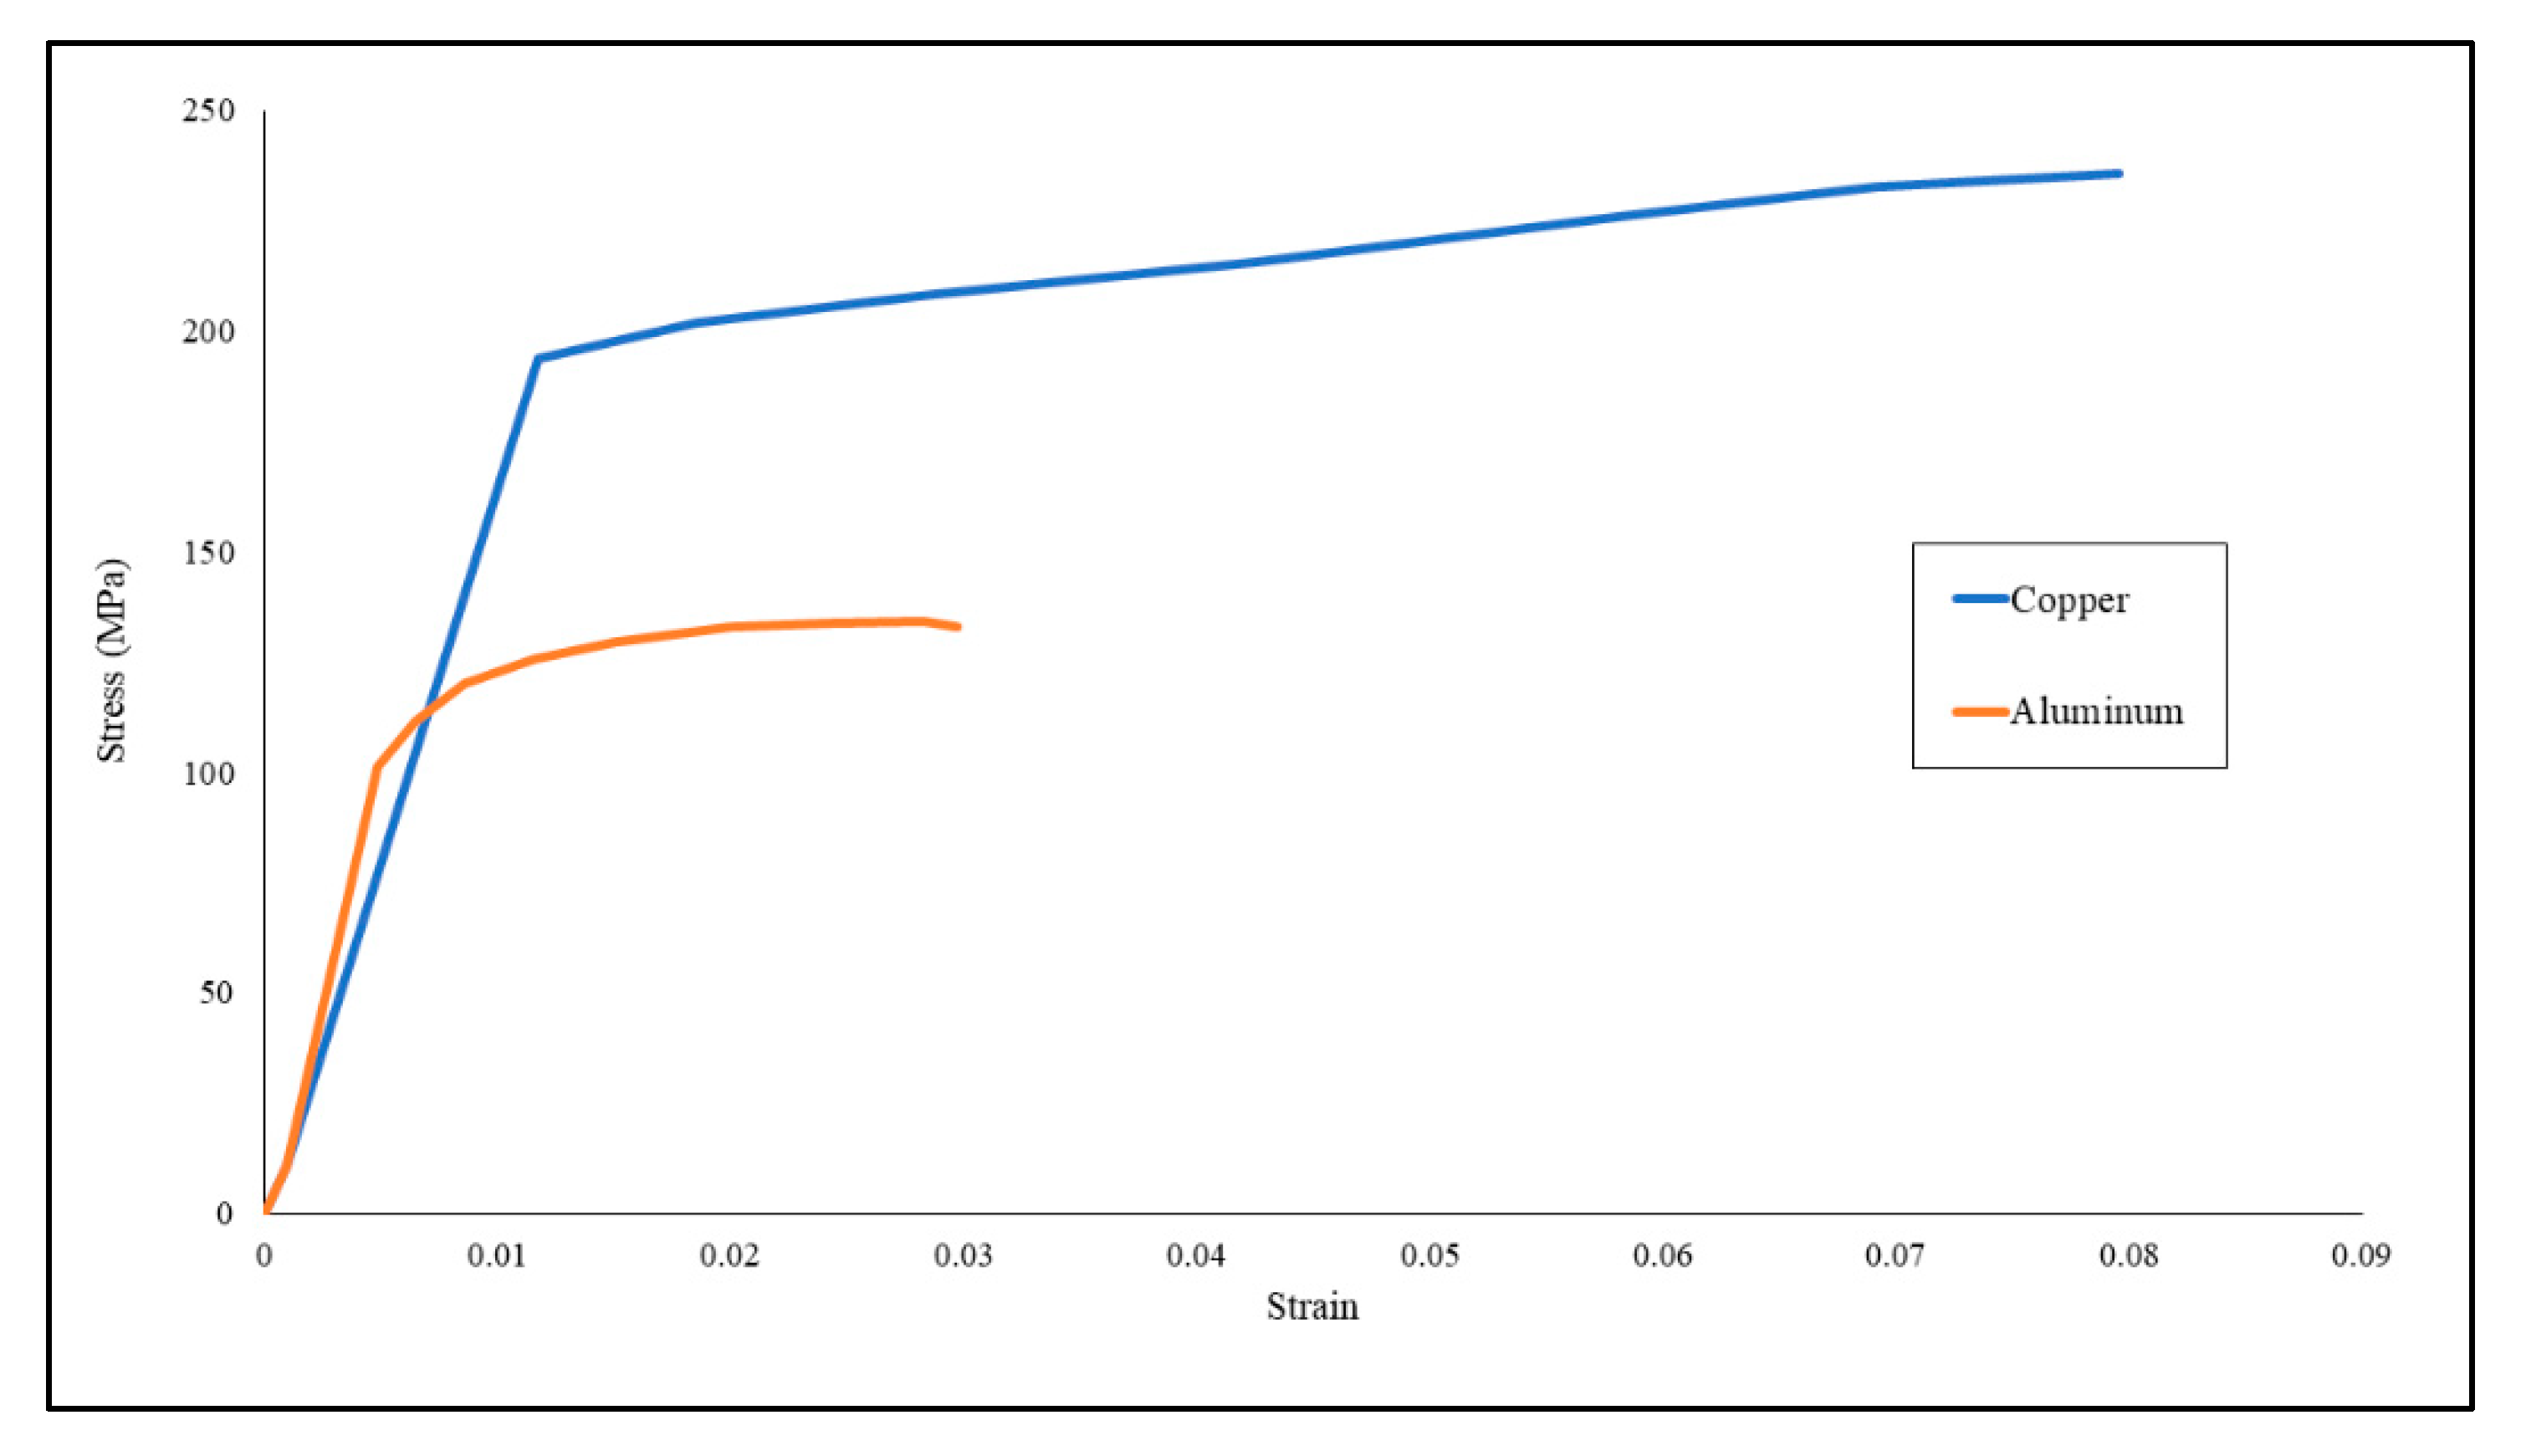
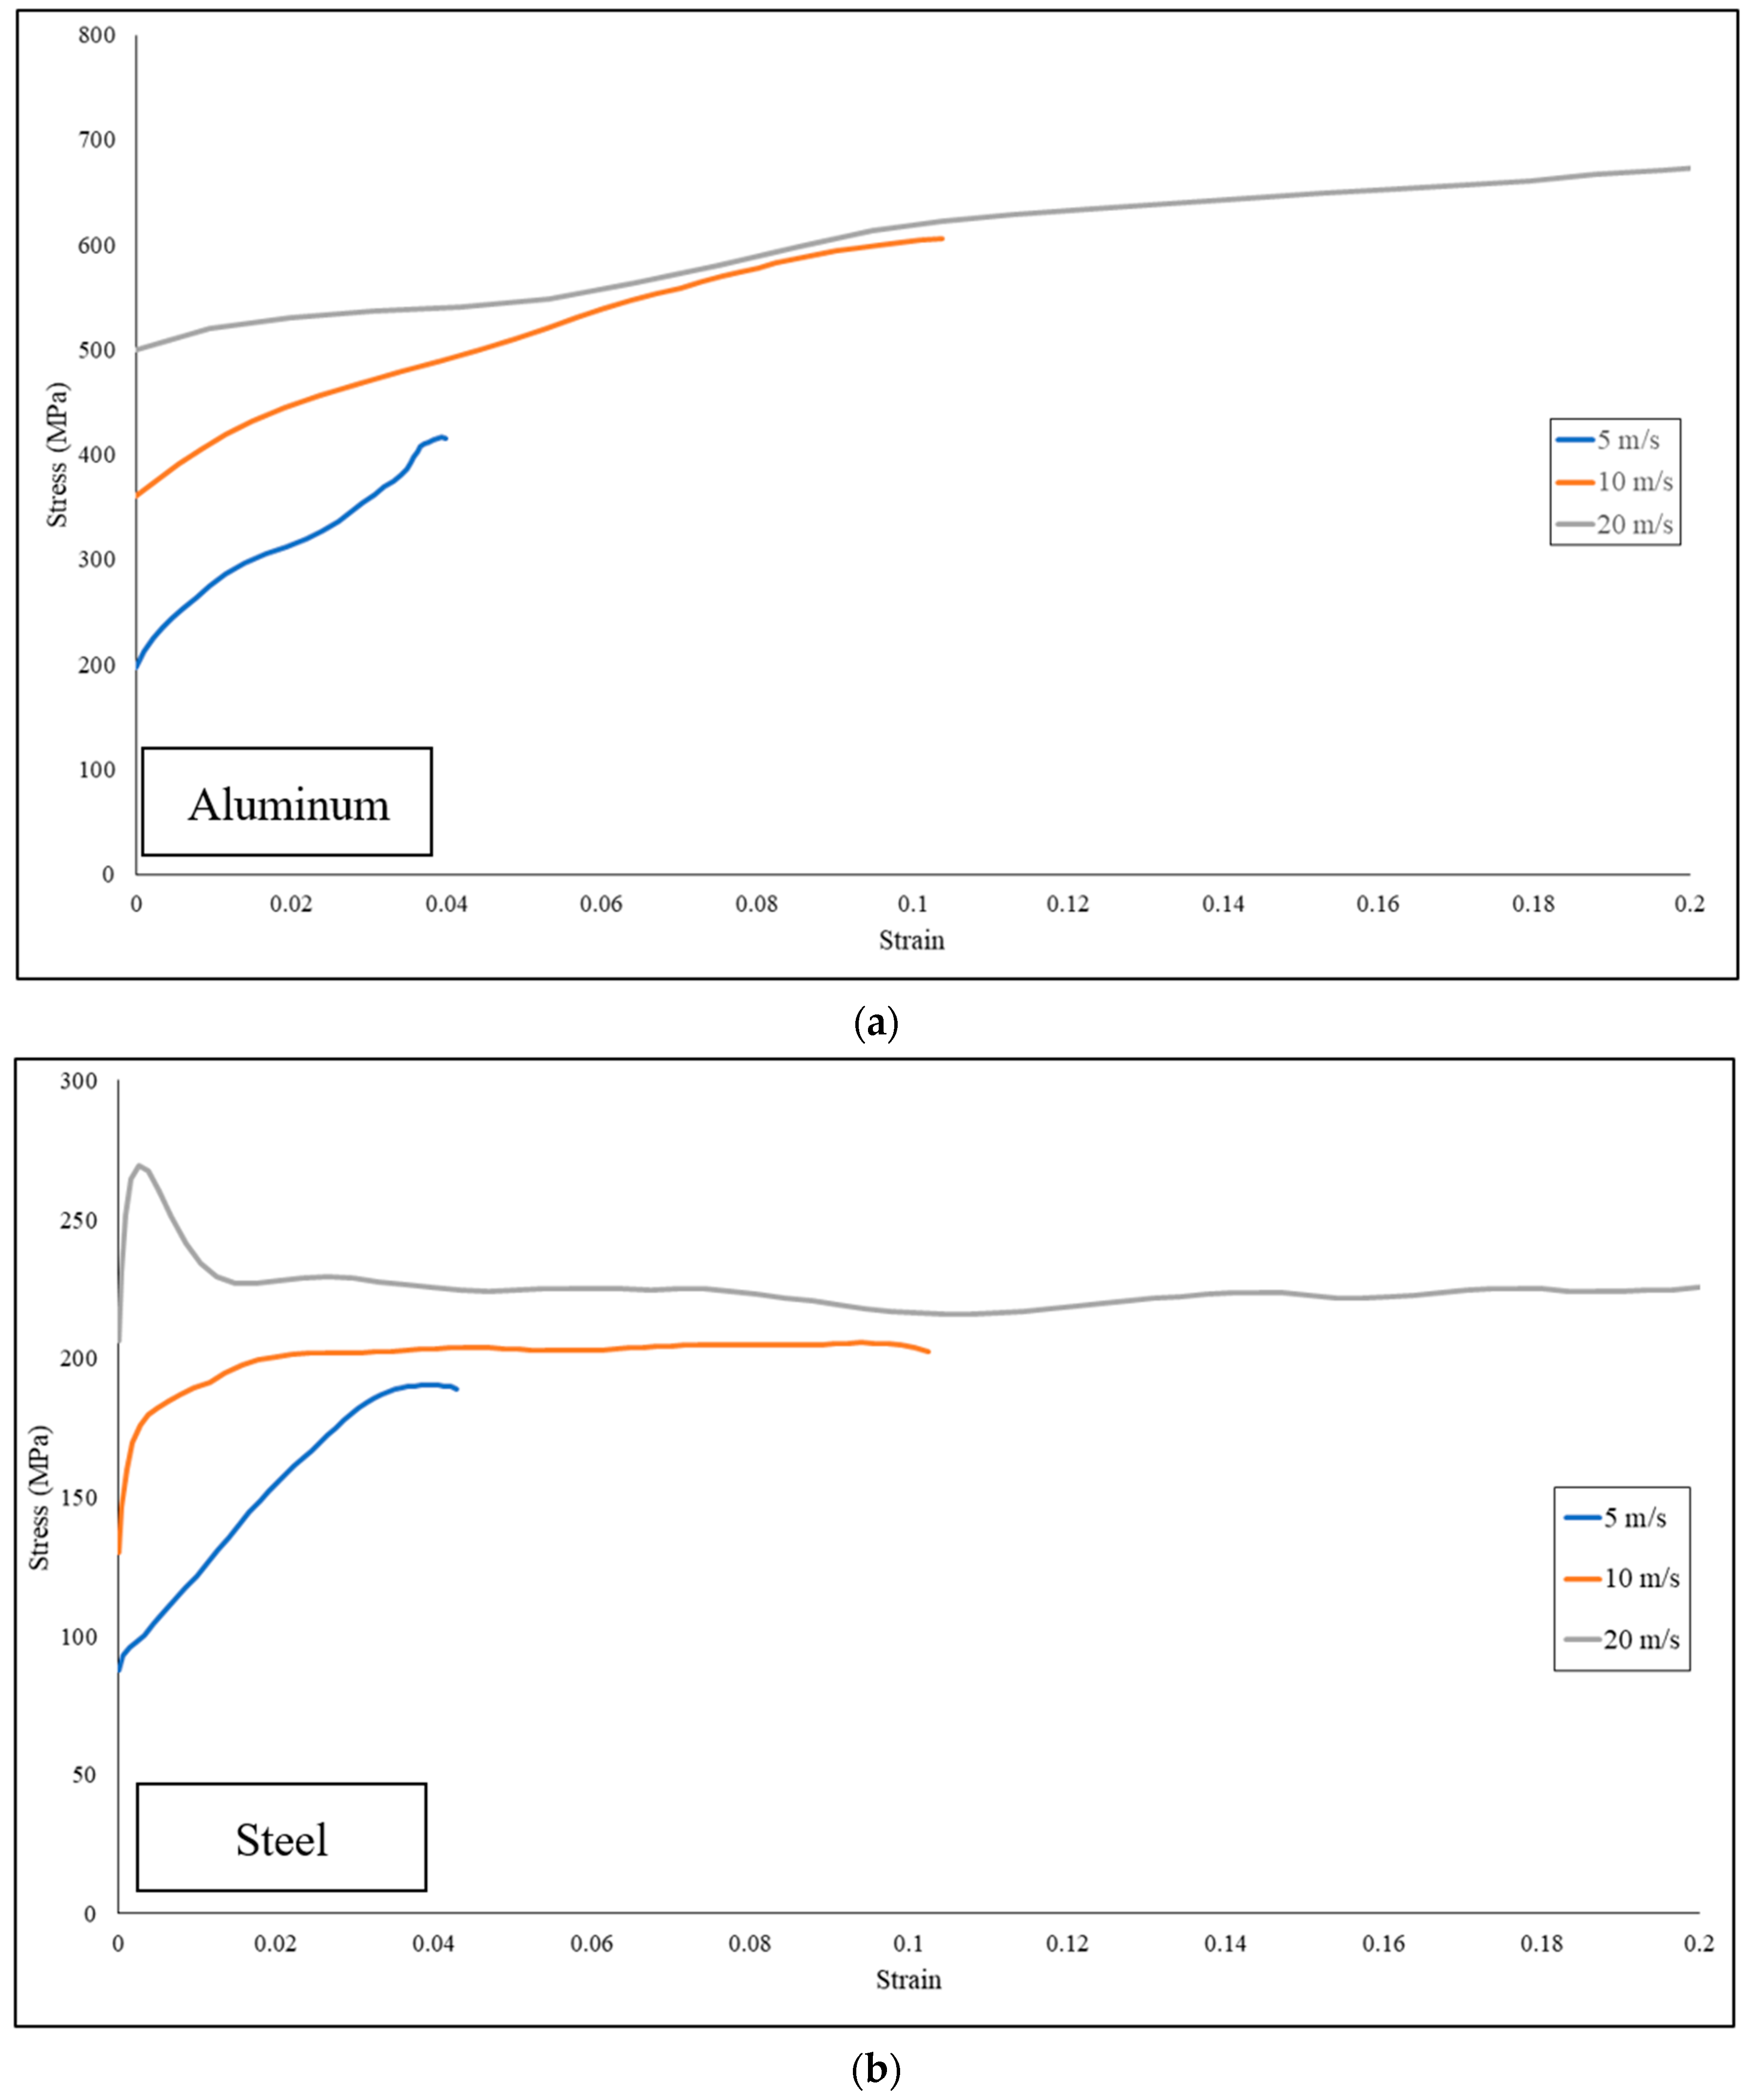
Three materials are simulated in this study, which are steel, aluminum, and copper. Steel is used for the casing of the battery, aluminum is used as the base metal of the cathode, and copper is used as the base metal of the anode. For the steel, the stress–strain curve used in the simulation can be seen in
Figure 5 with a Young modulus value of 200 GPa, a Poisson ratio value of 0.3, and a yield strength value of 450 MPa. For the aluminum, the corresponding stress–strain curve is plotted in
Figure 6 with a Young modulus value of 70 GPa, a Poisson ratio value of 0.33, and a yield strength value of 100 MPa. The stress–strain curve for the copper is shown in
Figure 6 with a Young modulus value of 110 GPa, a Poisson ratio value of 0.343, and a yield strength value of 190 MPa. These materials are modeled using the piecewise linear plasticity material model in LS-DYNA. For the aluminum and the copper, the effect of the strain rate was approximated using the Cowper–Symond constants listed in
Table 3.
The specimen is modeled with shell elements using the Belytschko–Tsay elements formulation with an average mesh size of 1.5 mm and 0.7 on the gage length area. The specimen is tied to the bolt using constant nodal rigid body, as shown in
Figure 7, to ensure no penetration of the bolt into the specimen during loading and to transmit the displacement from the bolt to the specimen. The specimen material is modeled as a piecewise linear plastic material with varying strain-rate or using Cowper–Symond constants.
Two parameters are simulated for the SHTB simulation: the effect of stacking and the effect of loading velocity. For the simulation of the stacking effect, the specimens are stacked on top of each other to amplify the transmitted signal. The number of stacked layers is varied at one, three, five, and seven stacks. The result of the stacking simulation was compared with the simulation using a single-layer specimen with a total thickness equivalent to the stacked specimens to check whether the stacking method might give a different strain reading or deviation from the single-layer specimen result. Stress variation due to the application of stacking is also observed to check whether the amount of stacking could alter the stress–strain result or not.
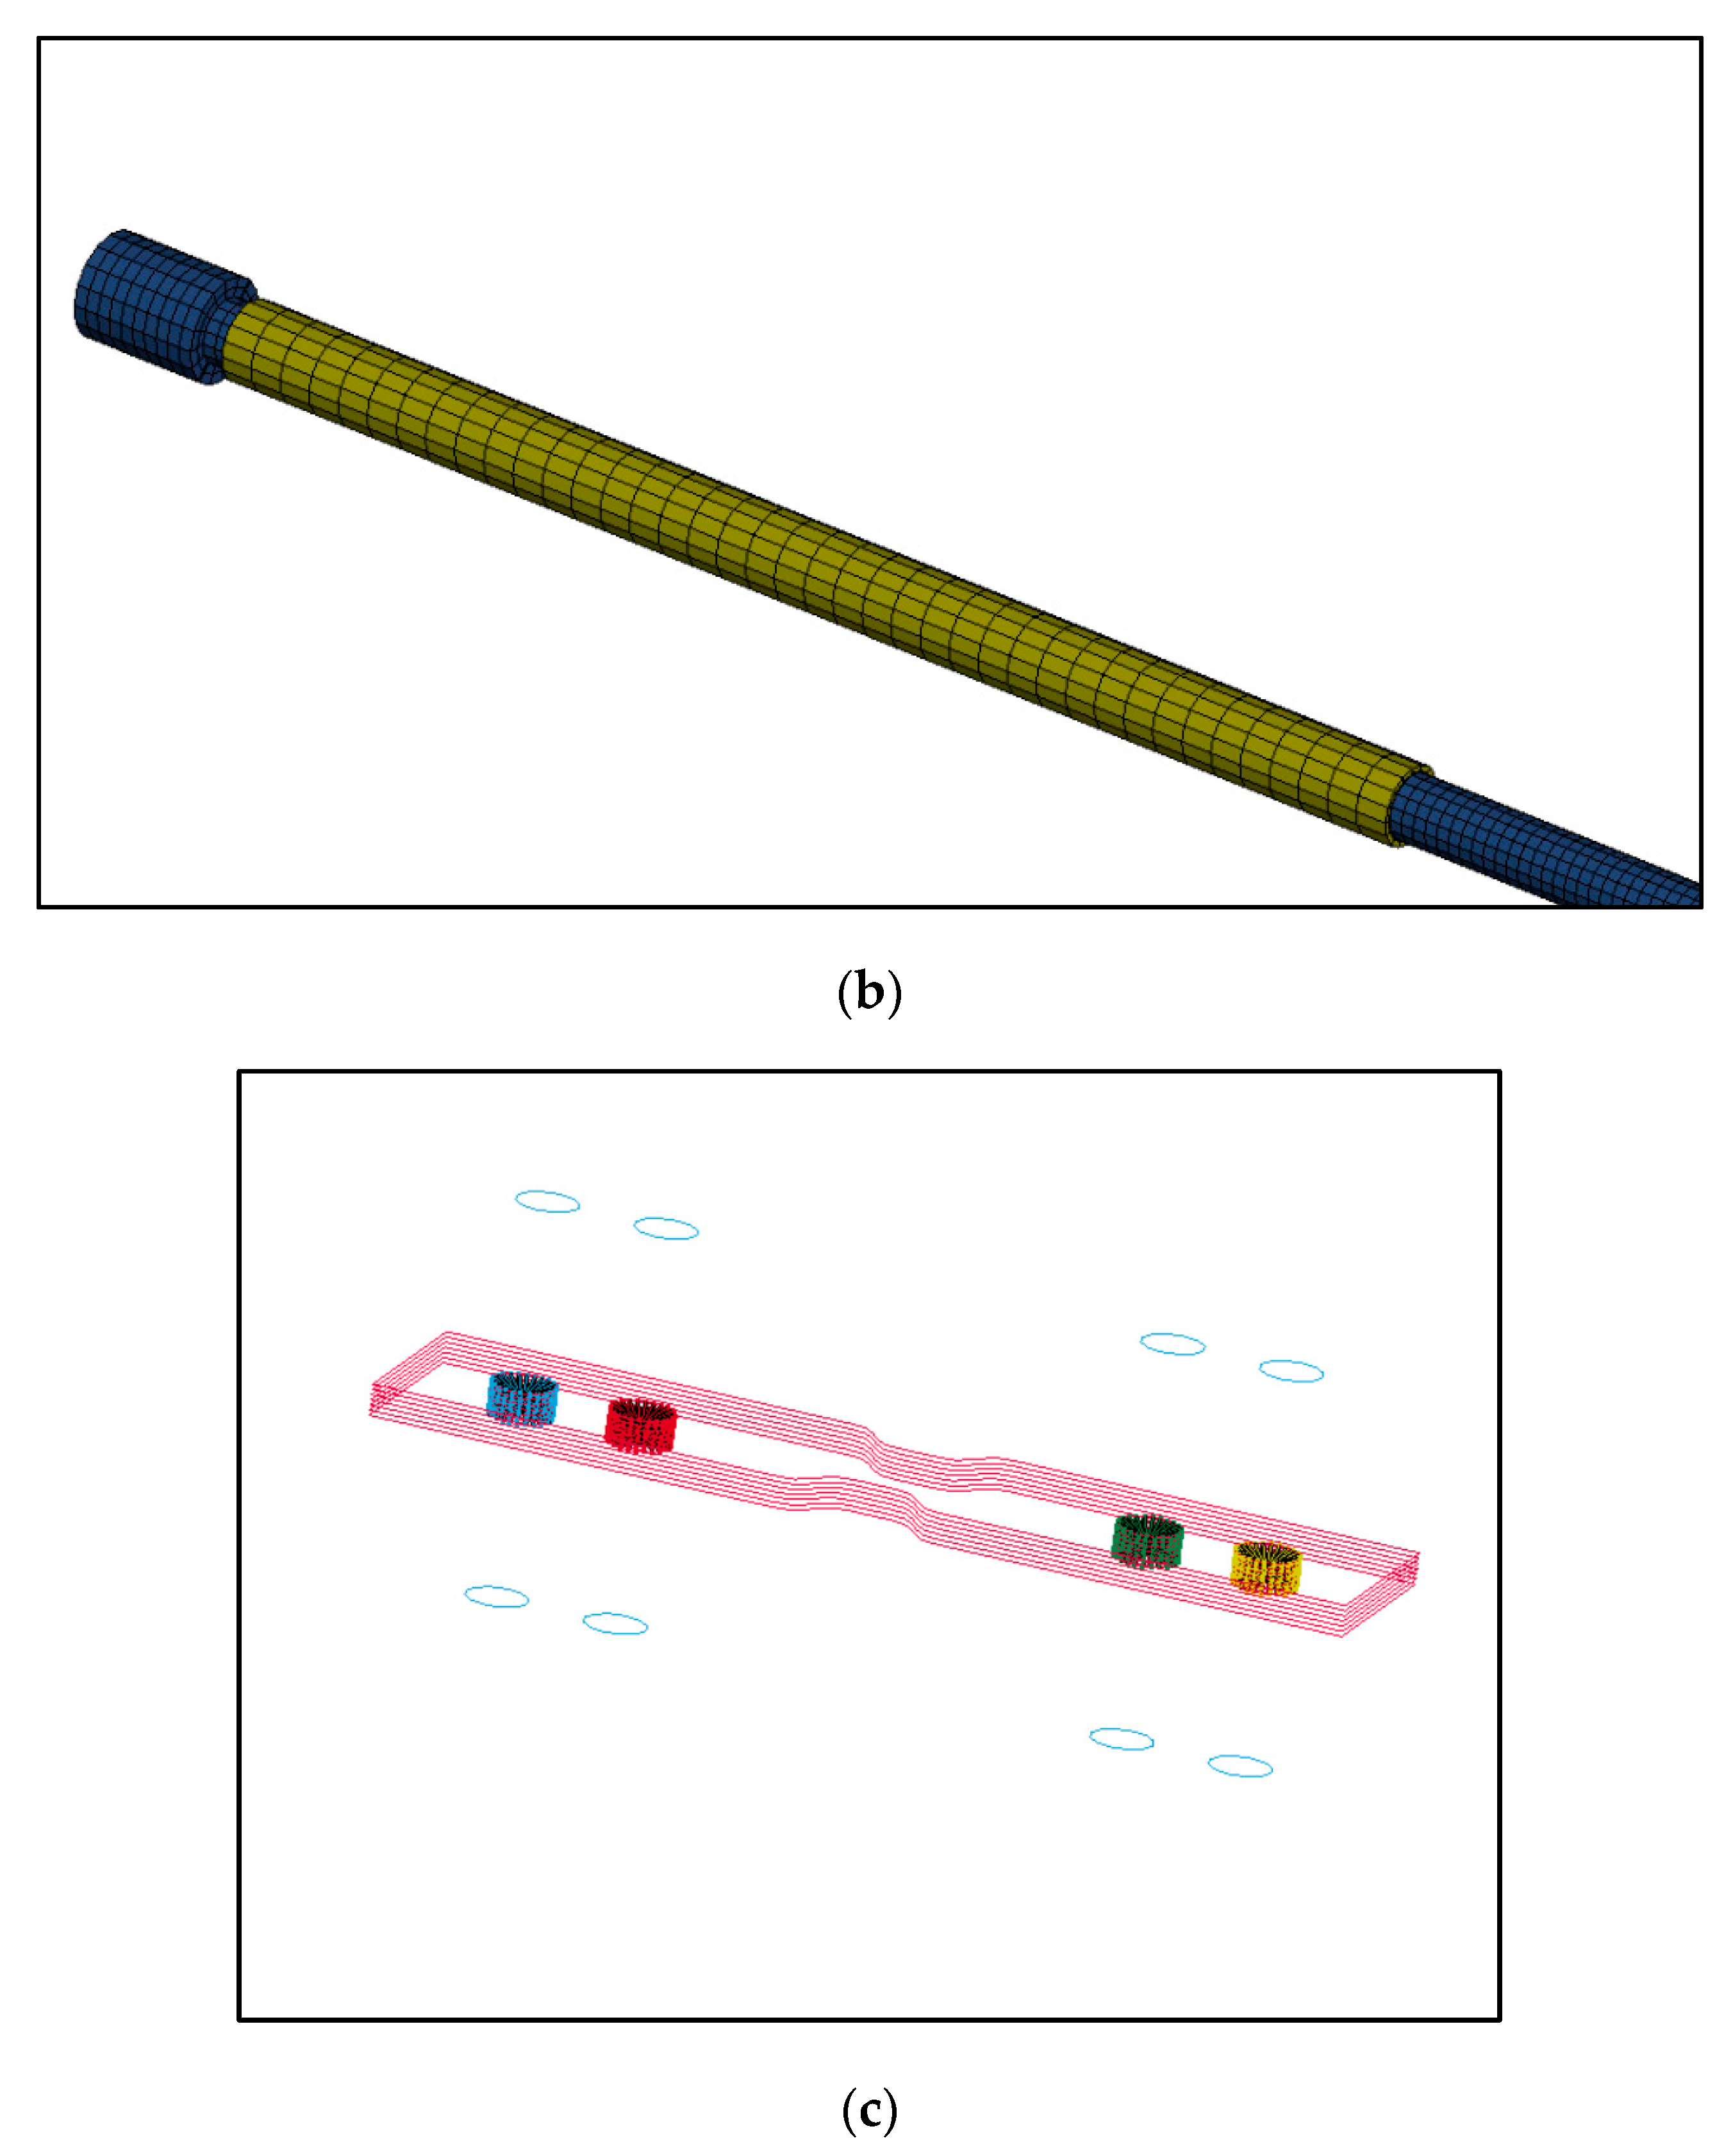
Figure 3 shows a model with stacked layers of specimens and the corresponding single-layer specimen with equivalent thickness.
The effect of loading velocity is studied by using models with the stacks that gave the highest signal response. The reasoning for picking models with the highest signal response is because the model with the lowest signal response would not be able to give adequate data to process, and the real experiment might not give an ideal result compared to the simulation result, since many factors could affect the measured strain. The stack of thin-foil material is simulated undergoing a tension with loading speed at 5 m/s, 10 m/s, and 20 m/s.
3.2. Dynamic Compression Test
The dynamic compression test simulation is performed using the SHPB setup to capture stress wave propagation on the incident bar and the transmitter bar. The simulation model is designed to replicate the testing condition; the impactor, the incident bar, and the transmitter bar were modeled in the simulation. The impactor, incident bar, and transmitter bar are constrained in the lateral direction of the bar length. Only movement in the longitudinal direction is allowed. The stress wave is generated by the impact between the impactor and the incident bar. The impact between those two bars is initiated by using the initial velocity card on the impactor. The initial impactor speeds were set at the values of 20 and 30 m/s.
The material used for the impactor, the incident bar, and the transmitter bar is PMMA. The material mechanical properties are listed in
Table 3. PMMA was chosen because PMMA is shown to have an approximately close impedance with the jellyroll compared to other materials such as AISI 4340 [
26]. The material data for the specimen are obtained from the SHPB testing of the dry jellyroll [
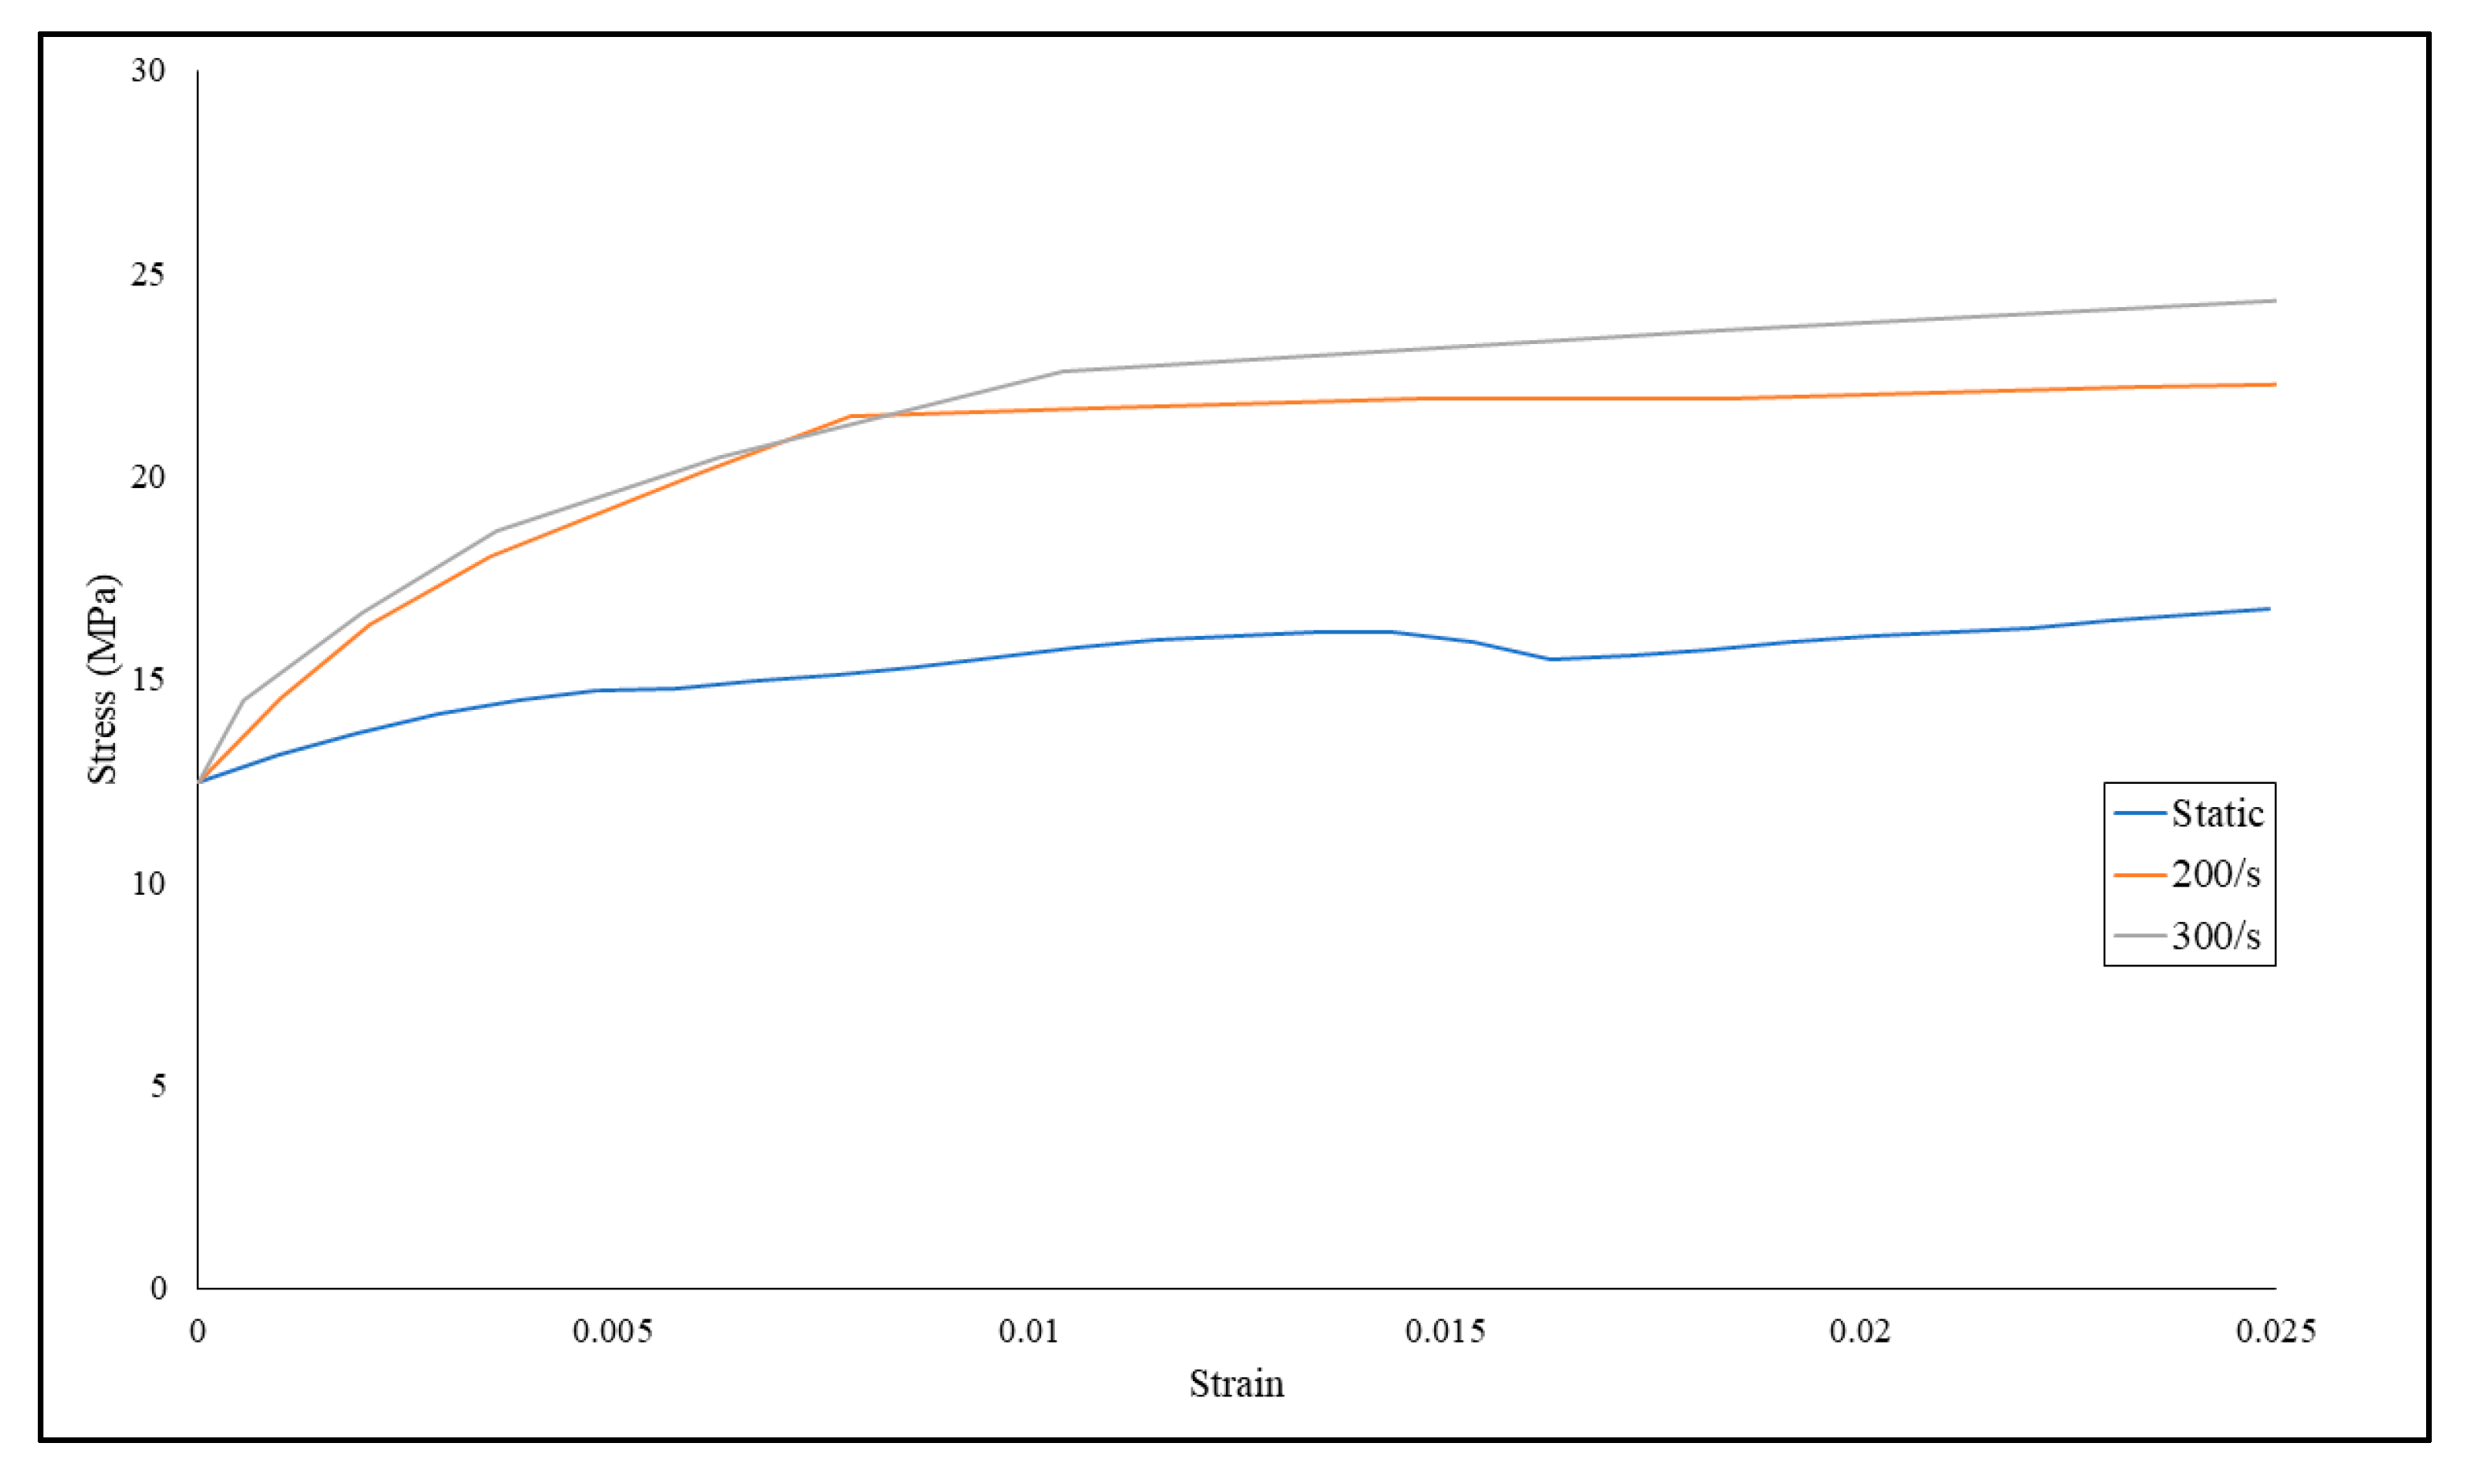
26]. The input for the stress–strain curve for the jellyroll is shown in
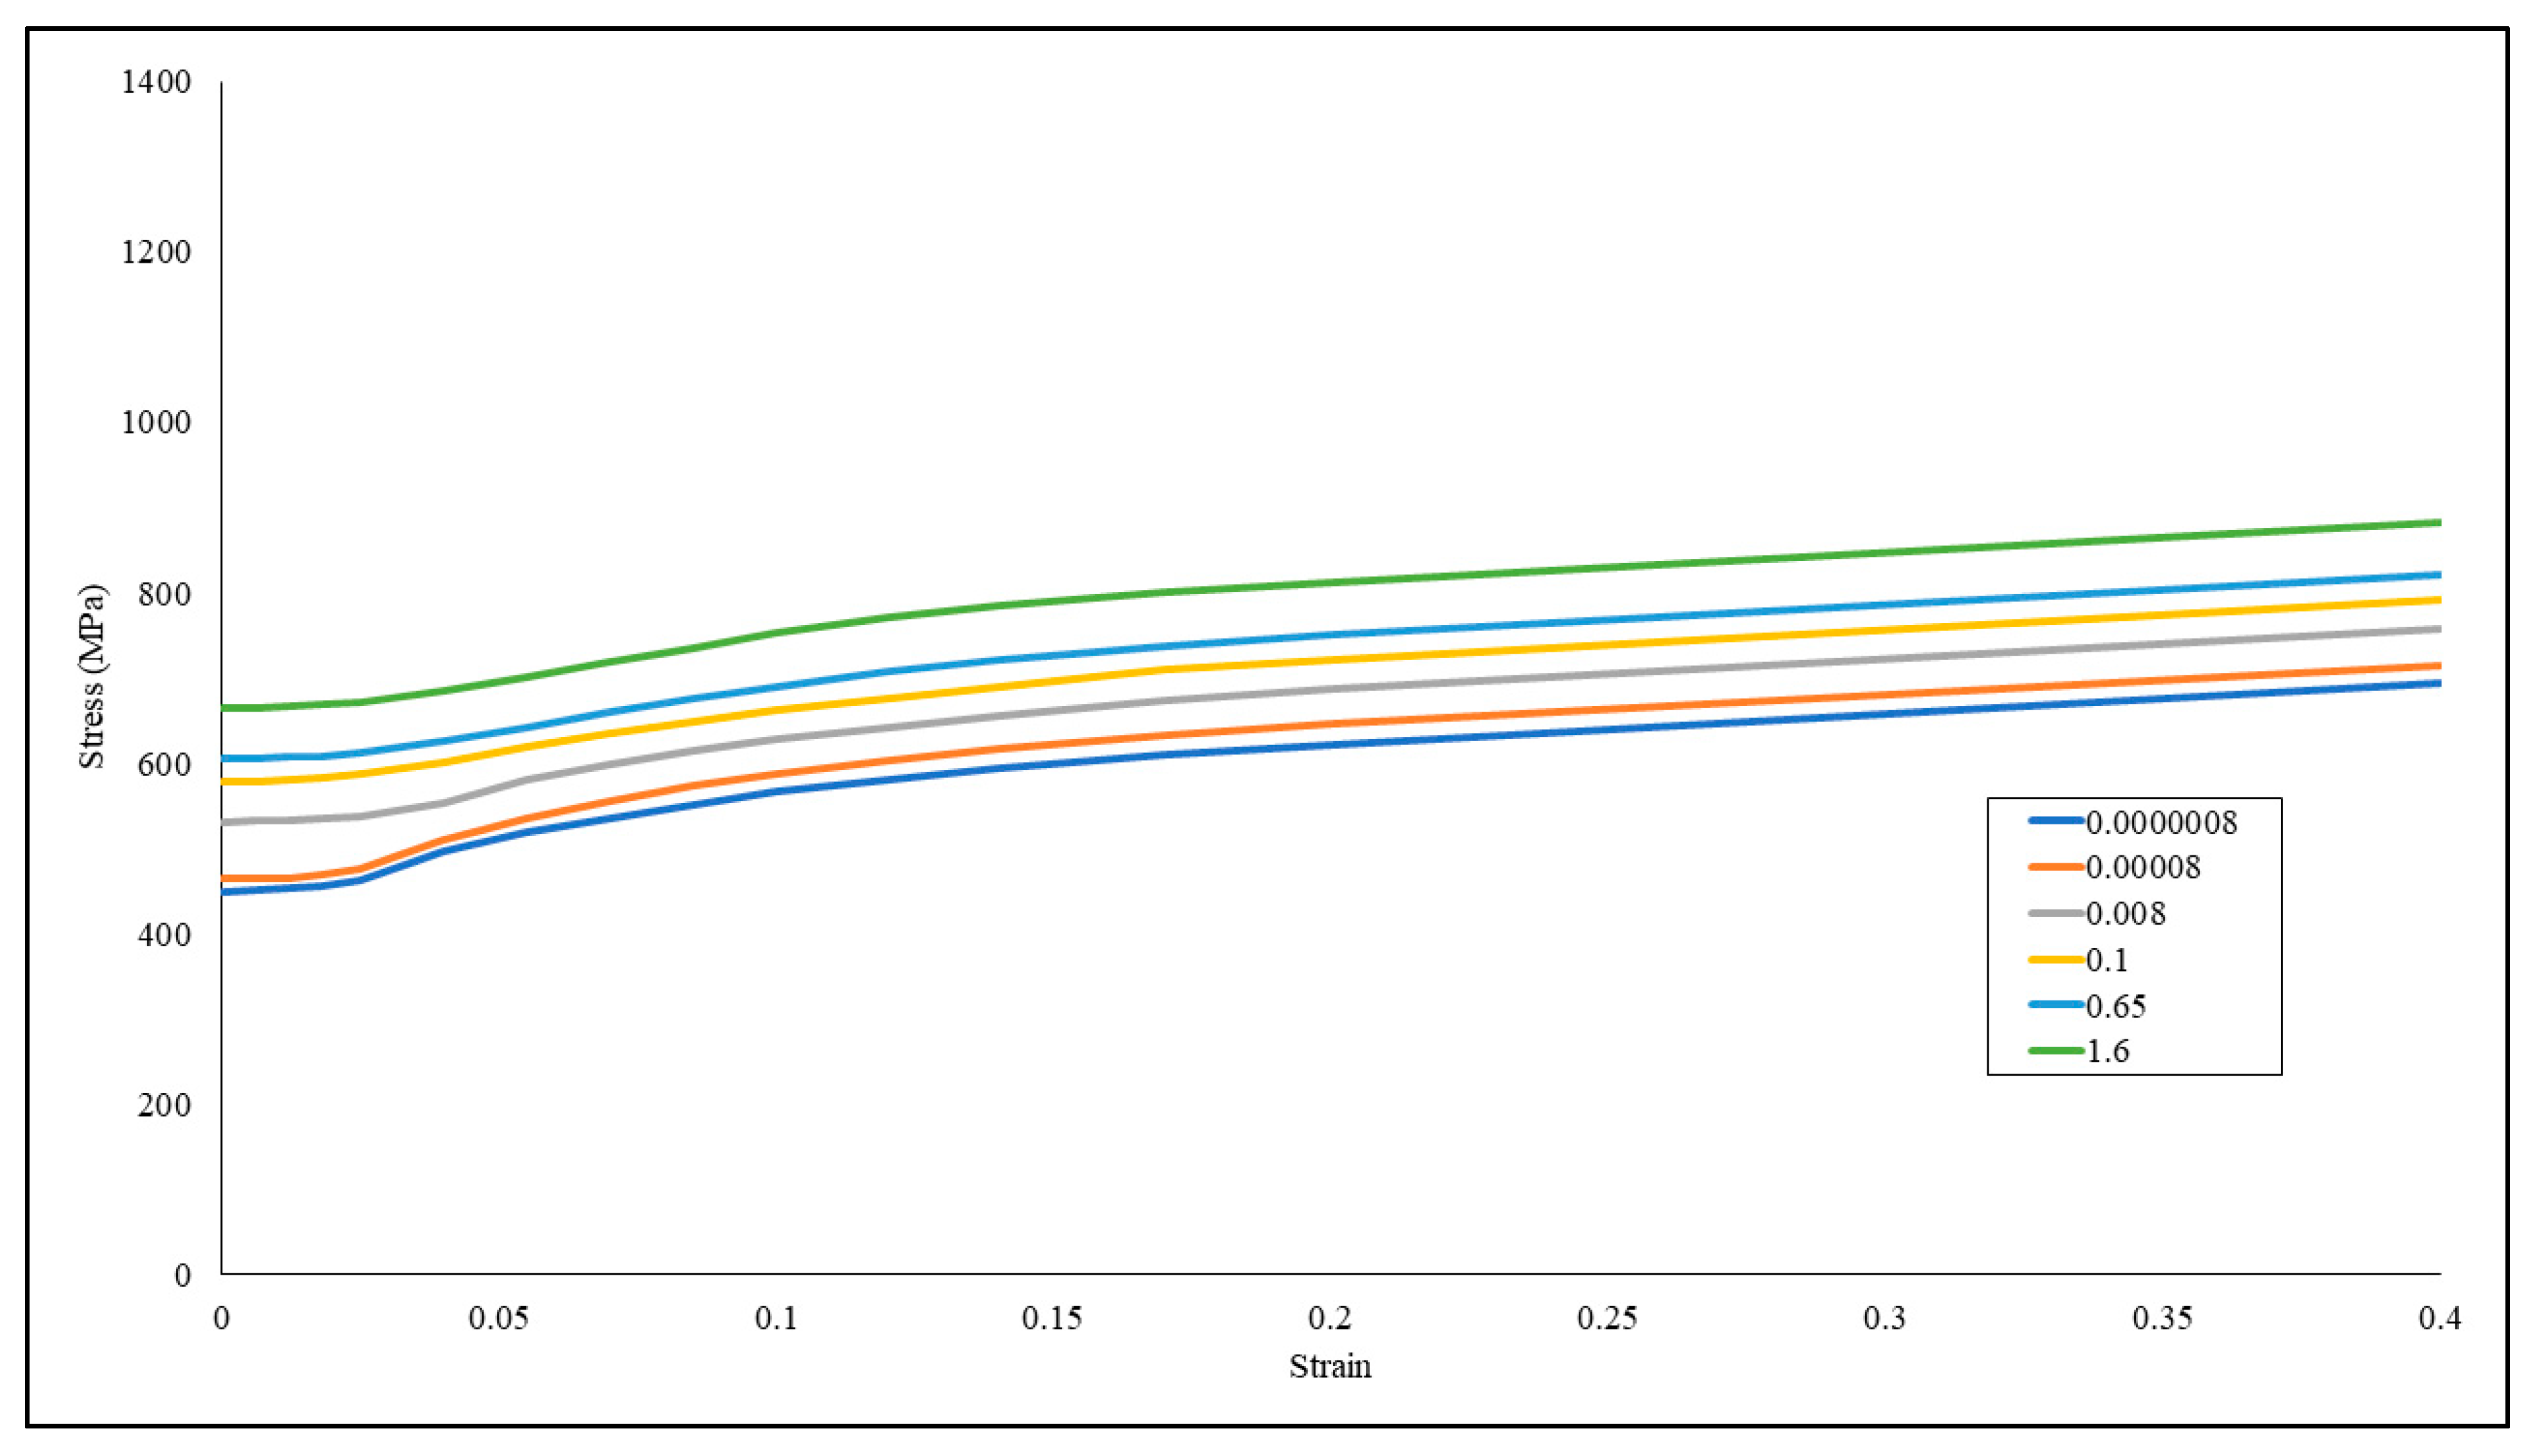
Figure 8. The dynamic stress–strain behavior of the jellyroll at the 200/s and 300/s strain rates are significantly increased compared to the static behavior. However, the result between the strain rate of 200/s and 300/s shows only a slight difference on the stress–strain behavior. The characteristics of the jellyroll might have reached a densification state at the strain rates of 200/s and 300/s, which explains similar jellyroll behavior. Therefore, at this densification state, the jellyroll stress–strain behavior at the strain rate of 200/s might have reached saturation, which leads to similar dynamic behavior at a higher strain such as at 300/s.
The specimen and the bars are modeled as a solid cylinder with an average mesh size of 6 mm for the bars and 3 mm for the specimen, as shown in
Figure 9. The dimension of the bars and the specimen are listed in
Table 4. The bars are modeled using material card MAT_ELASTIC. There are two material models considered for this study. Those material models are MAT_FU_CHANG and MAT_MODIFIED_CRUSHABLE_FOAM. The main reason why these two material models were considered was because both can accommodate the effect of strain rate, although there are several differences between those two material models. Modified crushable foam is the extended version of the crushable foam material model that is used to model isotropic foam with a low number of Poisson ratio with an added feature to interpolate the effect of strain rate from the input of several volumetric strain and stress curves at several strain rate values. Fu Chang foam is also used to model a foam with a low Poisson ratio. However, the input of the nominal stress–strain curve can be used in this material model. The shape of the unloading is controlled in several ways. Since the strain rate input is obtained from the table and the hysteretic unloading factor is set so that the unloading curve does not follow the pattern of the curve of the lowest strain rate, the unloading curve is determined using Equations (6) and (7) where σ is the principal stress, d is the damage parameter, HU is the hysteretic unloading unit, S is the shape factor for unloading, and W corresponds to the hyperelastic energy per unit undeformed volume, which can be useful to model the effect of unloading after the foam is compressed dynamically [
27]. The input parameters for the modified crushable foam and Fu Chang foam are listed in
Table 5.
3.3. Axial Impact Test Simulation
A homogenized model of an 18650 NCA Li-ion battery is developed using the jellyroll model data used in the SHPB dynamic compression simulation. The casing has a diameter of 18 mm, and the jellyroll has a diameter of 17.5 mm. The average mesh size of the casing is 1.1 mm, and the average mesh size of the jellyroll is 1.2 mm. A gap must be introduced since the shell has a thickness of 0.25 mm and to avoid penetration between the casing and the jellyroll. The impactor shown in
Figure 10 has a width and length of 40 mm and a thickness of 2 mm. The weight of the impactor was set to be 5 kg.
The shell casing was modeled using fully integrated shell formulation, the jellyroll was modeled using fully integrated solid element formulation, and the impactor was modeled using constant stress element formulation. The material used for the casing was similar to the steel specimen used in the SHTB simulation, the material used for the jellyroll was Fu-Chang foam, for reasons that will be explained in the result section, and the material model used for the impactor was MAT_RIGID with a Young modulus of 200 GPa and a Poisson ratio of 0.32. The bottom of the casing and the jellyroll were constrained so that the casing and the jellyroll would not move during the impact.
The reaction force between the impactor, the jellyroll, and the casing set part is combined with the displacement of the impactor to obtain the force–displacement curve. Then, the obtained result is further calculated to obtain a mean crushing force curve. The difference between the result of simulation with different impact speeds will be shown and analyzed.
4. Result
4.1. Dynamic Tensile Test Simulation Result
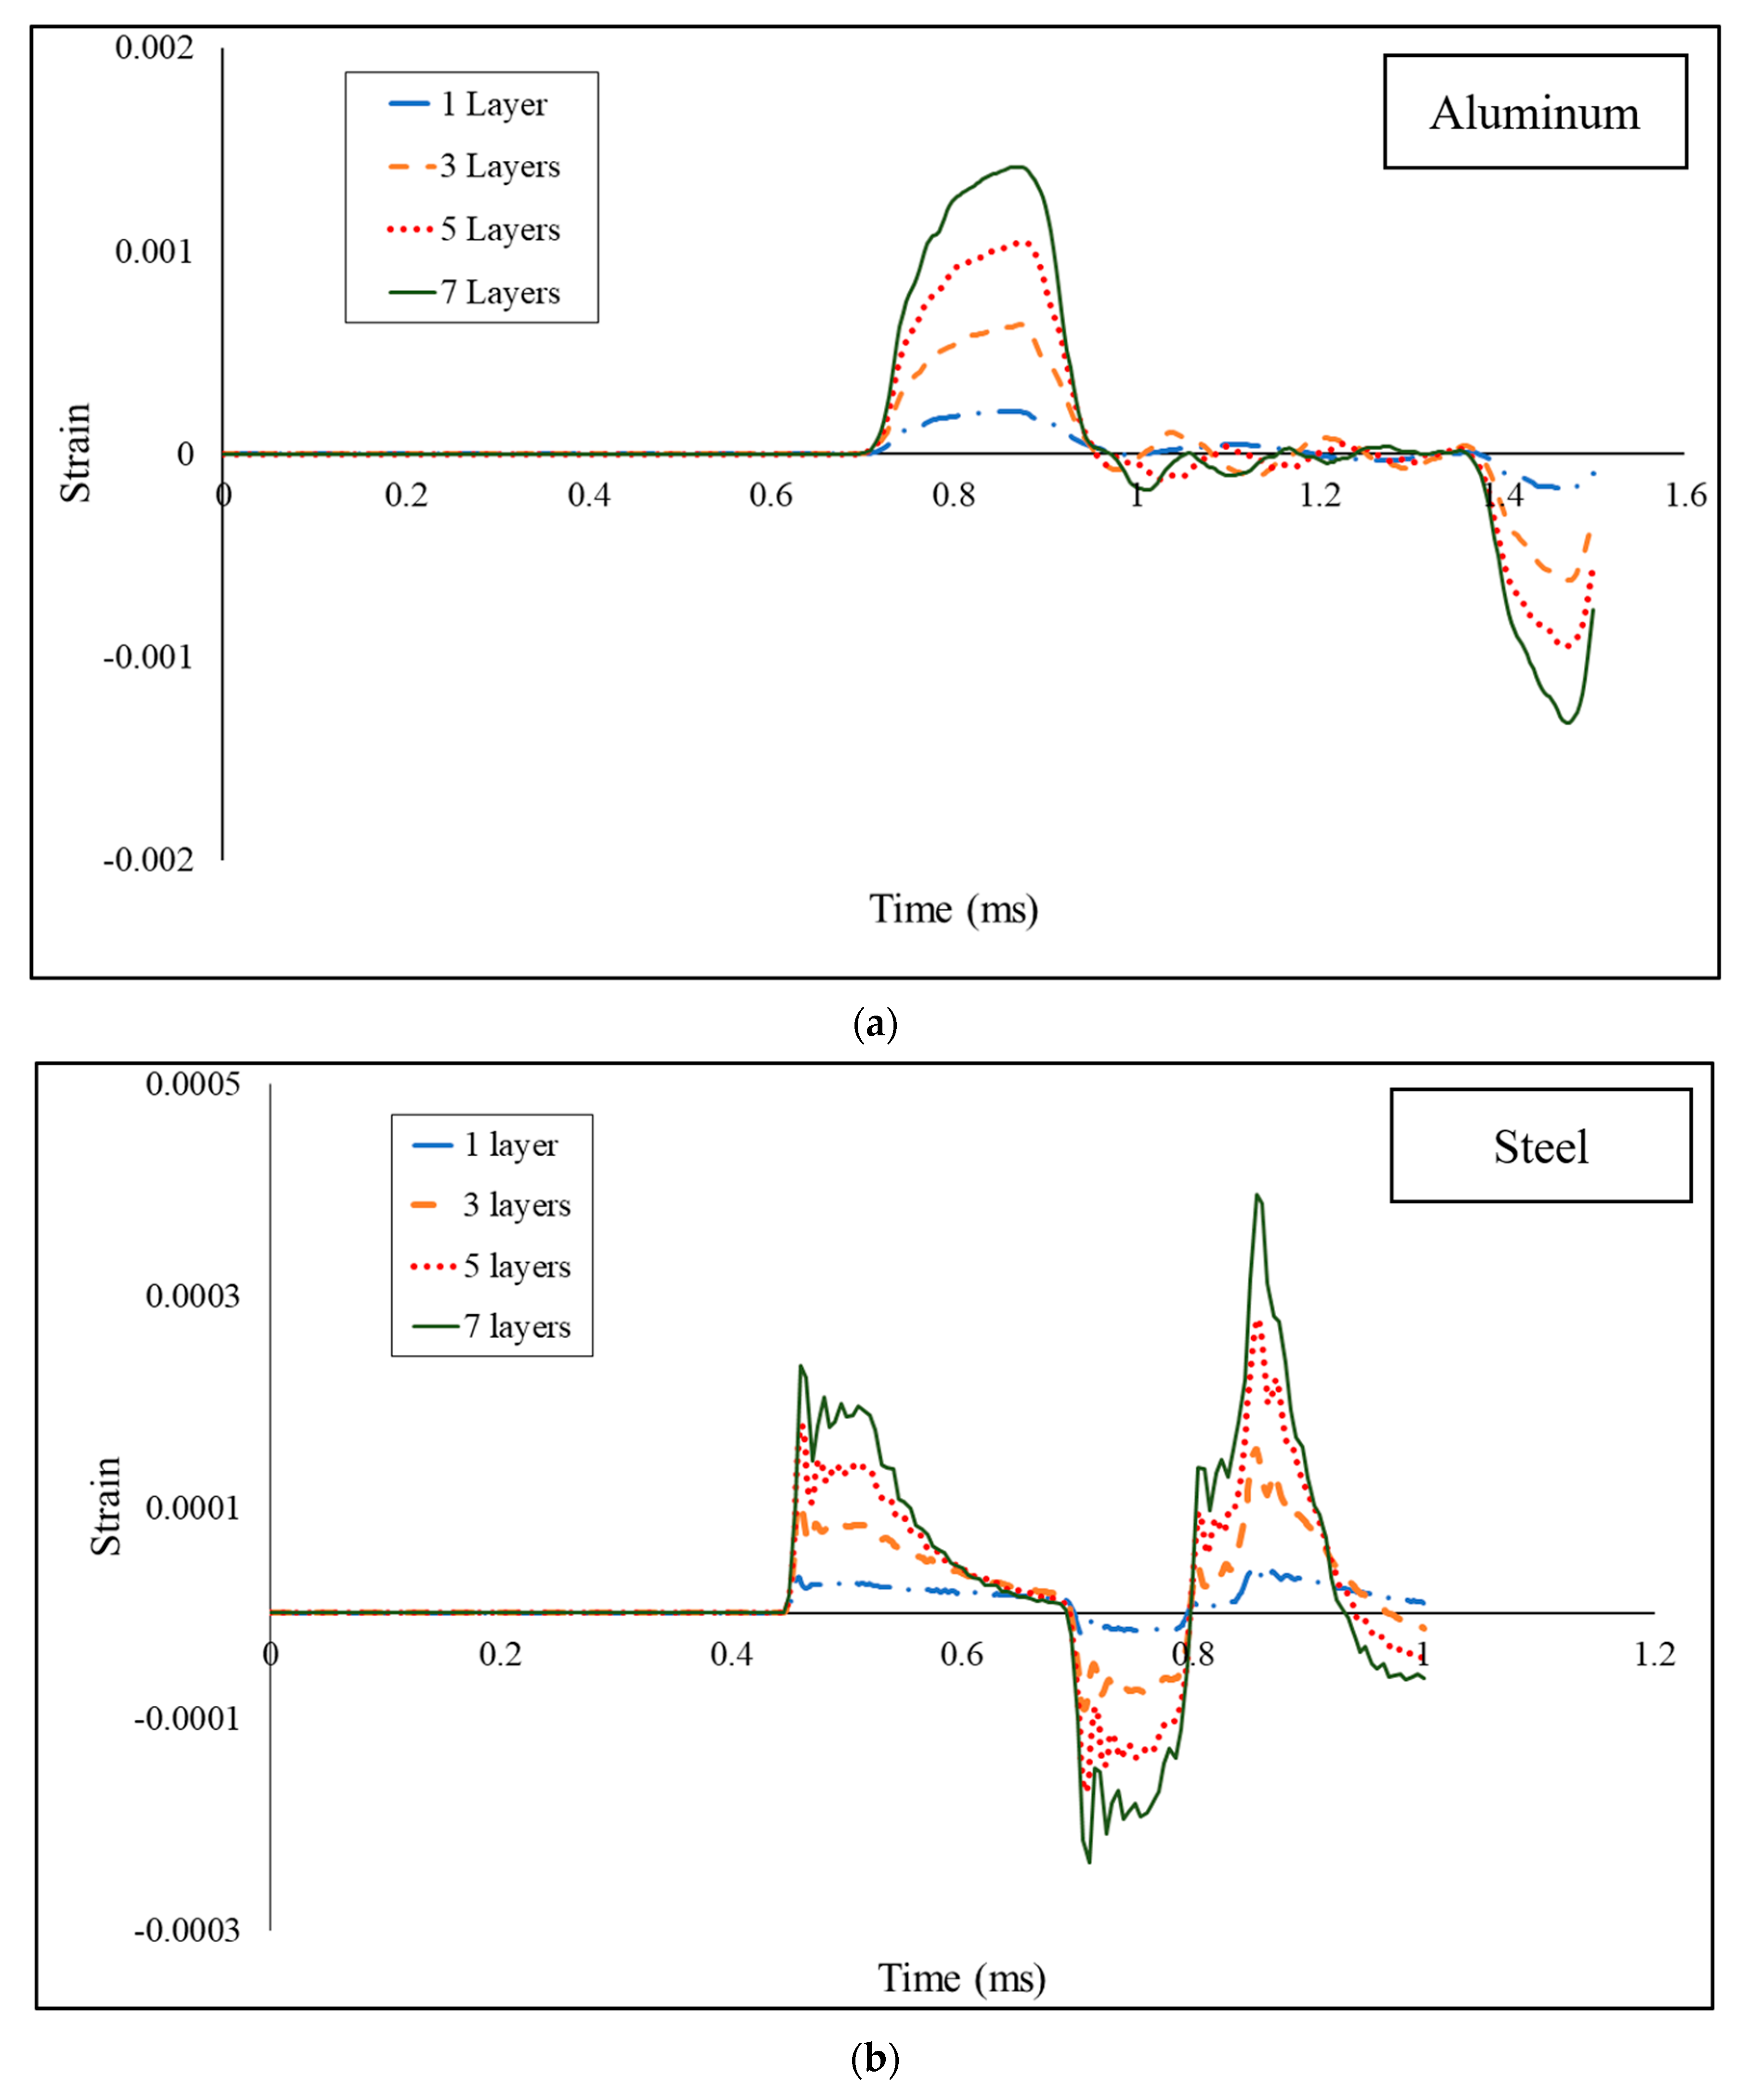
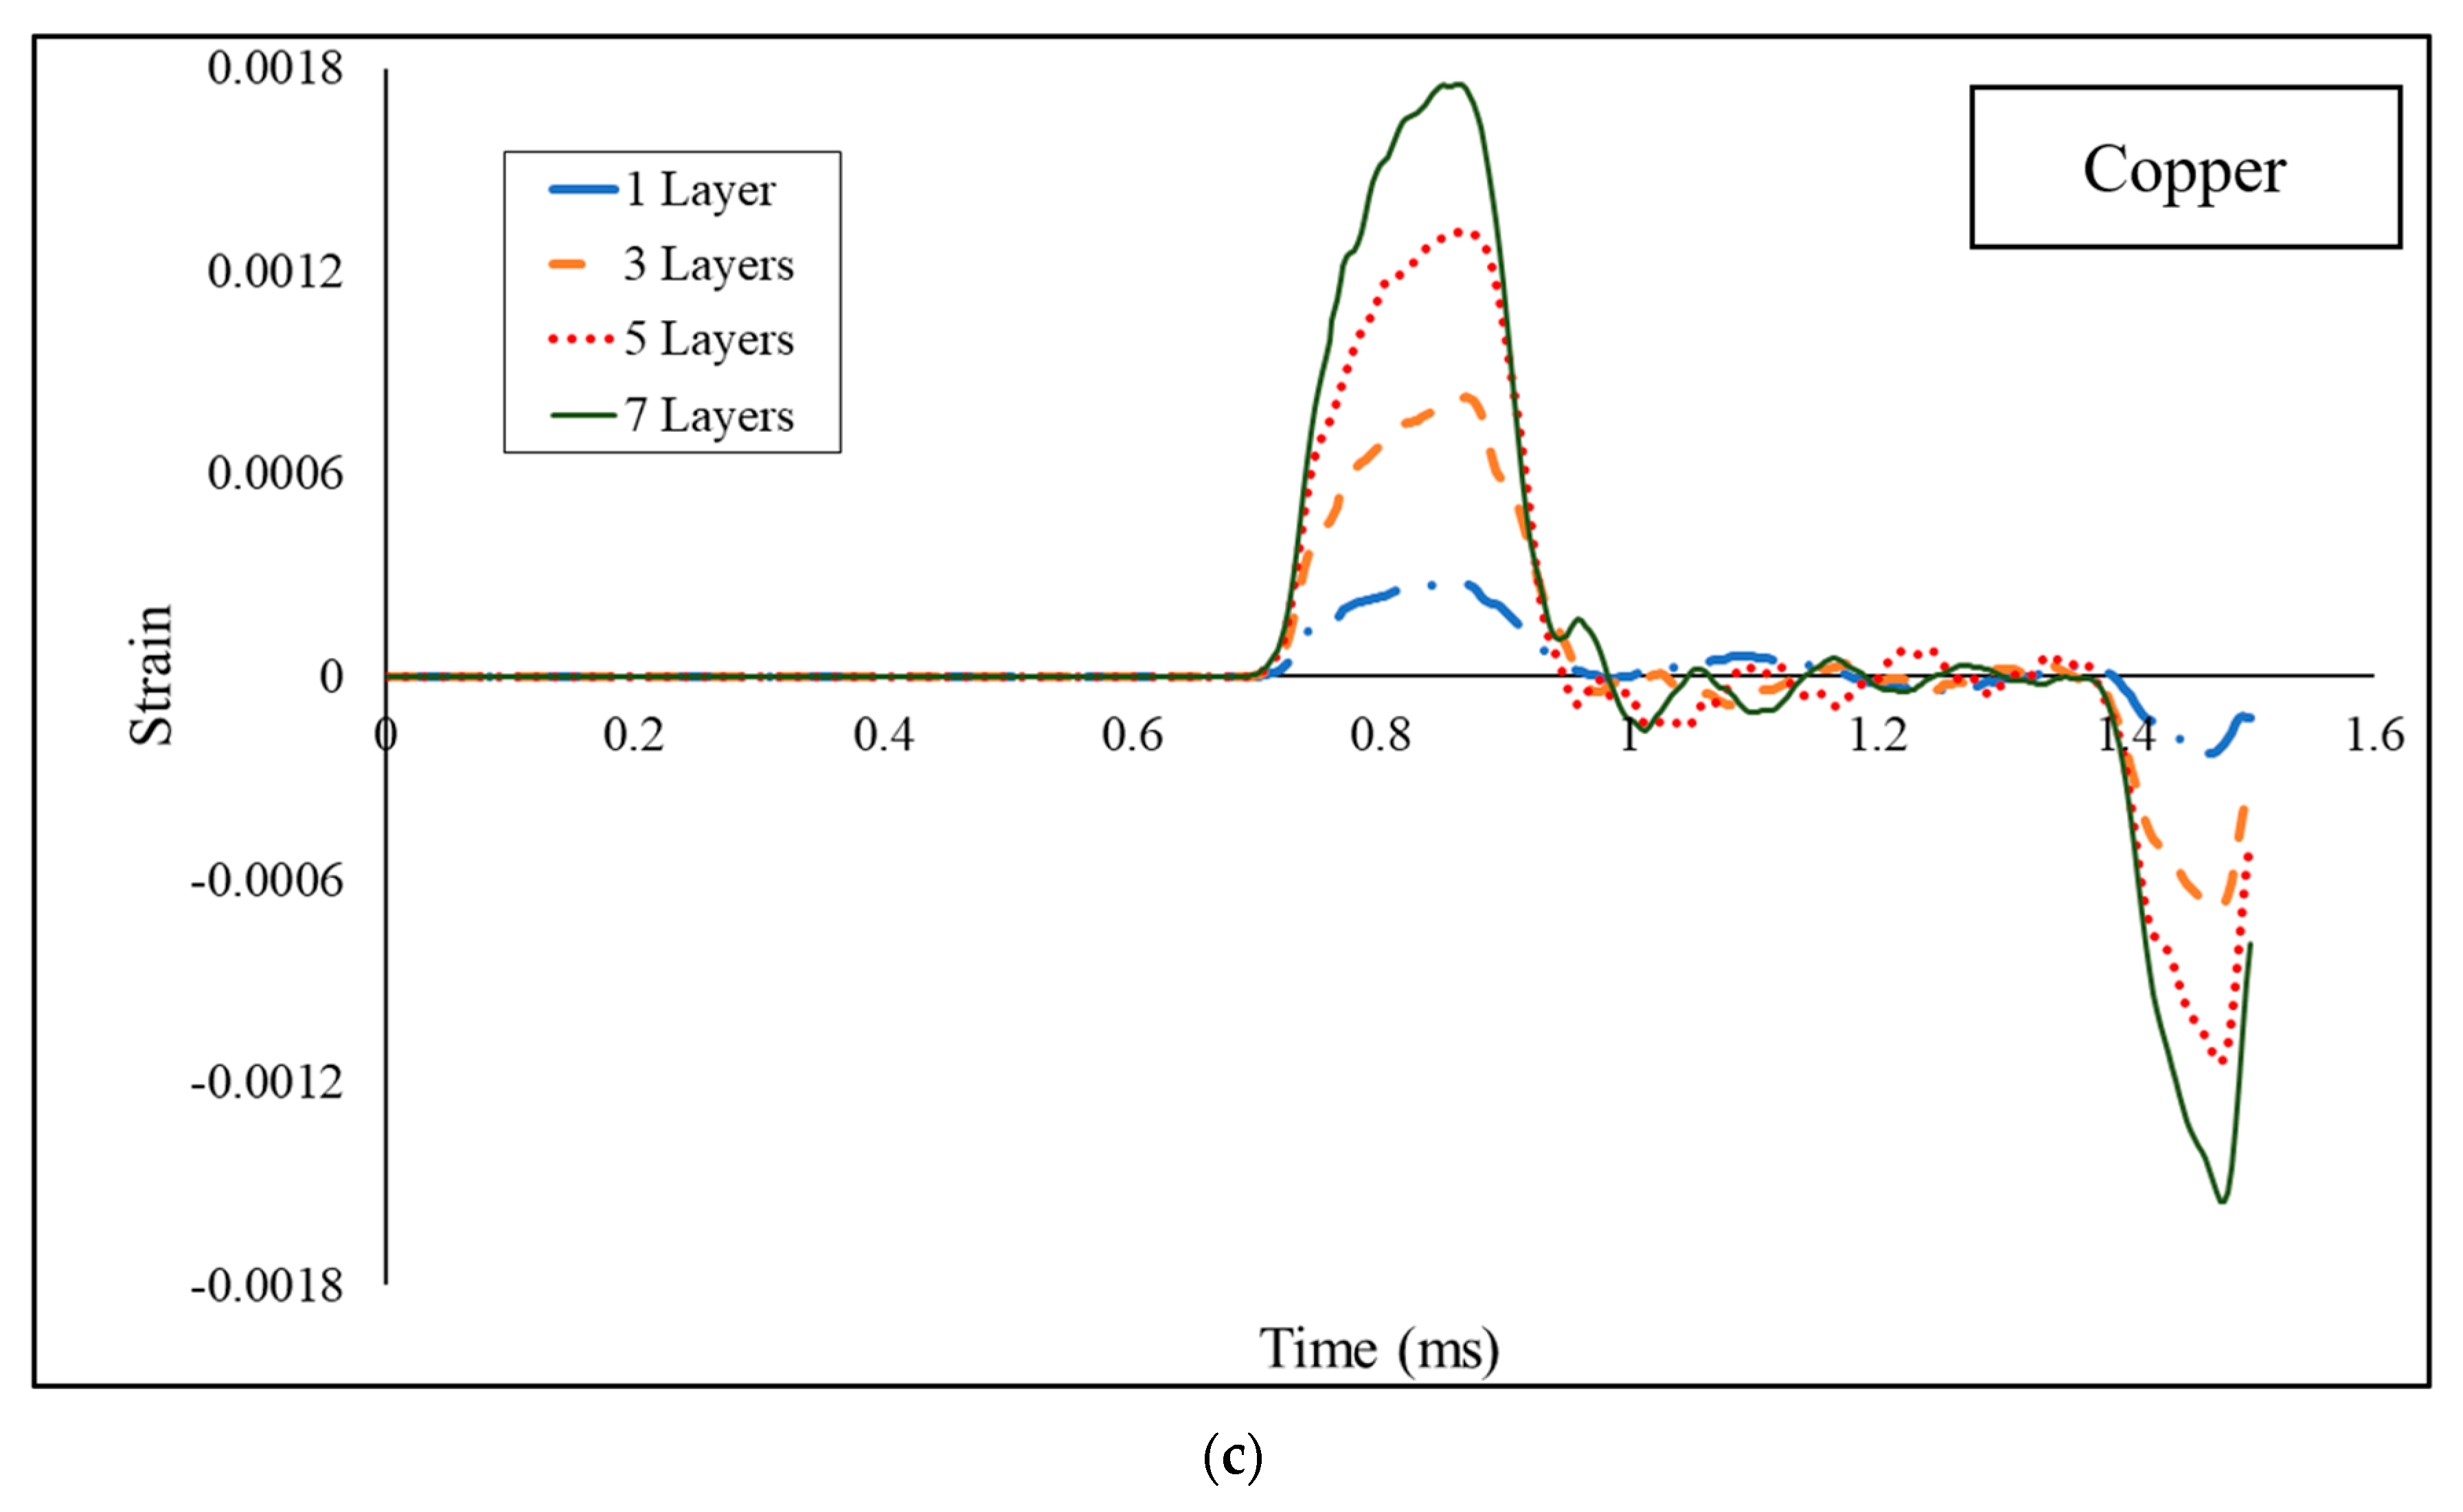
Analysis of a Li-ion NCA battery performance was conducted by evaluating two different parameters, namely the effect of stacking thin-foil materials and loading velocity. The first parameter studied was the effect of stacking on the strain wave. The simulation results of the effect of stacking on each of the three materials are shown in
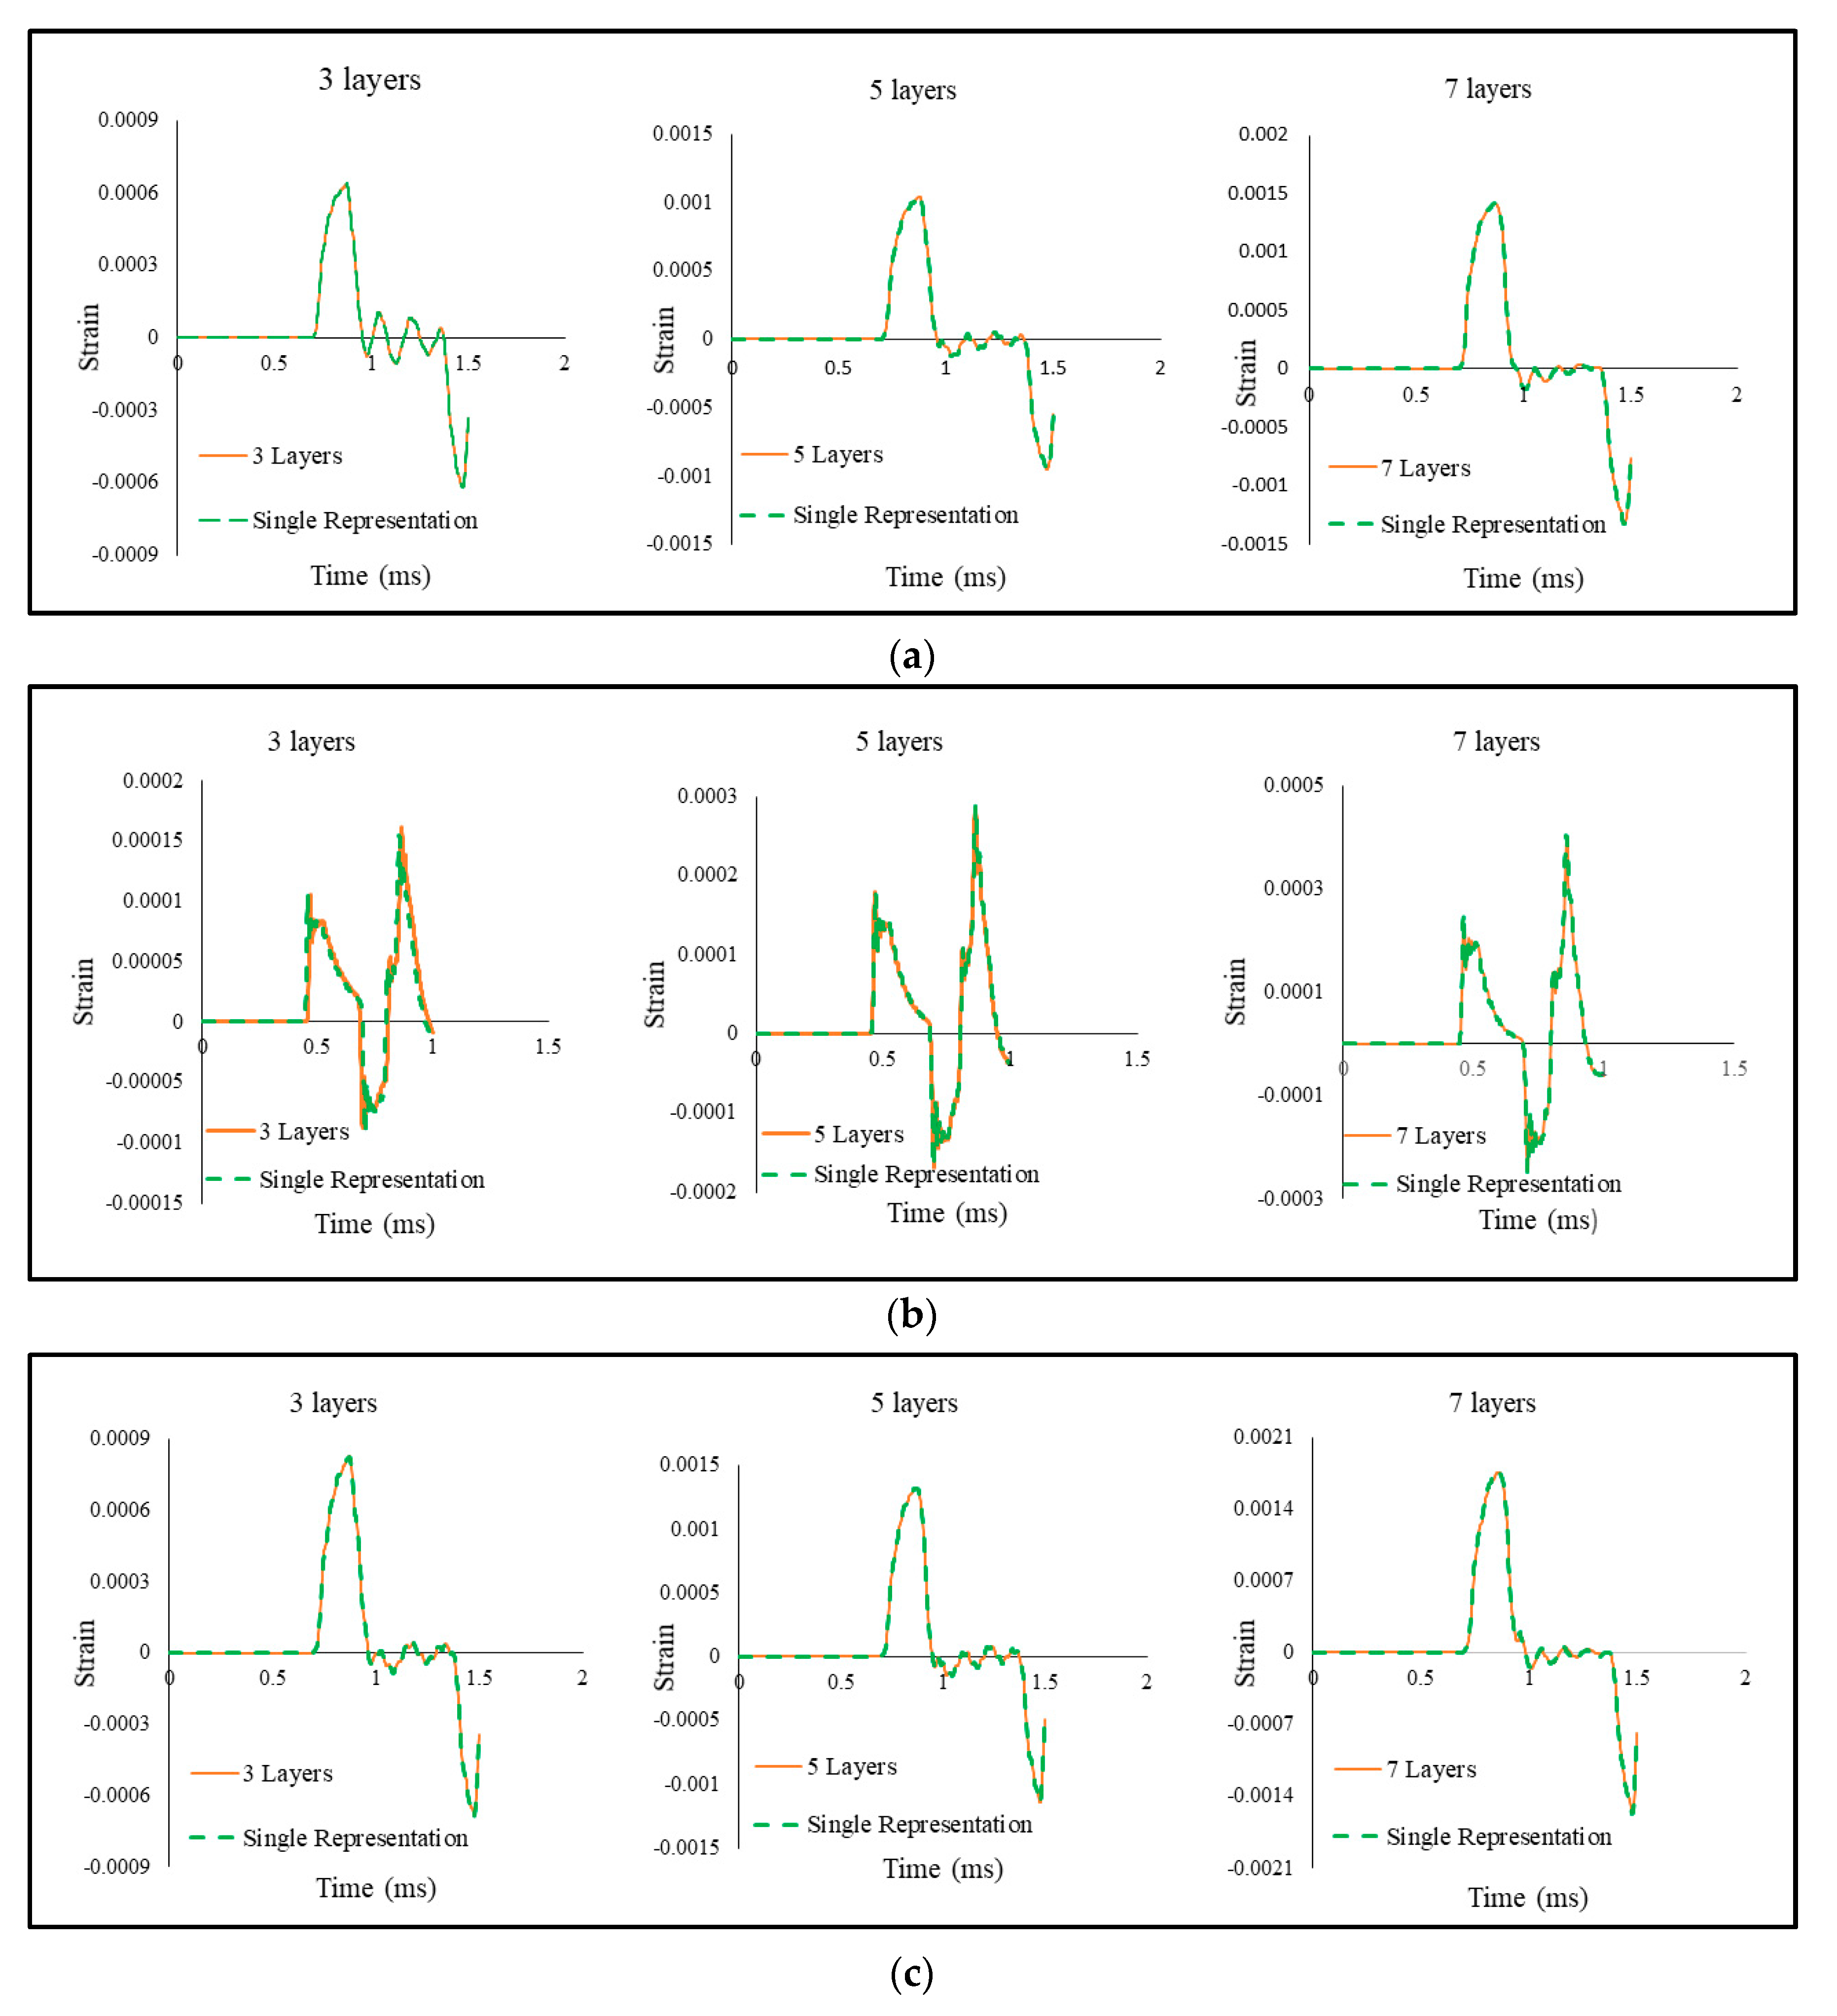
Figure 11. The strain data are measured from the element located in the middle of each incident and the transmitter bar lengthwise. The strain used for the data processing from the simulation was obtained from the mean strain on that element. The results show that the increasing number of specimen stacks used in the simulation could increase the amplitude of the transmitted signal.
In normal circumstances, an increase of the strain wave amplitude from the transmitter bar will be equal to the increase of stress. However, the same phenomenon should not be happening for the specimen stacking, since increasing the amount of the stack will also increase the total cross-sectional area, which is the sum of each cross-sectional area of the specimens.
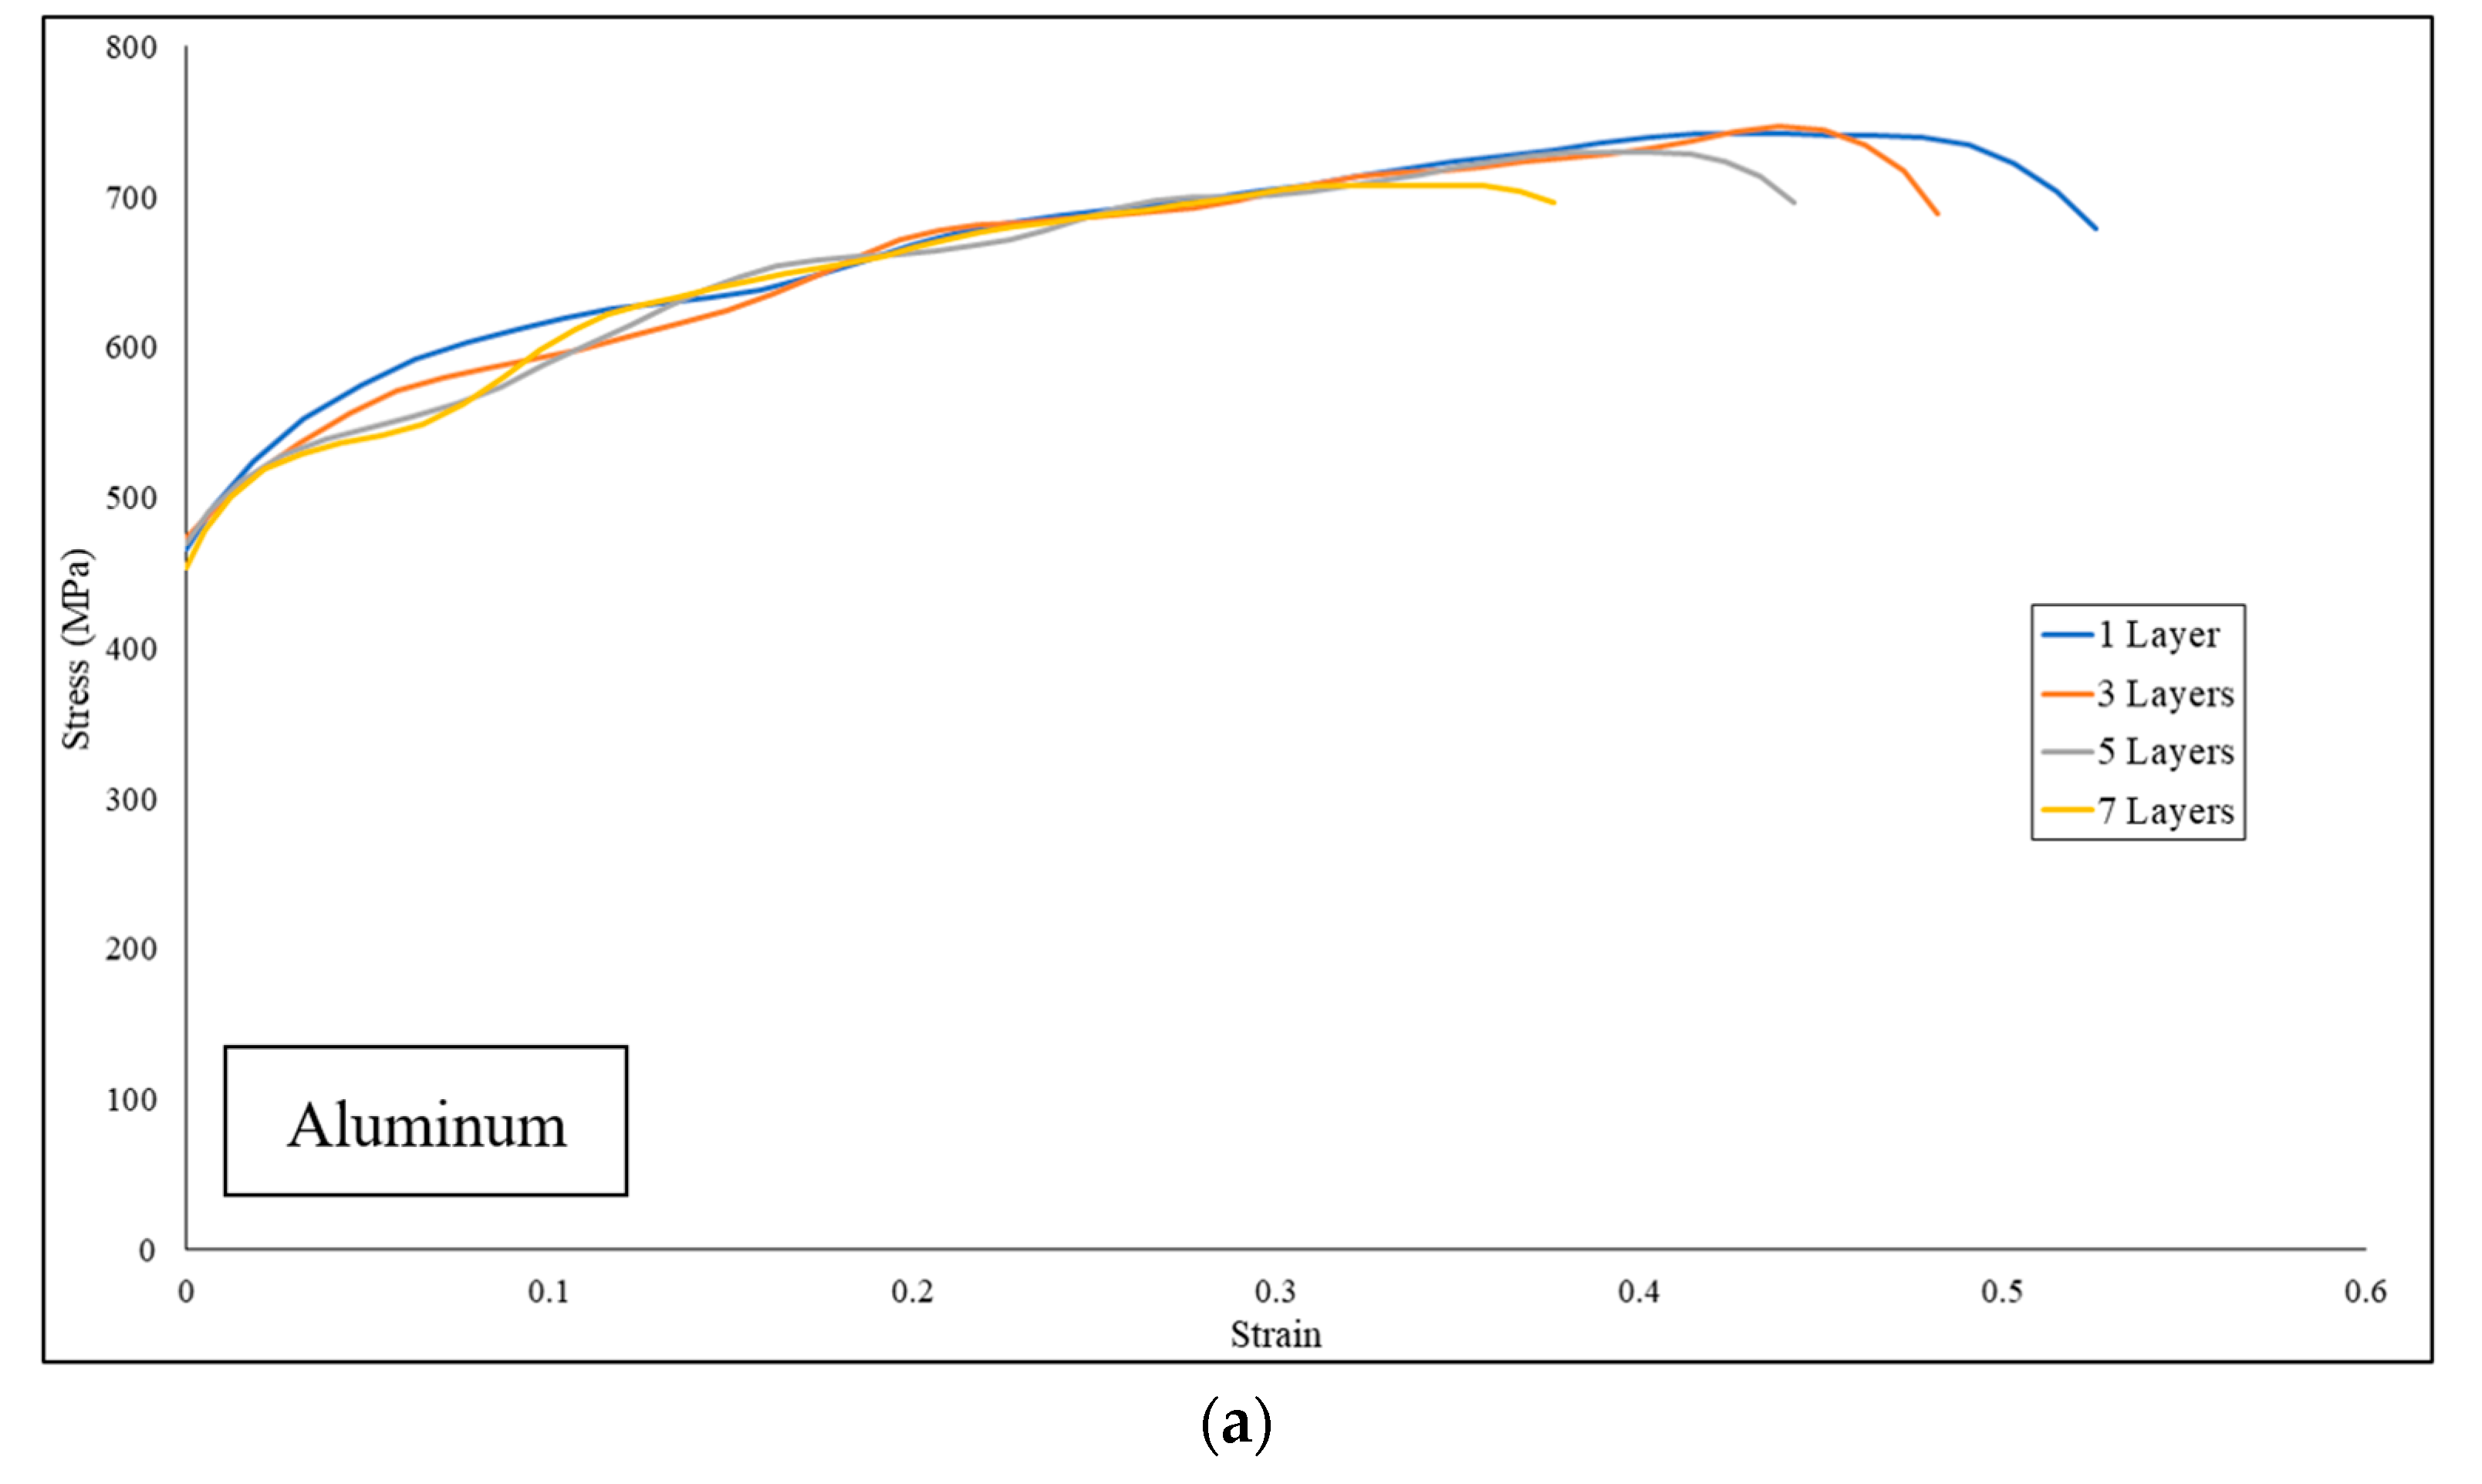
Figure 12 shows that there is not much deviation of stress from implementing specimen stacking for the simulation, and the result is within a tolerable value.
The strain obtained from the transmitter bar on the simulation with the stacking method was compared to an equivalent single-layer specimen, as shown in
Figure 13. The results show that there is no significant deviation between the stacking and the single-layer simulations. The consequence of the result obtained is that the single-layer specimen model can be used to simplify the simulation of the stacked specimen while maintaining the accuracy of the result.
In the numerical model, the damage or failure criterion of the thin-foil material was not included, because currently, no testing with a similar setup has been performed, the appropriate failure strain is not known yet, and inclusion of failure criteria may initiate the premature failure of the thin-foil materials, which could disrupt the stress wave. The effective strain distribution on the specimen undergoing the dynamic tensile load is shown in
Figure 14. It is shown that the strain distribution is relatively higher and consistent on the gage length area, which indicates that the straining of the specimen was mainly on the gage area.
For the second parameter, the effect of loading velocity, Equations (2)–(5) are used. The obtained signal was processed to generate the stress–strain curve for each loading velocity on each material, as shown in
Figure 15. The model used for this simulation was the model with the highest wave amplitude from each material, which was the model with the highest number of stacks. The results show that the three materials have a sensitivity to loading speed, where the stress measured is increasing with the increase of loading speed. From three materials simulated, steel has a result that is much lower than the static stress–strain curve. The possible explanation for this phenomenon is that the prescribed loading velocity is not high enough. Higher than elastic yield stress was obtained when the specimen was pulled at 20 m/s. This implies that a higher loading speed should be applied to ensure the specimen reaching plastic deformation.
4.2. Dynamic Compression Test Simulation Result
The numerical simulation of the dynamic compression of a jellyroll using Fu-Chang foam and modified crushable foam has been performed. The stress waves measured from the middle of the incident bar and the transmitter bar are processed using Equations (2)–(4) to obtain the stress and strain curve of the specimen.
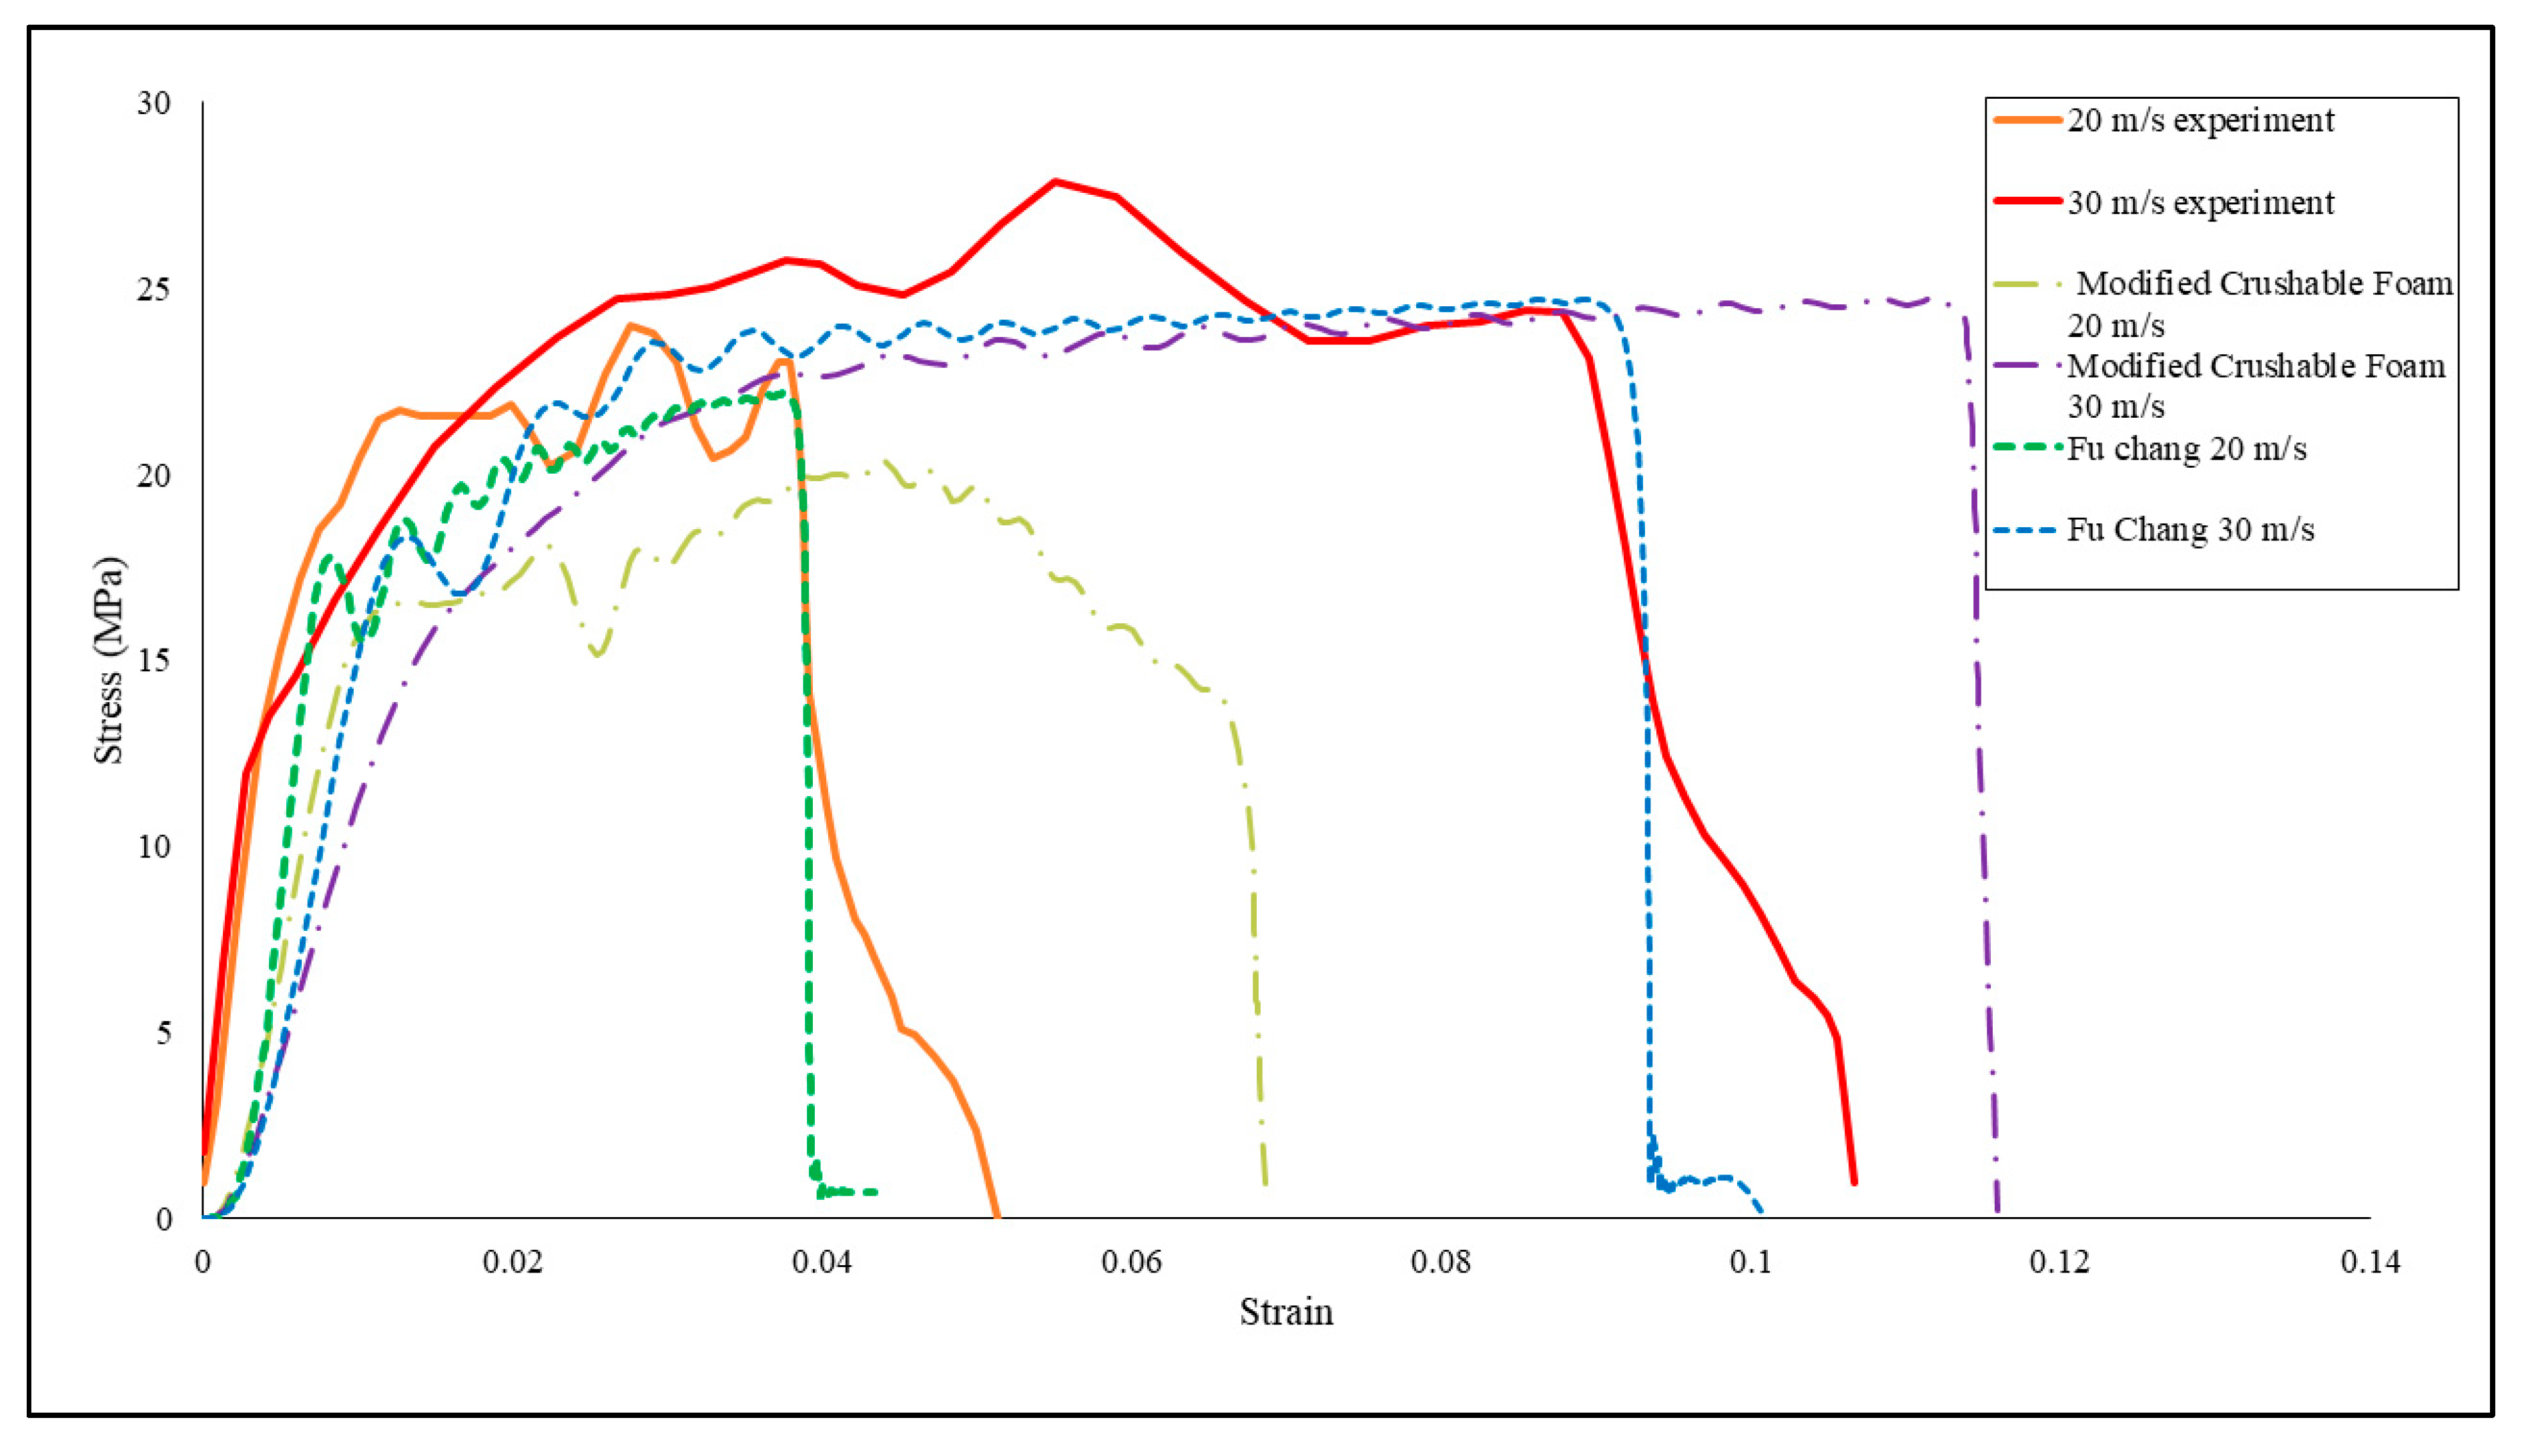
Figure 16 shows that both the Fu-Chang foam and the modified crushable foam model exhibit an increase of stress in the response of higher loading speed. Fu-Chang foam result has a better fit with the experiment result compared to the result of the modified crushable foam.
A closer look at the results show that there is a slight extension of the strain from the experiment. It is possible that unloading occurs right before the loading impulse is finished. Since the Fu-Chang foam allows the user to modify its unloading curve shape factor, the unloading assumption can be put to the test. There are three different values of hysteretic unit (HU): 0, which corresponds to using the stress–strain curve with the lowest strain rate as the unloading curve, 0.01, which is the HU value for the base model, and 1, which corresponds to the maximum value for the HU input. The deformation is measured by checking the displacement of the nodes on each of the flat sides of the specimen to see whether the deformation on the specimen remains constant or decreases after maximum compression, which is a characteristic of unloading.
The deformation of the specimen based on the change of its flat side displacement results is shown in
Figure 17. The result shows that the base model does not exhibit any kind of unloading where the front side and the rear side do not reduce their displacement after the maximum compression occurs. The model with hysteretic unit (HU) values of 0 and 1 shows a decay of displacement coming from the front side of the specimen, from which it can be predicted that the unloading of the specimen happens. The stress–strain curves of those three models are plotted and compared with the experiment, which is shown in
Figure 18. The model with HU values of 0 and 1 experiences a large increase of strain due to the unloading that occurred, while the base model only shows a straight line after the compression impulse is finished. The results from
Figure 17 show that the model with HU values of 0 and 1 has a significant amount of displacement decay right after the maximum compression occurs, and the specimen retains a small amount of deformation after the displacement decay is finished. The unloading process may tamper with the stress waves on the bar where the unloading may elongate the stress waves measured by the incident and transmitter bar, thus giving a result that might give a false hint that the material deforms larger than measured or observed.
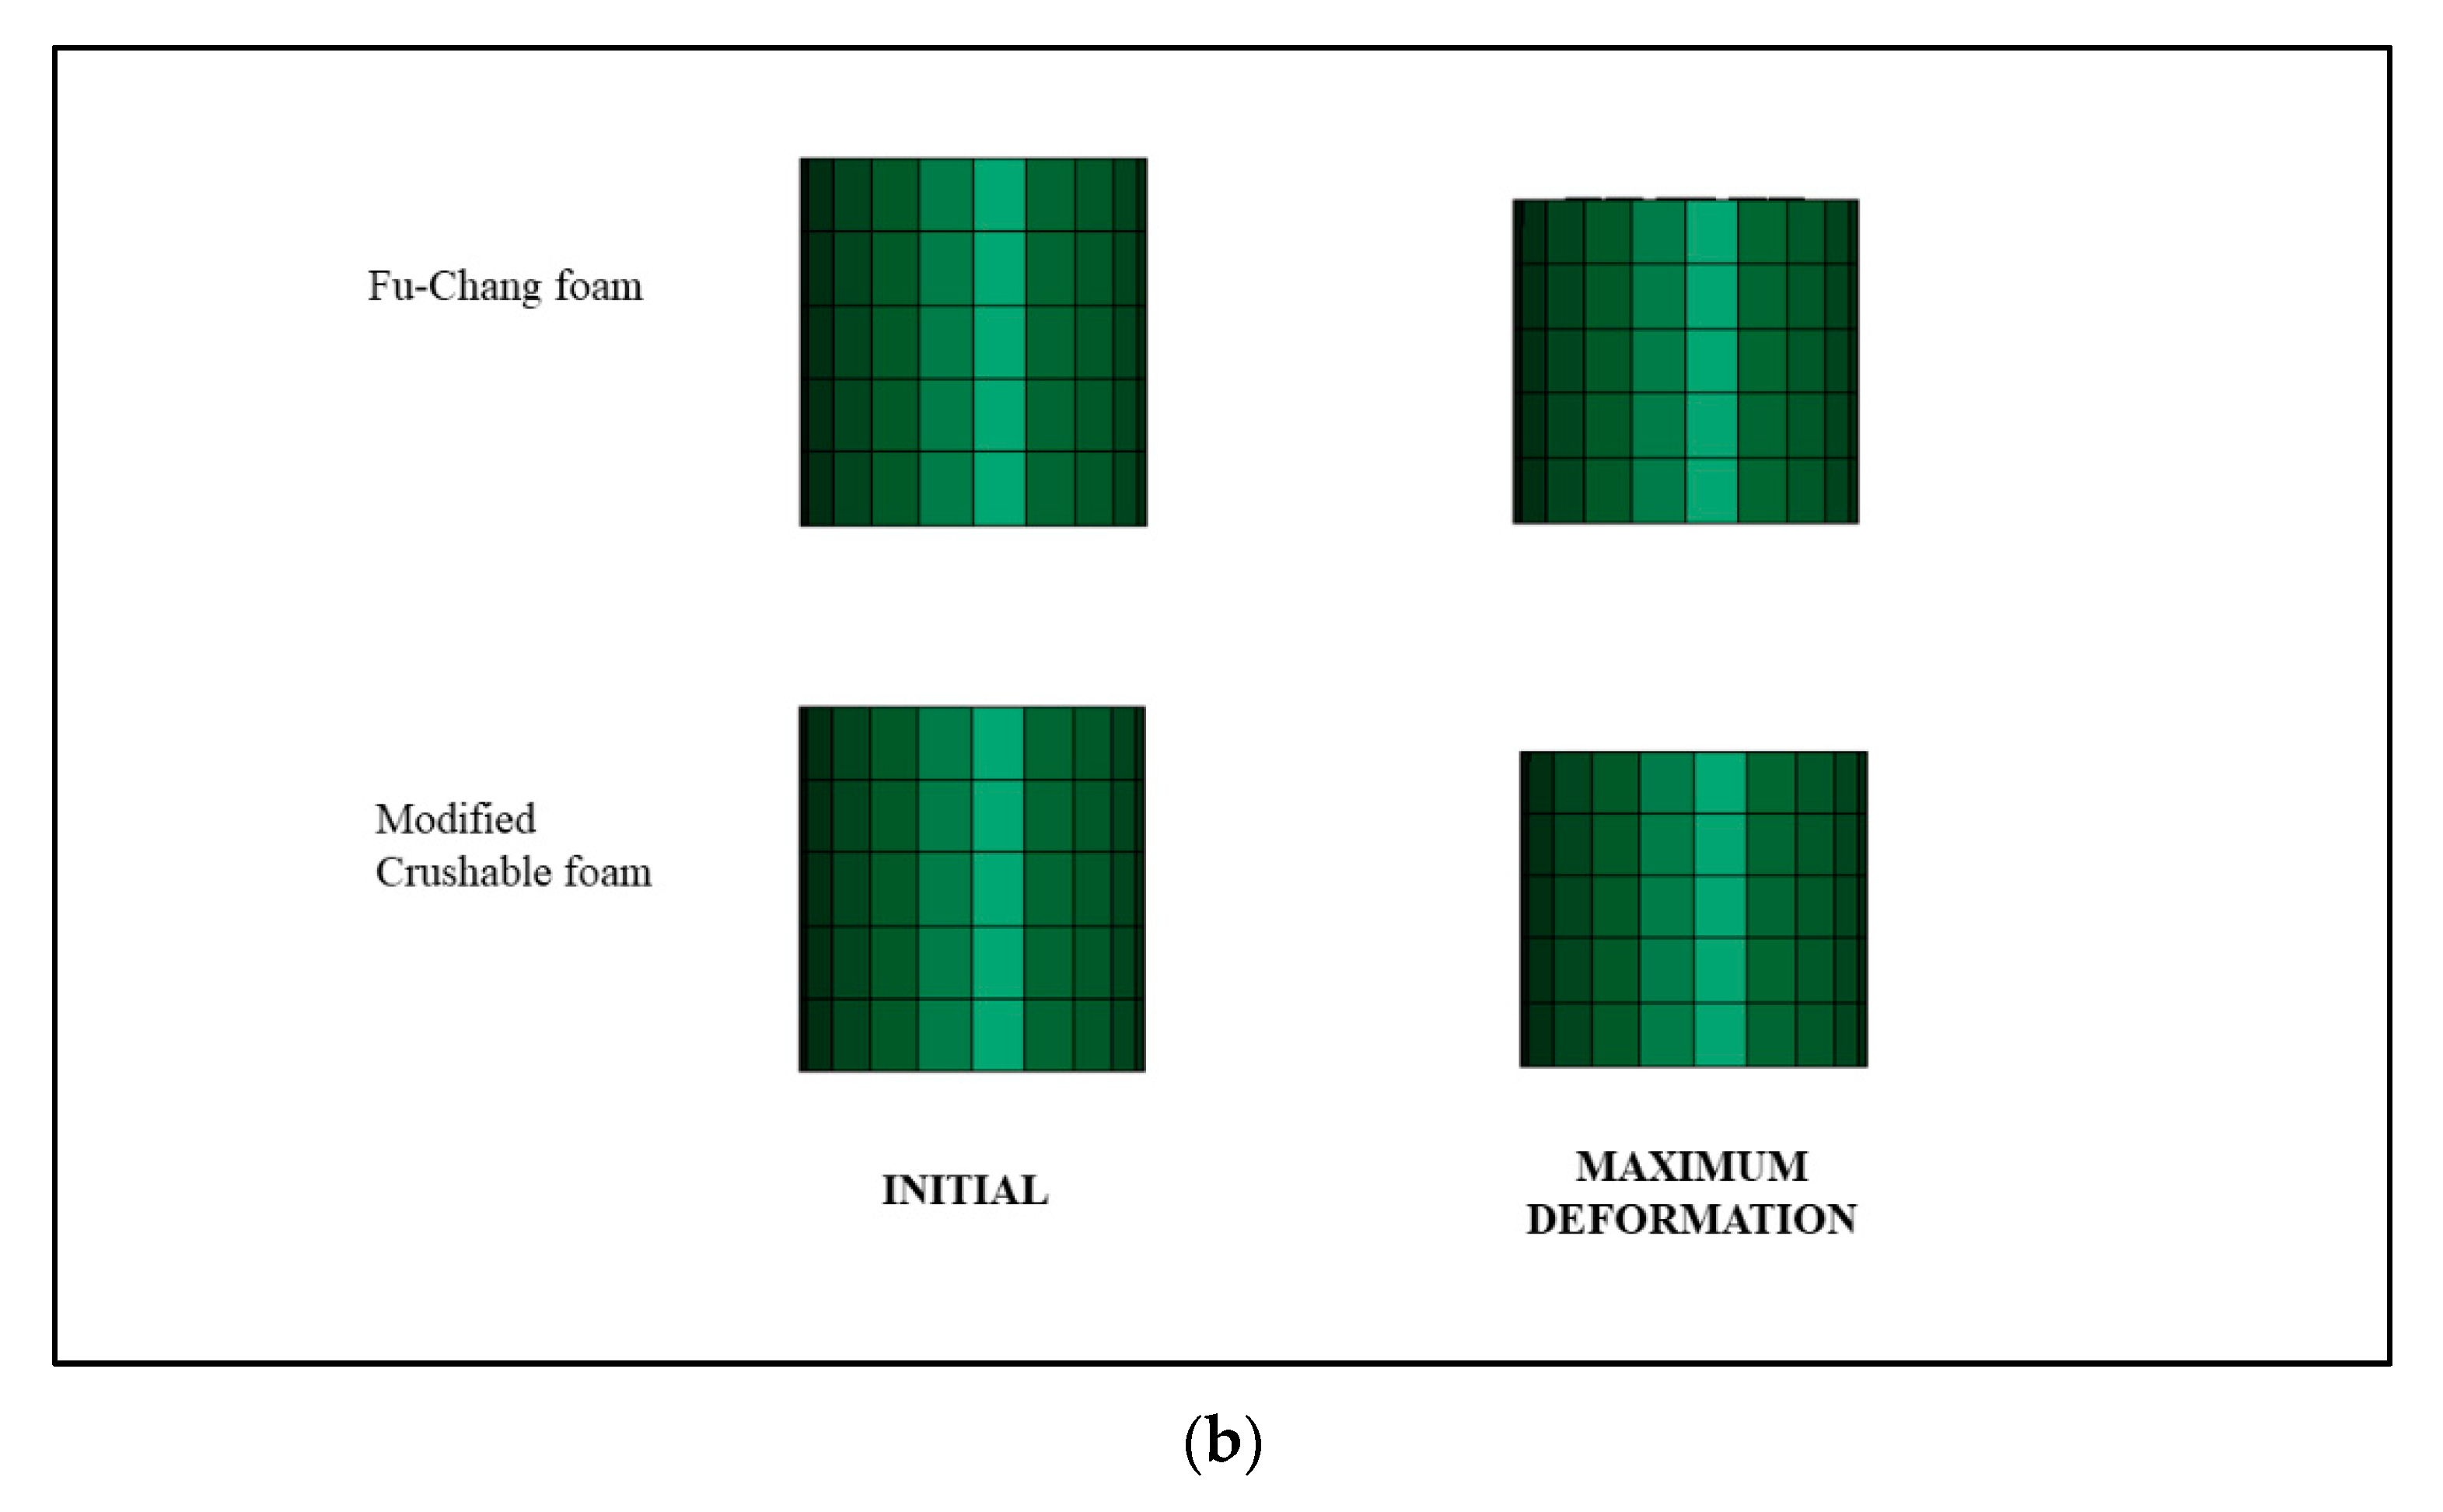
Since the model used in the simulation was a homogenized jellyroll, the buckling of the layers on the specimen could not be captured by both Fu-Chang foam and modified crushable foam. Both Fu-Chang foam and modified crushable foam showed a similar deformation mode where the specimen is contracted, as shown in
Figure 19. Although the model could not capture the deformation mode that occurred in the experiment, the result obtained is still adequate, since the model could produce a close approximation with the experiment result.
4.3. Axial Impact Test Simulation Result
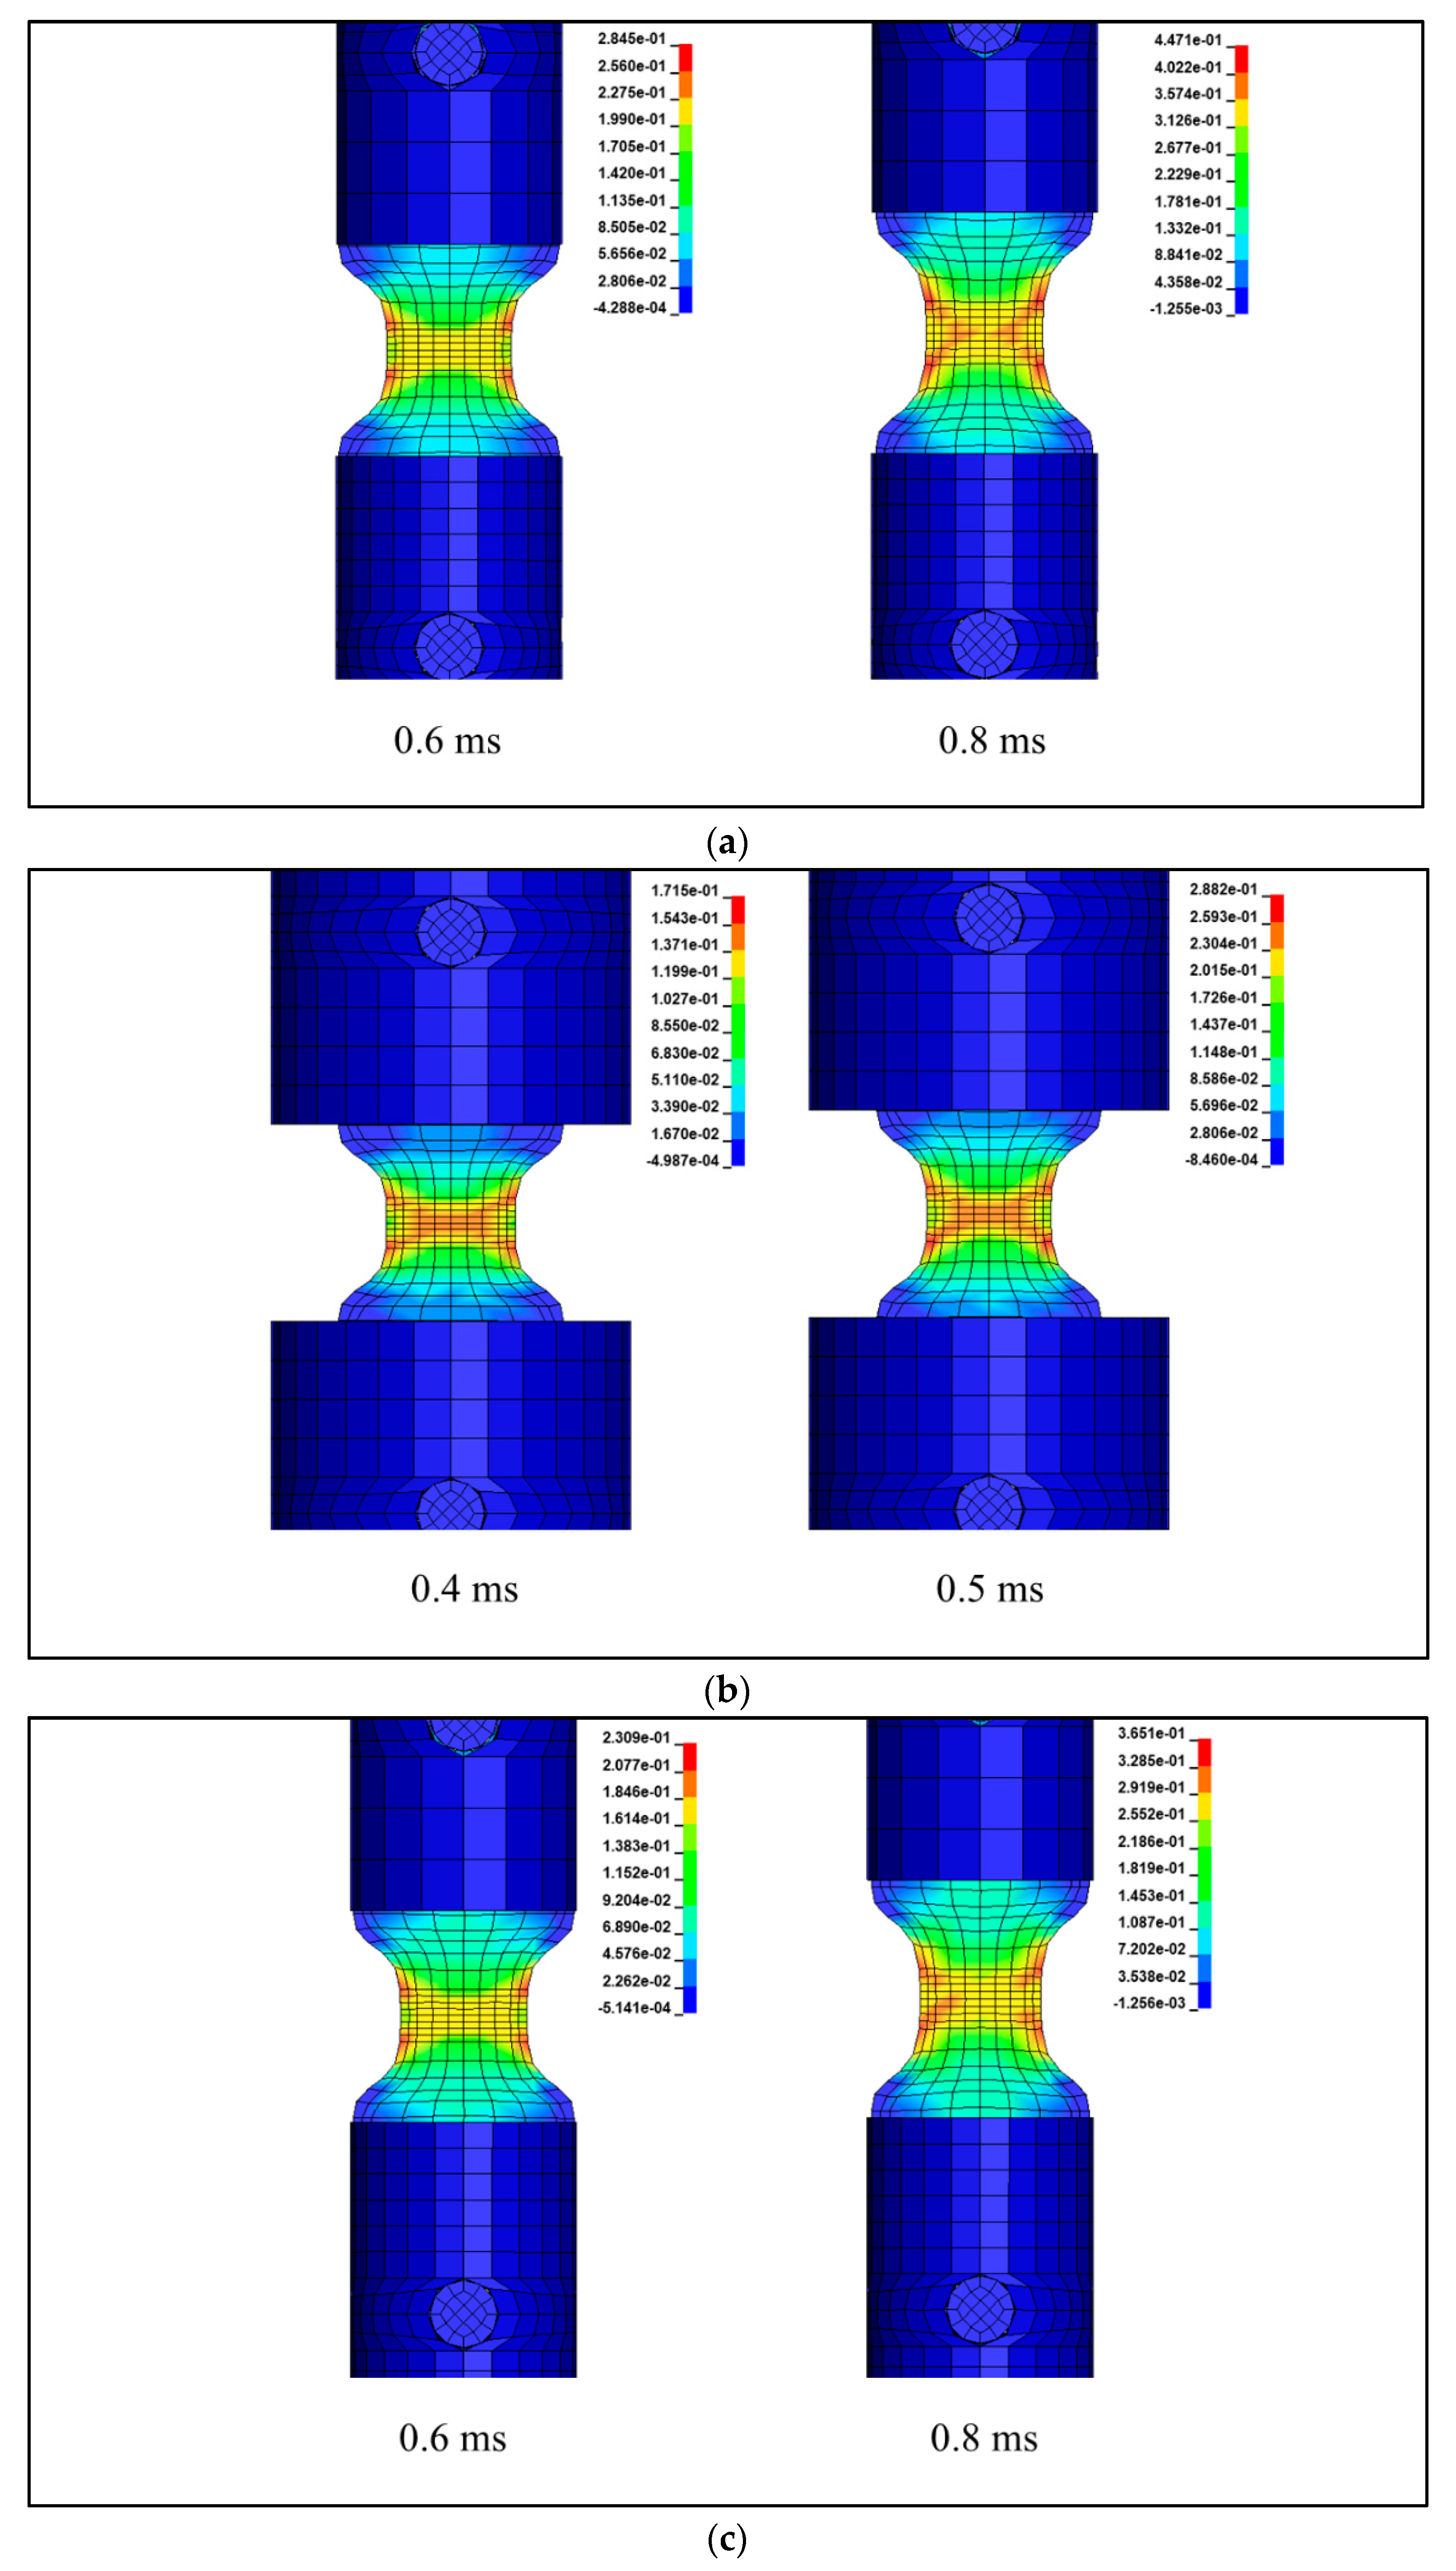
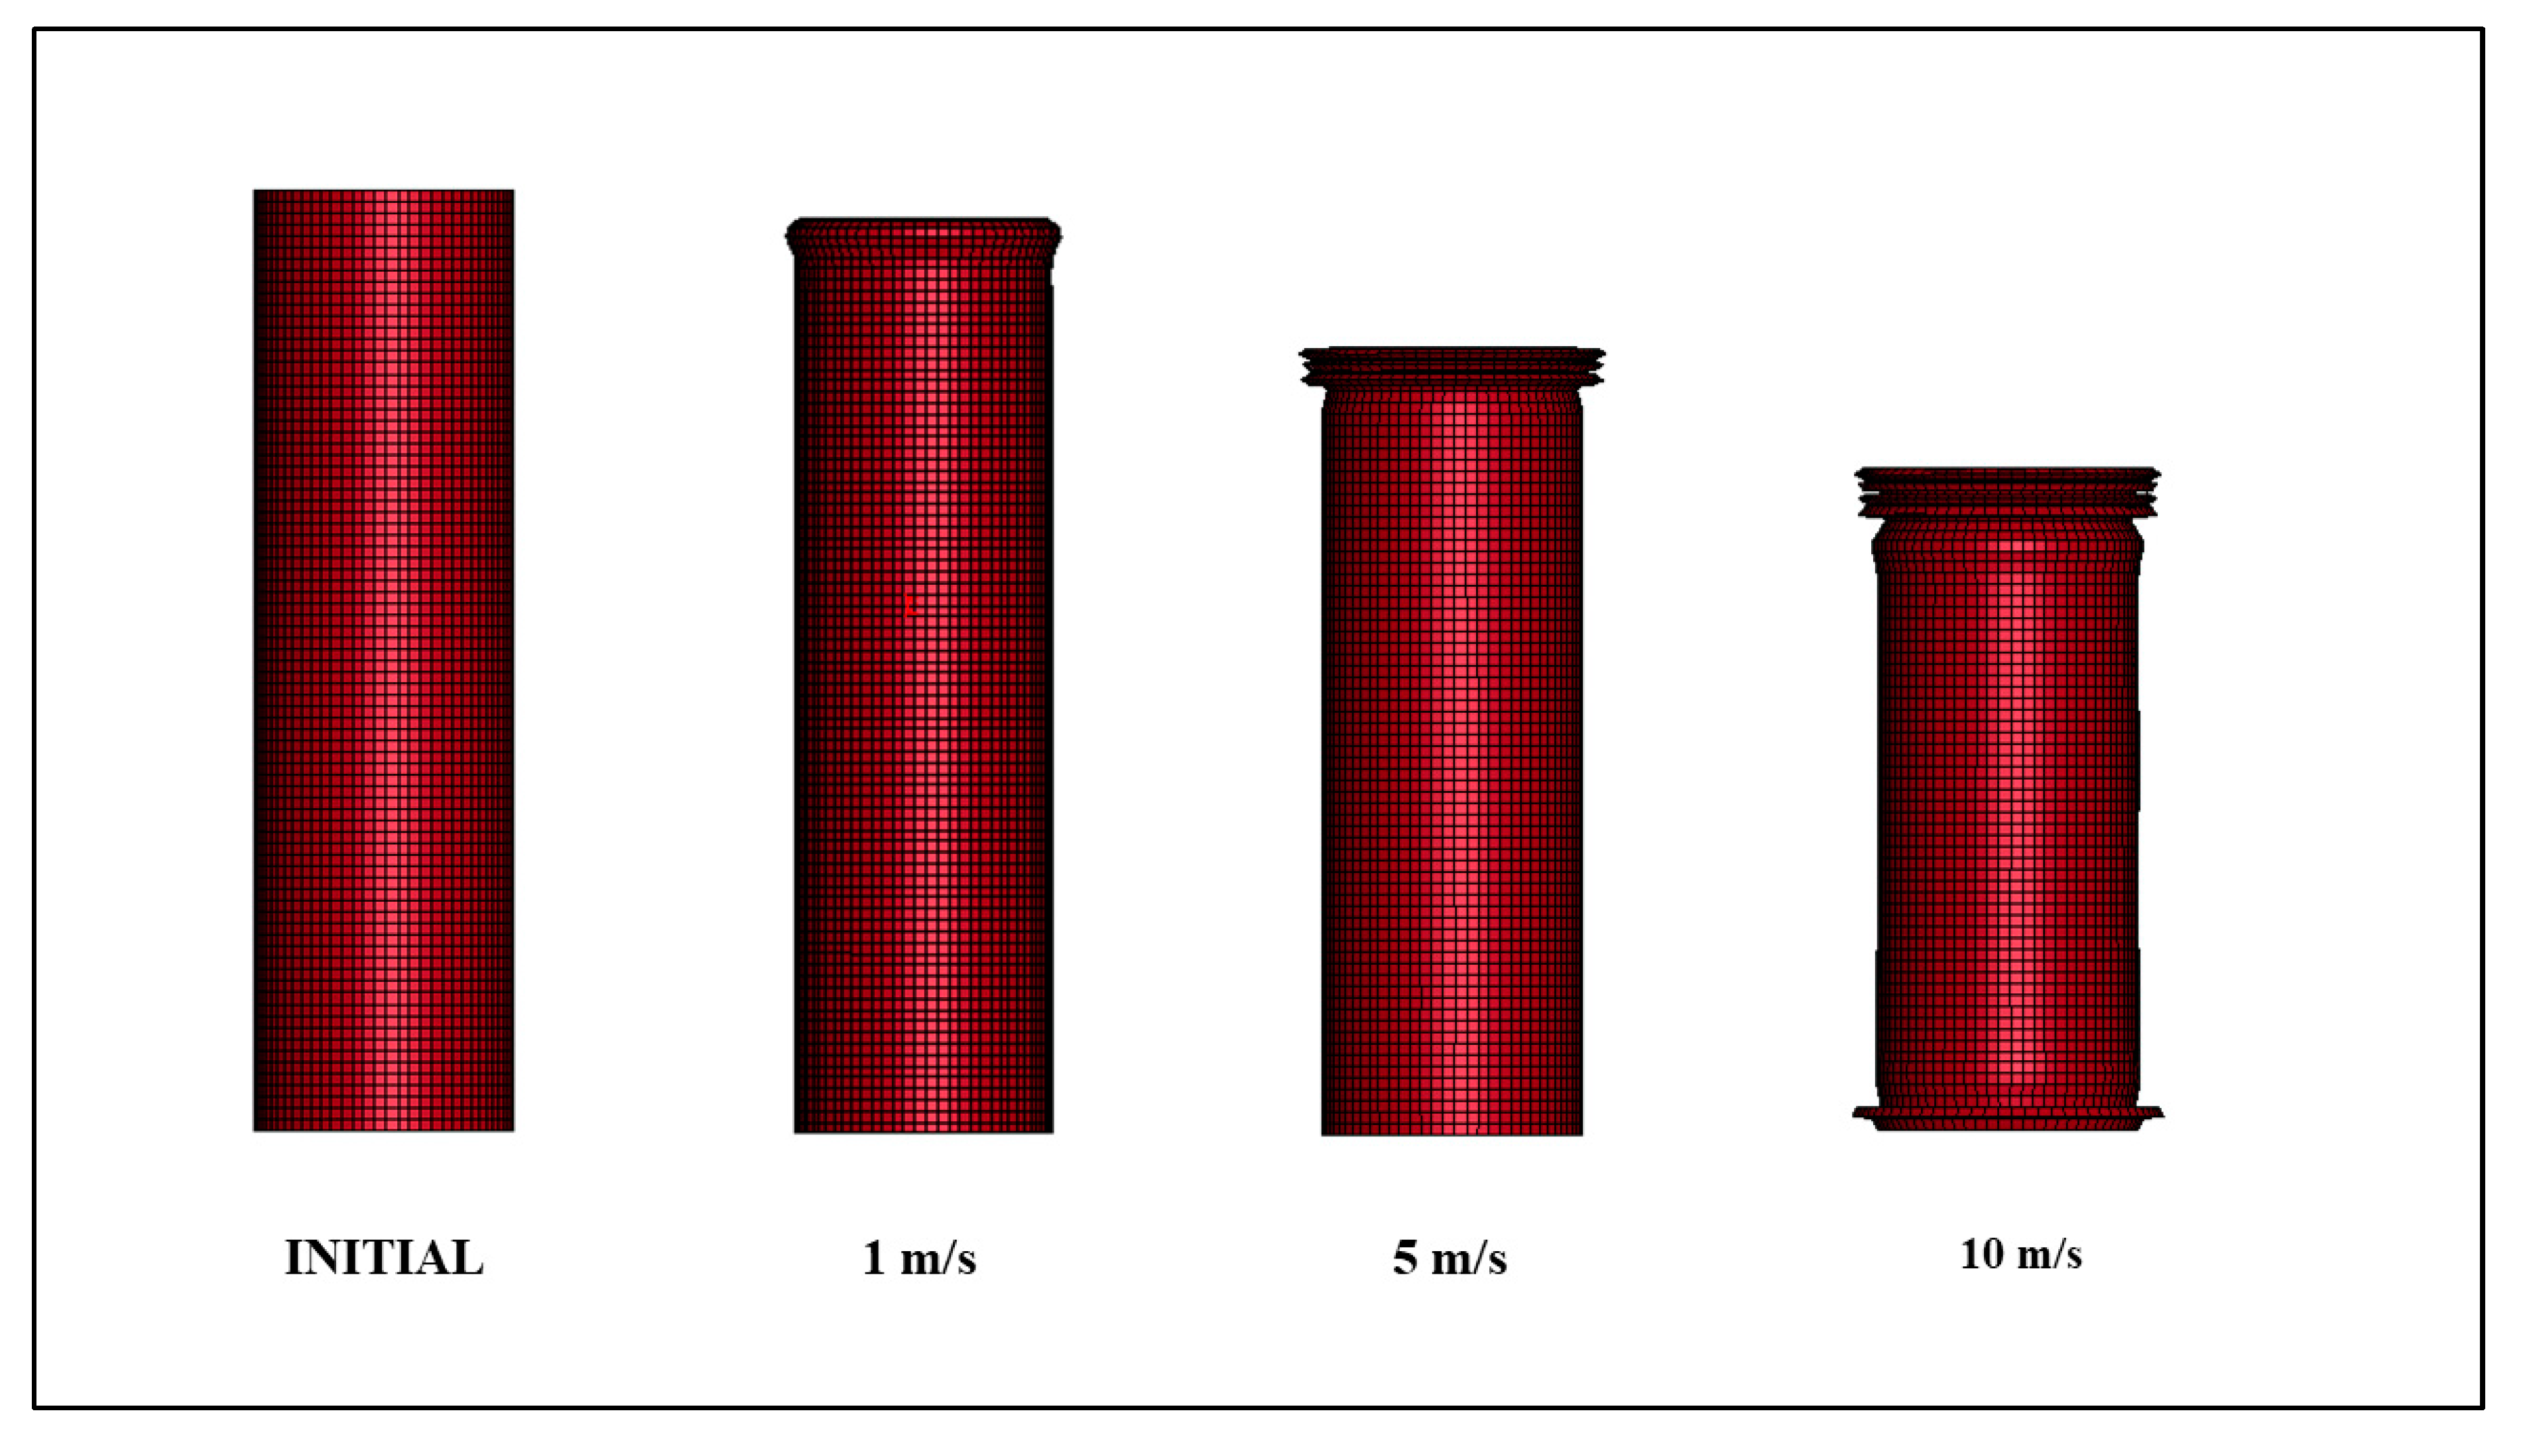
The deformation that occurred on the battery model on different impact speeds is shown in
Figure 20. The casing folded in concertina mode for the three loading speeds, and the amount of fold is easily predicted to increase with the increase of the loading speed. It is interesting to look at the result of the 10 m/s model, where a fold was created at the bottom area of the battery. Since the jellyroll is not modeled to stick to the surface of the casing and the foam model tends not to expand in the lateral direction due to the low Poisson ratio, the jellyroll did not significantly increase the stiffness of the casing, thus allowing the already thin shell casing to deform at the bottom area. Using a larger area for the constraint could prevent the buckling of the shell on the bottom area.
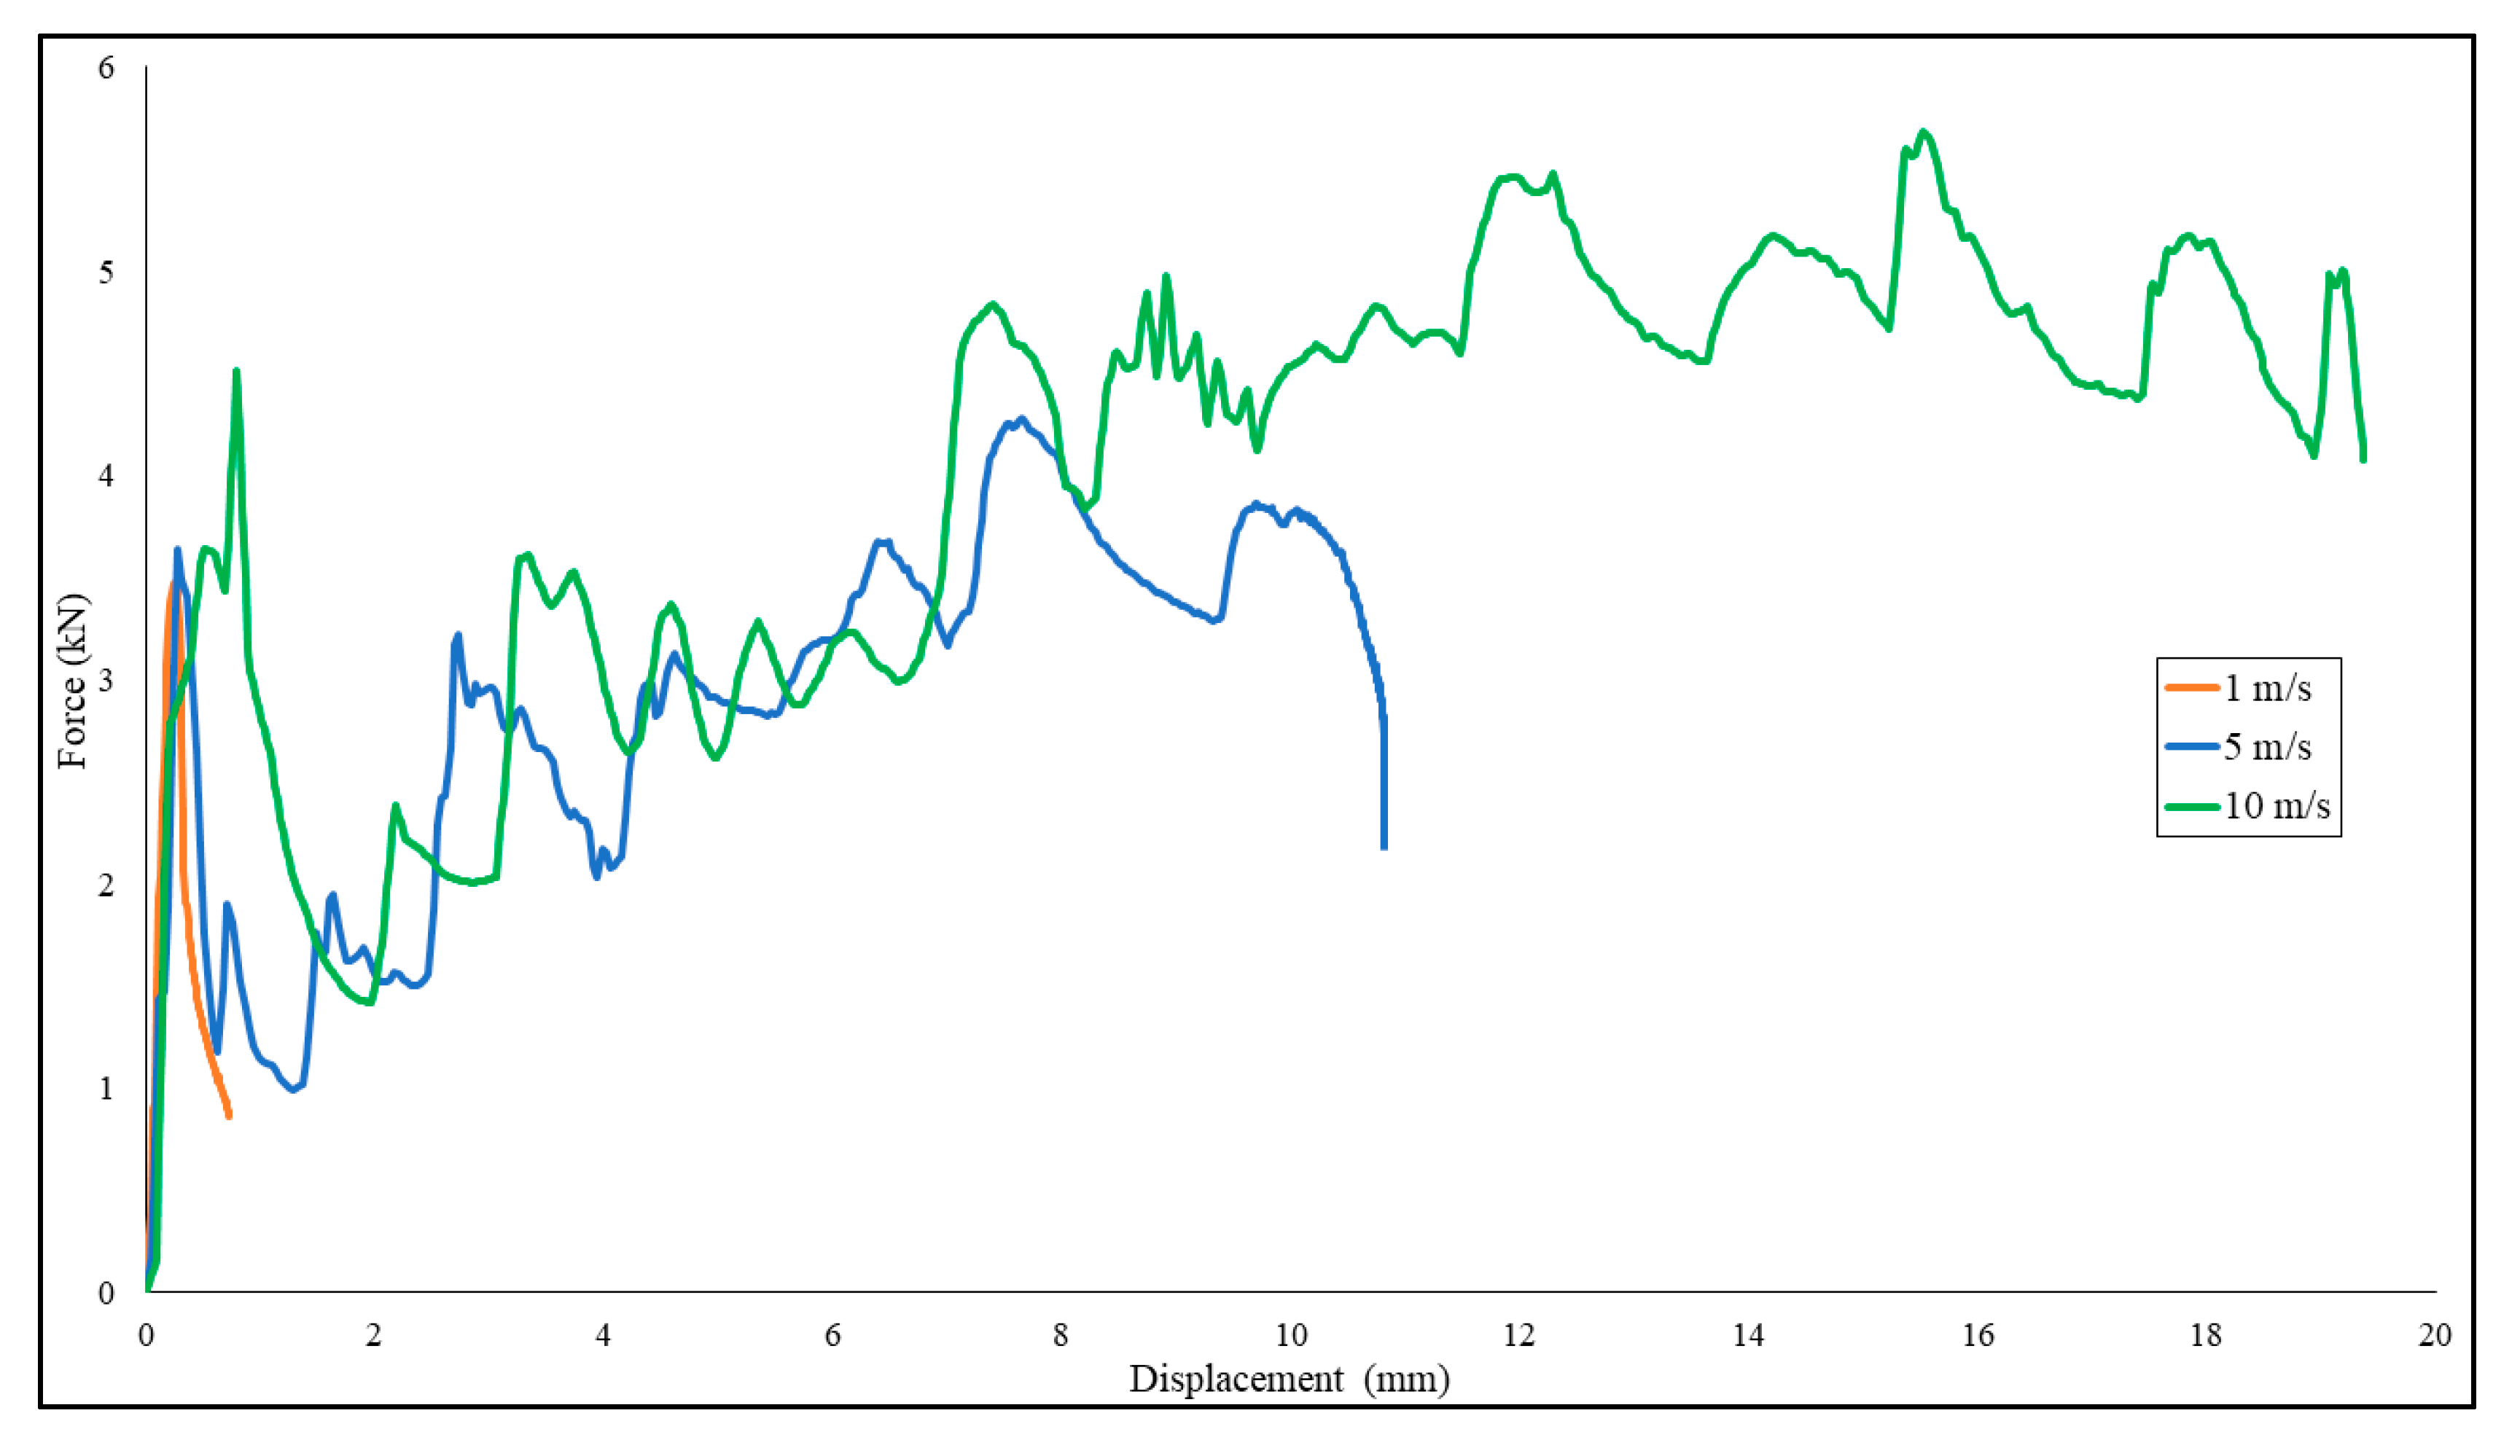
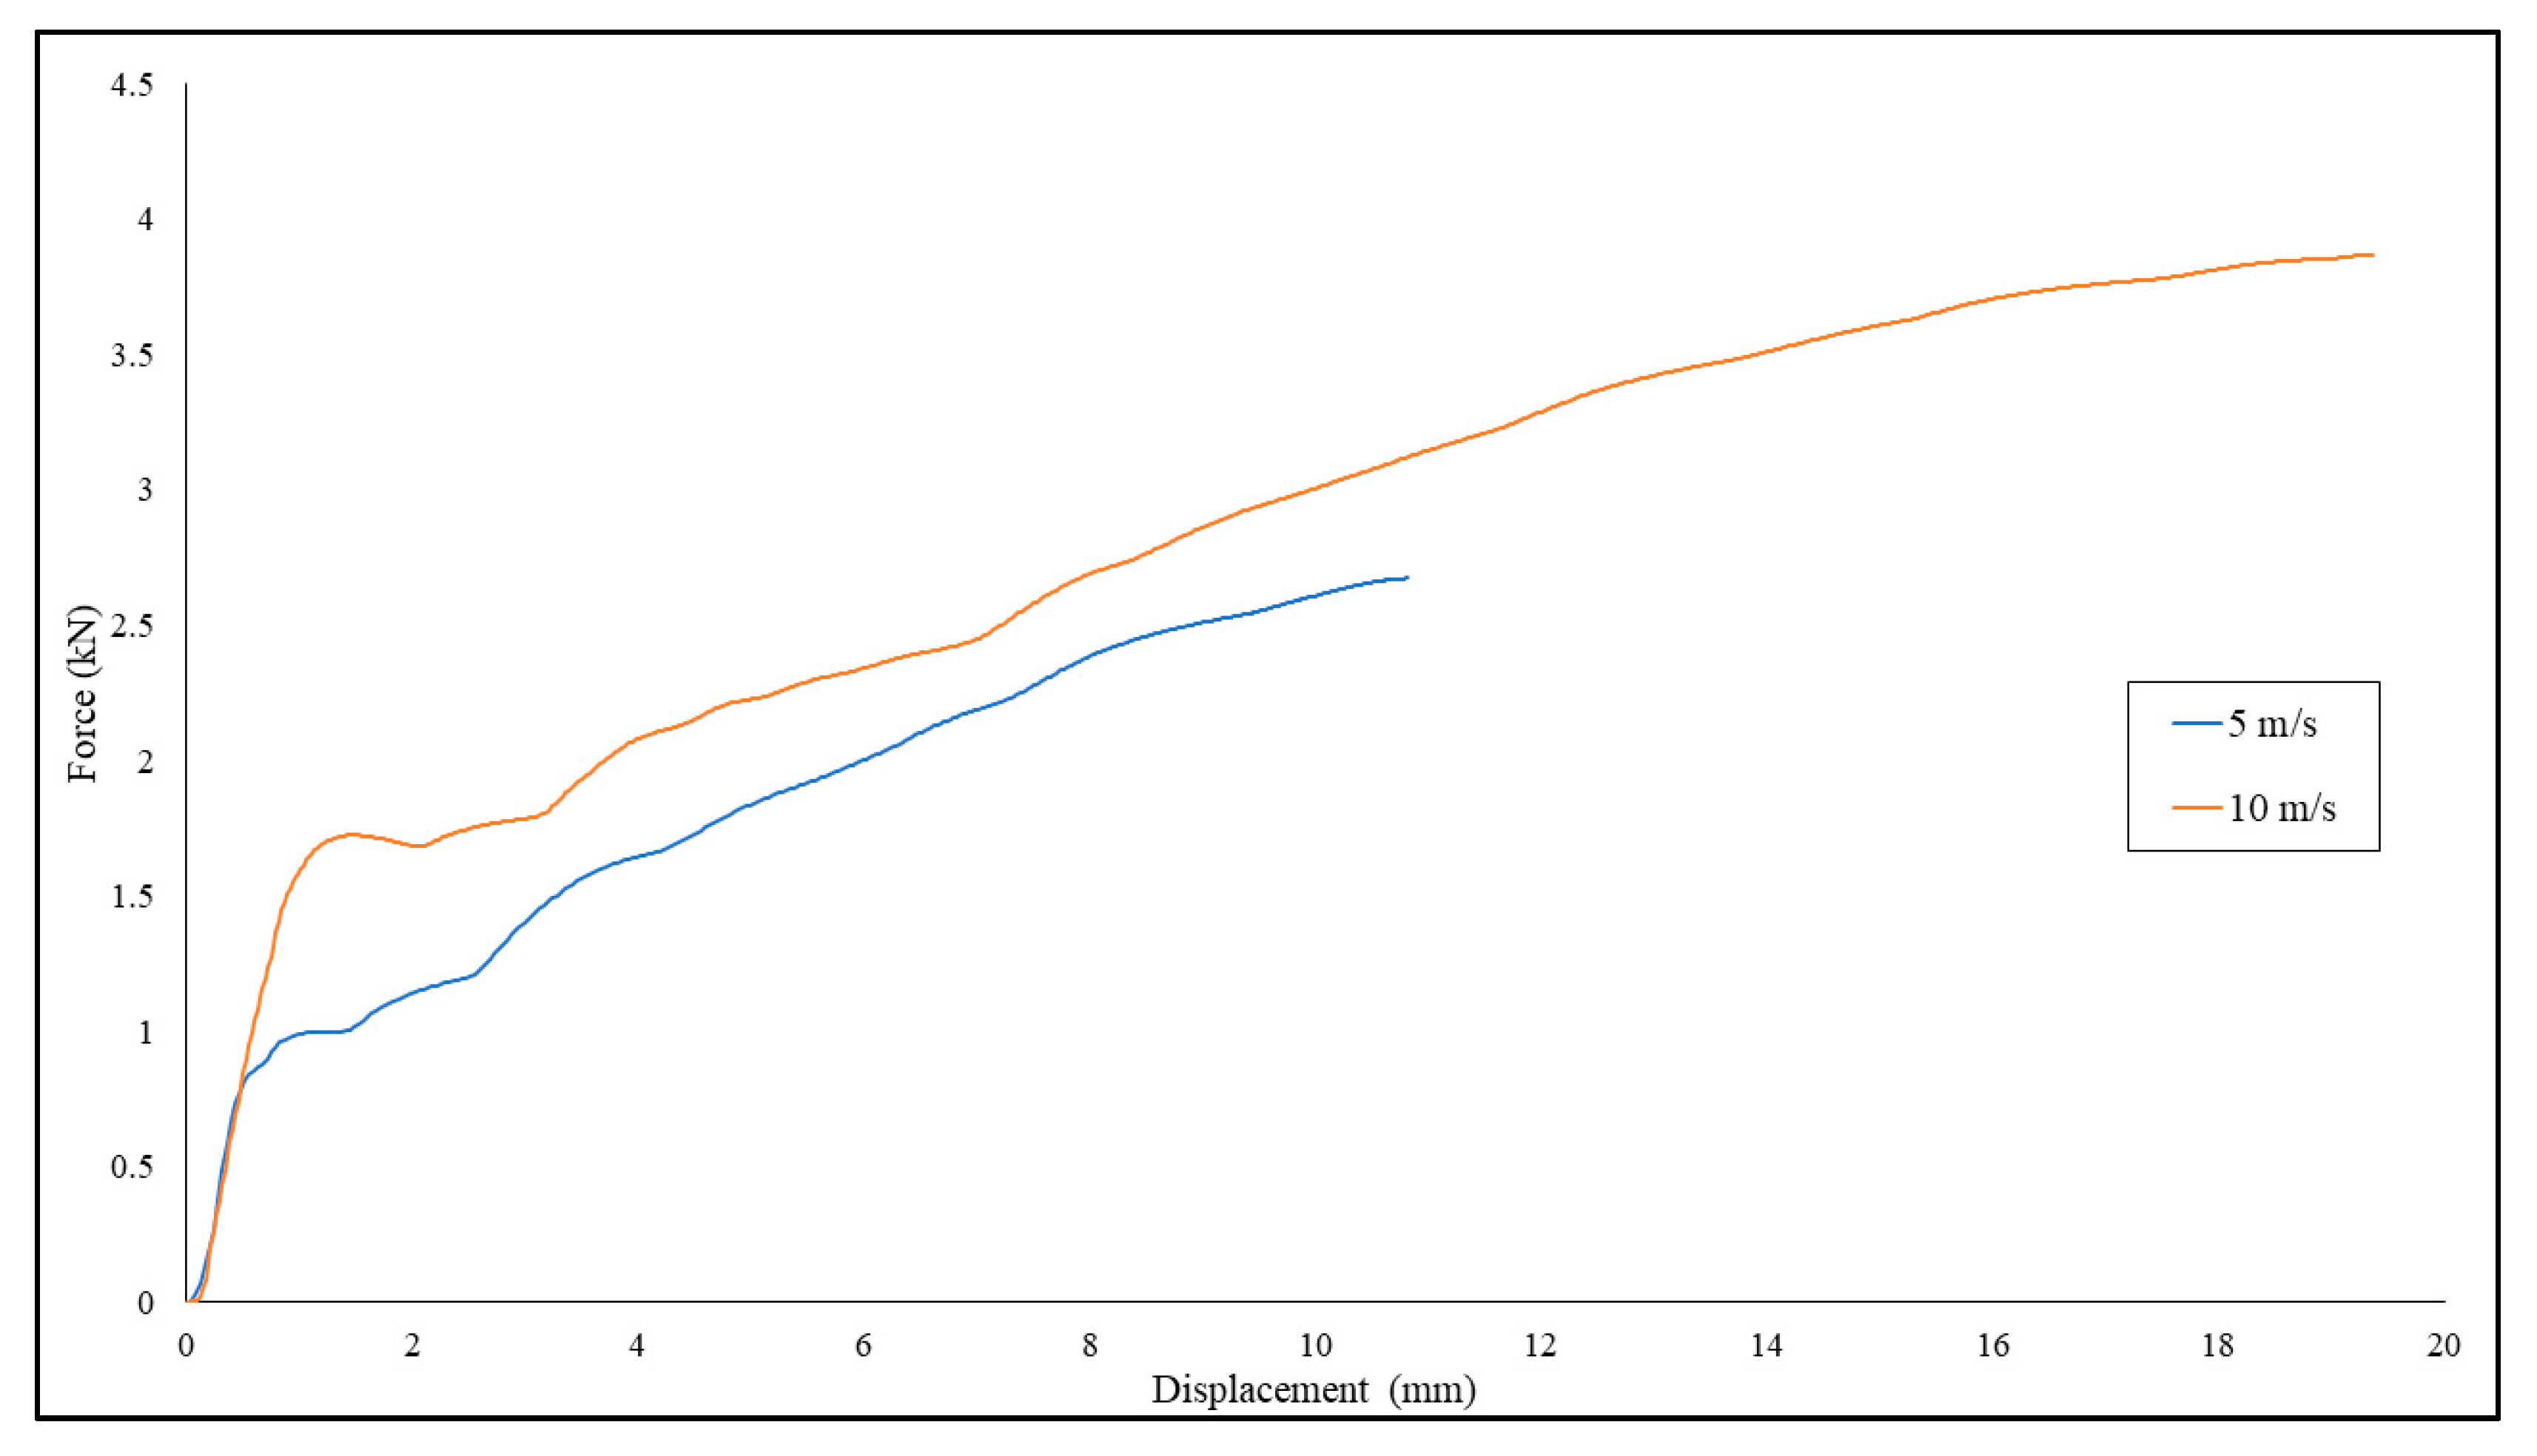
Compared to the conventional progressive buckling of a hollow, the force–displacement response of the battery upon axial impact loading does not show a steady rise and drop of the force. The curves shown in
Figure 21 have a trend of increased force response as the impactor pushes the battery further down. A similar trend was reported by Santosa et al. in a study of foam-filled sections where the force response increases with the application of foam with higher crushing strength [
28]. There is an increase of the force response between the 5 m/s model and the 10 m/s model, which comes from the casing and the jellyroll that is sensitive to the strain rate. The mean crushing force result shown in
Figure 22 confirmed that there is an increase of force response with the increase of loading speed as well.
5. Conclusion
This paper focused on the design and numerical simulation of the test for obtaining the stress–strain curves of the cylindrical battery. An SHPB setup was used to obtain the stress–strain curve of the jellyroll, and an SHTB setup was used to obtain the stress–strain curves of aluminum, copper, and steel, which are used as the basis for the electrodes and the casing of the cylindrical 18,650 Li-ion battery.
The proposed design and method used for SHTB testing have been shown to increase the measured strain amplitude on the transmitter bar. The amplitude of the wave is positively correlated with the increase of the amount of specimen used in the stacking. An increase of the stacks has been shown to not adversely affect the stress–strain result, which is important because if there is a significant variance of the result due to the stacking, the specimen stacking method cannot be used. A comparison between the result of the stacking method model and its equivalent thickness model in terms of transmitted strain shows no deviation, which implies that the equivalent thickness model can be used if the computational cost is limited. Variation of loading speed is also shown to increase the stress–strain response in accordance with the strain rate hardening.
For the SHPB simulation result, Fu-Chang foam and modified crushable foam could be used to model the strain-rate effect due to the dynamic compression. Fu-Chang foam could produce a better result in terms of the stress–strain curve than the modified crushable foam model compared to the experiment result. The unloading effect on the specimen right before the loading impulse is finished can be modeled using the Fu-Chang foam. However, further tuning is required to model the unloading phenomenon in accordance with the experiment results.
The result from the SHTB and SHPB simulation was used to develop the model for the axial impact loading. The result shows that the combination shell casing and the jellyroll behaved similar to a foam-filled section where the force response is increasing due to the resistance of the jellyroll. The slight increase of force response with higher loading speed was due to the strain rate sensitivity of both the shell casing and the jellyroll.
Further study and evaluation are required, since the simulation results need to be experimentally validated. The effect of manufacturing defects in the specimen is also necessary because the specimens simulated in this study were assumed to have no defect, and stress concentration on the holed area of the specimen should be considered since bearing failure could occur in that area. Application of higher loading speed should be evaluated, and the feasibility of the device to be tested at loading speeds higher than 20 m/s should be assessed as well. An axial impact experiment on the battery is necessary to validate the result of the SHPB simulation and the axial compression simulation.

 ,
, 


