Article

Photovoltaics- and Battery-Based Power Network as Sustainable Source of Electric Power

1
Holcombe Department of Electrical and Computer Engineering, Clemson University, Clemson, SC 29631, USA
2
Department of Automotive Engineering, Clemson University, Clemson, SC 29631, USA
3
Department of Finance, Clemson University, Clemson, SC 29631, USA
4
Department of Mechanical Engineering, Clemson University, Clemson, SC 29631, USA
5
School of Architecture, Clemson University, Clemson, SC 29631, USA
*
Author to whom correspondence should be addressed.
Energies 2020, 13(19), 5048; https://doi.org/10.3390/en13195048
Submission received: 9 August 2020 / Revised: 19 September 2020 / Accepted: 22 September 2020 / Published: 25 September 2020
(This article belongs to the Special Issue Assessment of Photovoltaic-Battery Systems)

Abstract

:
With the rise in the utilization of free fuel energy sources, namely solar and wind, across the globe, it has become necessary to study and implement models of a sustainable power network. This paper focuses on the design of a conceptual power network based on photovoltaics (PV) for power generation and lithium-ion batteries for storage. The power system showcases the various metrics that are involved in a grid-tied PV- and battery-based power network. It also encompasses the various design parameters and sizing considerations to design and conceptualize such a power network. The model focuses on the importance of the conservation of power by avoiding wastage of generated power through inverter sizing and design considerations. Finally, an economic and feasibility analysis is carried out to showcase the economic viability of the PV- and battery-based power network in today’s alternating current (AC)-based grid.

1. Introduction

Other than the human tragedy of the deaths of over three hundred thousand people all over the world, the recent coronavirus epidemic has had a dramatic impact on virtually every sector of the global economy. Oil companies are collapsing, but free fuel-based solar and wind energy systems keep growing [1]. In a post-pandemic world, renewable energy dominated by solar and wind is the only source of energy for building a sustainable world [1]. There is no direct competition between solar energy and wind energy [2]. In 2019, the world added 114.9 GW of photovoltaic systems and brought the world’s cumulative photovoltaic peak output to 629 GW [3]. Last year, 60.4 GW of wind energy capacity was installed globally and in 2019 the total capacity for wind energy globally was 651 GW [4]. Consistent with 2019 data, as shown in Figure 1 [5], in recent years, photovoltaics (PV) systems are growing faster than wind turbines. This trend is expected to continue in the future due to the fundamental advantages of PV systems over wind turbines, as stated earlier [6]. Constantly falling prices of electrical power generated by PV have provided a PV electrical power cost as low as 1.35 cents/kWh, which represents the lowest cost of electrical power generated by any other technique [7]. For storing electrical power generated by PV, lithium-ion batteries are emerging as the practical low-cost solution [8]. Due to the constantly falling prices of batteries, there are a number of power purchasing agreements (PPAs) in place with the cost of stored electric power being 2 cents/kWh [9]. PV generates direct current (DC) power, and battery systems store DC power. Today, except some inductive loads, all loads need DC power. By using DC power networks, capital cost and power savings are achieved [10]. It is expected that eventually a DC-powered world will emerge [11]. However, the current world is dominated by alternating current (AC) infrastructure. After the retirement of existing electricity infrastructure, there is a need to replace fossil fuel-based electrical power generation with PV- and battery-based power networks.
Several studies are being conducted on PV- and battery-based systems and how to incorporate them into the current AC grid. The increase in performance of hybrid microgrids (HMGs) can be seen in [12]. This HMG incorporates a PV and battery network into the AC utility grid through the utilization of DC buses and bidirectional converters. To connect to the AC grid, voltage and frequency regulation is required. Control strategies are being implemented to achieve frequency regulation through PV and battery systems and voltage regulation in their distributed network, as seen in [12]. In the absence of the utility grid, PV and battery systems must transition to standalone mode [13]. It can be seen from the results in [13] that the transition to standalone mode can be effectively carried out. Another important observation seen from [13] is that the PV and battery system could sufficiently meet the load demands in the absence of the grid. Thus, the attribution of the maximum utilization of PV-generated DC power is of utmost importance. Our paper emphasizes on the strategy to maximize this utilization in a test case scenario. Another important aspect of PV utilization is in the policy adaptation. According to [14], considering the reducing costs for PV generation and utilization, solar PV systems can be at par with conventional energy sources. Further, the solar PV industry is one of the largest employment-generating industries in the US [14]. Along with favorable public policies, the utilization of PV systems is only going to increase drastically. To support PV systems, intensive research is being carried out in the field of lithium-ion battery technology as well. The battery charging parameters, along with methods to improve their performance, are an active area of interest. As seen in [15] and [16], efforts to increase battery operation efficiencies under various operating conditions are predominant in the power sector research. Thus, this paper provides a holistic approach to a PV- and battery-based power network concept for the test case mentioned in the following paragraph.
According to the US Energy Information Administration (EIA), 10% of the total energy consumption in the commercial sector in 2012 was from educational buildings [17]. Further, educational institutions can lay the foundation for change in the adopted power networks. A 2019 report by the Frontier Group states that due to the geographically constrained structure for buildings in a university campus, the designing and modeling of a renewable energy-based power network is highly advantageous [18]. The report also states that the adoption of a renewable energy system will not only provide a playing field to facilitate the adoption of renewable energy for young talent but also create a trained and environmentally conscious future generation. Both these factors are highly essential to make a future of a renewable energy-driven power network a reality. As seen in [18], leading universities and colleges in the US are moving towards 100% renewable energy on campus. The Sustainable and Holistic Integration of Energy Storage and Solar PV (SHINES) is an initiative by the Department of Energy (DOE) to demonstrate the overall effectiveness of solar PV- and energy storage-based systems. The DOE’s Solar Technologies Office facilitates these programs with the aim of providing innovative and cost-effective solutions to modernize the electricity grid and maximize the incorporation of solar energy. Thus, the innovative concepts and economic viability of PV-based systems with storage are the need of the hour. Our work in this paper contributes towards this goal by creating the conceptual design of a PV- and battery-based power network for a university campus.
As part of the US Department of Energy Solar District Cup 2019 [19], our team participated in the competition. Using the data of New Mexico State University (per rules of the competition), in this paper we have shown that by using innovative concepts, we can economically implement a PV- and battery-based electrical power network for all the buildings. In Section 2, we describe the transformative role of a PV- and battery-based power network in the context of exiting electricity infrastructure. In the following section, we describe the key concepts of our model to conserve the power generated by PV. Details of the system design are described in Section 4. An economic and feasibility analysis is given in Section 5. Finally, the paper is concluded in Section 6.

2. Transformation of the Electric Power Grid by a Photovoltaics- and Batteries-Based Power Network

The traditional power grid is on the cusp of a disruptive transformation. Advancements in silicon PV technology and lithium (Li)-ion battery storage technology have spearheaded this transformation. The three major drivers of change in the electric power industry are digitization, decentralization and decarbonization. The traditionally independent domains of information technology (IT) and operational technology (OT) have now been integrated to ensure a data-driven energy infrastructure. Table 1 highlights the similarities between the complementary metal oxide silicon (CMOS)-based IT sector and PV-Li-ion-based power sector. Digitization by real-time monitoring and improved situational intelligence with internet of things (IoT) have led to the increased efficiency of the power network [20]. However, power conversion, distribution and long-haul transmission losses are still prevalent in the ageing grid infrastructure. The emergence of decentralized DC microgrids and nanogrids is the solution to mitigate these losses [8,10].
The traditional centralized power generation, transmission and distribution systems are being replaced with decentralized power systems. Grid penetration of free fuel-based solar energy has paved the way for localized power generation. This has given rise to prosumers—a consumer that not only consumes but also produces the electric power. Rooftop PV and battery storage networks are the primary source of distributed local power generation for prosumers. With widespread acceptance at the residential, commercial and utility levels, PV is the fastest growing power generation source. The total global solar capacity will increase four-fold from 629 GW at end of 2019 to 2.4 TW by 2030, making solar a tera-watt market within the next decade [25]. About 38% of the 2030 total power is expected to be small-scale or rooftop PV, as seen in Figure 2 [25], and 62% of utility-scale PV is expected with a capacity greater than 1MW. Small-scale or rooftop PV and commercial solar markets will see steeper growth with the advent of electric vehicles enabled with DC fast charging.
Silicon photovoltaic modules are highly reliable. Manufacturers will provide 30-years warranty. However, the useful life of these modules is more than 40 years. Sunpower has demonstrated that after 40 years, 99% of modules will have more than 70% power [26].

2.1. Cost Trends in PV and Battery Systems

Driven by advancements in the manufacturing technology of silicon modules and lithium-ion batteries (cost reduction and increase in energy density), the cost of a photovoltaic- and lithium-ion battery-based storage system is ready to provide electric power around the clock in almost every part of the globe. Volume manufacturing, similar to photovoltaic modules, is mainly responsible for the cost reduction of lithium-ion batteries. Doubling the volume of cumulative manufacturing leads to a cost reduction of about 22% in lithium-ion batteries [27]. Similar to gigawatt battery manufacturing facilities in Nevada, Tesla is setting up similar factories in China, Germany and other parts of the world [28]. Other companies such as Panasonic, North Volt, LG Chem and CATL have set up or are in the process of setting up similar large-scale battery manufacturing facilities in China, South Korea, Japan, Europe and the Unites States [29]. The long-term cost of supplying grid electricity from today’s lithium-ion batteries is falling even faster than expected, making them an increasingly cost-competitive alternative to natural gas-fired power plants across a number of key energy markets. As an example, on March 28, 2019, Florida Power and Light in the United States announced that it would retire two natural gas plants and replace those plants with what is likely to be world’s largest photovoltaic-powered battery bank when it is completed in 2021 [30]. Figure 3 shows the trend of the cost reduction of PV modules and lithium-ion batteries [31,32].
For reducing system costs and the initial upfront capital investment, the global PV industry is rapidly moving towards high-performance modules. Recently, one manufacturer has announced 21.6% PV modules with power output of 580W, which is 40% higher than current mainstream products installed in utility projects [33]. Photovoltaic modules based on the concept of multi-junction, multi-terminal photovoltaic modules (without the use of III-V compound semiconductors) have the potential of providing 35% efficiency and generating electric power at a cost of less than 1 cent per kWh [34]. However, even in the absence of any major innovation such as 35% silicon-based multi-junction solar cells, the industry has several innovative concepts in the pipeline that will continue to provide an incremental cost reduction of PV modules [35]. Similar to the cost reduction approach of integrated circuits and liquid-crystal display industries, one such idea is to increase the size of wafers to 12-inch squares [35].
A number of innovative manufacturing steps are in progress that will further reduce the capital cost of lithium-ion batteries [36]. As an example, the capital cost of CATL’s cobalt-free lithium iron phosphate battery packs has fallen below USD 80/kWh [37]. In a recent patent, Tesla announced a new “tables” battery cell design that will further reduce the manufacturing cost [38]. Although no one has reported manufacturing cost and performance data, solid-state lithium batteries have the potential for further cost reduction.

2.2. Environmental Benefits of Sustainable Power Generation with PV and Battery System

Increased use of solar and wind power and electrification of transportation will have a major impact on solving climate-related challenges that includes reduced greenhouse gas (GHG) emissions. Solar and wind energy penetration led by PV and electrification of the transportation sector will account for 75% of GHG emission reductions as aimed by the Paris Agreement targets by 2050 [23]. It is essential to reduce the carbon footprint of the fossil fuel-based energy sector in order to achieve cleaner and sustainable power generation. Accelerating solar PV and wind energy are the two most viable RES that can curb emissions significantly. PV alone can cut energy-related CO2 emissions by 21% by 2050 [23].
Electric power generation by fossil fuel and nuclear has tremendous water usage. Most of the fossil fuel-based power generation requires water throughout the lifecycle of the energy infrastructure for extraction, purification, washing and treatment of raw materials like coal, oil and natural gas. Water is also extensively used as a coolant in nuclear and thermal power plants. Nearly a quarter of the world’s population is headed towards a water crisis [39]. Free fuel-based solar PV can significantly reduce the water consumption for electric power generation. Solar and wind account for 225–520 and 55–100 G/MWh water consumption for each MWh of electrical power generation as opposed to 20,000–50,000 G/MWh for coal and nuclear and 2,000,000–10,000,000 G/MWh for natural gas-based electrical power generation [40]. Utilizing PV power for electrical power generation thus has a negligible impact on both carbon emissions and global water usage, thereby having a major impact in solving climate-related challenges.

3. Maximum Utilization of Power Generated by PV System

Alternating current (AC) has been dominating power networks ever since it won the battle against DC networks in the late 19th century. Long distance transmission of electricity was possible with AC using transformers that could step up/down the voltages. However, the scenario is changing today. Local generation of DC power eliminates the long-haul transmission and saves capital cost and power [8,10]. Photovoltaics generates DC power and batteries store DC power. Therefore, it is important to avoid the wastage of DC power due to conversion to AC for the given power network. In this section, we discuss the two main considerations in our model to maximize utilization of DC power in current AC power networks. Inverter sizing factors greatly impact the utilization of DC power and this is discussed in Section 3.1. As discussed in Section 3.2, additional energy can be saved by using a different photovoltaics, battery and inverter architecture than current practice.

3.1. Inverter Sizing Considerations

Driven by profitability in a short period of five years, large industrial- and utility-scale ground-mounted PV systems use a DC/AC ratio in the range of 1.5–1.6 [41]. Knowing the lifetime of PV systems of at least 30 years, this approach is a pure waste of solar power. For this reason, we are not using any inverter clipping [41]. The DC/AC ratio is maintained approximately at 1 to avoid any wastage of power generated by PV. However, the losses incurred due to power conversion from DC to AC are still taken into consideration. In our design, the inverter types which are considered are of two types, microinverters, and industrial-grade string inverters. The STP-33-US-41 industrial inverter is the industrial-grade inverter considered for the PV farm operation. A summary of the inverter specifications can be found in Table 2. The full specification sheet can be found at [42].
As seen in Table 2, the rated efficiency for the inverter is 97.5%. More design considerations can be found in the following section. Figure 4 [43] shows the range of efficiencies for operating power and input voltages. The efficiency graph is considered for a similar 50 kW inverter as used in our system. The specifications for this inverter can be found in [43]. A 92% value accounts for the losses incurred due to operating the inverter close to the sizing factor of 1. Thus, our design is underestimated for the operation of the inverter even at 0% input power. The minimum efficiency at 0% power is rated at 96%, while our consideration is at 92% to account for the sizing factor and other losses. The utilization of microinverters for rooftop systems and high-efficiency string inverters for the ground-mounted PV systems enables the system to maintain this sizing factor. The microinverters enable a conversion efficiency of 95% to 96%, as seen in Section 4.2. This sizing factor also ensures that the problem of hyper-clipping can be avoided. Hyper-clipping can occur in inverters due to oversizing them, where the inverters operate at zero power instead of clipping and operating at 80% power [44]. Even though this event is less frequent overall, in regions with good sunlight it can lead to substantial losses due to zero power outputs during peak sun hours [44]. The overall gain in power by oversizing the inverter system is not comparable to the power savings by avoiding clipping the peak power in our system. Since our total power output is not entirely attributed to the load, an inverter sizing close to 1 is most efficient for our system. The inclusion of battery systems is discussed further in the following sub-section.

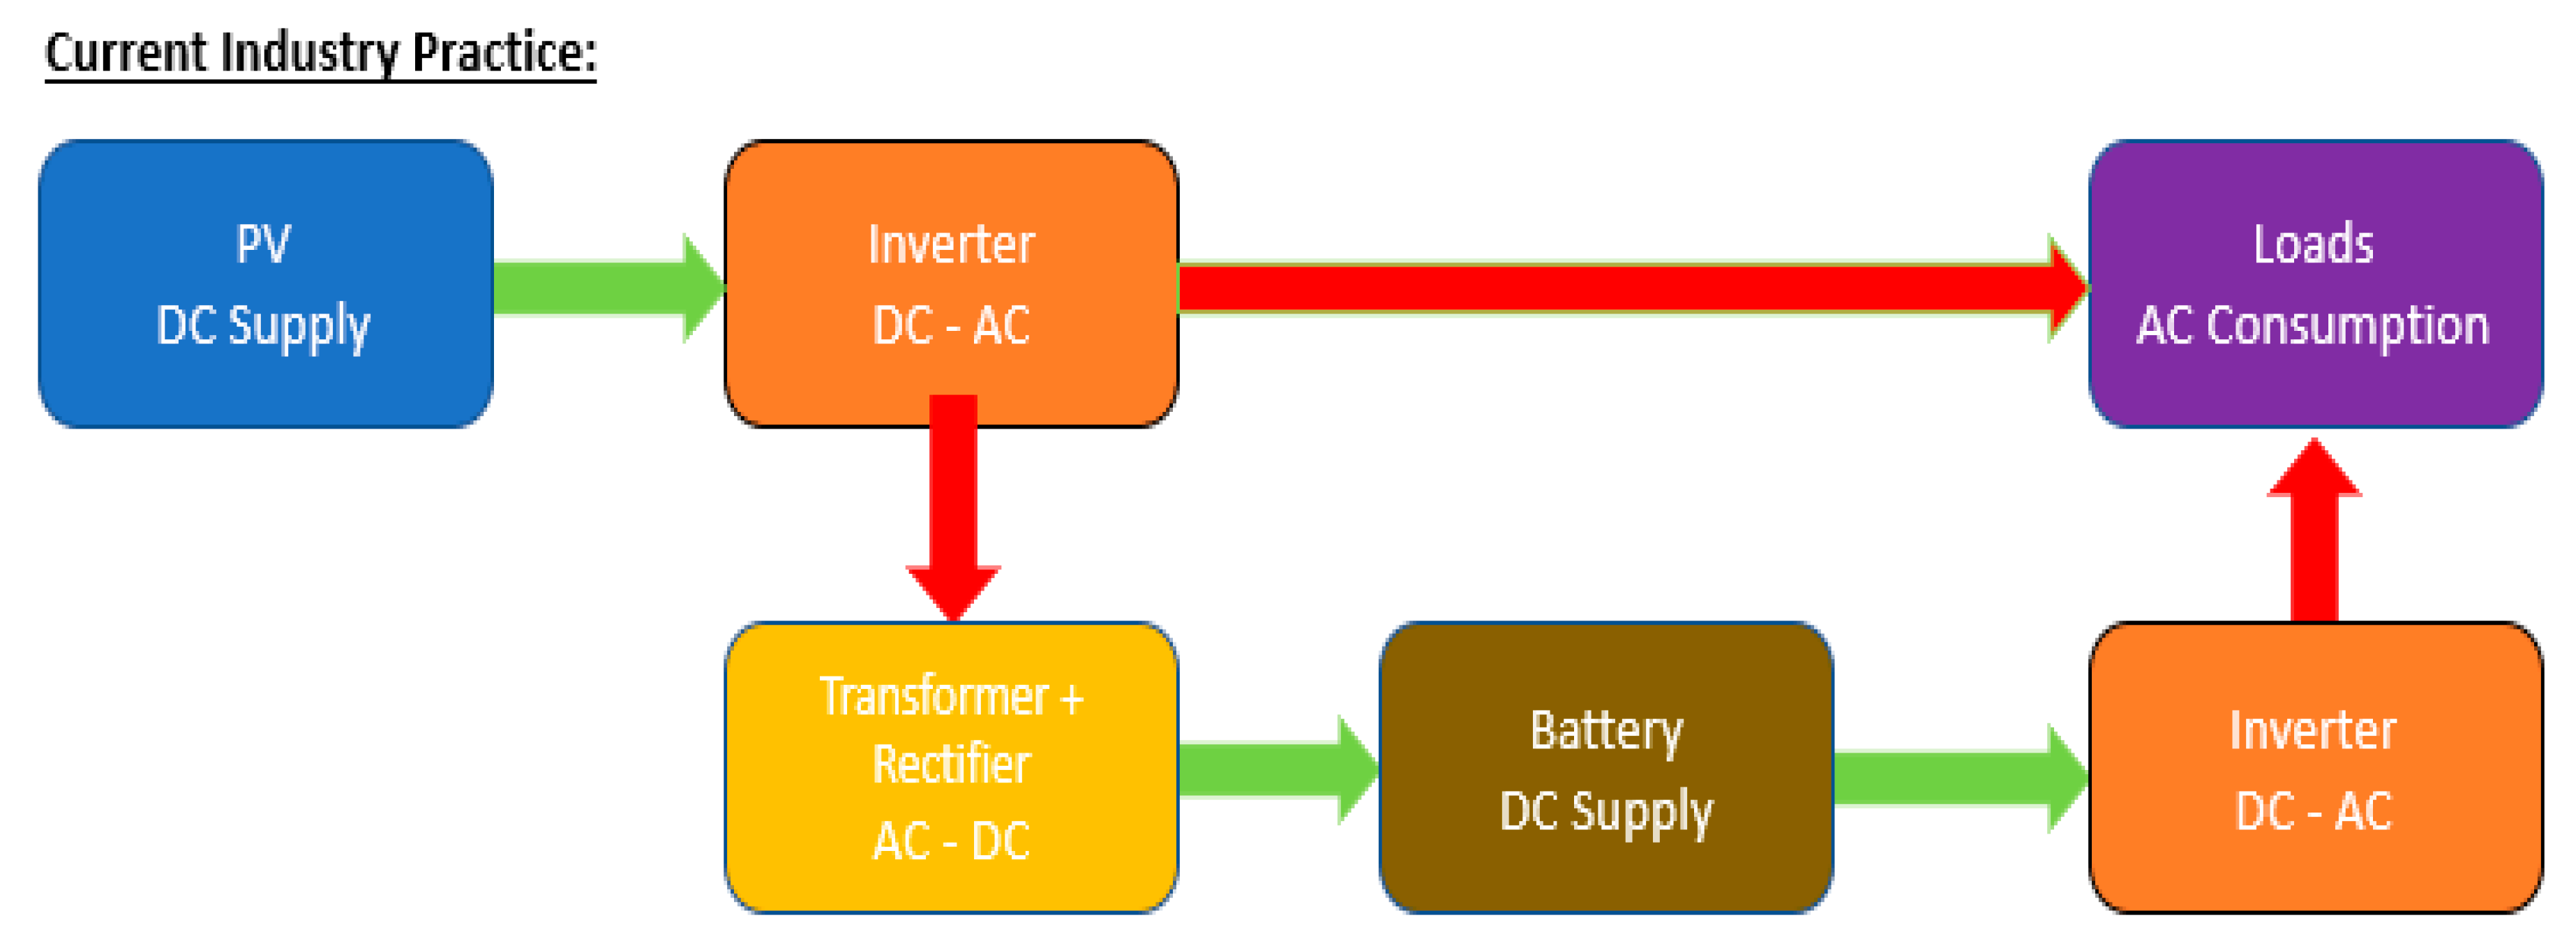
3.2. Proposed Inverter Architecture to Maximize DC Power Utilization

Grid-tied PV systems are directly connected to an inverter which transfers the excess PV power not used by local loads directly to the grid. In this scenario, there are no battery systems involved. The PV power generation is monitored and balanced with the consumption through the utility. However, if battery systems are to be incorporated, Figure 5 shows the current industry practice. Special inverters are placed at the output of the PV panels that convert the AC power back to DC for charging the batteries. Such inverters are called hybrid inverters [45]. Hybrid inverters are designed to work with battery solutions for grid-outage scenarios. However, due to this implementation strategy, DC power is wasted in the conversion from DC to AC, AC to DC and DC to AC power. Since, the PV output power is DC power and batteries also consume DC power for charging, a lot of energy can be saved by adopting our proposed design system, as shown in Figure 6.
In the proposed PV- and battery-based power network, a significant portion (60%) of the power of the rooftop PV system is dedicated to battery charging before converting to AC power. Even at the solar farm level, the battery bank charging is prioritized before the generated excess power is converted to AC to be sold to the grid. Ideally, a DC power network consisting of PV for DC generation, a battery for DC storage and DC loads will be a more efficient system than the existing grid [8]. However, this imminent shift to a complete DC network with the conversion to a few AC loads will take some time [11]. This is due to the fact that the world today is based on AC power infrastructure. At this point, the incorporation of DC power into the AC grid is the key to the oncoming paradigm shift. Hence, it is necessary to conserve DC power and avoid power losses as much as possible. The intelligent charge controller shown in Figure 5 can decide the amount of power that should be transferred directly to batteries without unnecessary power conversion steps.

4. Design Considerations

There are numerous design considerations for the simulated model of an AC power network based on PV and batteries for a university campus. The university’s load requirements are substantiated into 10 buildings. Our design implements the power network shown in Figure 7.

4.1. Geographical Considerations

The location of our case study is Las Cruces, New Mexico, USA. The preliminary step is to calculate the daily irradiance for this region. A solar chart is included in Figure 8 [46]. The solar chart shows the movements of the sun for the specified area. The daily irradiance values were based off the solar irradiance calculator given in Reference [47]. The PV panel output profile was then temperature-compensated to increase the accuracy of our model.
A comparison of the PV panel output profiles, before and after temperature compensation, is shown in Figure 9. The temperature of solar panels is compensated using the following formula:
Temperature-compensated efficiency = Panel efficiency + {(Testing temperature − temperature) × temperature_Power_derate_factor,
The values for the terms used in Equation (1) are given in the panel ratings in the following section. An interesting observation derived from Figure 9 is that when the intensity of the sun is low, the temperature is also low. Thus, the PV panel exhibits more power efficiency during these days of low-intensity sunlight. The daily average temperature is compensated into the PV panel output calculations to find realistic PV outputs.
Another geographical consideration is the tilt angle for the installed panels. The tilt angle was calculated from the declination angle and altitude angle using the following equations:
Declination angle = 23.45 ∗ sin {360/365 (n − 81)}
Altitude angle = 90 − L + Declination angle
Tilt = 90 − Altitude angle
where n = day number in a year;
L = latitude co-ordinate.
The tilt angle is considered after taking the average of the calculated tilt angles for 365 days in a year for each month. A clear separation of the tilt angle for summer and winter was observed based on the calculated monthly average values. The summer and winter values for the tilt angle are 18° and 47°, respectively. The tilt angle produces significant differences in the amount of power produced by the panel for the given amount of sun hours.

4.2. Ratings and Parameters for Equipment

The goal of this simulation is to emphasize the maximum utilization of DC power even in an AC power network, as discussed in Section 3. Thus, the equipment chosen for our model was with respect to maximizing utilization of DC power by minimizing conversion losses. The PV panels used were the SunPower® X-Series: X22-370. The parameters for the panel can be found in reference [48]. These panels are equipped with microinverters that can be integrated perfectly for rooftop utilization. The PV farm, as shown in Figure 6, must be equipped with string inverters due to greater power handling capabilities. The panels at the solar farm were rated at a high peak power of 470 W [49], which yielded a total number of 17,403 panels for the entire NMSU campus via the following equation:
Number of panels = Total DC PV power [kW]/Peak power of PV panel [kW]
Modules per string = MPP/VMPP
For the smaller rooftop application, ease of installation, and reliability, high-efficiency (22.7%) residential panels with built-in microinverters were deemed the top choice. The use of these smart panels complies with the different restrictions that rooftop grids require in the state of New Mexico. Rated at 370 W, about 11,606 panels were needed with the same number of microinverters pre-installed. Matching the commercial-grade panels to a commercial-grade inverter with a high upper limit of the rated MPP voltage range was critical for the grid design. By calculating the modules per string for the low MPP and high MPP values using Equation (4), an operating range of between 5 and 11 modules per string can be determined. To safely size-up our connections according to industry standards and account for efficiency drops as a result of the temperature, nine modules per string was the most appropriate size. Our inverter can support up to 12 strings as seen in [42]. Thus, using the obtained number of panels for the rooftop and PV farm, a summary of our calculated results is shown in Table 3. A lithium ferro phosphate (LFP) battery bank is also incorporated into the network. The battery specifications for the design considerations can be found in [50].

4.3. Sizing Considerations

The sizing considerations are taken into account for operation in a MATLAB code simulated for the provided data. The assumptions for the MATLAB code can be found in Appendix A. Figure 10 shows the flow chart of the MATLAB code. The rooftop PV panels were sized at 80% of the available rooftop area. The utilization of only 80% of the total available area considers the losses due to shading, mismatch, etc. The rooftop PV is thus sized at 4.2 MW, as seen from Table 4. Keeping this in mind, the load and battery systems, and the power network system were designed considering a 60%-40% sizing approach. A total of 60% of the power from the rooftop PV panels was dedicated to battery charging at the building level. The remaining 40% was given directly to meet the load requirement. The load deficit during the day is met by the PV farm. The power produced by the farm is first dedicated to meeting the local load demand, then charging farm batteries and, in the end, charging batteries of buildings. Any surplus power can be sold to the utility. Any power shortage in our system will be provided by the power purchased from the utility. The 60%-40% number was optimized after several trials and test values. The goal for sizing the PV and battery is to minimize the cost of power purchased from the utility, maximize the utilization of DC power in our power network and minimize electricity bills paid by the university.
Owing to the 60-40 approach, the farm is sized to 8 MW to fulfil the daytime load requirement. The battery systems are sized to minimize costs and maximize DC utilization. The battery banks at the building and farm ensure the availability of power during grid-outage periods and reduce the amount of energy consumed from the grid during the peak load hours in the evening. Solar intensity is at its lowest during early morning and late evening hours, which consist of some peak load hours. The battery banks at the buildings and the farm are sized with the consideration to supply power during these peak hours. According to the El Paso Electric Company (utility of the concerned area), the selling rates for the surplus PV-generated power is priced at USD 0.052/kWh, USD 0.079/kWh, USD 0.121/kWh and USD 0.036/kWh, respectively, for on-peak hours (June through September) and USD 0.03/kWh on an average for off-peak hours. The on-peak hours are described by the utility from 12 p.m. to 6 p.m. during Monday to Friday for the months of June through September. The rest of the hours throughout the year are defined as off-peak hours. The system is scaled to generate surplus power for approximately half the year. Generating a surplus for the entire year will ultimately oversize the PV system and will lead to a loss in the total economic viability when compared to purchasing power directly from the utility. The surplus PV power is generated during the day during the on-peak hours. However, as the utility has incentivized on-peak selling for four months, the remaining eight months are compensated at a much lower rate. The self-consumption quota is estimated with the aim of maximizing utilization of the surplus PV-generated power for the majority of the year. Therefore, the total building battery bank was sized at 12 MWh and the farm battery bank was sized at 35 MWh. The size of the battery bank can be adjusted according to the incentives given by the utility for selling power. A complete simulated power model for one year can be seen in Figure 11. The sizing considerations are comprehensive as they take into account the losses due to transmission and distribution, power conversion from DC to AC and battery cycling.

5. Economic and Feasibility Analysis

The levelized cost of electricity (LCOE) is an unstandardized model used to make an economic assessment of the cost of electric power generated by a specific energy source. LCOE models are often filled with assumptions (what people believe) instead of field data, and even when field data are used, the generated forecast is based on assumptions (beliefs) [51]. The major flaws of LCOE models are: (i) in place of data, assumptions are used, (ii) data are used that support the modeler’s goal, (iii) model inputs are adjusted to make a particular point and (iv) the assumption that the cost and price are synonymous [51]. For these reasons, we are not going to use LCOE for the economic and feasibility analysis.
As stated before, in addition to having photovoltaic modules on the roof of the buildings, we have a solar farm of the size of 8 MW on the university property. Batteries were used in each building as well as with the solar farm. The total size of batteries is 47 MWh. On the days the power network does not have enough power to meet the load demand, the required power will be obtained from the utility. On the days the power network has extra power, the utility will be the buyer of the power. The rates of buying power and selling power are calculated according to data supplied by the utility.
Two cases of financial analysis were used. In one case, the university is the owner of the PV- and battery-based power network. The rates of buying power from the utility and selling power to the utility are according to the data supplied by the utility. Figure 12 represents this case. In the second case, either the utility or some third party is the owner of the power network. A power purchasing agreement (PPA) is generated between all three parties (university, utility and investor). If the utility is the investor, then the PPA is between only two parties. Figure 13 represents the case of a PPA.
Various data used in the financial analysis are given below:
  • According to a recent article of December 2019, the cost of a DC power PV system has gone as low as USD 0.7 per watt [52]. In our case, we have 12.2 MW DC power and the cost can be as low as USD 8.54 million. For an AC system, the cost of the inverter must be added. According to [53], the cost of an inverter in 2018 was USD 0.06153 per watt. Therefore, we can assume an inverter cost of USD 0.06 per watt in 2020. Thus, the PV system cost with AC power becomes USD 0.76 per watt. In addition to the PV system cost, one must consider the legal fees, project management cost, fencing, interconnection fee, construction, etc. On 20 November 2019, the El Paso Electric Company applied for expedited approval of a certificate of public convenience and necessity (CNN) and for a special rate contract to construct a solar generation/storage project at New Mexico State University [54]. The cost of a ground-mounted single-axis 3 MW PV system is USD 4,301,797 and the 4 MWh battery system cost is USD 1,969,000, while the total PV and storage system cost is USD 6,284,580. The overall project cost is USD 7,838,226, which means that additional costs of legal fees, project management, fencing, interconnection fee, etc., for a project of the size of a 3 MW PV system and 4 MWh battery system is 24.7%. Since our project size is much larger than the case of reference [54], we will use 20% additional cost of the project. Thus, adding an additional 20% to the cost of USD 0.76 per AC watt provides the total cost of the AC system of USD 0.91 per watt. To be extremely conservative, we have used USD 1 per watt (AC power output) that covers all PV installed and operating system costs.
  • The lithium-ion batteries cost also keeps falling in line with the cost reduction of PV modules [55]. Based on very recent (3 December 2019) cost data published by Bloomberg New Energy Finance [32], the average battery pack capital cost in the years 2020 and 2030 is expected to be USD 144 and USD 61 per kWh, respectively.
  • Although the lifetime expectancy of lithium-ion batteries can be as much as 12 years [56], we have used the manufacturer’s warranty [57] of 10 years in our calculations. In year 11, new batteries are installed, and their cost is included in the financial calculations.
  • Depending on the type of inverter (microinverter, central inverter or string inverter), the warranty can vary from 12 to 25 years [58]. We have chosen 15-years warranty in our calculations, since the quality of inverters is improving, and the cost of inverters is also constantly reducing. Based on 2017 data, the inverter cost is USD 0.06153 per watt [53]. In the year 2035, we expect that the cost will be reduced to USD 0.03 per watt. This is the cost we have used in our model to replace inverters in year 15.
  • In line with the current debt rate for state universities in the United States, we have used a 4.00% debt rate.
  • The investment tax credit (ITC), also known as the federal solar tax credit, allows one to deduct 26% of the cost of installing a solar energy system from their federal taxes. The ITC applies to both residential and commercial systems, and there is no cap on its value [59]. We have assumed that the utility or private investor pays enough federal taxes and all the 26% of the system cost can be deduced in year 1. After year 7 (no more equipment depreciation), the federal and state taxes are paid.
  • In the estimation of the depreciation cost of the PV system, 70% is the hardware cost. For the battery system, the hardware cost is 90%.
  • We have used the PPA cost of USD 0.04 per kWh in our analysis. The PPA cost is in line with large-scale utility projects in the United States. The main reason for the low cost is the falling cost of PV modules and batteries. As an example, Los Angeles Department of Water and Power has signed a groundbreaking 25-year PPA with 8Minute Solar [60]. The combined price for solar energy plus storage is just 3.3 cents per kWh, the lowest ever in the US and cheaper than electricity from a natural gas-powered generating plant [60].
  • Utility rate enhancement of 2% per year is used in our financial model.
  • As per the rules of the Solar District Cup, financial calculations are done for 20 years.
As shown in Figure 12 and Figure 13, we have used two different scenarios in our financial model. In the first case, the university is the owner of the power network. The 12.2 MW DC system and 47 MWh battery storage system provide most of the power to all the buildings and have surplus most of the time and deficit sometimes. During the times of deficit or surplus, the utility is the seller or buyer of the power as per the rates described by the utility. As per the current agreement with the utility, the total amount paid by the university to the utility over 20 years is USD 28,872,525. In the first scenario, the university can save money in the amount of USD 7,380,148.
In the second case, either the utility or a third party (investor) is the owner of the power network. Like the previous case, the power network generates most of the clean power and any deficiency is covered by purchasing power from the utility. A PPA is generated between two or three parties (depending if the utility is the investor or not). Since we do not have the balance sheet and tax details of the utility or investor, we have assumed that the investment is done on this project, and for tax calculation purposes, no other income of the investor is added. As stated before, we have used a PPA of 4.0 cents per kWh for 20 years. At this price, the university buys all the electrical power for 20 years. In this case, the investor profit is USD 1.7 million, and the university saves USD 4.2 million. The summary of both financial models is given below in Table 5.
As was discussed in Section 2, the useful life of a PV system is 40 years. Thus, the power generated beyond the 20-years calculations shown here will make the project highly profitable to the owner of the power network. Thus, in addition to addressing the climate-related challenges, the use of a PV- and battery-based power system is driven by economic advantages.

6. Conclusions

The conservation of power is of prime importance when designing novel power networks or while integrating renewable systems to the current power grid. Thus, the importance of DC power and its maximum utilization is of utmost relevance. The power network for the future requires to be clean, sustainable, reliable and low-cost. The implementation of a PV- and battery-based power network should encompass only DC power flow for future systems to minimize the wastage of power. In lieu with current established AC-based power networks, the incorporation of PV and battery systems must focus on maximum utilization of DC power as well. However, the trend today is focused on incorporating PV and batteries to maximize the sustainability of the AC grid. Thus, the simulated model implements the design and economic viability of a power network focused on the conservation of power with economic benefits.
Free fuel-based PV-generated electric power at the utility scale plummeted to 1.5 cents per kWh in the United States [61] and 1.32 cents per kWh in Europe [62], which represent the lowest costs of electrical power generated by any other energy conversion technique. Due to the increasing manufacturing capacity and other efficiency gains, the lithium-ion batteries cost also keeps falling in line with the cost reduction of PV modules. This reduction in battery cost is fueled by the increasing demand for electric vehicles across the globe as well as stationary storage. For a four-hour battery storage, NextEra Energy recently reported a battery storage cost of 0.8 to 1.4 cents/kWh [63]. That number should keep declining over the next few years as the industry builds more manufacturing capacity and benefits from its increased scale and is projected to be down to 0.4 to 0.9 cents/kWh by 2022 [63]. Similar to the cost reduction of computing at large scale to computing at the smart phone scale, we expect a major cost reduction in battery storage both at the utility scale as well as at the distributed power level. The cost trends of PV and battery systems are a clear indication of the future power network. PV along with batteries can become the next self-sufficient and clean power network for fulfilling 24/7 power needs at the lowest cost of 2–3 cents per kWh. The future scope in this project would lead to the inclusion of an intelligent artificial intelligence (AI)-based energy management system to control charging/discharging mechanisms for the battery storage system. With the increase in reliability and efficiency of the distributed power network, the need for a centralized power network is greatly reduced. Decentralized power systems are advantageous over centralized power systems in terms of flexibility, control, scalability and reliability [64]. PV- and battery-based networks can enable the realization of such decentralized power networks. In our system, even with the consideration of an AC grid-tied PV and battery network, the cost savings are showcased in Section 5. With a further decrease in the costs of PV and battery systems (according to the current industry trend), our project will show a further increase in costs savings for the university. As mentioned in Section 1, the university use case is an effective demonstration platform to showcase the future scope of our power network. The goal would be to realize a distributed power network based on PV and a battery which is completely disjoint with the current AC network. Such a power network can be supported with the inclusion of DC loads to achieve maximum efficiency in power utilization.

Author Contributions

Conceptualization: P.P., V.P. and R.S.; methodology: B.H., P.L., M.A. and D.C.; software: P.P., V.P., B.H., M.A. and J.K.; validation: A.C. and D.P. (Dhruval Patel); investigation: Z.S., T.B., K.J. and D.P. (Dalton Pumputis); resources: J.F.; writing—original draft preparation, P.P. and V.P.; writing—review and editing, R.S.; supervision, R.S.; project administration, R.S. All authors have read and agreed to the published version of the manuscript.

Funding

This research received no external funding.

Acknowledgments

As part of US Department of Energy Solar District Cup 2019, our team (authors) participated in the competition. The data utilized for the simulation is of New Mexico State University (per rules of the competition). Permission was obtained to use the data of New Mexico State University for publication. Thanks to Tony Putnam Director of Utility Service at Clemson University for many valuable suggestions.

Conflicts of Interest

The authors declare no conflict of interest.

Appendix A

The following are the key assumptions used in the MATLAB simulation:
  • The available rooftop area for PV panel installation on buildings is 80% of the provided area as justified in the text. The farm area is considered at 37,384 m2 to provide the sizing of an 8 MW system.
  • The battery capacities chosen according to the sizing considerations are 12,000 kWh for the buildings and 35,000 kWh for the PV farm. These considerations are obtained through varying several values for the batteries in the given flowchart in Figure 8.
  • The minimum state of charge (SOC) is rated at 20% of the battery charge level and the maximum SOC is rated at 100% of the battery capacity as modern batteries are equipped to operate at such ratings.
  • The PV generation data are generated through the irradiance in the region. After temperature compensation is carried out for the panels, as described in Section 4.1, the panel output is obtained by multiplying the efficiency of the panel (22.1%, according to the data sheet in [24,25]). This obtained output is for per m2 of the panel. The final PV generation is obtained by multiplying the obtained per m2 value with the available rooftop area.
  • The losses due to inverters, transmission lines and battery cycling efficiency are assumed after researching the most recent and state-of-the-art systems. These losses assumed are as follows:
    • Inverter loss: 8%;
    • Transmission loss: 7%;
    • Battery cycling loss (round-trip efficiency consideration): 5%.
  • The losses occur as follows:
    • Building:
      From PV to battery charging: minimum DC-DC losses (neglected);
      From PV to load: inverter loss;
      From battery to load: inverter loss + battery cycling loss.
    • PV Farm:
      From PV to battery charging: minimum DC-DC losses (neglected);
      From PV to load: inverter loss + transmission loss;
      From battery to load: inverter loss + battery cycling + transmission loss.

References

  1. The New York Times: Oil Companies Are Collapsing, but Wind and Solar Energy Keep Growing. Available online: https://www.nytimes.com/2020/04/07/business/energy-environment/coronavirus-oil-wind-solar-energy.html (accessed on 5 June 2020).
  2. Singh, R.; Alapatt, G.F.; Bedi, G. Why and How PV Will Provide the Cheapest Energy in the 21st Century. Facta Univ. Ser. Electron. Energ. 2014, 27, 275–298. [Google Scholar] [CrossRef]
  3. PV Magazine: The World Added. 115 Terawatts of Solar Power in 2019 for a Cumulative. 629 Terawatts. Available online: https://pv-magazine-usa.com/2020/04/30/the-world-added-115-terawatts-of-solar-power-in-2019-for-a-cumulative-629-terawatts/ (accessed on 5 June 2020).
  4. GWEC: Over 60 GW of Wind Energy Capacity Installed in 2019, the Second-Biggest Year in History. Available online: https://gwec.net/gwec-over-60gw-of-wind-energy-capacity-installed-in-2019-the-second-biggest-year-in-history/ (accessed on 5 June 2020).
  5. The Wall Street Journal: Green Energy Won’t Slip on Cheap Oil. Available online: https://www.wsj.com/amp/articles/green-energy-wont-slip-on-cheap-oil-11587975878 (accessed on 5 June 2020).
  6. Renewable Energy World: Champions of Photovoltaics Technology. Available online: https://www.renewableenergyworld.com/2010/10/01/champions-of-photovoltaics/#gref (accessed on 5 June 2020).
  7. GTM: World’s Largest Solar Project Will Also Be Its Cheapest. Available online: https://www.greentechmedia.com/amp/article/worlds-largest-solar-project-will-also-be-worlds-cheapest (accessed on 5 June 2020).
  8. Paniyil, P.; Singh, R.; Asif, A.; Powar, V.; Bedi, G.; Kimsey, J. Transformative and Disruptive Roles of Durect Current Power Networks in Power and Transportation Sectors. Facta Univ. Ser. Electron. Energ. 2019, 32, 387–402. [Google Scholar] [CrossRef] [Green Version]
  9. Energy Storage: Battery Storage at US $20/MWh? Breaking Down Low-Cost Solar-Plus-Storage PPAs in the USA. Available online: https://www.energy-storage.news/blogs/battery-storage-at-us20-mwh-breaking-down-low-cost-solar-plus-storage-ppas (accessed on 5 June 2020).
  10. Singh, R.; Shenai, K. DC Microgrids and the Virtues of Local Electricity. IEEE Spectrum 2014. Available online: https://spectrum.ieee.org/green-tech/buildings/dc-microgrids-and-the-virtues-of-local-electricity (accessed on 5 June 2020).
  11. Ertugrul, N.; Abbott, D. DC Is the Future. Proc. IEEE 2020, 108, 615–624. [Google Scholar] [CrossRef]
  12. Almasalma, H.; Deconinck, G. Simultaneous Provision of Voltage and Frequency Control by PV-Battery System. IEEE Access 2020, 8, 152820–152836. [Google Scholar] [CrossRef]
  13. Singh, Y.; Singh, B.; Mishra, S. Multifunctional Control for PV Integrated Battery Energy Storage System with Improved Power Quality. IEEE Trans. Ind. Appl. 2020. [Google Scholar] [CrossRef]
  14. Kim, J.; Jeong, D.; Choi, D.; Park, E. Exploring public perceptions of renewable energy: Evidence from a word network model in social network services. Energy Strategy 2020, 32, 100552. [Google Scholar] [CrossRef]
  15. Sun, L.; Li, G.; You, F. Combined internal resistance and state-of-charge estimation of lithium-ion battery based on extended state observer. Renew. Sustain. Energy Rev. 2020, 131, 109994. [Google Scholar] [CrossRef]
  16. Sun, L.; Sun, W.; You, F. Core temperature modelling and monitoring of lithium-ion battery in the presence of sensor bias. Appl. Energy 2020, 271, 115243. [Google Scholar] [CrossRef]
  17. EIA: Use of Energy Explained, Energy Use in Commercial Buildings. Available online: https://www.eia.gov/energyexplained/use-of-energy/commercial-buildings.php (accessed on 8 August 2020).
  18. Environment America: America’s Top Colleges for Renewable Energy. Available online: https://environmentamerica.org/reports/ame/americas-top-colleges-renewable-energy (accessed on 8 August 2020).
  19. Office of Energy Efficiency & Renewable Energy: U.S. Department of Energy Solar District Cup Collegiate Design Competition. Available online: https://www.energy.gov/eere/solar/solar-district-cup (accessed on 5 June 2020).
  20. Bedi, G.; Venayagamoorthy, G.K.; Singh, R.; Brooks, R.; Wang, K.C. Review of Internet of Things (IoT) in Electric Power and Energy Systems. IEEE Internet Things J. 2018, 5, 847–870. [Google Scholar] [CrossRef]
  21. CHM: 13 Sextillion & Counting: The Long & Winding Road to The Most Frequently Manufactured Human Artifact in History. Available online: https://computerhistory.org/blog/13-sextillion-counting-the-long-winding-road-to-the-most-frequently-manufactured-human-artifact-in-history/ (accessed on 5 June 2020).
  22. CISION: Global Consumer Electronics Market to Reach US $2.9 Trillion by 2020–Persistence Market Research. Available online: https://www.prnewswire.com/news-releases/global-consumer-electronics-market-to-reach-us-29-trillion-by-2020---persistence-market-research-609486755.html (accessed on 5 June 2020).
  23. IRENA: Future of Solar Photovoltaic. Available online: https://www.irena.org//media/Files/IRENA/Agency/Publication/2019/Nov/IRENA_Future_of_Solar_PV_2019.pdf (accessed on 5 June 2020).
  24. Electrek: Tesla’s Secret Roadrunner Project: New Battery Production at $100 per kWh on a Massive Scale. Available online: https://electrek.co/2020/02/26/tesla-secret-roadrunner-project-battery-production-massive-scale/amp/ (accessed on 5 June 2020).
  25. CIF: Global Solar Investment Report. Available online: https://www.climateinvestmentfunds.org/sites/cif_enc/files/knowledge-documents/bnef_2019-10-30_isa-cif_report-final_002.pdf (accessed on 5 June 2020).
  26. SunPower: SunPower Module 40-Year Useful Life. Available online: https://us.sunpower.com/sites/default/files/media-library/white-papers/wp-sunpower-module-40-year-useful-life.pdf (accessed on 5 June 2020).
  27. BNEF: Lithium-ion Battery Costs and Market. Available online: https://data.bloomberglp.com/bnef/sites/14/2017/07/BNEF-Lithium-ion-battery-costs-and-market.pdf (accessed on 5 June 2020).
  28. Barron’s: Tesla and California Are Making Nice. The Next Factories Will Be Somewhere Else. Available online: https://www.barrons.com/articles/tesla-stock-california-factories-geographic-diversification-texas-shanghai-china-germany-51590075949 (accessed on 5 June 2020).
  29. The Guardian: UK’s First Car Battery ‘Gigafactory’ to be Built by Two Startups. Available online: https://www.theguardian.com/business/2020/may/20/uk-first-car-battery-gigafactory-amte-power-britishvolt (accessed on 5 June 2020).
  30. FPL: FPL Announces Plan to Build the World’s Largest Solar-Powered Battery and Drive Accelerated Retirement of Fossil Fuel Generation. Available online: http://newsroom.fpl.com/2019-03-28-FPL-announces-plan-to-build-the-worlds-largest-solar-powered-battery-and-drive-accelerated-retirement-of-fossil-fuel-generation (accessed on 5 June 2020).
  31. Wood Mackenzie: Solar Technology Got Cheaper and Better in the 2010s. Now What? Available online: https://www.woodmac.com/news/opinion/solar-technology-got-cheaper-and-better-in-the-2010s.-now-what/ (accessed on 5 June 2020).
  32. BloombergNEF: Battery Pack Prices Fall as Market Ramps up with Market Average at $156/kWh in 2019. Available online: https://about.bnef.com/blog/battery-pack-prices-fall-as-market-ramps-up-with-market-average-at-156-kwh-in-2019/ (accessed on 5 June 2020).
  33. Solar Industry: JinkoSolar Launches Its Tiger Pro Series of PV Modules. Available online: https://solarindustrymag.com/jinkosolar-launches-its-tiger-pro-series-of-pv-modules (accessed on 5 June 2020).
  34. Singh, R.; Alapatt, G.F.; Lakhtakia, A. Making Solar Cells a Reality in Every Home: Opportunities and Challenges for Photovoltaic Device Design. IEEE J. Electron Devices Soc. 2013, 1, 129–144. [Google Scholar] [CrossRef]
  35. Singh, R. Why Silicon is and will Remain the Dominant Photovoltaic Material. J. Nanophotonics 2009, 3, 032503. [Google Scholar] [CrossRef]
  36. Asif, A.; Singh, R. Further Cost Reduction of Battery Manufacturing. Batteries 2017, 3, 17. [Google Scholar] [CrossRef]
  37. Aljazeera: Tesla Is Working on Making Electric Cars Less Expensive. Available online: https://www.aljazeera.com/amp/ajimpact/tesla-working-making-electric-cars-expensive-200514181336609.html (accessed on 5 June 2020).
  38. Popular Mechanics: Tesla’s Battery Cell Patent Is ‘Way More Important than It Sounds’. Available online: https://www.popularmechanics.com/science/a32433420/elon-musk-tesla-battery-cell-patent/ (accessed on 5 June 2020).
  39. Bloomberg: These Countries Are the Most at Risk from a Water Crisis. Available online: https://www.bloomberg.com/graphics/2019-countries-facing-water-crisis/ (accessed on 5 June 2020).
  40. The Wall Street Journal: Power Plants Aim to Curb Their Thirst. Available online: https://www.wsj.com/articles/SB10000872396390444433504577649914114390298 (accessed on 5 June 2020).
  41. Solar Power World: How to Maximize Solar Project Value Using Inverter Clipping. Available online: https://www.solarpowerworldonline.com/2019/12/how-to-maximize-solar-installation-value-using-inverter-clipping/ (accessed on 5 June 2020).
  42. Sunny Tripower Core1 33-US Datasheet. Available online: https://documents.wholesalesolar.com/media/specs-20190530215325.2950183-4.pdf?_ga=2.46336487.1967707496.1600033514-1216853251.1574280990 (accessed on 14 September 2020).
  43. ABB: Solar String Inverters (TRIO-50.0-TL-OUTD-US-480-50 kW) Datasheet. Available online: https://library.e.abb.com/public/4d8140daa2b24c7c9ca4a37638e153bc/TRIO-50.0-TL-OUTD-US-480_Rev.G.pdf (accessed on 14 September 2020).
  44. Solar Power World: Too much of a Good Thing: Inverter Hyper-Clipping. Available online: https://www.solarpowerworldonline.com/2018/06/too-much-of-a-good-thing-inverter-hyper-clipping/ (accessed on 5 June 2020).
  45. Solar Power World: Hybrid Inverters Can Future-Proof Solar+Storage Installations. Available online: https://www.solarpowerworldonline.com/2018/09/hybrid-inverters-future-proof-solar-storage-installation/ (accessed on 5 June 2020).
  46. University of Oregon–Solar Radiation Monitoring Laboratory: Sun Path Chart Program. Available online: http://solardat.uoregon.edu/SunChartProgram.html (accessed on 14 September 2020).
  47. NMSU: Solar Time, Angles, and Irradiance Calculator: User Manual. Available online: https://aces.nmsu.edu/pubs/_circulars/CR674/welcome.html (accessed on 5 June 2020).
  48. SunPower: SunPower Residential AC Module. Available online: https://us.sunpower.com/sites/default/files/sp-x22-370-360-d-ac-datasheet-527025-revb.pdf (accessed on 5 June 2020).
  49. SunPower: SunPower X-Series Commercial Solar Panels. Available online: https://us.sunpower.com/sites/default/files/sunpower-x-series-commercial-solar-panels-x21-470-com-datasheet-524935-revb.pdf (accessed on 5 June 2020).
  50. Simpliphipower: Phi 3.8 Battery. Available online: https://simpliphipower.com/wp-content/uploads/documentation/phi-3-8/simpliphi-power-phi-3-8-kwh-60-amp-specification-sheet.pdf (accessed on 5 June 2020).
  51. Renewable Energy World: Levelized Cost of Electricity Models: The Good, The Bad and the Potential for Bias. Available online: https://www.renewableenergyworld.com/2014/11/14/levelized-cost-of-electricity-models-the-good-the-bad-and-the-potential-for-bias/#gref (accessed on 5 June 2020).
  52. PV Magazine: Utility Scale Solar Power as Cheap as 70 Cents Per Watt and Still Falling. Available online: https://pv-magazine-usa.com/2019/12/20/utility-scale-solar-power-as-cheap-as-75%C2%A2-per-watt-says-government-researchers/ (accessed on 5 June 2020).
  53. NREL: 2018 U.S. Utility-Scale Photovoltaics-Plus-Energy Storage System Costs Benchmark. Available online: https://www.nrel.gov/docs/fy19osti/71714.pdf (accessed on 5 June 2020).
  54. The Electric Company: El Paso Electric. Available online: https://www.transmissionhub.com/wp-content/uploads/2019/11/EPEappNov202019.pdf (accessed on 5 June 2020).
  55. GTM: Why Moore’s Law Doesn’t Apply to Clean Energy Technologies. Available online: https://www.greentechmedia.com/articles/read/why-moores-law-doesnt-apply-to-clean-technologies (accessed on 5 June 2020).
  56. Beltran, H.; Ayuso, P.; Perez, E. Lifetime Expectancy of Li-Ion Batteries used for Residential Solar Storage. Energies 2020, 13, 568. [Google Scholar] [CrossRef] [Green Version]
  57. Limited Warranty for Panasonic’s Lithium-Ion Battery Module for Pika Harbor Smart Battery/Flex and Plus System. Available online: https://d3g1qce46u5dao.cloudfront.net/warranty/dcb105_warranty.pdf (accessed on 5 June 2020).
  58. Wholesale Solar: Solar Panel Warranty Guide: How Long Will My System Last? Available online: https://www.wholesalesolar.com/blog/solar-panel-warranty-guide (accessed on 5 June 2020).
  59. Energysage: Investment Tax Credit for Solar Power. Available online: https://www.energysage.com/solar/cost-benefit/solar-investment-tax-credit/ (accessed on 5 June 2020).
  60. CleanTechnica: LA & 8Minute Solar Ink Lowest Cost Solar-Plus-Storage Deal in US History. Available online: https://cleantechnica.com/2019/09/11/la-8minute-solar-ink-lowest-cost-solar-plus-storage-deal-in-us-history/ (accessed on 5 June 2020).
  61. UtilityDive: El Paso Electric Sees Record Low Solar Prices as It Secures New Mexico Project Approvals. Available online: https://www.utilitydive.com/news/el-paso-electric-sees-record-low-solar-prices-as-it-secures-new-mexico-proj/578113/ (accessed on 14 September 2020).
  62. PV Magazine: Portuguese Government Confirms World Record Solar Price of $0.01316/kWh. Available online: https://www.pv-magazine.com/2020/08/27/portuguese-government-confirms-world-record-solar-price-of-0-01316-kwh/ (accessed on 14 September 2020).
  63. The Motley Fool: This Renewable Energy Juggernaut Wants to Supercharge America’s Battery Storage Capacity. Available online: https://www.fool.com/investing/2020/09/05/this-renewable-energy-juggernaut-wants-to-supercha/ (accessed on 14 September 2020).
  64. Renewable Energy World: Weighing the Advantages of Distributed and Centralized Energy Storage. Available online: https://www.renewableenergyworld.com/2015/04/01/weighing-the-advantages-of-distributed-energy-storage-and-centralized-energy-storage/#gref (accessed on 14 September 2020).
Figure 1. Increase in power generation capacity for solar and wind energies [5].
Energies 13 05048 g001
Figure 2. Total global Photovoltaic rooftop and utility-scale generation 2019–2029 [25].
Energies 13 05048 g002
Figure 3. Plummeting prices of (a) PV modules [31]; (b) lithium-ion battery pack [32].
Energies 13 05048 g003
Figure 4. Change in efficiency with respect to operating power and input DC voltage [43].
Energies 13 05048 g004
Figure 5. Current industry practice in implementing PV + Battery systems.
Energies 13 05048 g005
Figure 6. Our proposed model to avoid DC–AC conversion losses.
Energies 13 05048 g006
Figure 7. Conceptual design of proposed power system.
Energies 13 05048 g007
Figure 8. Solar chart for Las Cruces, NM [46].
Energies 13 05048 g008
Figure 9. PV panel output considering the effect of temperature on output power.
Energies 13 05048 g009
Figure 10. Flowchart of the MATLAB code.
Energies 13 05048 g010
Figure 11. Total load requirement vs. total power generated by the PV and battery system. The power deficit is covered by purchasing power from the utility grid.
Energies 13 05048 g011
Figure 12. Financial analysis based on the fact that the university is the owner of the entire power network based on photovoltaics and batteries. It is assumed that under the existing agreement, the utility can supply the deficiency of power generated by the PV and battery system.
Energies 13 05048 g012
Figure 13. Financial analysis is based on the fact that the owner of the entire power network is either the utility or some other investor. It is assumed that between the university, utility and investor, a PPA has been signed. The utility will supply the deficiency of power generated by the PV system.
Energies 13 05048 g013
Table 1. Transformative role of technologies in the IT and power sectors.
TechnologySectorRemarks
CMOSInformation TechnologyCMOS accounts for 99.9% of all transistors used in USD 2.9 trillion consumer electronics [21,22]
Crystalline silicon PVPower Generation About 93–95% of global PV production by the end of 2018 accounted for about 470–480 GW, leading towards a TW scale [23]
Lithium-ion batteryEnergy StoragePlummeting costs of about USD 100/kWh [24], nearing cost of pumped hydro storage at about USD 75–100/kWh
Table 2. Sunny Tripower Core1 (STP-33-US-41) inverter specifications [42].
MetricValue
Maximum array power50,000 Wp STC
Maximum system voltage1000 V
Rated MPP voltage range330 V–800 V
MPPT operating voltage range150 V–1000 V
Maximum operating input current/per MPP tracker120 A/20 A
AC nominal Power33,300 W
Maximum Apparent Power33,300 VA
Maximum output current40 A
Nominal AC Voltage480 V/277 V WYE
AC voltage range244 V–305 V
CEC Efficiency (preliminary)97.5%
Table 3. System sizing summary.
Calculated MetricRooftop Demand [kWh/year]Total DC Rooftop PV Power [MW]Number of Rooftop PanelsPV Farm Demand [kWh/year]Total DC Farm PV Power [MW]Number of Ground-Mounted PanelsNumber of Panels per StringNumber of StringsNumber of Inverters
Value10,967,3564.29411,60620,890,2028.1817,403101688140
Table 4. Building rooftop PV generation capacity.
BuildingRooftop PV Value [kW]
Building 1820
Building 2317
Building 3371
Building 4631
Building 5715
Building 6127
Building 7524
Building 886
Building 9231
Building 10316
Total4200
Table 5. Summary of financial analysis.
ModelTotal Bills Paid by the University to the Utility under Existing AgreementsUniversity’s Savings over 20 Years by Using PV- and Battery-Based Power NetworkProfit of Utility or Investor
University is the owner of power networkUSD 28,572,525USD 7,380,148Not Applicable
Power network is owned by the utility or investorUSD 28,572,525USD 4,163,022USD 1,652,379

