1. Introduction
In 2017, the building sector accounted for 20% of total energy consumption in Korea [
1]. HVAC system (i.e., heating, cooling, and ventilation) is a primary driver of energy consumption in commercial buildings [
2], which occupied about 45% of the total building energy use [
3,
4]. However, in most existing buildings, it is challenging to improve HVAC system performance due to the considerable construction costs of installing new systems. Thus, a proactive method of energy conservation would work for commercial buildings as the second-best plan to make a more efficient approach in air handling units (AHUs) [
5].
In the literature, researchers studied various methods to improve efficiencies in the HVAC systems in operation stages, including the duty cycle, economizer, load reset, optimal start, optimal stop, and night purge [
6,
7,
8,
9,
10]. Of them, one of the best ways to conserve energy is an economizer that introduces low-temperature or low-enthalpy outdoor air into the building to reduce or eliminate mechanical cooling depending on outdoor air conditions [
11,
12]. When outdoor air temperature (TOA) is lower than the supply air temperature (TSA), the economizer can provide free-cooling by introducing outdoor air. This can remove partial or complete mechanical cooling loads during intermediate seasons, and thus, HVAC system loads (e.g., chiller, pump, and cooling tower) can be reduced considerably [
13]. In the process, outdoor air and return air can be modulated to produce optimal TSA and reduce mechanical cooling operations [
14]. Therefore, if the air-handler operates the economizer effectively, significant amounts of energy savings [
15,
16], and the improved indoor air quality [
17] are expected in commercial buildings [
18].
Economizer control has significant energy saving potential in commercial buildings. Numerous studies recently explored the effect of diverse economizer control types on energy conservation [
19,
20,
21,
22,
23,
24,
25,
26,
27,
28,
29,
30,
31]. Yao and Wang investigated the energy savings potential of temperature-based and enthalpy-based economizer cycles on VAV systems using a simulation program. They evaluated the energy-saving ratio using different controls of temperature-based and enthalpy-based economizer in six climate zones (i.e., cool-dry summer and very cold winter, moderate summer and cold winter, hot-dry summer and cold winter, hot-humid summer and mild winter, hot-humid summer and little cold winter, hot-humid summer and warm winter) in China. The result revealed that the economizer cycle in the hot-humid summer climate zones showed about 10–20% energy savings compared to the cool-dry summer zone. This study identified that the climatic conditions are one of the significant factors affecting the energy-saving impact of air economizers [
19]. Chowdhury and Khan calculated the effect of economizer control strategies based on return air temperature and pre-cooling in EnergyPlus and compared the simulated chiller energy consumption with measured data over five working days. The economizer controls in the simulation result reduced 72 kW/m
2 month in cooling loads than the existing building [
20]. Son and Lee conducted an energy performance analysis of the economizer systems in an office building using EnergyPlus. To evaluate the cooling energy performance of the economizer cycle controls, the differential dry-bulb temperature (DT), differential enthalpy (DE), and no economizer (NE) methods were used in building energy simulations. The result suggested that the DT method could show less cooling energy savings than the DE method depending on TOA conditions, because latent heat is not considered in the DT method. In detail, the estimation of Incheon, Korea suggests that the DE control method showed the largest energy saving by approximately 10% under Korean climatic conditions compared to other economizer control methods. The DT control represented 12.7% smaller energy consumption than no economizer control in an intermediate period [
21]. Similarily, Aktacir used a computer coding of the NE, DT, and DE economizer modes for simulations using a 15-year period of TOA data. This study identified that the DE economizer mode was the most energy conservative approach to save the cooling energy of the different economizer controls. Moreover, it worked effectively in March, April, October, and November in Mediterranean countries because they have hot and long summer. The rest of the year did not show cooling load savings [
22]. Bulut used 16 years of bin data to determine the energy-efficient DT mode of economizer control types. The study analyzed the economic conditions and free cooling potential according to the TSA for an all-air HVAC system in different outdoor conditions. Moreover, the cooling hours and cooling energy costs were calculated when the TSAs were 15 °C, 18 °C, 21 °C, and 24 °C. The reduction rates in cooling energy costs were 10%, 18%, and 25% compared to the TSA of 15 °C, respectively [
15]. On the other hand, some researchers focused on optimization-based strategies [
28] and damper controls [
23] to improve the energy efficiency of economizer controls. As for building type, economizer controls have been applied in a variety of building types, such as data centers [
24,
25,
26,
27], office buildings [
19,
21], and residential homes [
28,
29]. However, case studies of hospitals are still uncommon in the field of economizer research.
The literature review verified the cooling energy savings potential from economizer controls in commercial buildings. However, most studies focused on data analysis from simulation programs and control methods (e.g., temperature-based, enthalpy-based control) to investigate economizer energy performance in residential buildings, office buildings, and data centers. The researchers neglected the outdoor air faction-based controls using field study data and the impact of economizer controls in the hospital. Without the data collection, it is difficult to realize accurate estimations of economizer performance and potential energy savings in different control types. Therefore, a study of optimal outdoor air fraction (OAF) can contribute to having a better understanding of free cooling using economizer cycles to alleviate mechanical cooling loads in transition seasons. This study aims to interpret operational data in the actual hospital building and analyze the effects of various economizer controls using optimal OAF. The results of this study can reveal energy conservation potential in the hospital.
To achieve the purpose of this study, the field data from AHUs in a large hospital in Korea were collected to observe the actual OAF in summer and the intermediary seasons. Based on the real operational data, the optimal OAF for economizer control types was calculated. In the process, energy performance was examined through high-limit control methods. These methods can calculate the optimum mixed air ratio according to the outdoor air conditions that focus on the TSA and the supply air enthalpy (SAE). The mechanical cooling hours and OAFs were used to compute the system loads of cooling coils by the economizer control types and then compared the results with the actual operation and the NE control mode to quantitively compare the energy conservation effect in economizers. The data for economizer analysis were selected from March to November in 2016, which corresponds to the spring, summer, and fall in Korea.
The research procedure is briefly shown in
Figure 1.
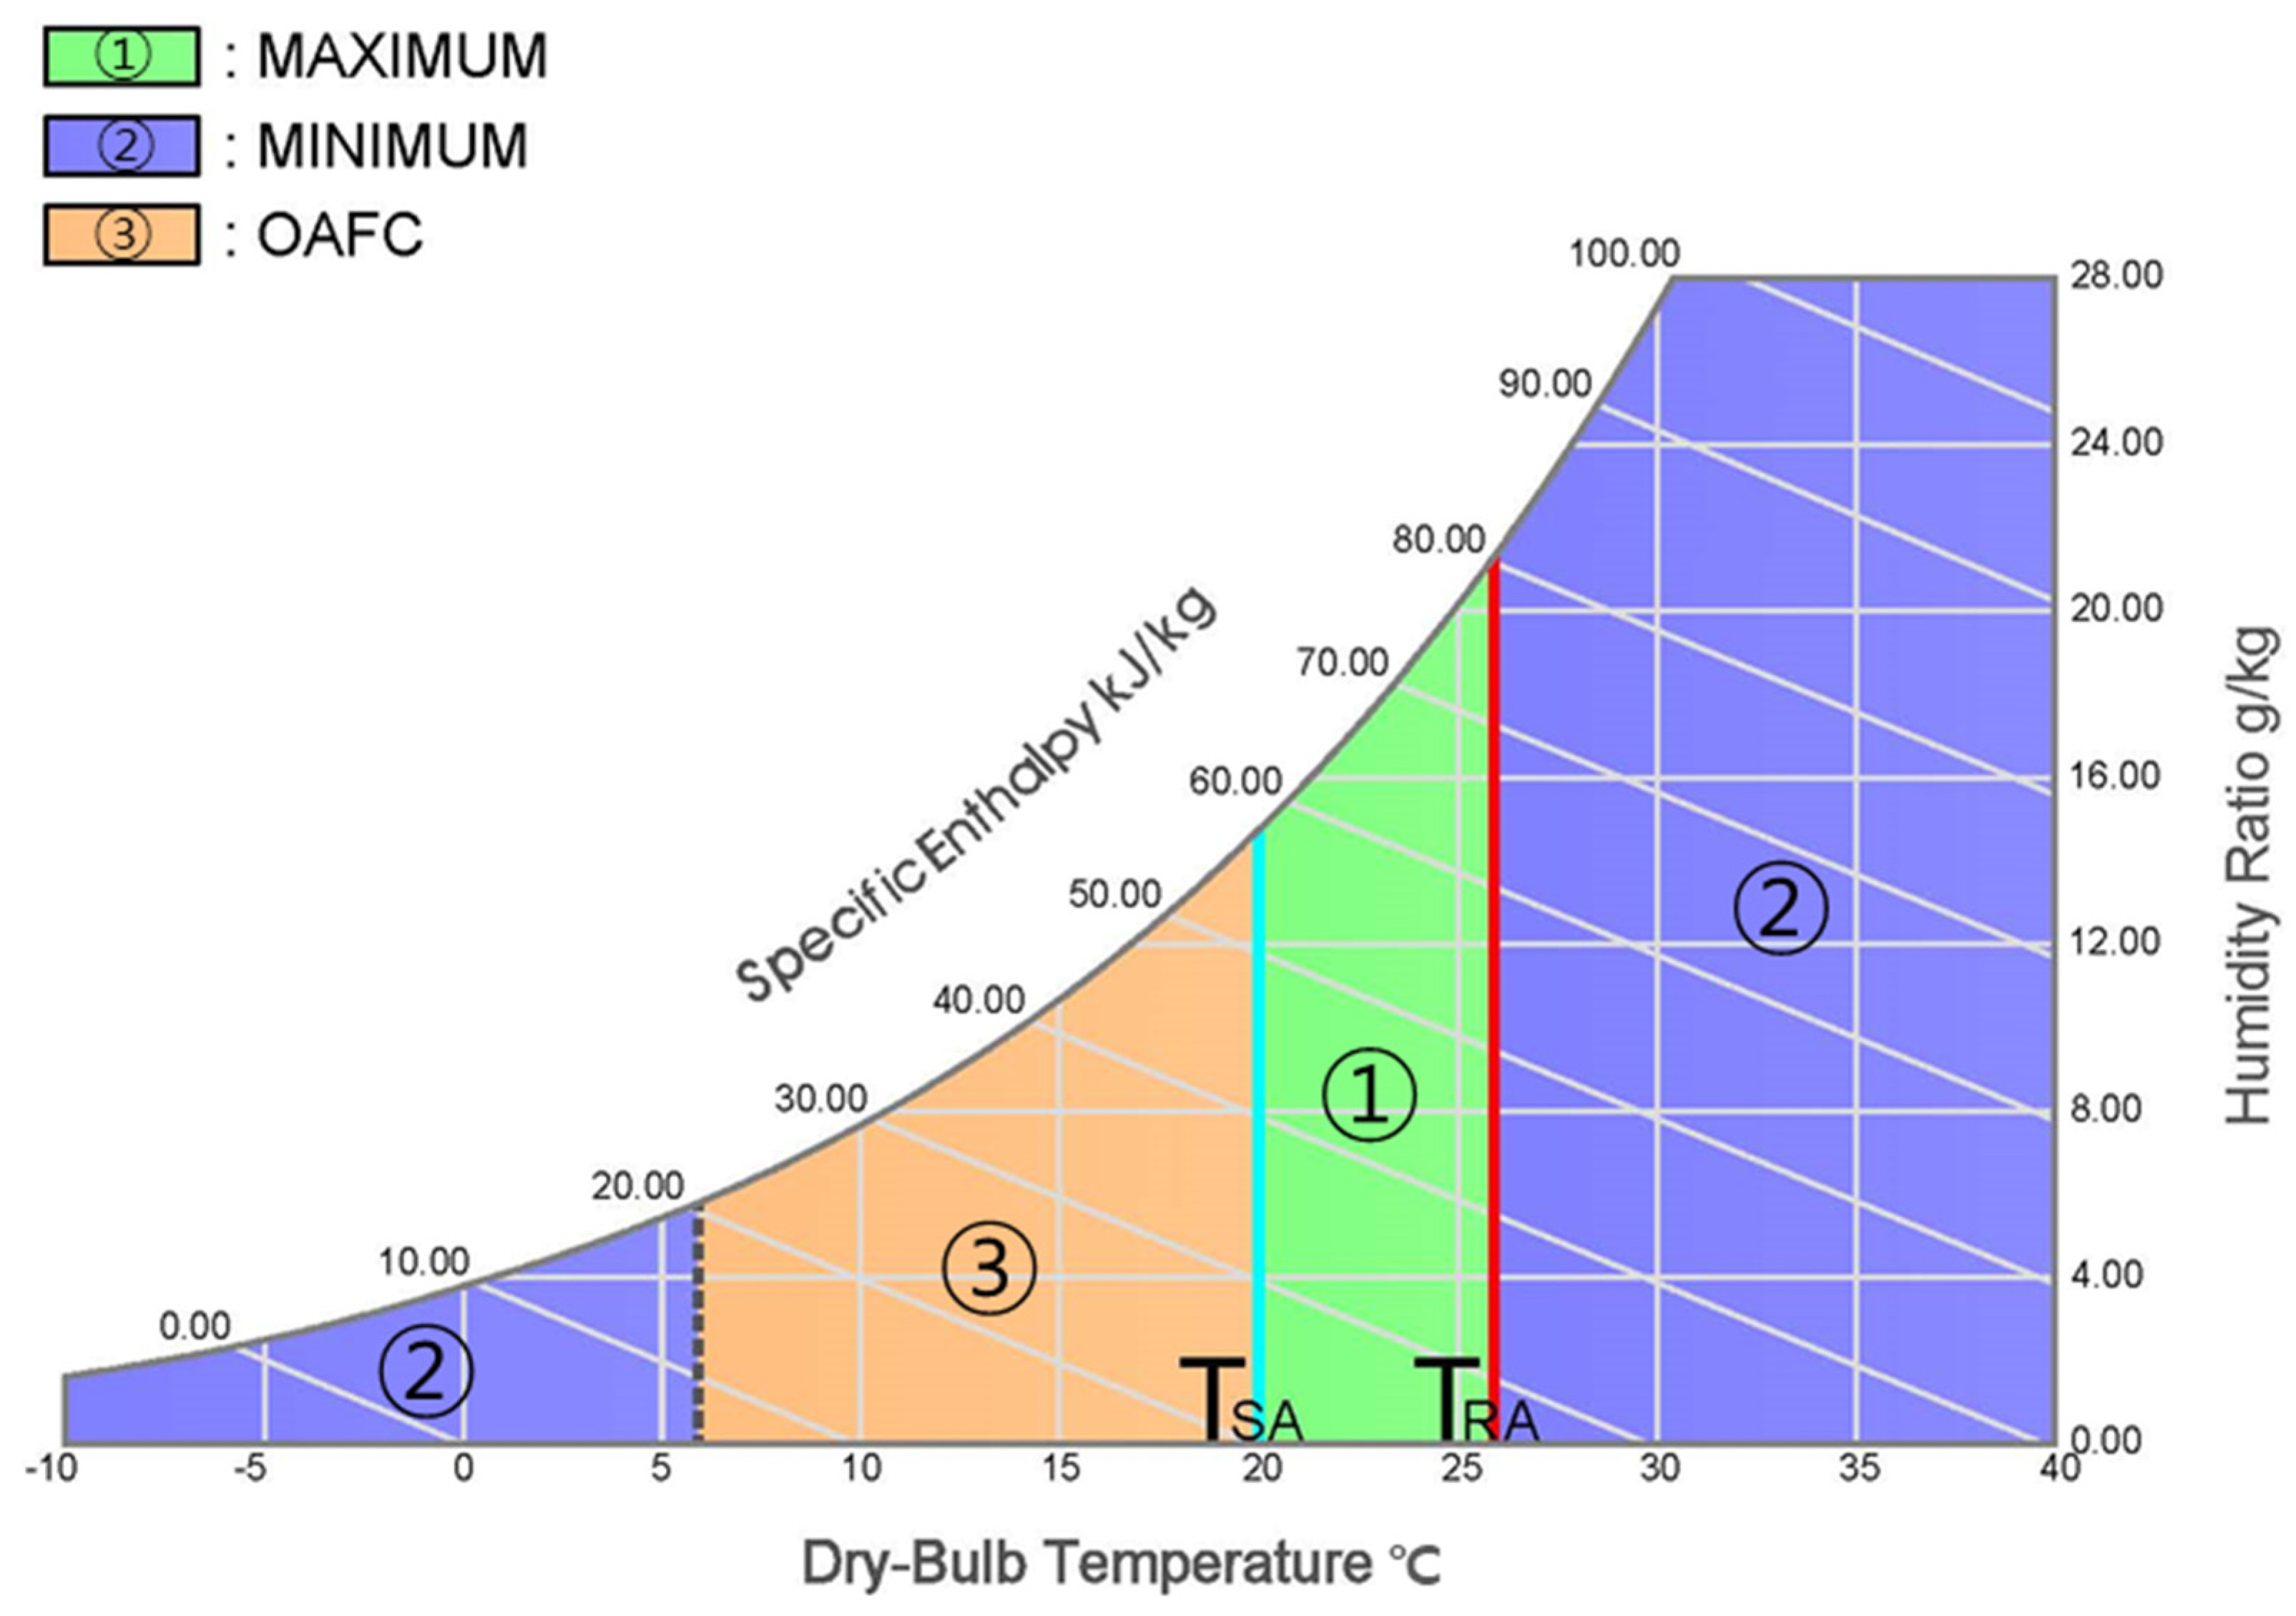
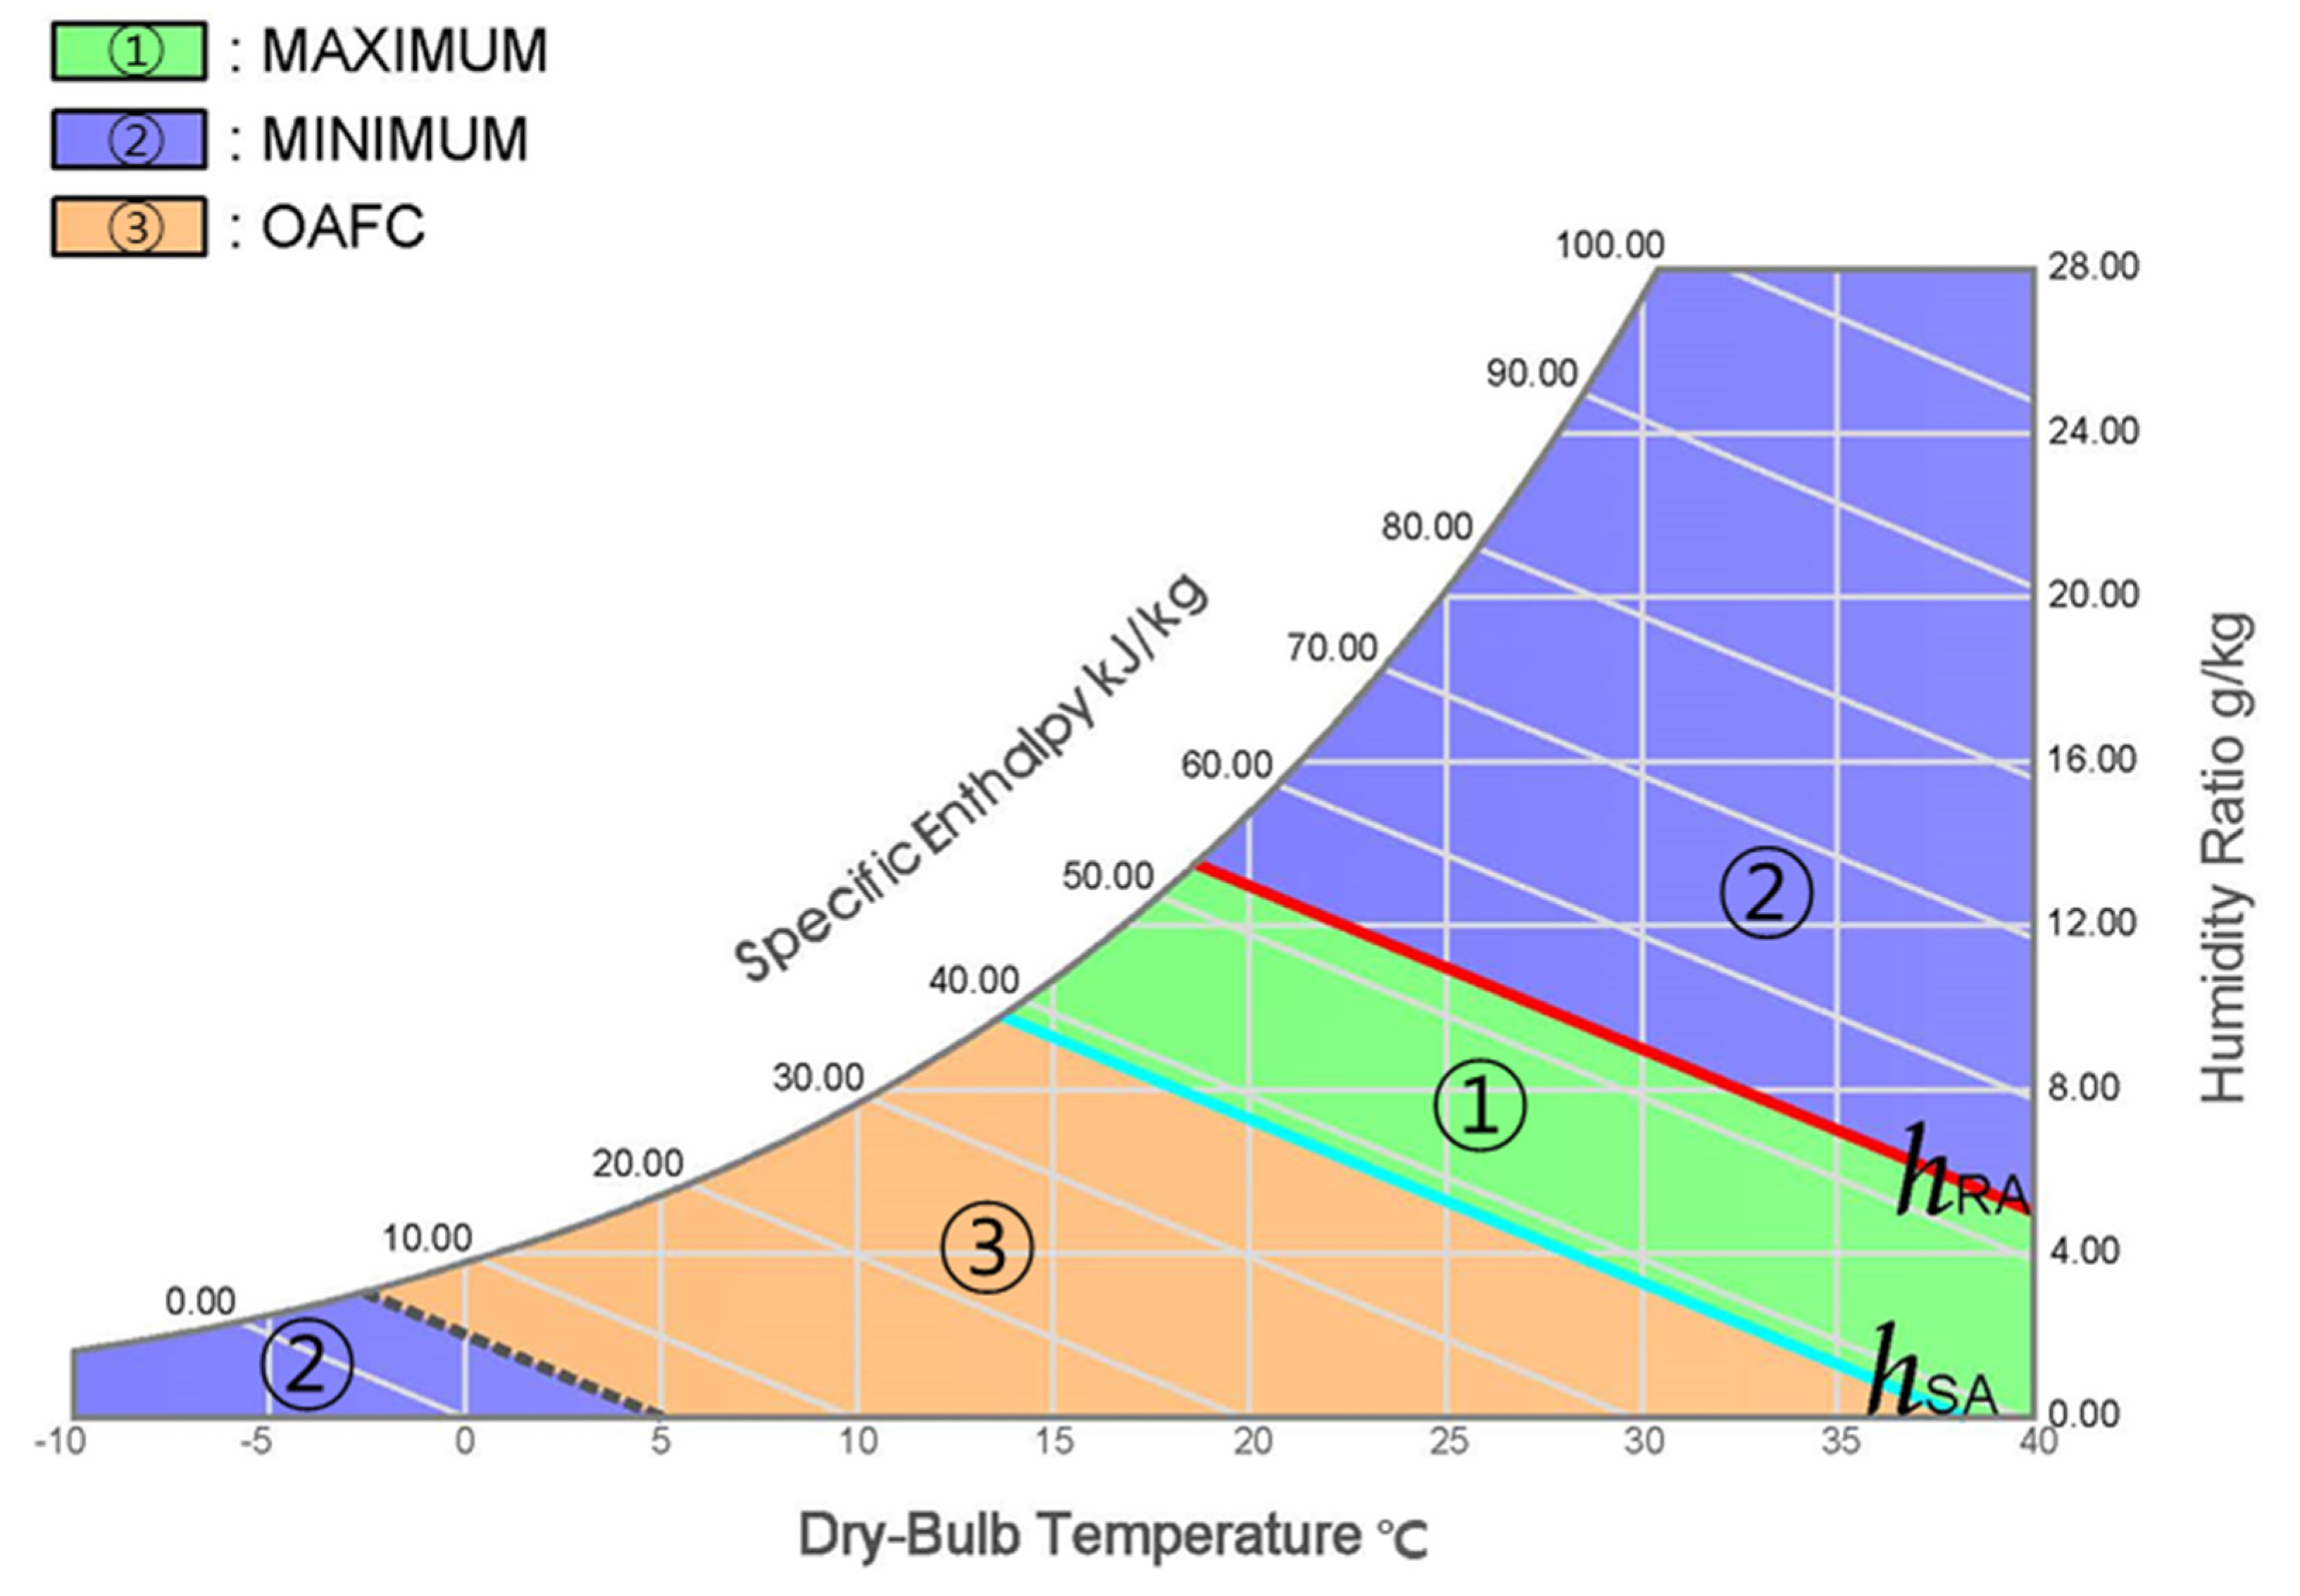
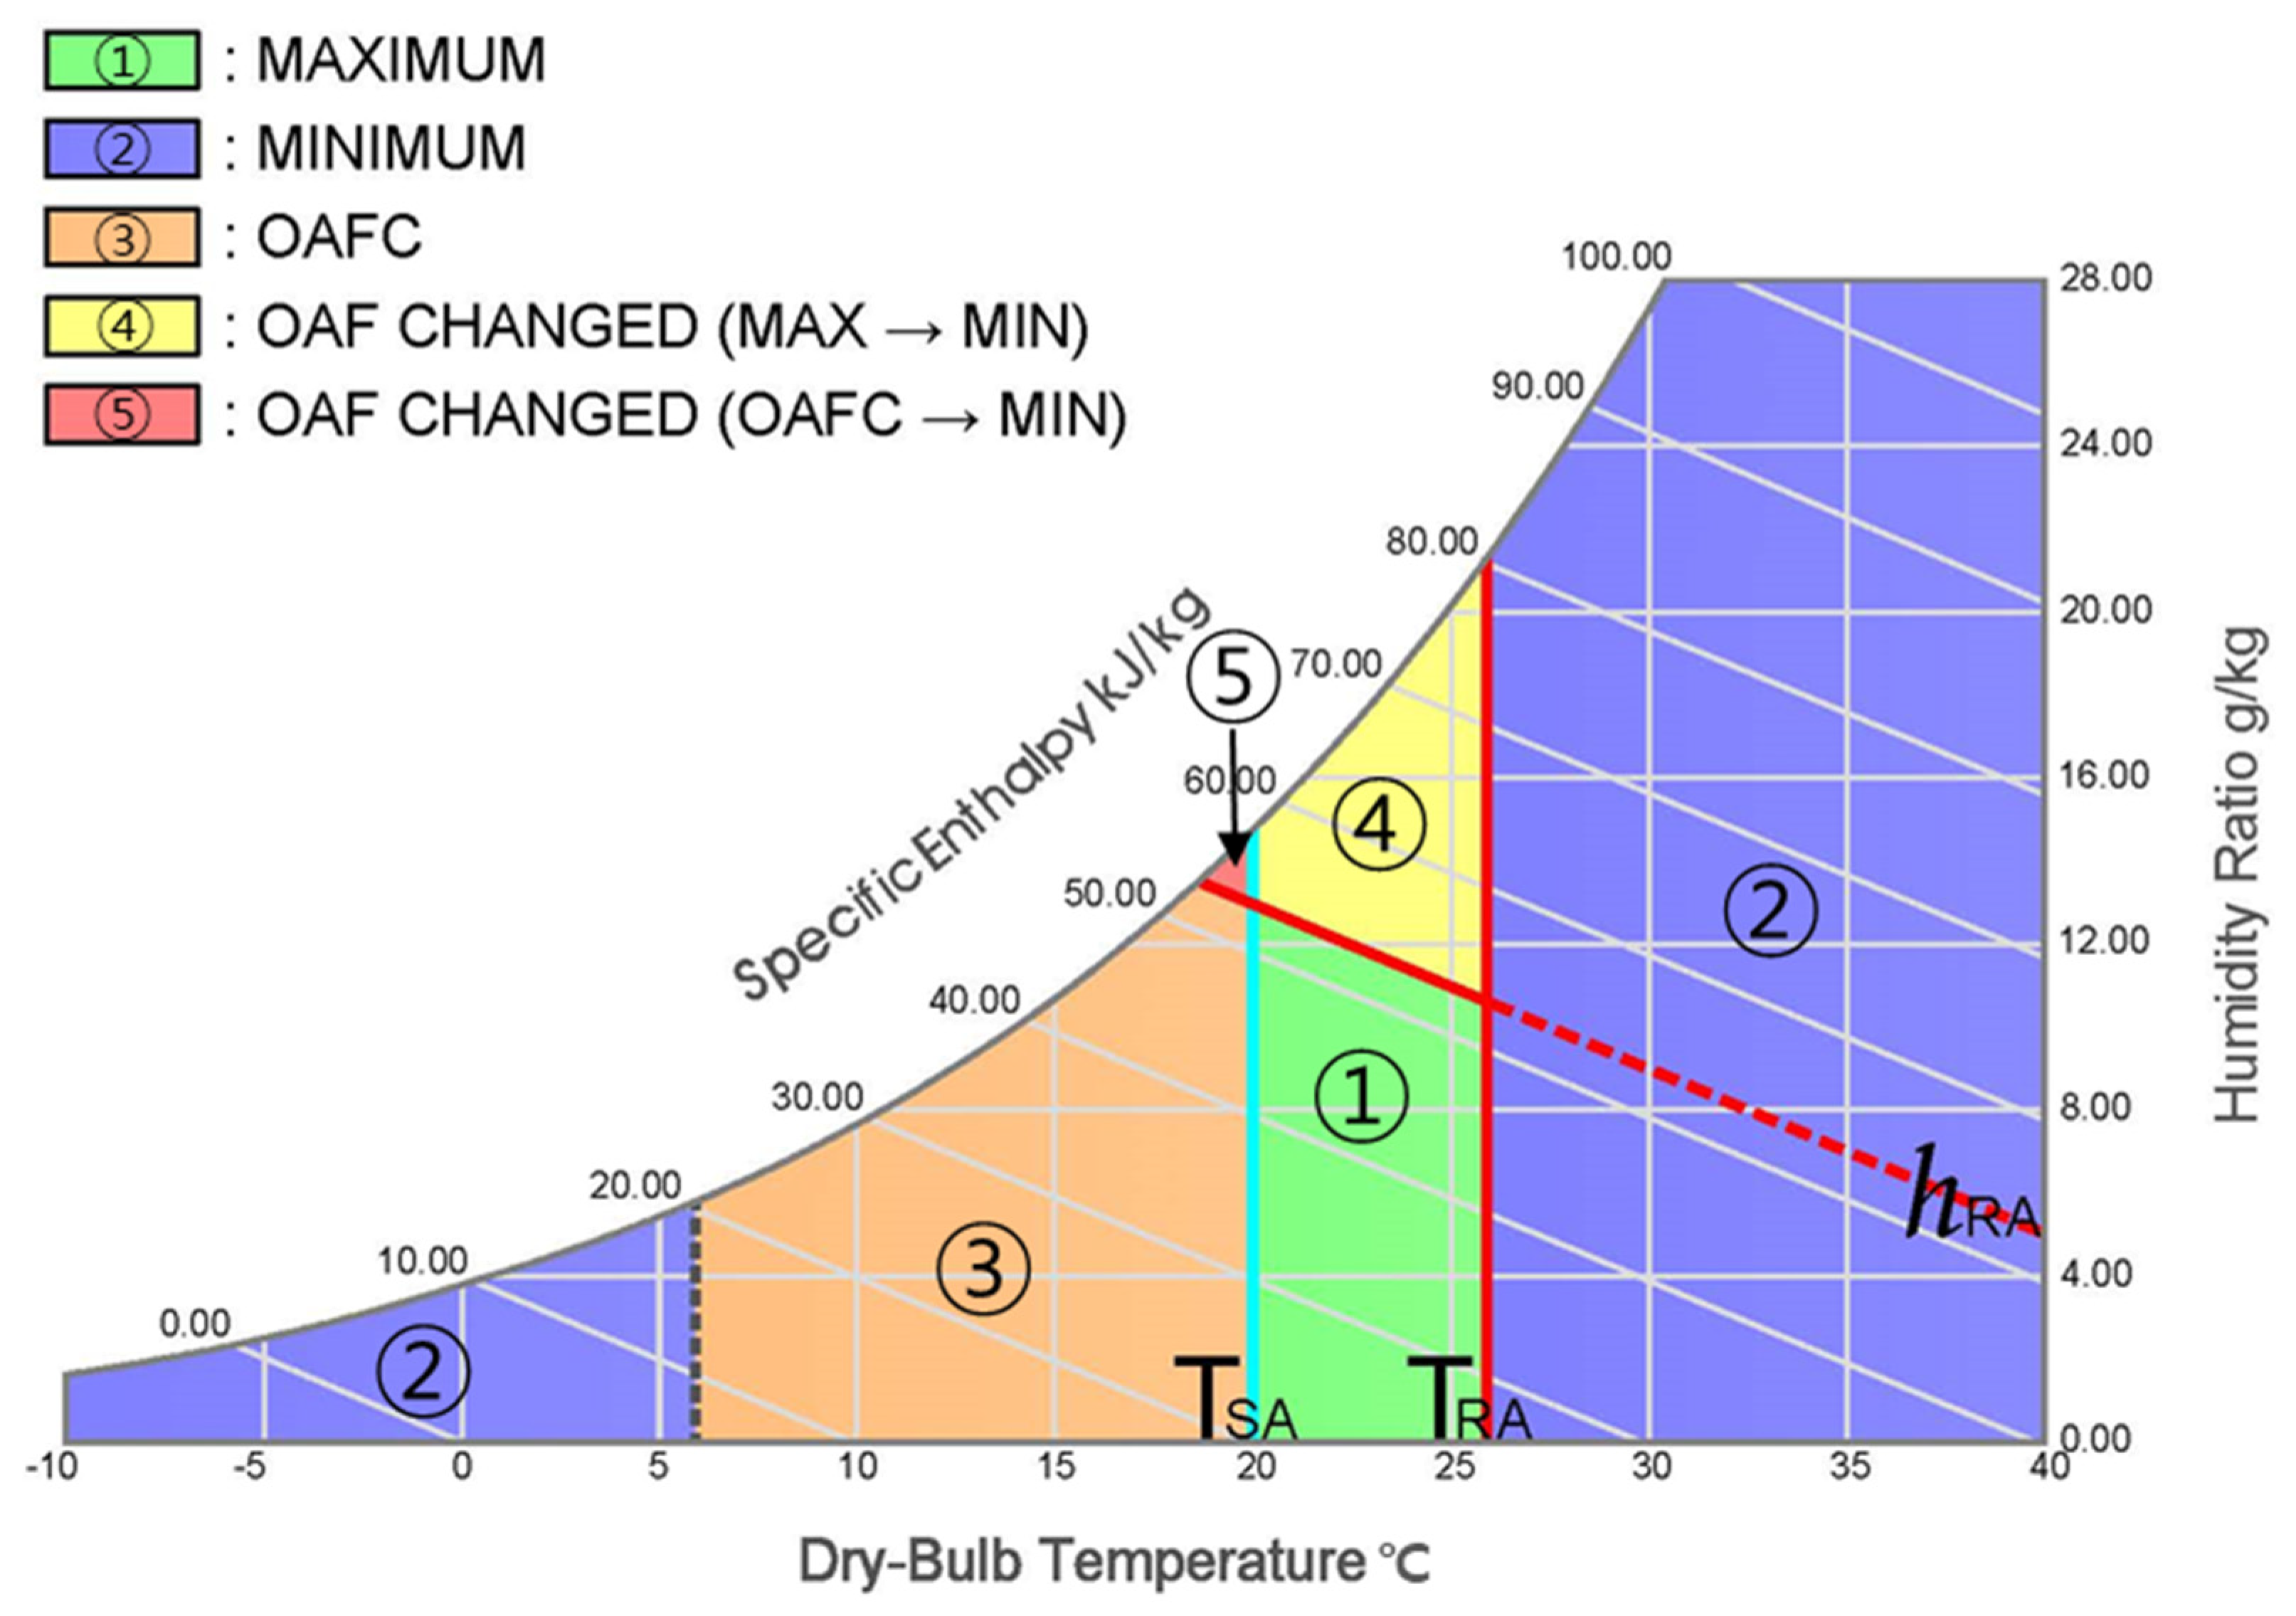
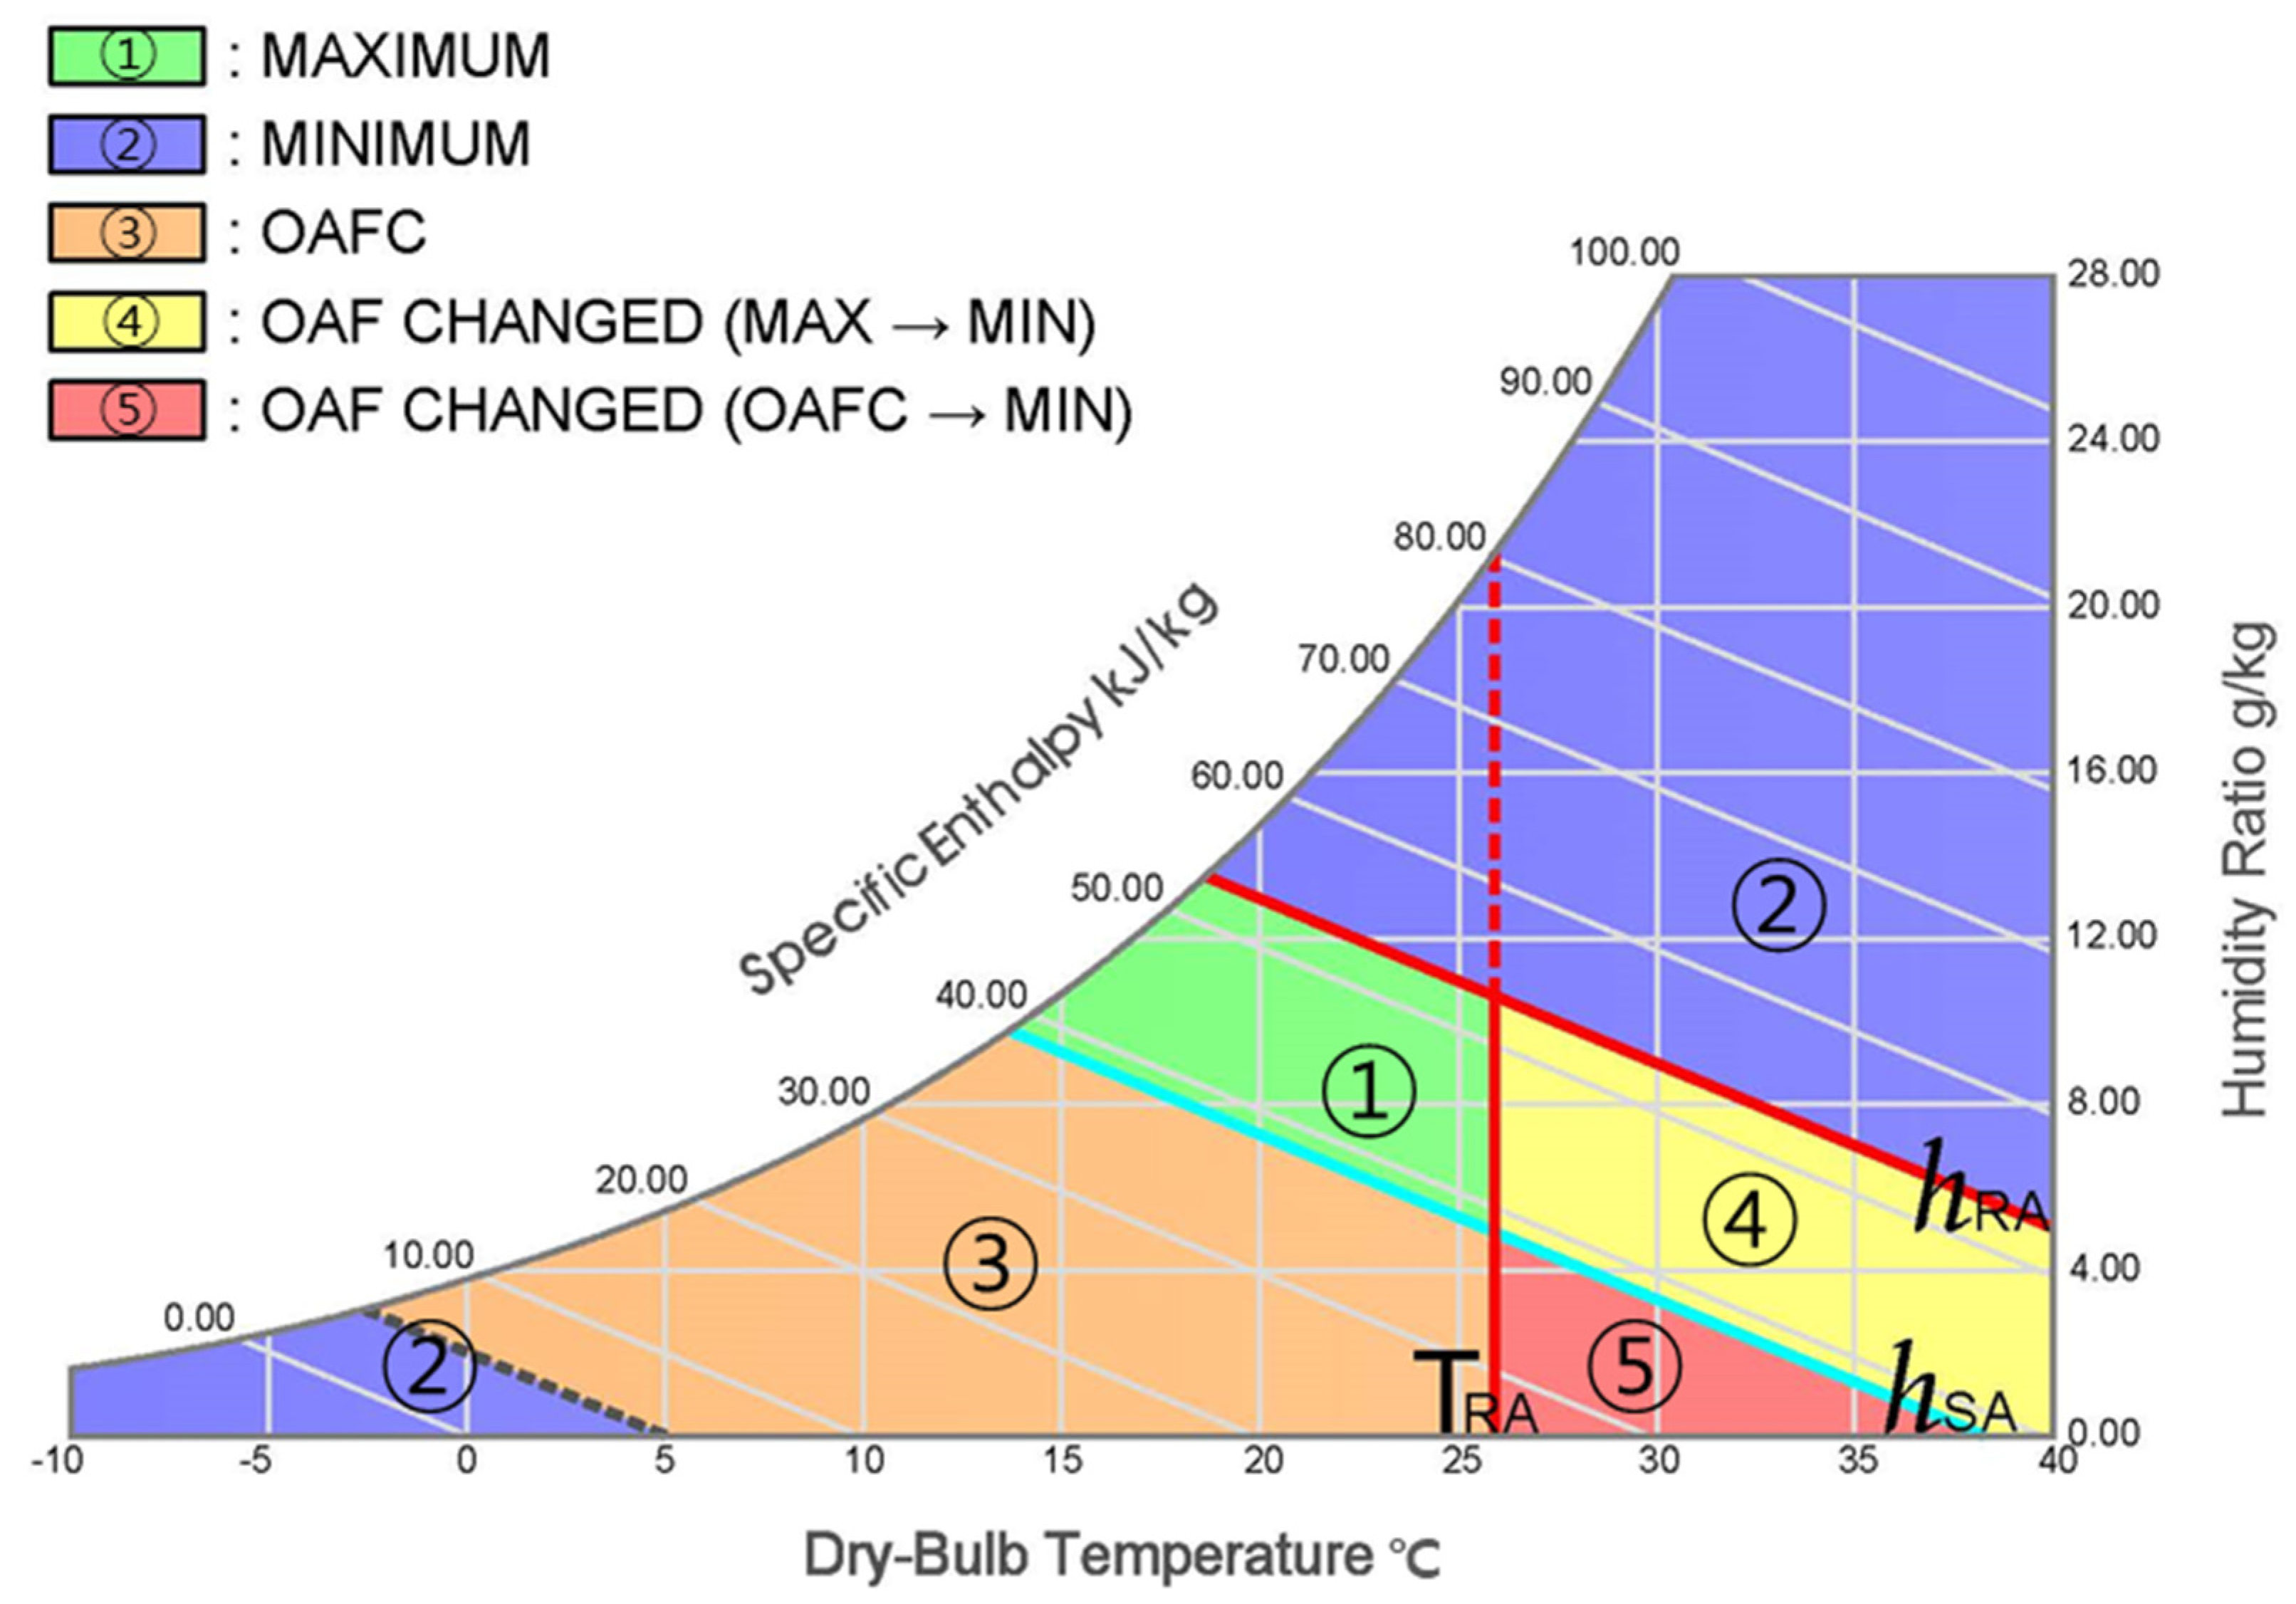
Section 2 describes the economizer control types and the optimal outdoor air fraction calculation methods for each control type.
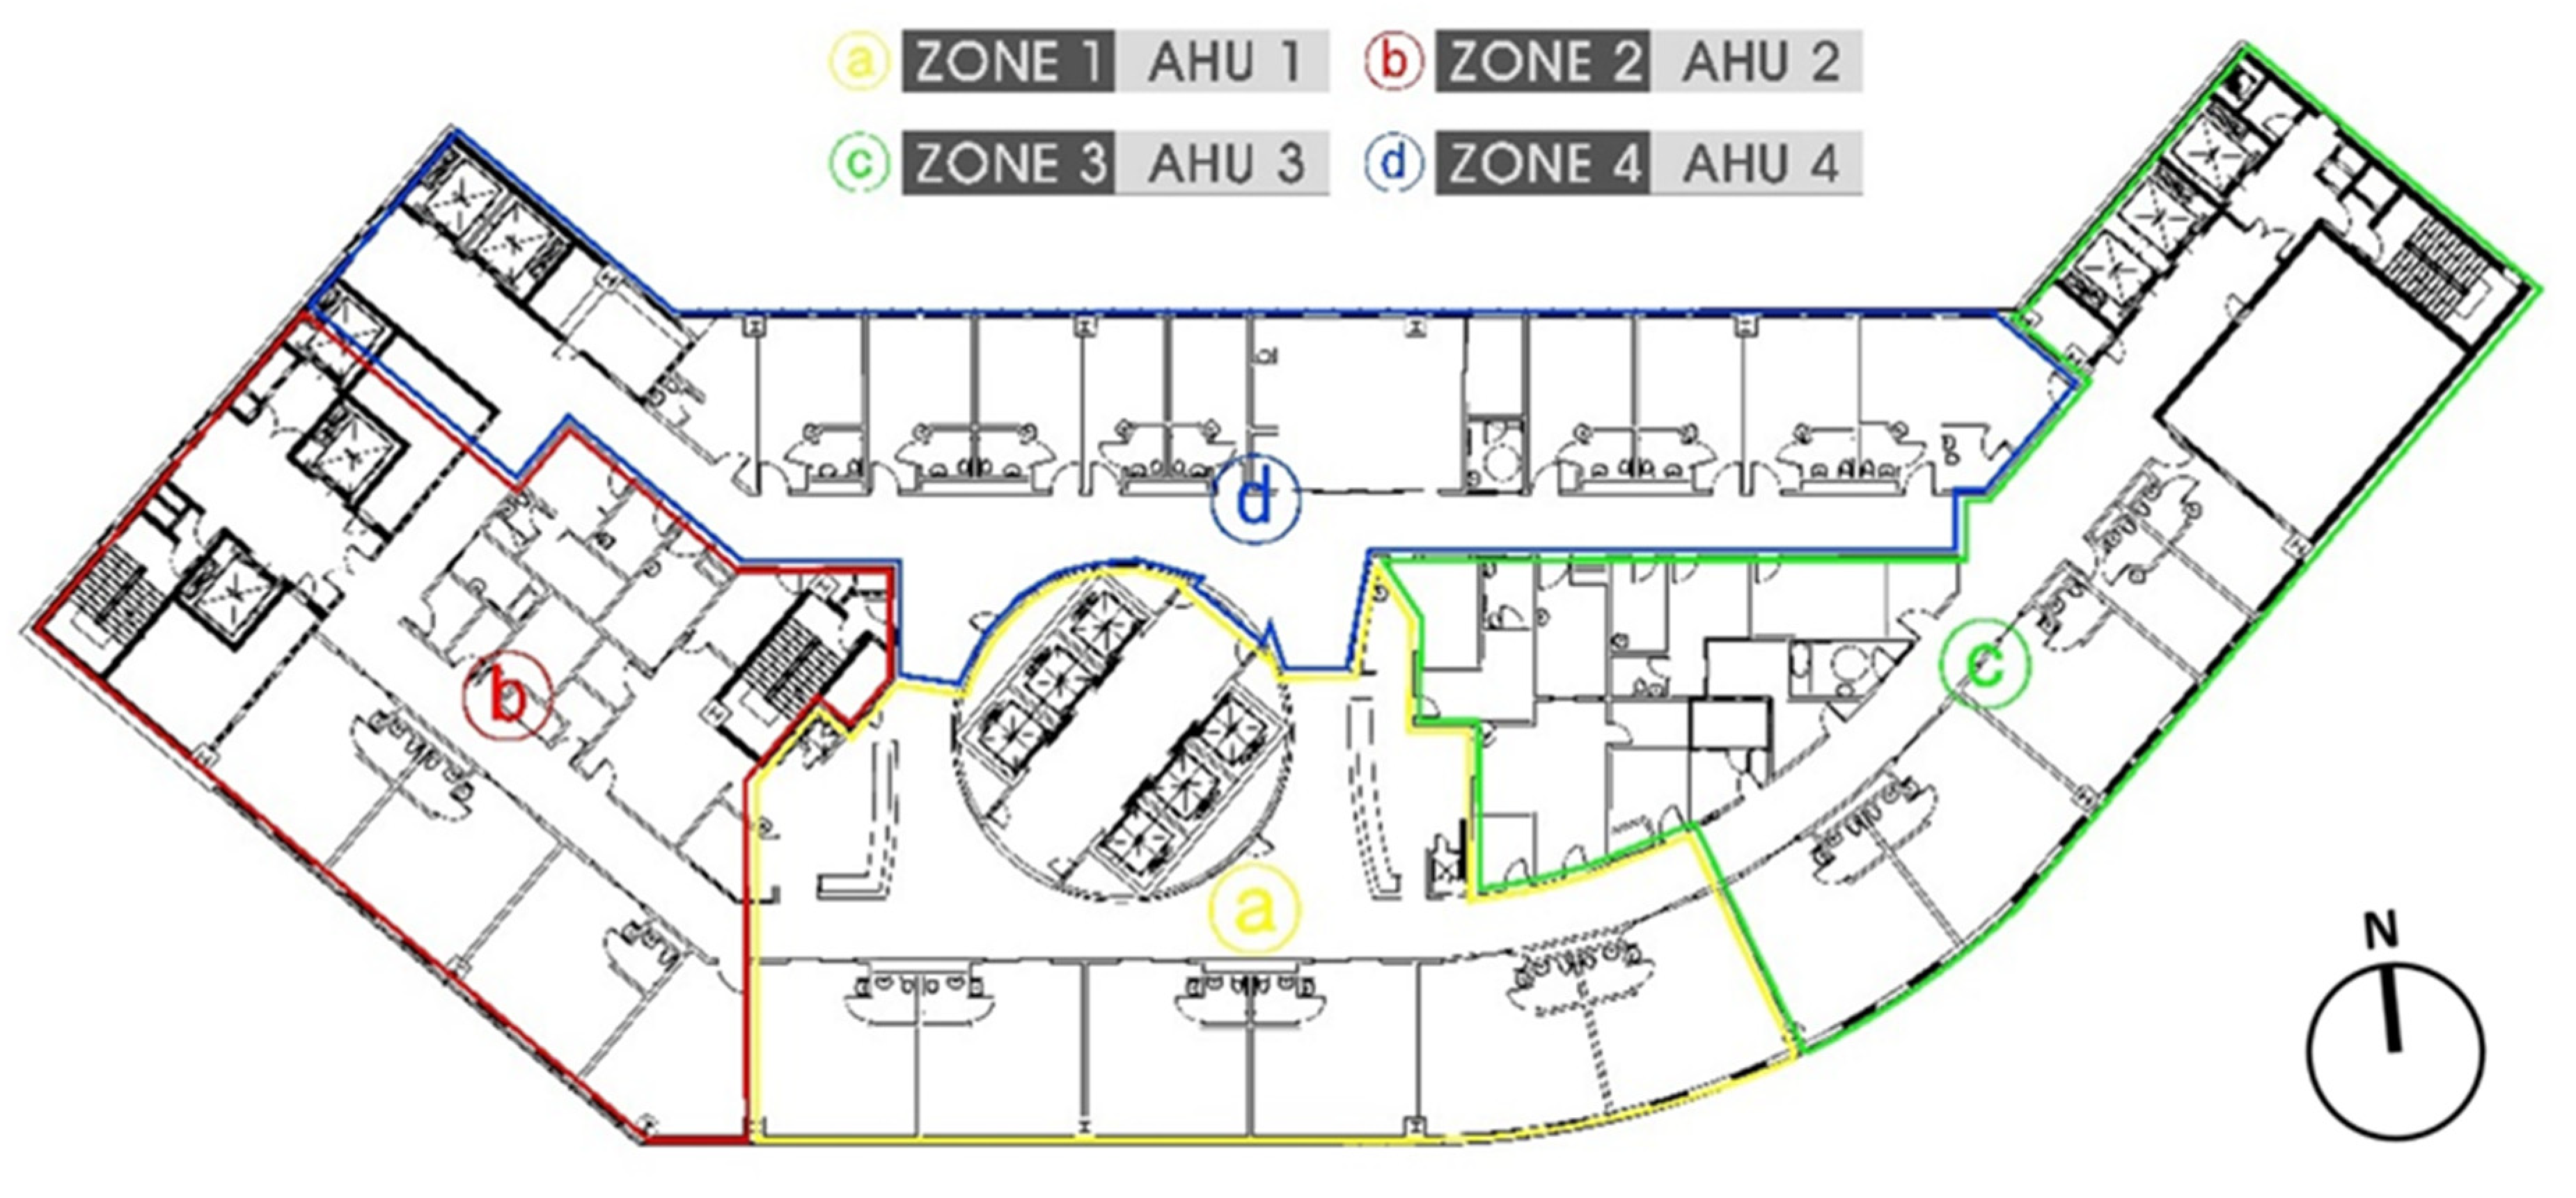
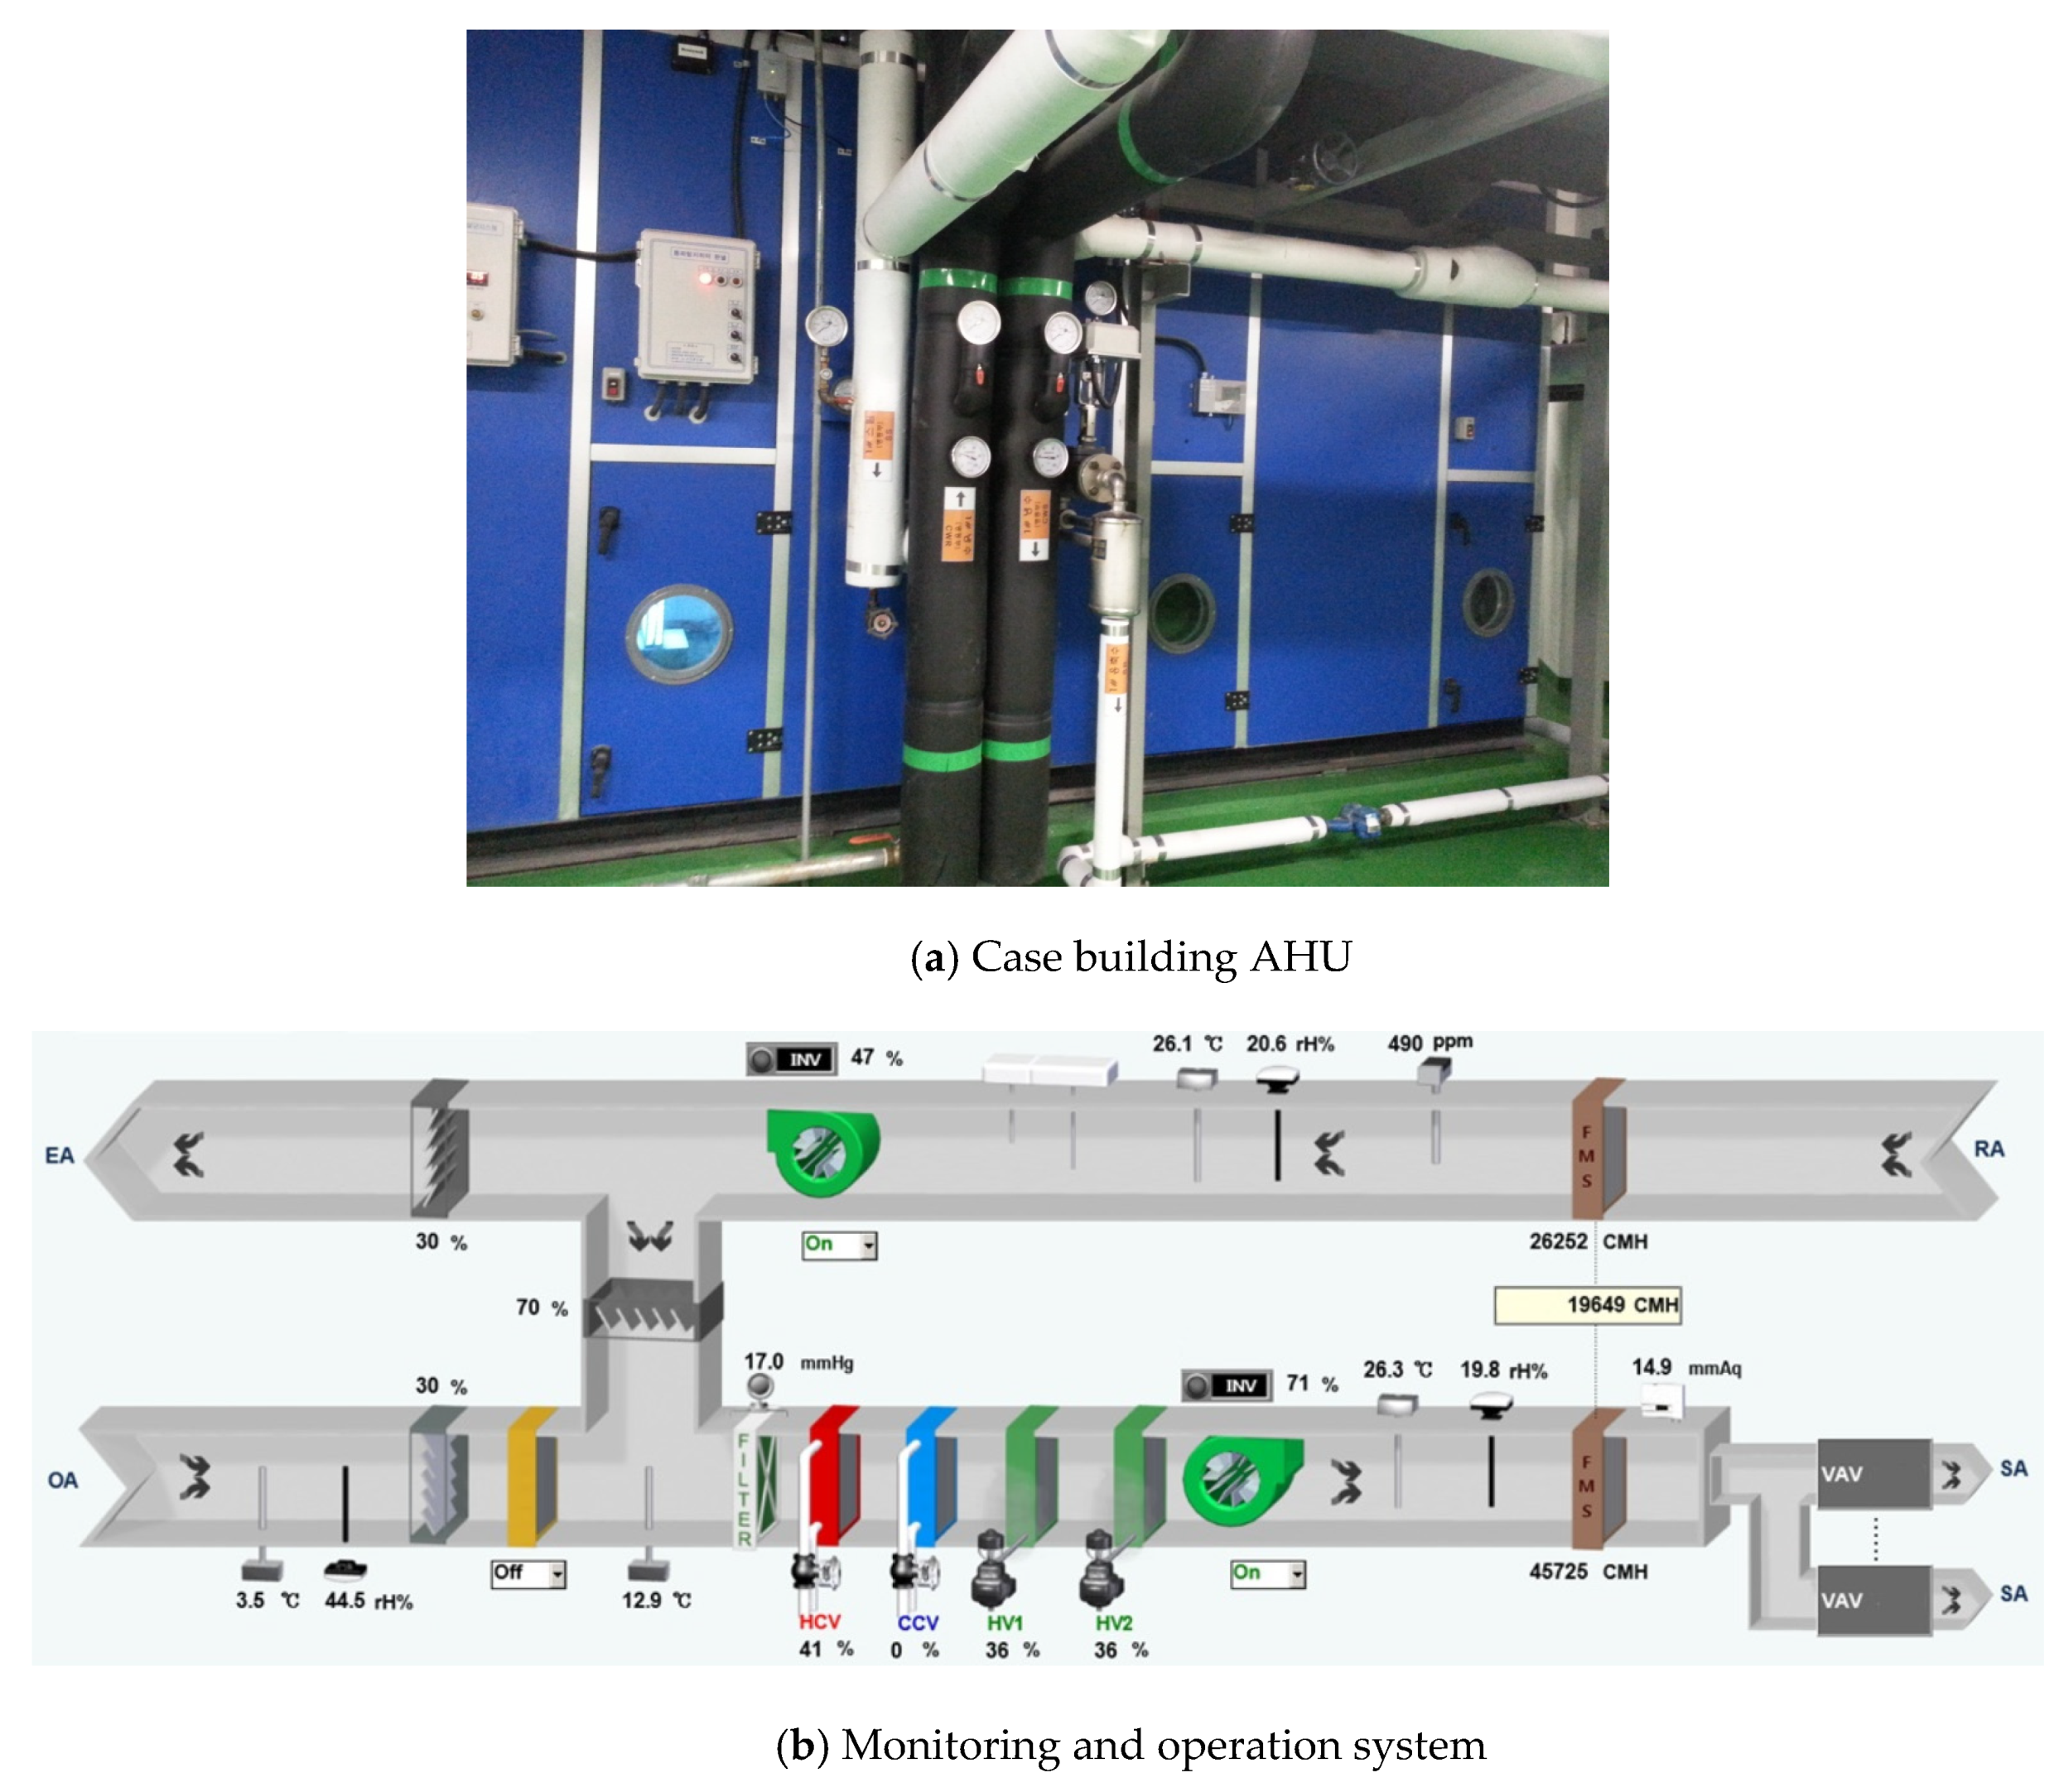
Section 3 introduces a case study building and its HVAC systems, and then demonstrates how to acquire building operation data from the air-handling units through the sensors. In
Section 4, the temperature distribution in the air-handing units is analyzed, and the outdoor air fraction is calculated using the actual operation data. Based on the optimal outdoor air fraction calculations, system cooling coil loads of four types of economizer controls were estimated and compared to compute potential energy savings in the hospital. The results of this study can contribute to the development of an energy-efficient HVAC driving method by interpreting actual building driving data for spring, summer, and fall when economizers are applied during the year in hot-humid climate zones. Moreover, recently, researchers have attempted to advance building system controls and algorithms using a variety of energy management platforms; thus, based on the outcome of this study, if the economizer can be integrated with such approaches, the economizer control methods would be more sophisticated and elaborate in HVAC systems.
4. Results
With using the actual building operational data to estimate cooling energy savings potential from economizer controls, this study investigated the optimal OAFs of the four economizer control types in AHUs. The OAFs were calculated for all control types, including the NE and actual operations. The system loads for each control type were projected based on the estimated OAFs. The result of the system loads demonstrated a significant possibility in cooling load savings in the hospital, depending on the control operation modes in economizer.
4.1. Outdoor Air Fraction of the Case Study Building’s AHU
A dataset of the OAFs, shown in
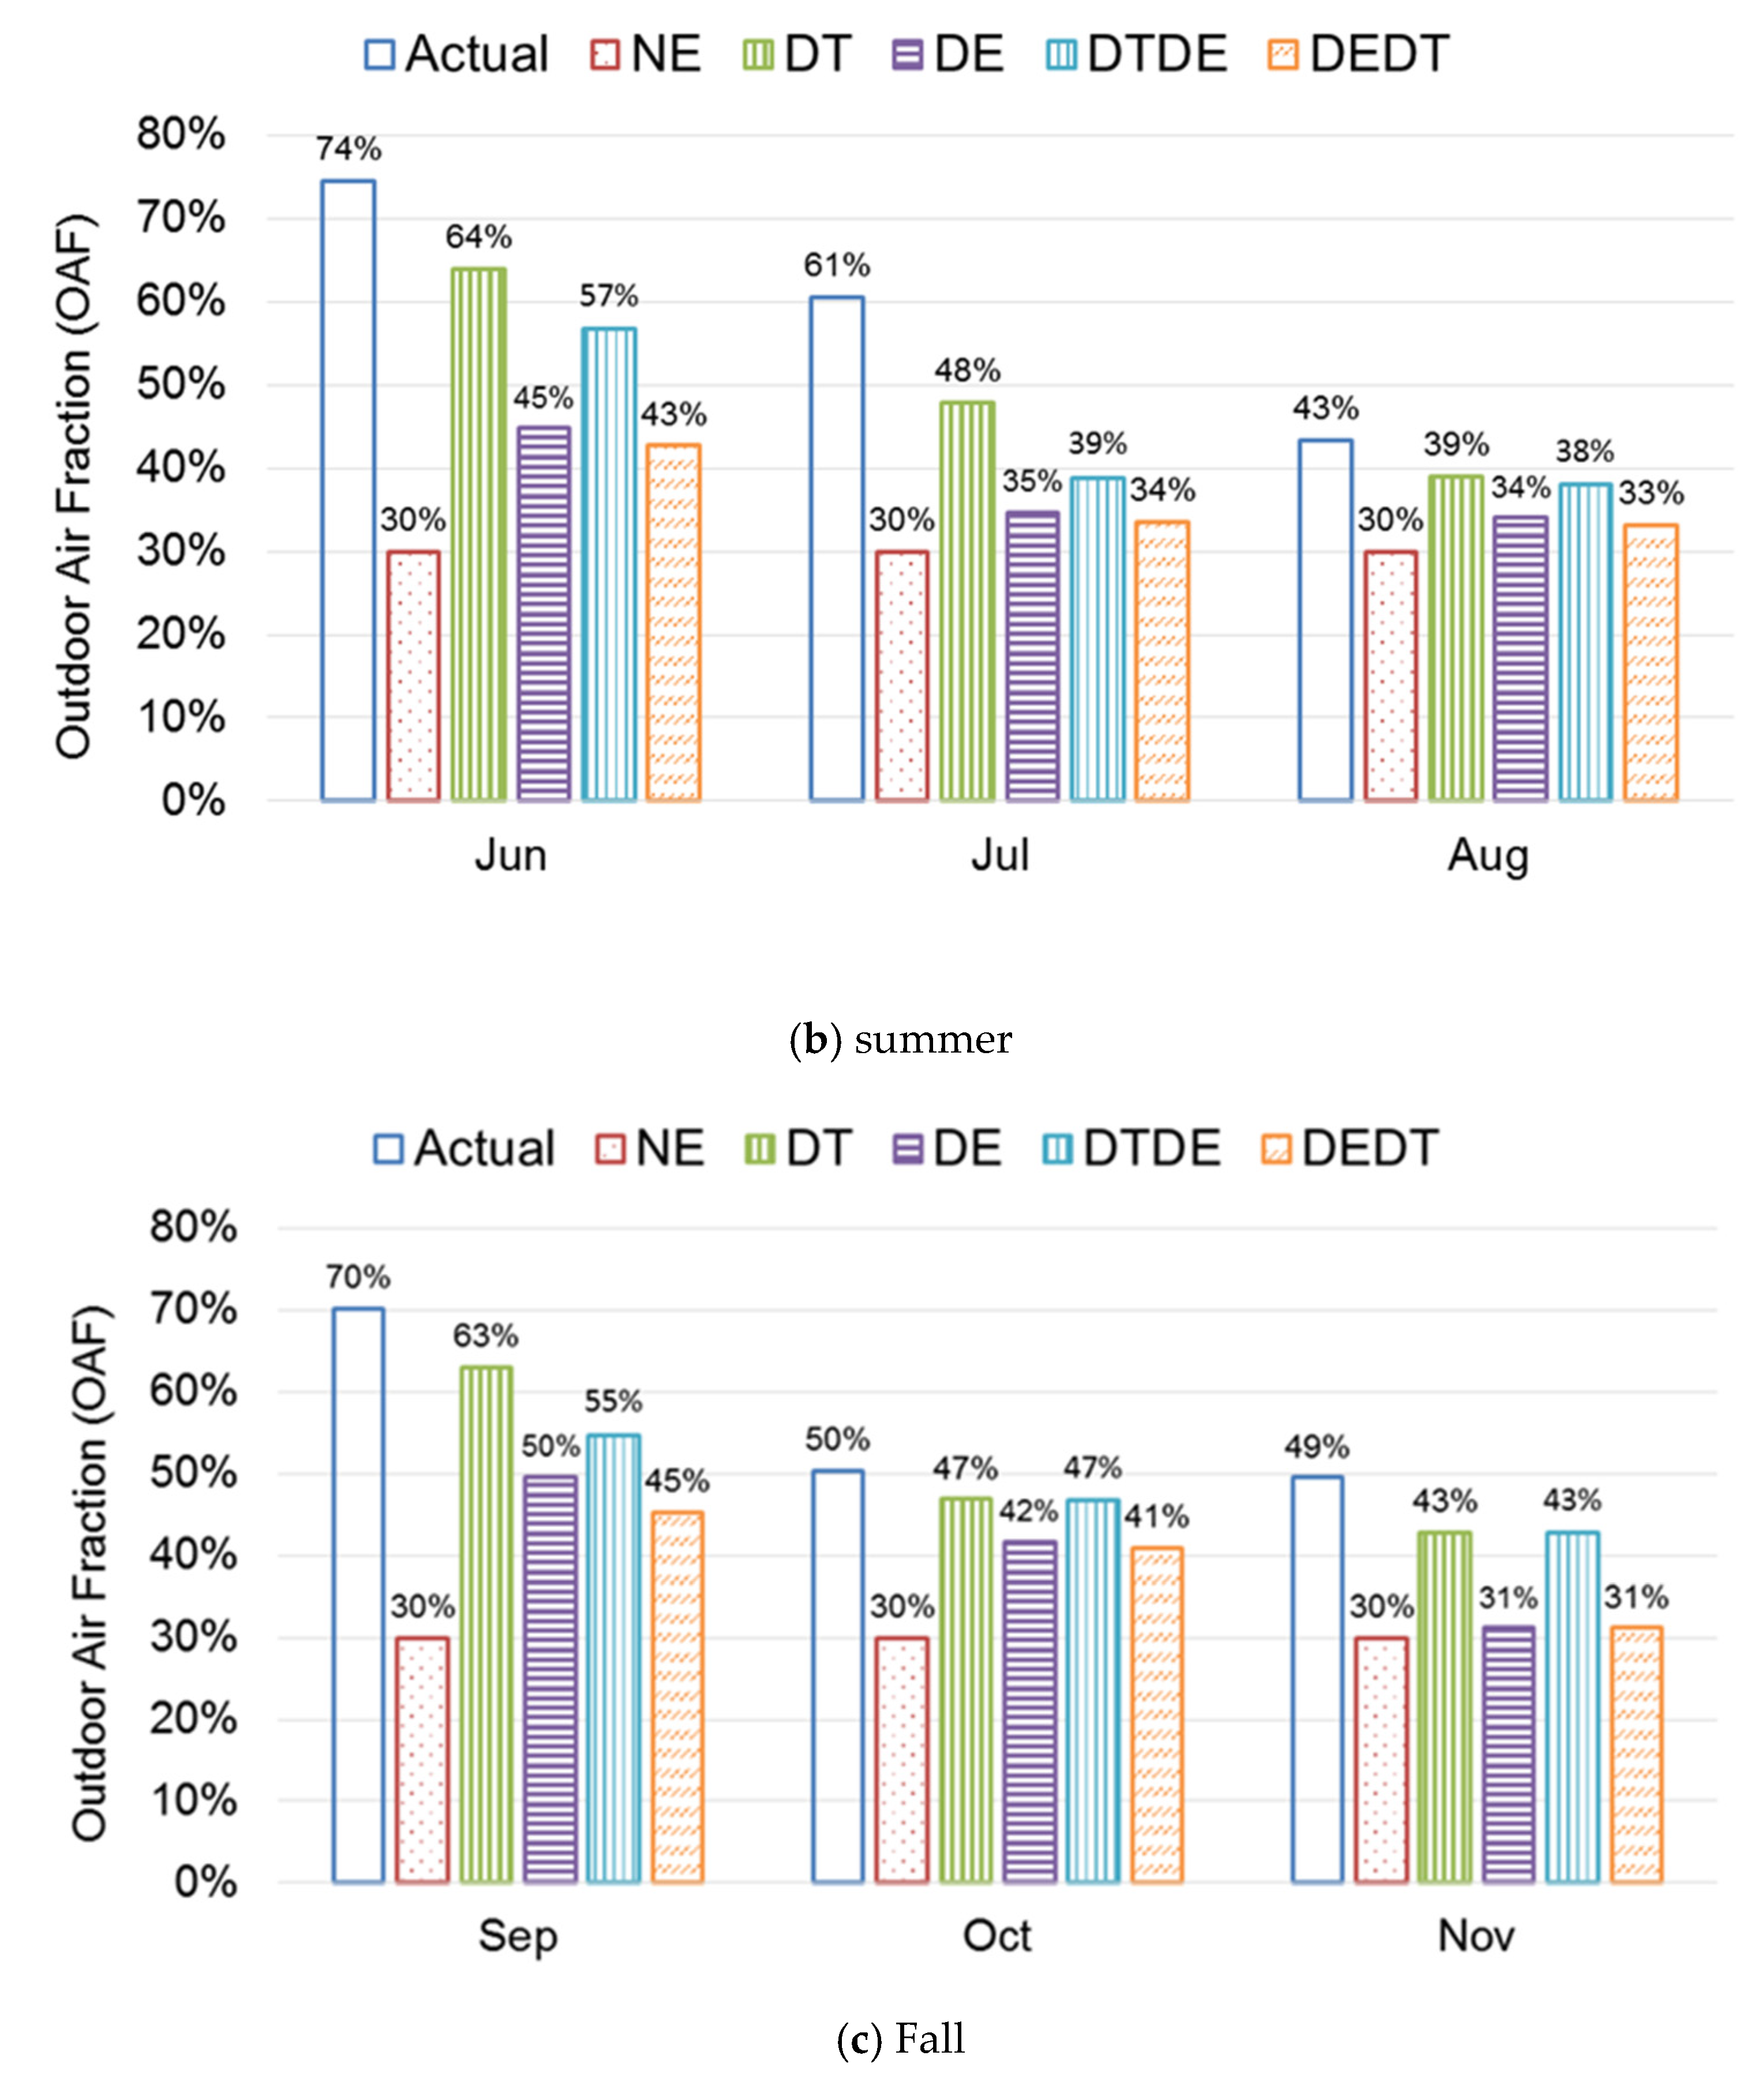
Table 4, represents actual outdoor air fraction data of AHU 1 from March to November. In spring, actual OAFs are 39–60%, and in summer, the OAFs was 43–74%. The OAFs of fall were 49% to 70% in 2016. The seasonal OAF average was 52–59% throughout the monitored period.
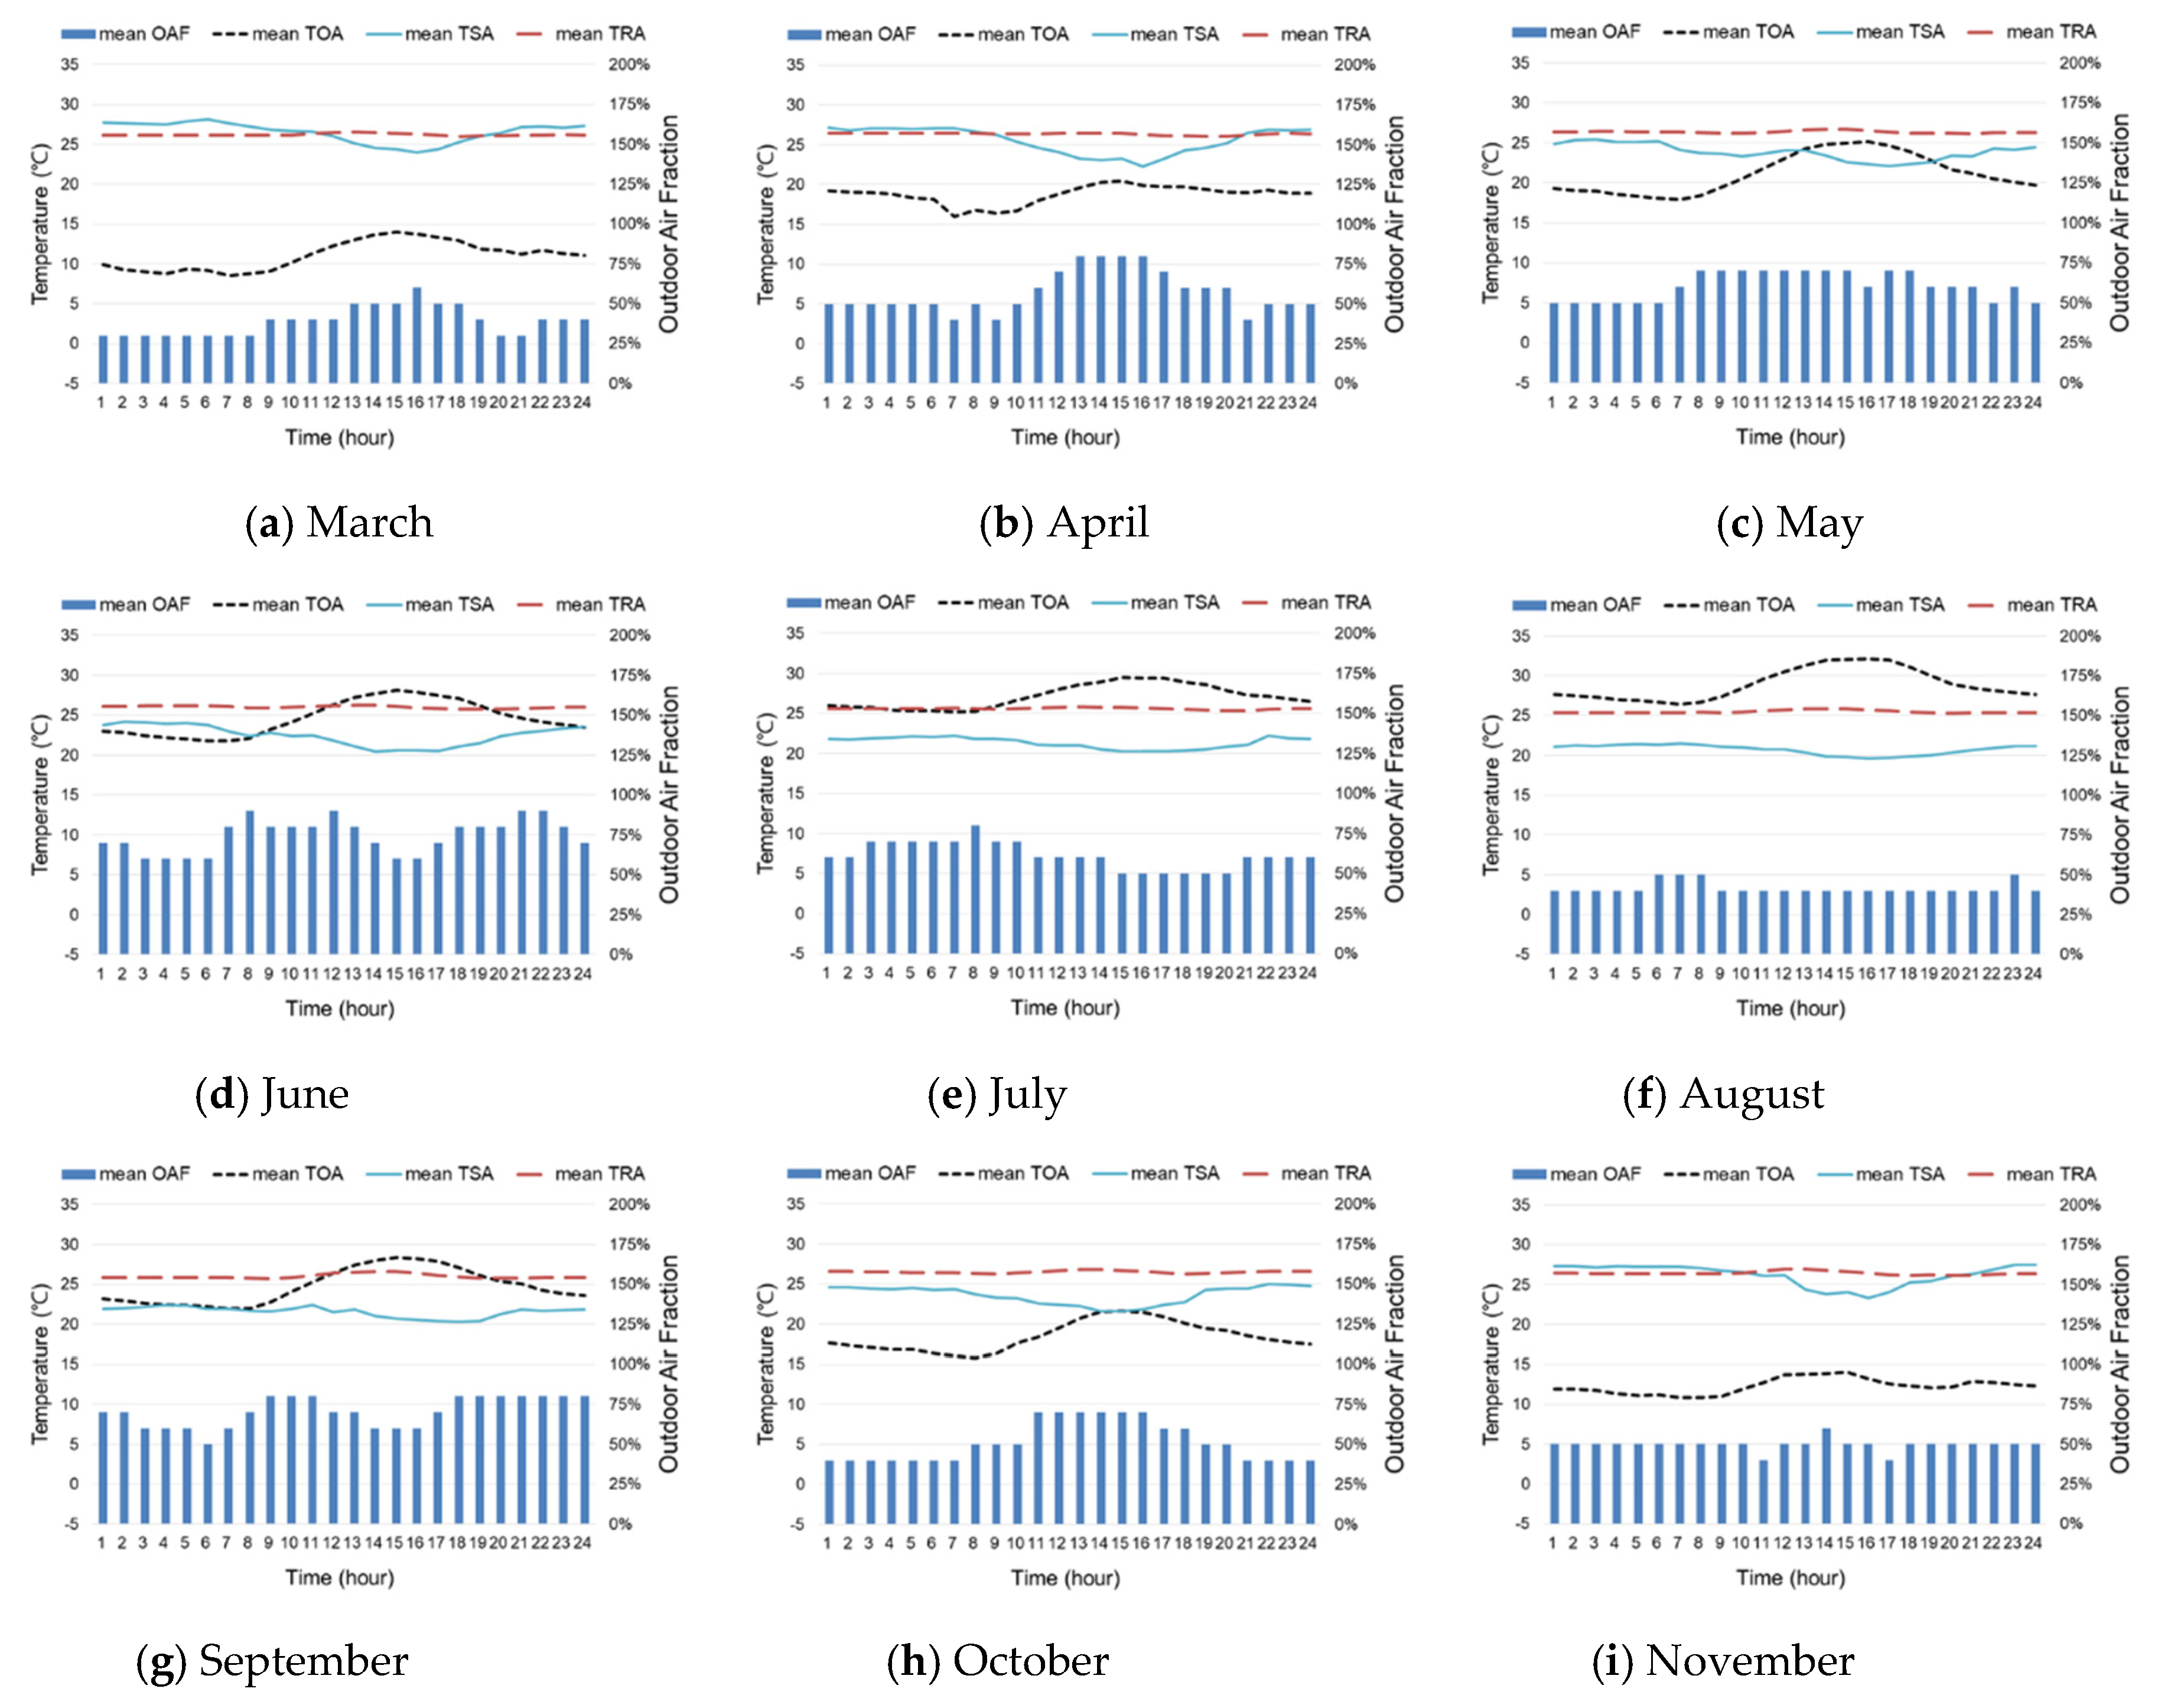
Figure 8 shows the OAFs, the mean TOA, the mean TSA, and the mean TRA of the case study building by season. The cooling setpoint temperature in the hospital was 26 °C for the season. The indoor air temperature was kept constant at an average of 26 °C.
In
Figure 8a–c, there was a pattern of the OAF that showed low fractions at night time in spring when the TOA was low. Moreover, the OAF increased during the day as the TOA increased and the TSA was low. However, the OAF was relatively consistent in May, when the TOA was higher than the TSA.
Figure 8d–f shows the monthly averages of the OAF and temperature distribution in summer. The OAF was the lowest if the TOA became higher than the TSA and TRA. Since the distribution of TOA was mostly higher than the TSA and the TRA during August, the OAF was fixed at the minimum value. In September, the OAF increased when the TOA was lower than the TRA, as shown in
Figure 8g–i. When the TOA is higher than the TRA, it is necessary to maintain the minimum OAF. In the graph, this means that the OAF was continuously kept low. In October, the distribution patterns of the OAF and the TOA were similar in trends. In November, the overall OAF was lower than in October.
Briefly, in the plots of the TOA and the OAF by month, the OAF is constantly fluctuating depending on whether the TOA and the TSA are higher or lower than the TRA. In the spring and fall, when the TOA is lower than the TRA, free cooling is possible instead of mechanical cooling operations according to the appropriate OAFs. Therefore, to support effective economizer operations, the calculation of the optimal OAF is important—considering the TSA, and not merely comparing the TOA and the TRA for economizer controls.
4.2. Optimal Outdoor Air Fraction (OAF) by Economizer Control Types
In this chapter, the optimal OAF of different economizer control types was calculated using operational data in AHU 1 and the Equations (1) and (2). The OAF is very significant in economizer performance calculations to reduce gaps between the TSA and SAE and the TMA and the mixing enthalpy (MAE). If the TSA and SAE are equal to the TMA and MAE, the system cooling loads will be zero. Therefore, many parts of economizer controls depend on the OAF calculations to match the TSA and SAE and the TMA and MAE as much as possible, which could provide improved energy efficiency in HVAC systems to reduce wasted cooling energy.
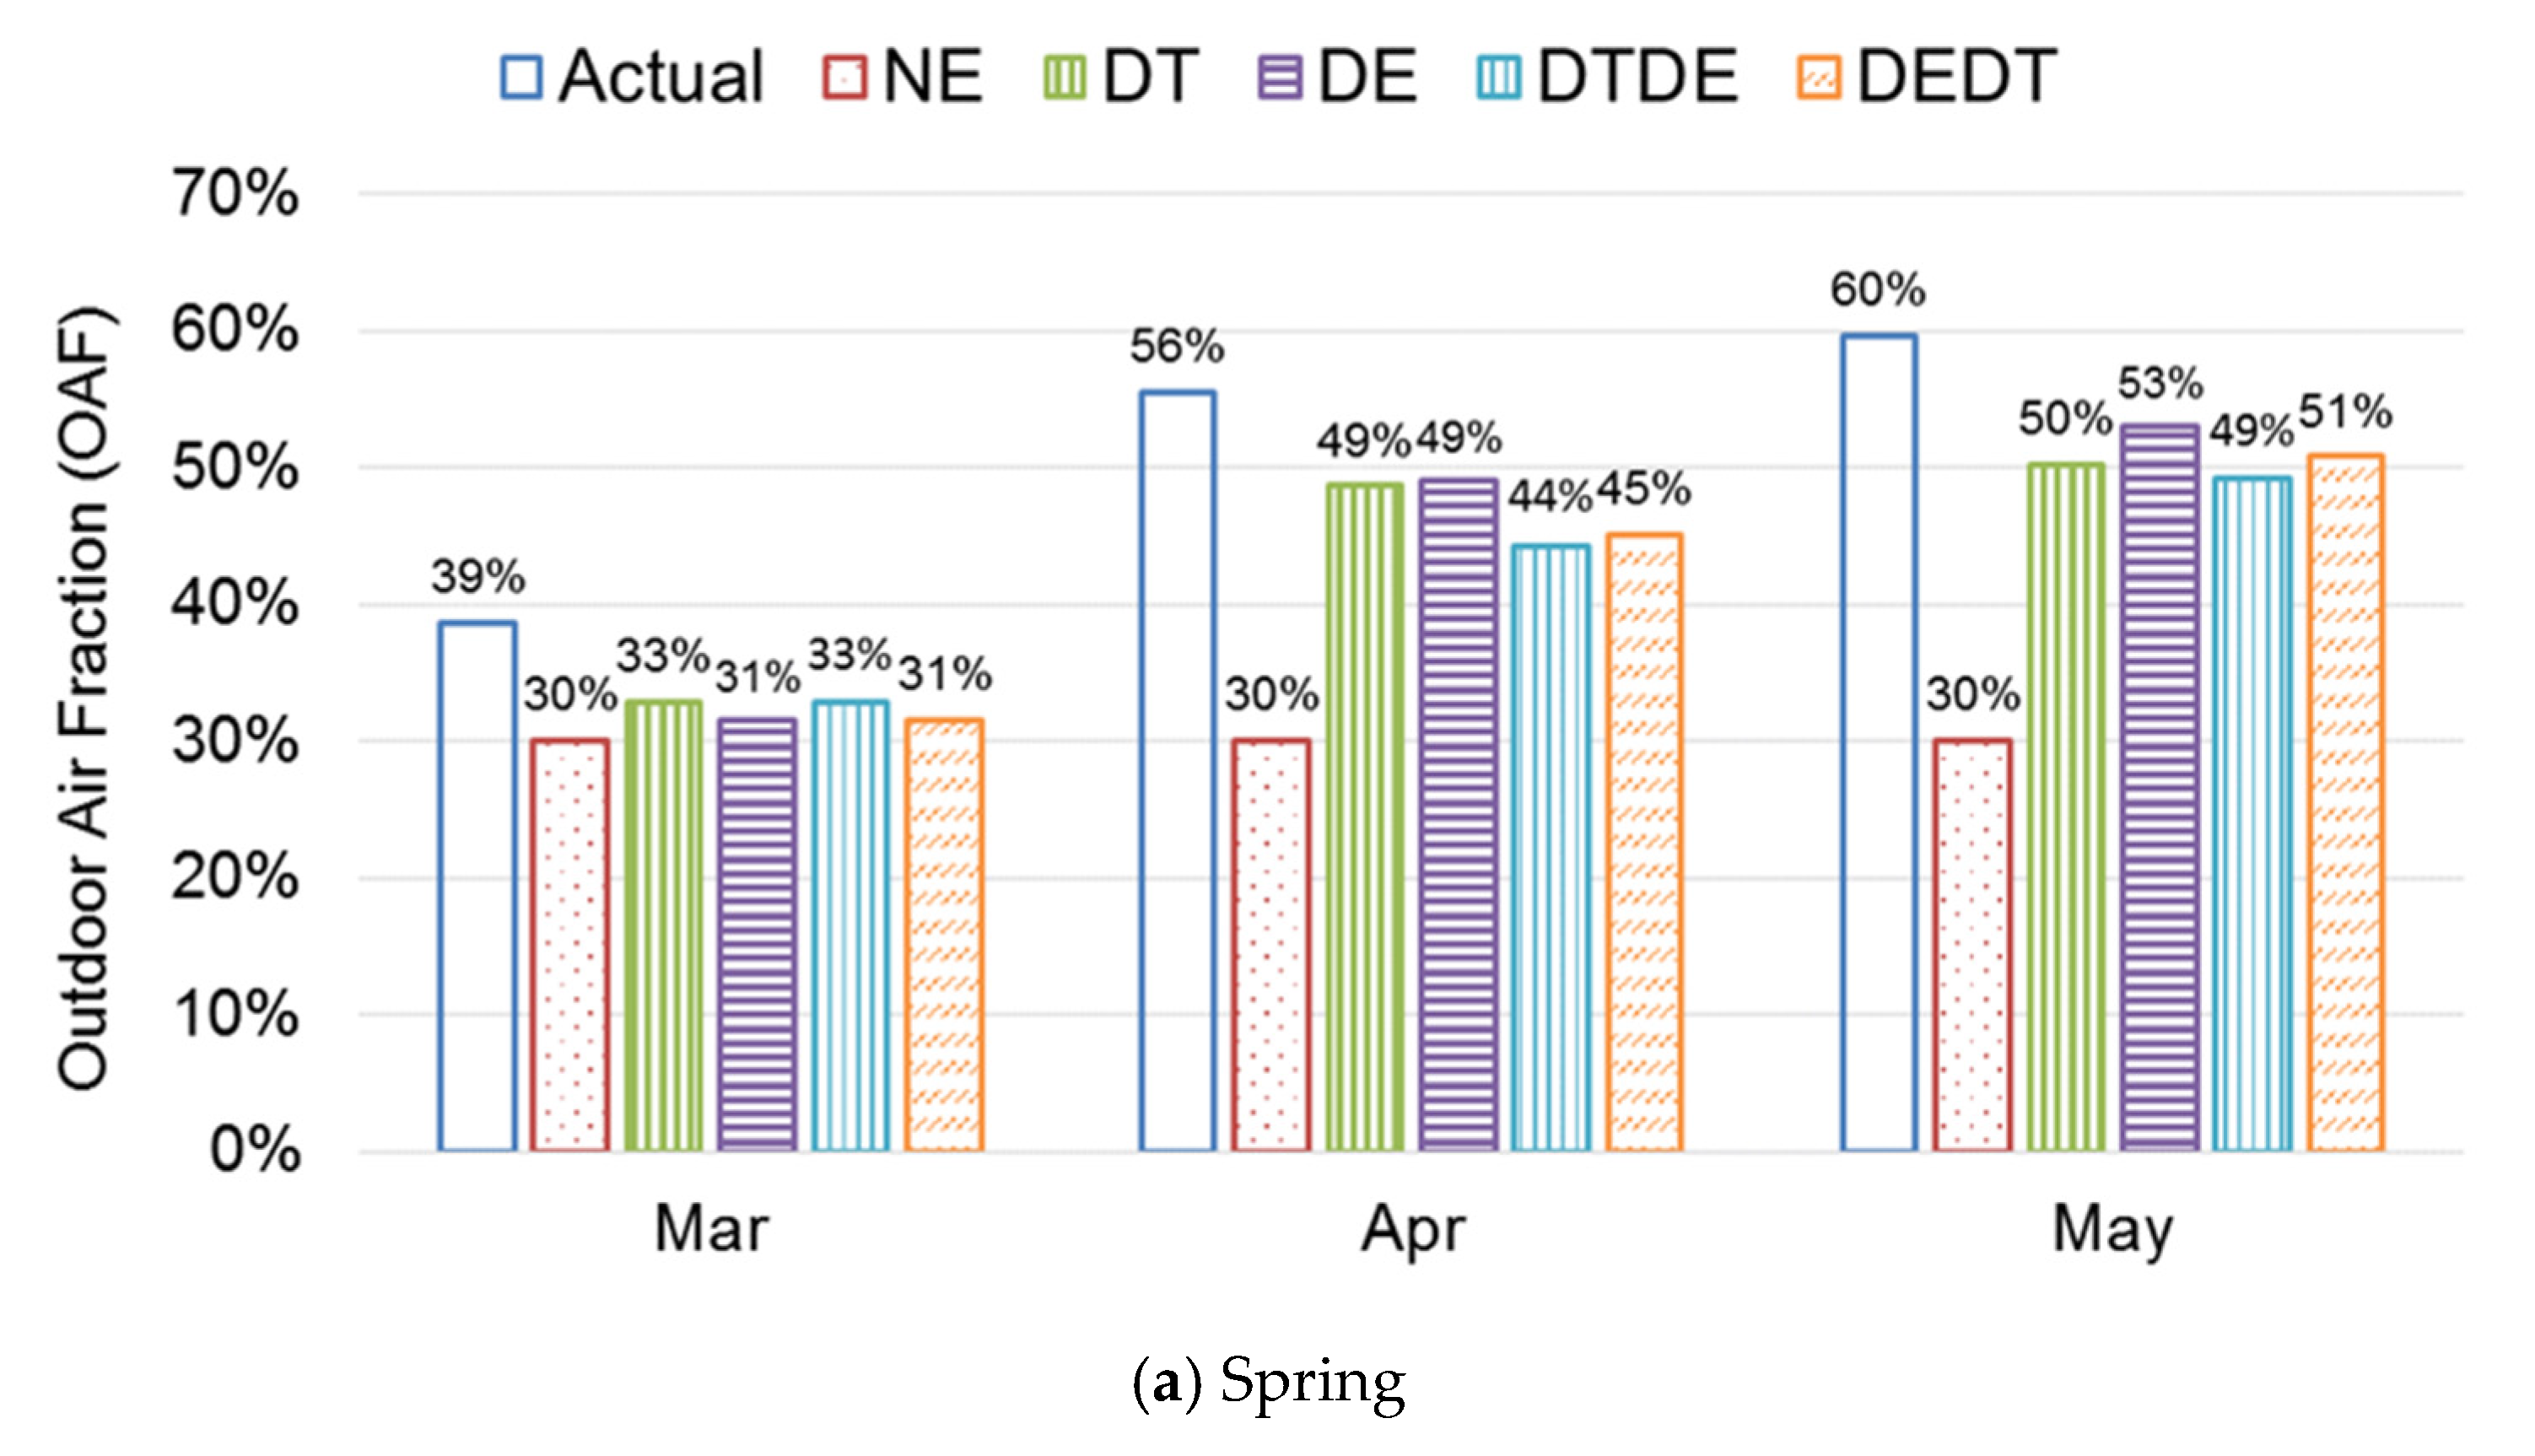
Figure 9 represents actual OAF from the case study building and the calculated optimal OAF by economizer control types. The estimated OAF of different control types was compared with actual operation OAF data (Actual) and no economizer (NE) mode. In spring, the trend of the OAF was a steady increase from March to May in four control types. The OAF for the actual operation was 39% in March, and the OAF for the control types was 31–33%. April and May introduced 10–20% more outdoor air, compared to March. In summer, the pattern of the OAF was a gradual decrease from June to August except the NE control. The actual operation data from the building was the highest compared to all control types, and the DT control introduced the largest amount of outdoor air among control types. The range of actual OAF in summer was 43% to 74%, and the OAF of economizer controls was 33% to 64% between control types. In the summer season (e.g., July, August), it is difficult to use free cooling due to the high outside air temperature and enthalpy. In the fall, the OAF pattern from September to November declined, which was similar to the summer. The OAF of the actual operation changed 49% to 70%, and the economizer controls showed the range of 31% to 63%.
In a comparison of OAF between different economizer control types, the proportion of the OAF was highest in the DT control. The DT control method in spring represented a similar distribution with the DE control. However, in summer, the DT control method showed the highest values in June. The distribution rate of the OAF lowered in July and August compared to spring. In fall, the highest OAF was during September.
From the AHU data, in May and September, the economizers showed the highest free cooling potential. The OAF of the actual operation was 3–13% higher than other economizer control types in spring to fall. The results of the optimal OAF demonstrate that each control type had different OAFs depending on the seasonal change from March to November. Based on the OAF calculations, the system cooling loads were estimated, and the most energy-efficient control type was analyzed. This is significant to analyzing actual building operation status with economizers quantitatively, which can be used to calculate potential energy savings in the cooling coils and propose the most energy-efficient economizer control type in the hospital.
4.3. System Loads by Control Types
This study calculated cooling coil loads at the system level. Free cooling using an economizer can reduce the waste of cooling energy from spring to fall. The optimal OAF of economizer controls highly contributed to the cooling coil load savings of HVAC systems in the studied building. In calculations, the effect of the economizer cycle varied depending on the control types. Free cooling is available with economizer systems if the TMA or the MAE meets the TSA or the SAE. According to the changes to the OAF in different economizer control types, the amount of the MAE changes. To estimate energy performance in the economizer, Equation (3) is used to calculate the system loads based on the difference between the MAE and the SAE.
where
= air density (kg/m
3), Q = air flow rate (m
3/h), and
= difference of enthalpy (kJ/kg)
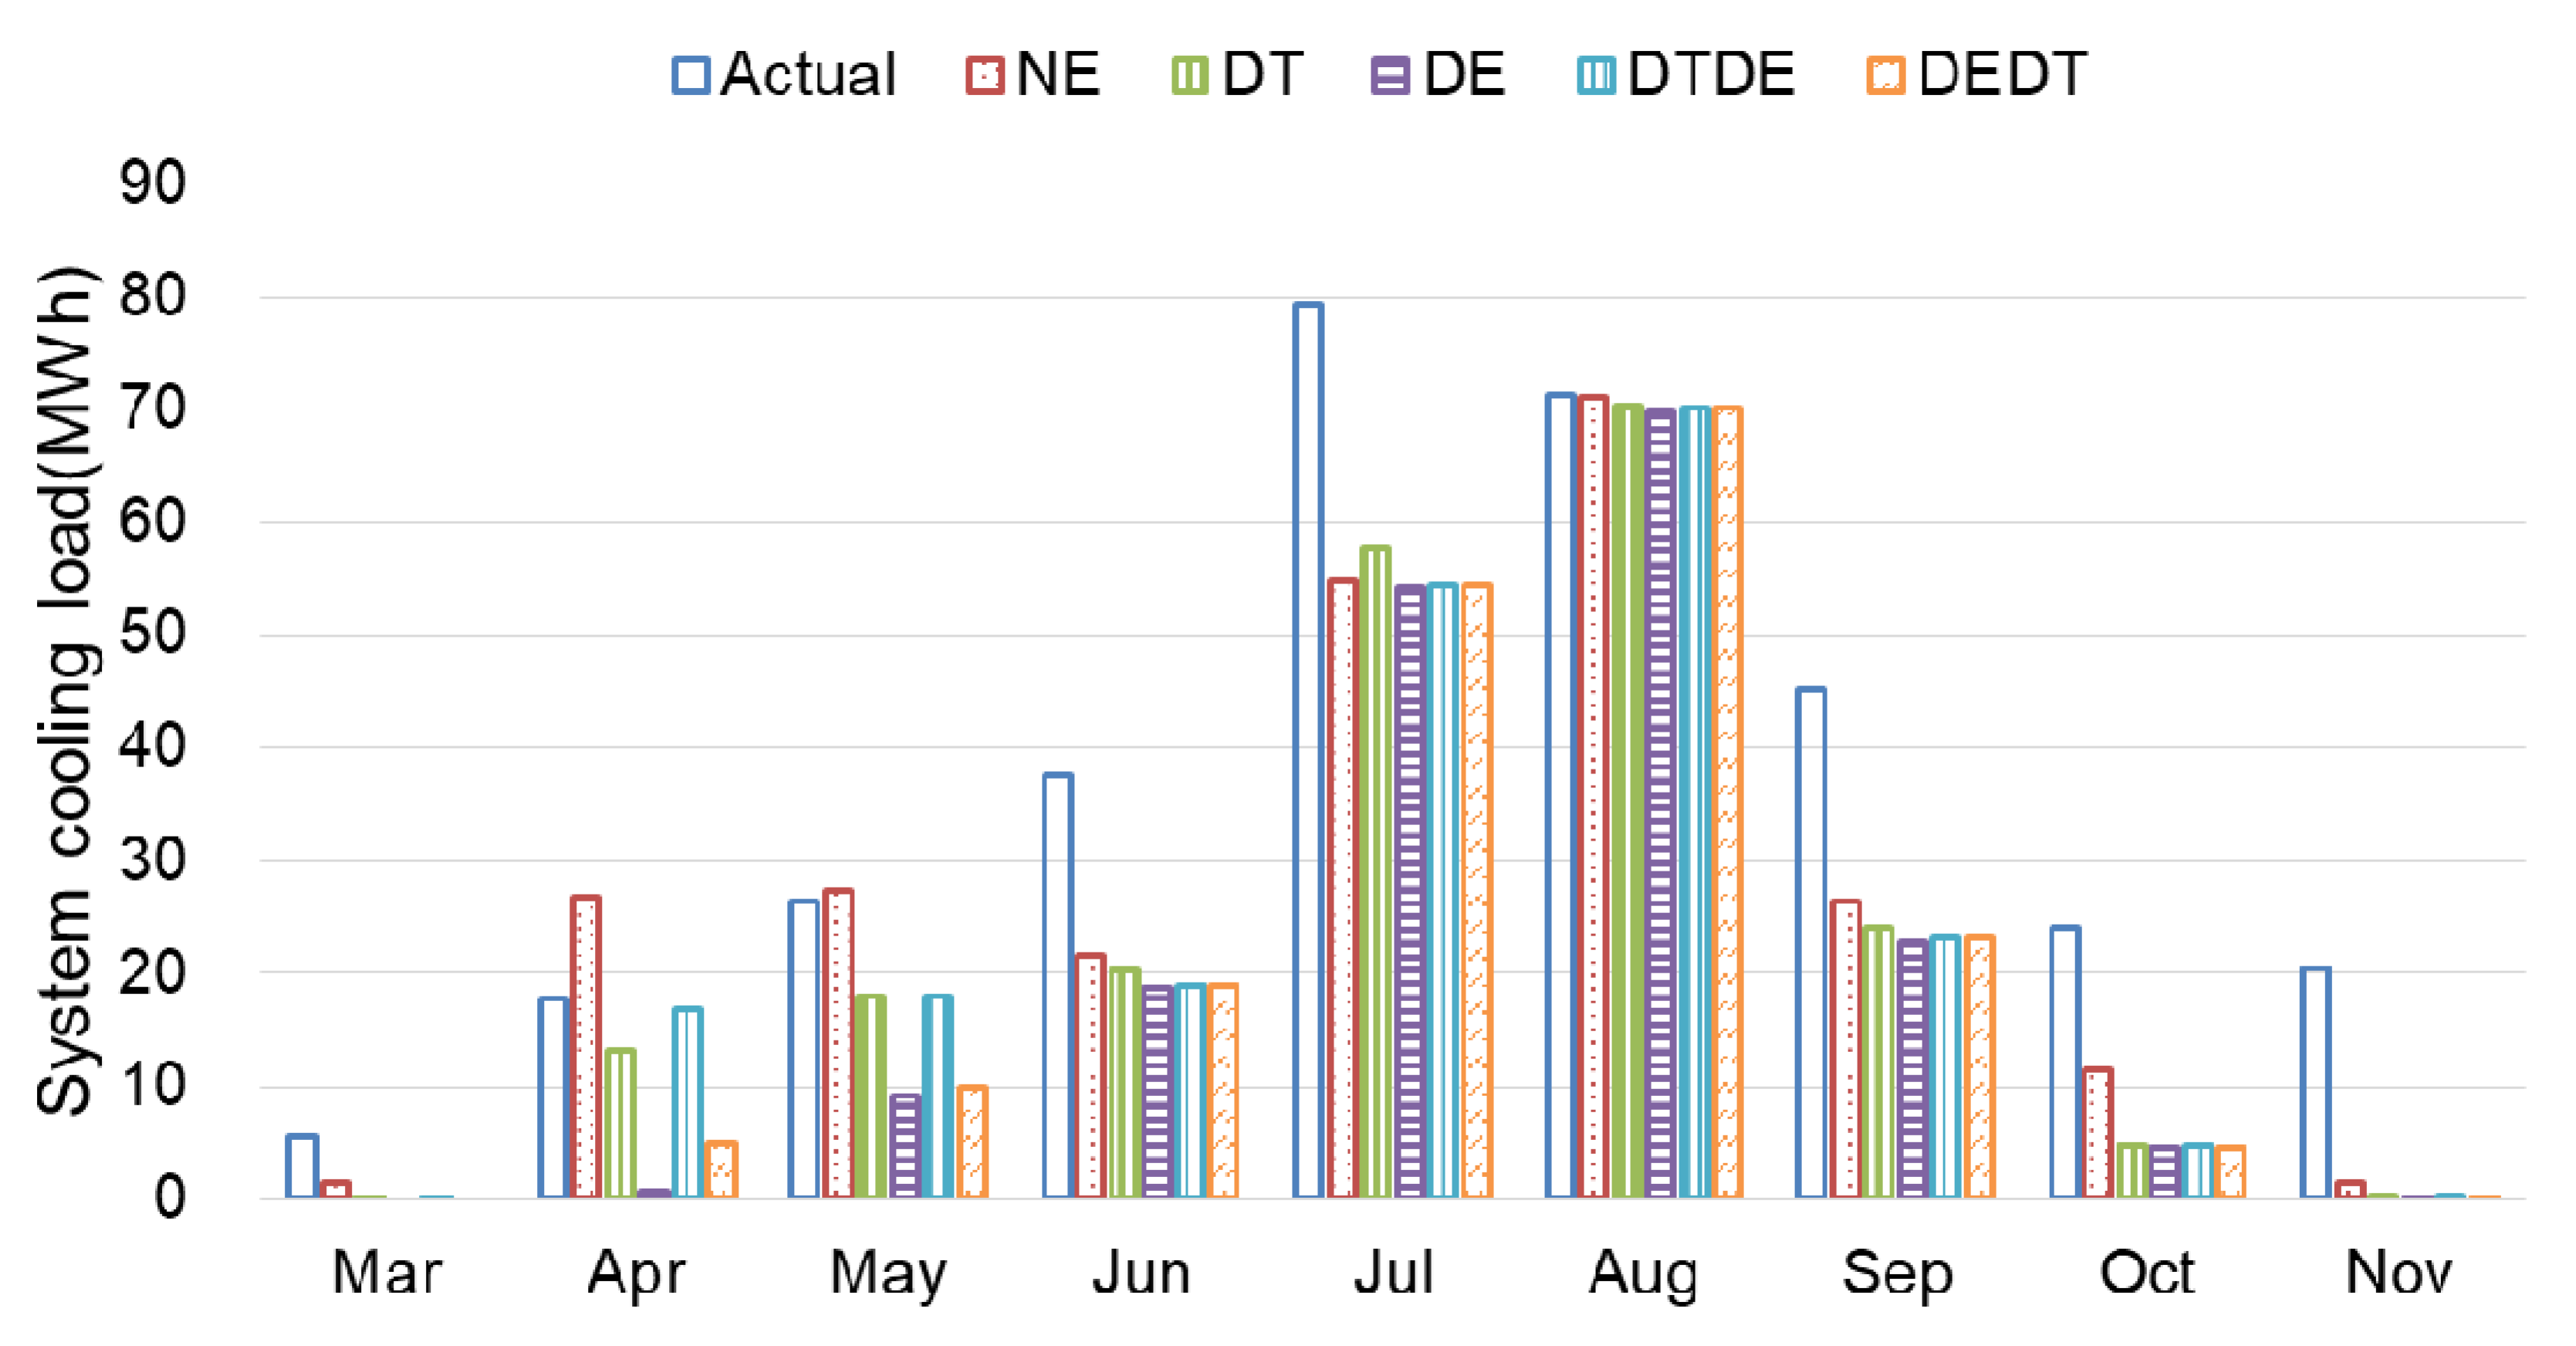
Figure 10 shows the calculated system cooling loads of AHU 1 on the monthly average by control types, including actual operation and the NE control. In spring, the DE control method showed a very small system cooling load in April. Thus, for the case study in April, the DE control method can be used effectively to gain the greatest reduction in cooling energy consumption. The actual system cooling loads of AHU 1 from March to May were 49.7 MWh. In spring, the cooling system loads for the DE method were 9.7 MWh, which can save five times more energy than the actual operation. The NE control showed that 55 MWh was the highest system cooling load. Thus, in spring, the NE control used roughly six times more cooling energy than the DE control. Among the economizer control methods, the DE method, which uses enthalpy control, was the best energy conservation system for the hospital.
In summer, the distribution of monthly system cooling loads was similar between control types. In July and August, free-cooling was rarely used in most economizer control types due to high temperature and humidity in Seoul, where the target building is located. Thus, the distribution of system cooling loads was almost the same, regardless of the different economizer control types. The actual system cooling loads were relatively high from June to August, and the OAF was roughly 4–30% more than the economizer control types. The system cooling loads of the DT control were higher than the NE control. This is because, in the DT control, the latent loads cannot be considered.
In the fall, the system cooling loads were relatively small in October and November. The system cooling loads for September and October were similar between the control types, excluding the NE control. The DE control had the lowest cooling loads of 27.3 MWh. The actual building recorded 89.7 MWh, and the NE control represented 39.3 MWh of the cooling loads during the fall. The DE control showed roughly 31% less cooling energy than the NE control and 67% less than the actual operation.
In summary, the system cooling loads of the case study building were investigated for nine months except winter. The DT control type had the highest system cooling loads of four control types.
Table 5 shows the system cooling loads by the economizer control methods and the energy-saving ratios compared to actual building data and the NE control. The actual operation of the hospital building consumed more cooling energy than other economizer control types.
Table 5 shows that the system cooling loads in actual case-building operations were 328 MWh for cooling seasons (March to November). When comparing to all economizer control types, the actual operation consumed 36–45% more cooling energy. Moreover, compared to the NE control method, the potential cooling energy savings were up to 14% for the DT control, 25% for the DE control, 15% for the DTDE control, and 23% for the DEDT control. In a comparison between the DT control and the DTDE control, the system cooling loads of the DTDE control were 3 MWh lower than the DT control. Since outdoor air has high humidity around summer, the DTDE control could work effectively using high limit control of enthalpy than the DT control. Similarly, the DEDT control was roughly 6 MWh higher than the DE control. In the case of the DEDT control, it should be operated at the minimum OAF due to the high limit of the DT control where the maximum OAF should be operated in the DE control. In a comparison of the total cooling loads using optimal OAFs in economizer systems, the control types of the DE series (i.e., DE, DEDT) were the superior methods to the DT control type series (i.e., DT, DTDE). The DE control showed 13.9% less energy use in cooling systems than the DT controls, and the DEDT control used 10.0% less energy than the DTDE control in cooling coils.
4.4. System Cooling Loads and Energy Savings Potential by Control Types in AHUs
In the case study building, four AHUs (i.e., AHU 1–4) were operated based on building orientations. The interior and exterior environmental differences in thermal zones, such as different outdoor temperatures, heat gains, window-to-wall ratios, space programs, and occupancy rates in the patient rooms, make the discrepancies in system cooling loads. Therefore, this chapter investigated all four AHUs system loads to analyze the cooling system performance and energy savings potential of economizer control types.
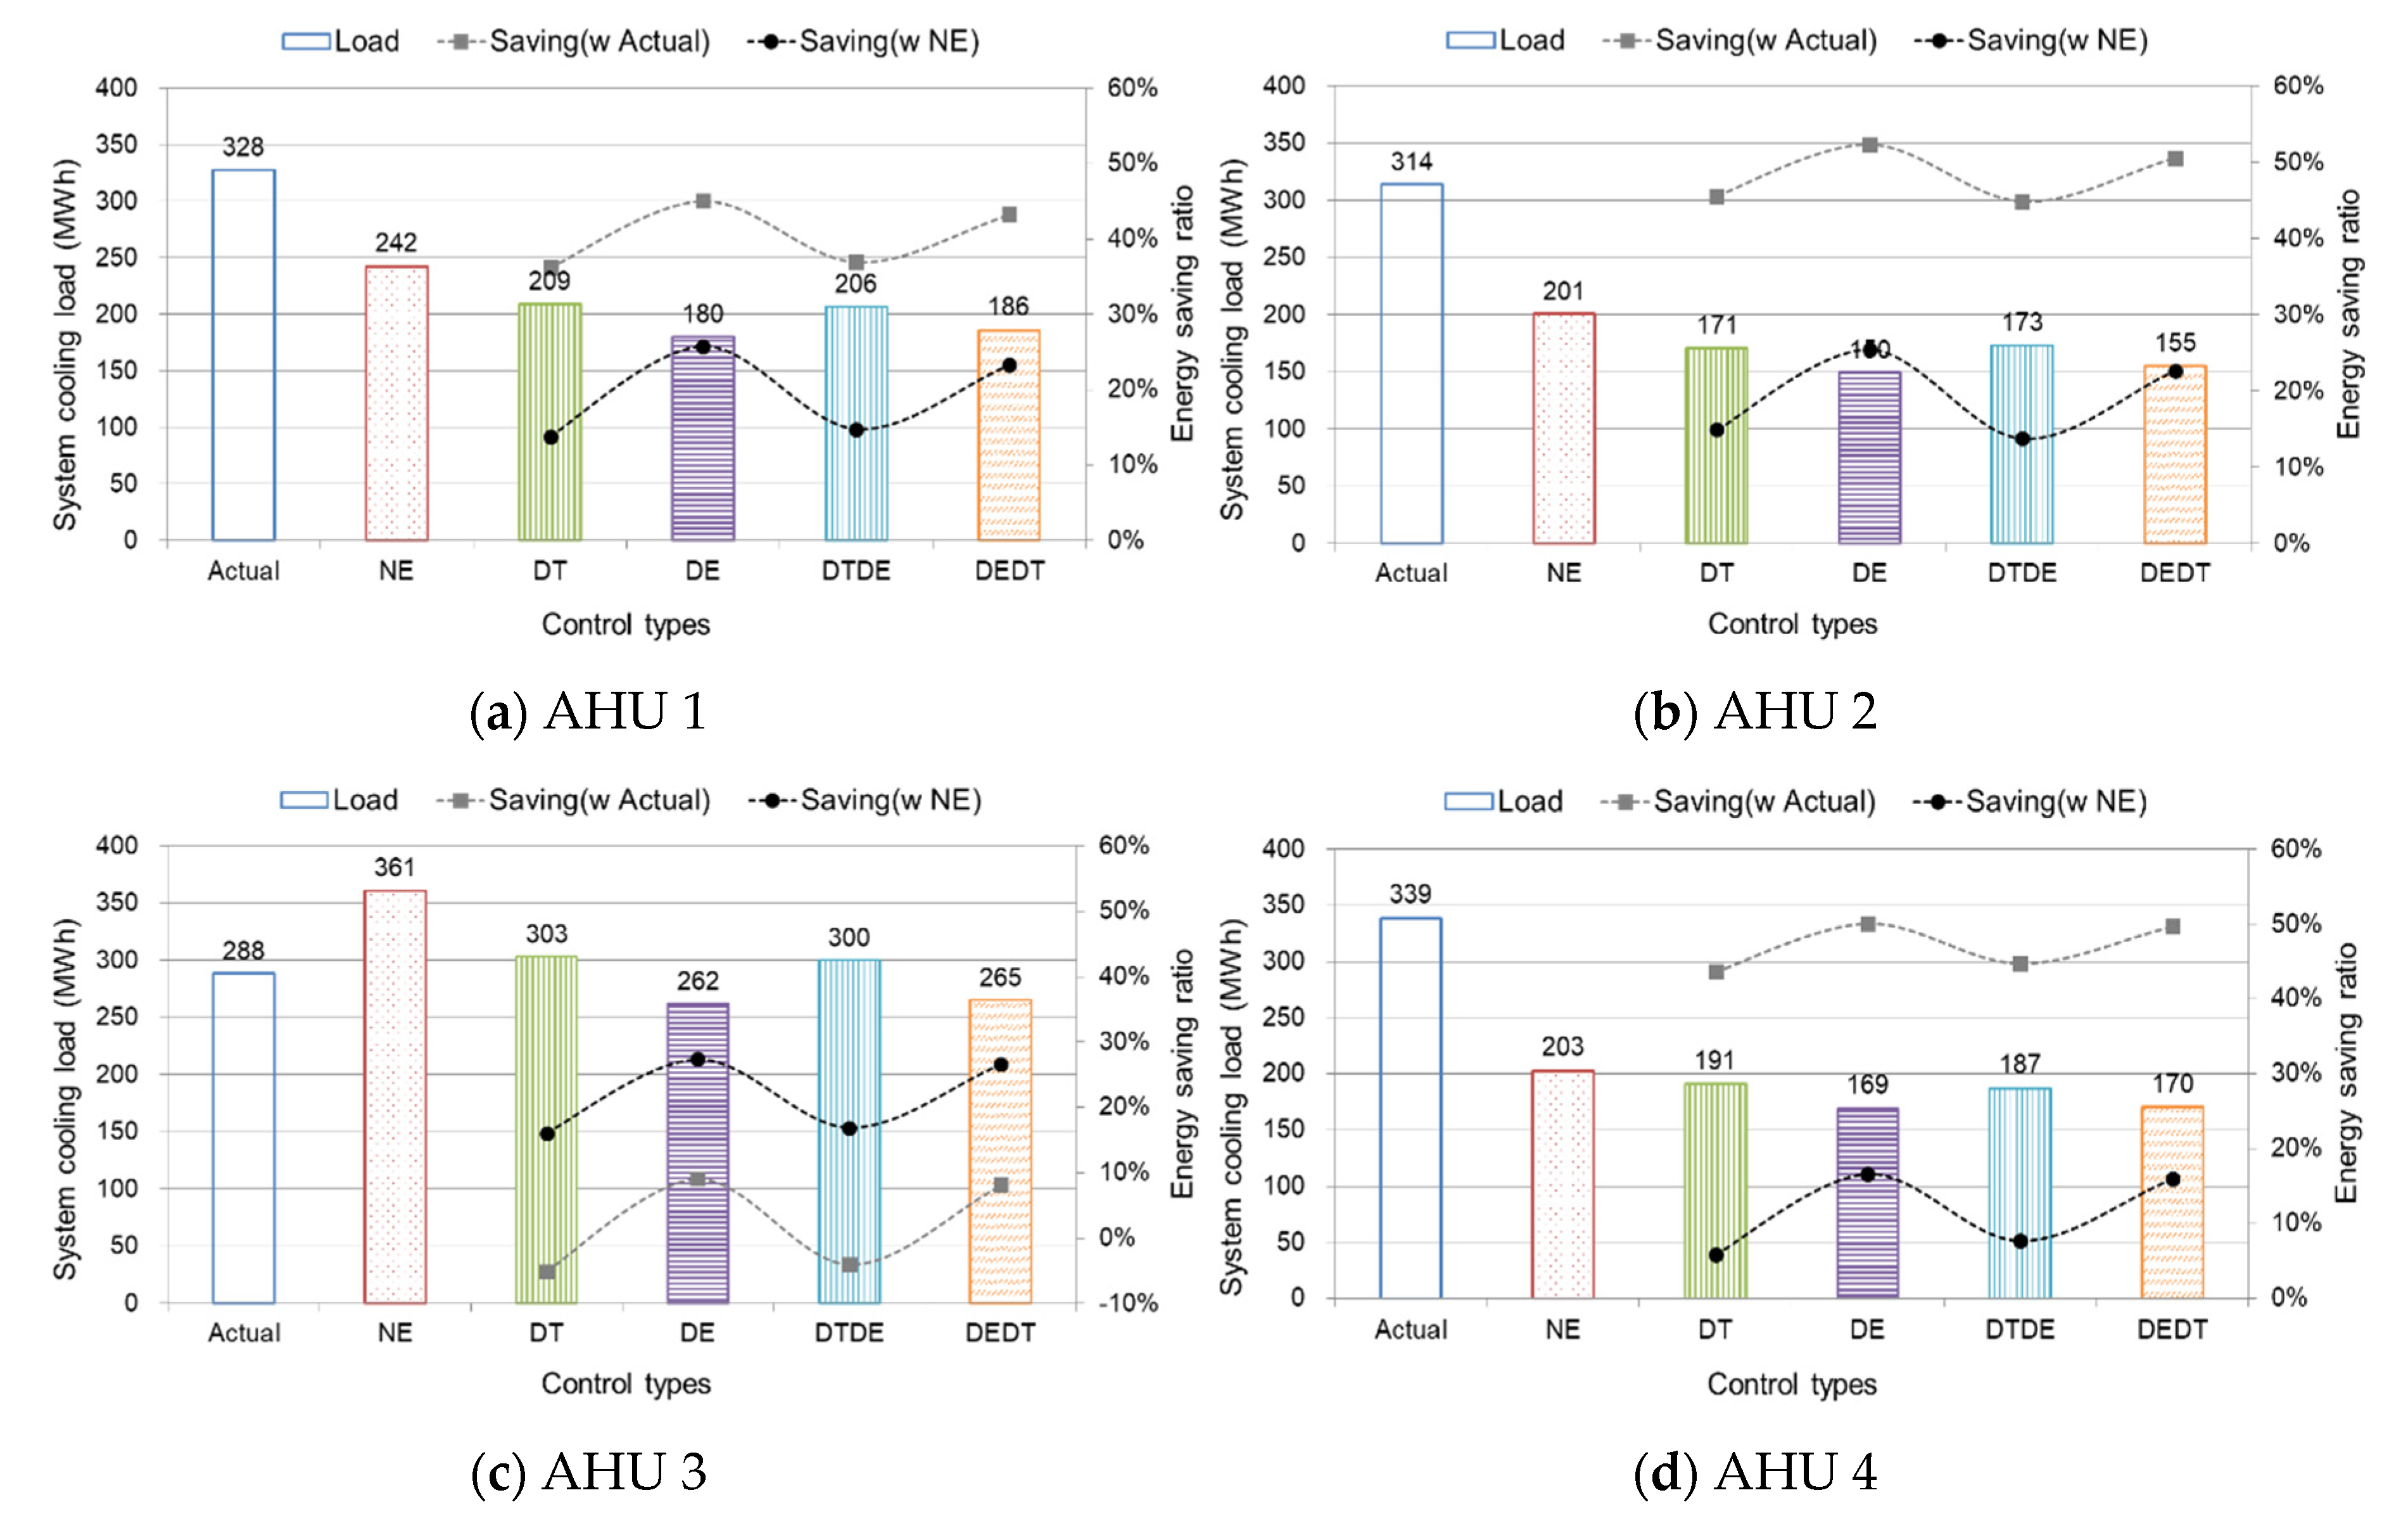
Figure 11 shows the system cooling loads and energy-saving ratios under optimal OAF operations in each AHU. The energy savings of AHUs were calculated based on the comparison between the actual operation and economizer control types. The result of AHU 1 was already represented in
Section 4.2 and
Section 4.3. In terms of the details of AHU 2, the actual system cooling load from the case building was 314 MWh, and the NE control used 201 MWh. In the result of control types, the system load in the DT driving was 171 MWh, and the DE control was 150 MWh. The DTDE control and the DEDT control showed 173 MWh and 155 MWh, respectively. The cooling energy use of AHU 2 demonstrated that the actual building wasted a great deal due to excessive external air introduction in AHU system driving. Therefore, if the building reduces immoderate OAF and operates the HVAC systems based on control types, a huge amount of cooling energy will be saved in AHU 2. In cases of driving with the DT, DE, DTDE and DEDT controls, the potential energy savings were expected up to 46%, 52%, 45%, and 51%, respectively, compared to actual building’s operation. When compared to the NE control in AHU 2, the expectations of energy savings were 15% for the DT, 25% for the DE, 14% for the DTDE, and 23% for the DEDT control, separately. As for AHU 3, the system cooling loads were 288 MWh for the actual building, 361 MWh for the NE control, and 303 MWh for the DT control, 262 MWh for the DE control, 300 MWh for the DTDE control and 265 MWh for the DEDT control. Compared to the DE control that consumed the lowest cooling energy, the NE control and actual building consumed 38% and 10% more energies, respectively. The AHU 3 in actual operation had the most similar results with the four economizer controls. This indicates that AHU 3 operated the OAF most efficiently compared to AHU 1, AHU 2, and AHU 4. The AHU 4 in the actual building used 148–170 MWh more cooling energy than all control types, which was also 136 MWh more than the NE control. The result of AHU 4 showed the largest potential for cooling energy conservation when applying the economizer control methods with optimal OAFs.
Table 6 represent normalized system cooling loads and savings of economizer control types using optimal OAFs in the hospital. The normalized energy use can allow us to accurately compare energy usage per unit area, because four AHUs have different thermal zone areas. The energy-saving result represented that AHU 3 was the most efficiently operated among AHUs. AHU 3 used 5 kWh/m
2 less energy than the DT control. However, the other three AHUs showed much more cooling energy use compared to all economizer control types. This implies that AHU 1, AHU 2, and AHU 4 have substantial energy waste as well as savings potential from HVAC system operations using the control types with optimal OAFs. Above all, the results indicate that the operation of the DE control types (i.e., DE, DEDT) was the most energy-saving approach in the target building. It could reduce about 17–27% cooling loads compared to the NE operation.
The results of this field study provide significant implications that the actual operations of the hospital were very different from the initial expectations of this study. Therefore, efforts are needed to reduce the gap between the estimated energy performance and the actual operating performance of HVAC systems in the buildings. This study would offer a milestone to understand why careful operations using economizer controls are essential with optimal OAFs in the hospital to optimize system operations.
5. Discussion
Seasonally, of the control types, the differential enthalpy (DE) control showed the best fit for cooling energy conservation in spring. It can save six times more cooling energy than the no economizer (NE) control from March to May. In terms of the DE control method, it had a large effect in spring, but no significant impact during the summer and fall compared to the other control types. DT control type was about 1.7 times more efficient in cooling loads than the NE control in spring. Contrastively, the evaluations in the summer showed that the DT control represented more cooling energy than the NE control, because outdoor air was introduced without considering latent loads in the DT control [
21,
33]. The case study building was more energy-efficient than the DT control in summer, and it is desirable to determine the outdoor air fraction in consideration of the indoor CO
2 concentration. In addition, in the fall, DT driving can save about 30% of system cooling loads compared to the NE control. The DTDE and DEDT controls were carried out to confirm that these controls can additionally contribute to energy saving quantitatively as combination controls. It was found that the DTDE control saved only about 1–2% more energy than the DT control. Therefore, from the conventional DT and combination models, there is a need for developing improved DT control strategies. Moreover, recently, there have been many attempts to advance building system controls using a variety of energy management platforms, such as Model Predictive Control (MPC) [
34], Internet of Things (IoT) technologies [
35], event-triggered mechanism [
36], Supervisory Control and Data Acquisition System (SCADA) [
37]. The SCADA system can integrate various types of building information from several technologies in buildings (i.e., control of ventilation, temperature, illumination). The combination with the advanced monitoring and control approaches in HVAC systems will help improve the economizer controls in the existing buildings and provide more potential to reduce building energy by realistically interacting with building space and building environment.
6. Conclusions
This study investigated the economizer control types as an energy conservation measure for AHU operations in the hospital in Seoul, Korea. Four economizer control types (i.e., DT, DE, DTDE, DEDT) were selected for the performance estimations and were studied to provide OAF-focused observations. Based on the optimal OAF calculations of economizer control types, the system cooling loads and savings potential were estimated in cooling seasons (i.e., spring, summer, fall). In the 2016 AHU driving data, in May and September, the economizer had the highest free-cooling potential. The calculations of the optimal OAF showed that the OAF of all control types is different according to the seasonal changes from March to November.
The DE control showed the lowest cooling energy use among all control types. This indicates that the DE control was the most superior control type for cooling seasons in the hospital. The normalized energy savings potential was 6–14% for the DT control, 17–27% for the DE control, 8–17% for the DTDE control, and 16–27% for the DEDT control compared to the NE control.
In this study, by comparing the cooling coil loads of actual operation to each economizer control type, the amount of potential energy savings of the case study building was quantitatively examined through four economizer control models. In addition, the result of this study is significant in developing an energy-efficient HVAC driving plan by investigating actual driving data for spring, summer, and fall, when economizers can be applied during the year in hot-humid climate regions.
Therefore, the result of this study would provide a better understanding of economizer control types to improve building energy efficiency in HVAC systems. Moreover, to develop more effective HVAC operation methods in actual buildings, it is necessary to continuously study the operation and maintenance (O&M) of economizer controls to prevent the failure of actual operations in commercial buildings.

