Article

Annealing-Temperature Dependent Carrier-Transportation in ZnO/PbS Quantum Dot Solar Cells Fabricated Using Liquid-Phase Ligand Exchange Methods

1
Department of Functional Materials Science, Saitama University, 255 Shimo-Okubo, Sakura-ku, Saitama 338-8570, Japan
2
Research Center for Advanced Science and Technology, The University of Tokyo, 4-6-1 Komaba, Meguro-ku, Tokyo 153-8904, Japan
3
Department of General Systems Studies, Graduate School of Arts and Sciences, The University of Tokyo, 3-8-1 Komaba, Meguro-ku, Tokyo 153-8902, Japan
*
Authors to whom correspondence should be addressed.
Energies 2020, 13(19), 5037; https://doi.org/10.3390/en13195037
Submission received: 18 August 2020 / Revised: 18 September 2020 / Accepted: 21 September 2020 / Published: 24 September 2020
(This article belongs to the Special Issue Advanced Dye-Sensitized Solar Cells)

Abstract

:
We constructed ZnO/PbS quantum dot (QD) heterojunction solar cells using liquid-phase ligand exchange methods. Colloidal QD solutions deposited on ZnO-dense layers were treated at different temperatures to systematically study how thermal annealing temperature affected carrier transport properties. The surface of the layers became dense and smooth as the temperature approached approximately 80 °C. The morphology of layers became rough for higher temperatures, causing large grain-forming PbS QD aggregation. The number of defect states in the layers indicated a valley-shaped profile with a minimum of 80 °C. This temperature dependence was closely related to the amount of residual n-butylamine complexes in the PbS QD layers and the active layer morphology. The resulting carrier diffusion length obtained on the active layers treated at 80 °C reached approximately 430 nm. The solar cells with a 430-nm-thick active layer produced a power conversion efficiency (PCE) of 11.3%. An even higher PCE is expected in solar cells fabricated under optimal annealing conditions.

Graphical Abstract

1. Introduction

Colloidal quantum dots (CQDs) indicate a size-dependent bandgap, and a low-cost solution process compatibility, while CQD assemblies display semiconducting properties and are stable in the air [1,2,3]. These features provide significant potential for a wide range of applications, ranging from solar cells [4,5,6,7,8,9,10], lasers [11,12], light-emitting diodes [13,14], and applications in medical fields—e.g., their use in biosensors [15,16]. For solar cell applications, lead sulfide (PbS) CQDs are promising candidate materials;, their bulk absorption edge is located in the infrared region exceeding 3 μm [17], and the size-dependent bandgap enables them to tune their absorption gap position to almost any desired wavelength in the solar spectrum [18]. The performance of PbS QD heterojunction solar cells has been steadily improving. High-performing PbS QD-based solar cells have reached power conversion efficiency (PCE) exceeding 13.3% [19], and their long-term stability has also been confirmed [20,21,22].
CQDs are generally capped with long insulating ligands, such as oleic acid, to maintain stable dispersion in a solution. However, when constructing solar cells with CQDs, these long ligands must be exchanged for short ligands to ensure good QD coupling [23]. Therefore, ligand exchange methods are one of the keys to creating high-performance solar cells. QD-solid films are typically formed through a layer-by-layer deposition accompanied by a solid-phase ligand exchange method. By modifying solid-phase ligand exchange methods, the performance of CQD-based solar cells has been improved. Tang et al. proposed a ligand exchange method using halide ions [24] (unlike conventional short organic molecules, such as 3-Mercaptopropionic acid) [25], which they termed atomic ligands, to decrease the distance between the QDs and to achieve efficient passivation. With iodide ions to passivate the surface of the QDs, the resulting PCE of the solar cells reached approximately 10.6% [26]. The energy level alignment of the QD layers using different ligand treatments was demonstrated as being useful for elongating carrier diffusion lengths, thereby increasing short circuit current density [27]. In addition, post-annealing CQD layers have been reported to help enhance PCE [28,29,30].
Sargent and his colleague proposed a novel ligand exchange method, wherein ligand exchange is performed in a solution phase before QD film formation (referred to as liquid-phase ligand exchange). Liquid-phase ligand exchange made it possible to achieve more efficient and uniform passivation on the surface of CQDs compared with solid-phase ligand exchange. As a result, the liquid-phase ligand exchange method has gained popularity for achieving high-efficiency CQD-based solar cell performance [31,32,33,34,35,36,37,38]. In addition to CQD solution deposition methods and conditions, the post-treatment of the deposited CQD films is equally important for the construction of QD solid films with better QD coupling and fewer defect states [33,38]. However, there are few detailed reports on how post-annealing impacts solar cell performance. Herein, we construct ZnO/PbS QD solar cells with PbS active layers using a liquid-phase ligand exchange method. Additionally, we present a systematic study of how thermal annealing of the active layers influenced carrier transport properties and a solar cell performance.

2. Materials and Methods

2.1. Materials

Lead iodide and lead bromide (as a perovskite precursor), 1,2-ethanedithiol (EDT, >99.0%), and 2-aminoethanol (>99.0%) were obtained from Tokyo Chemical Industry, Japan. Ammonium acetate (97.0%), zinc acetate dehydrate (99%), butylamine (reagent grade), octane (Wako special grade), and super dehydrated solvent N,N-dimethylformamide (DMF), toluene, acetonitrile, and methanol were purchased from Fujifilm Wako Pure Chemical Corporation, Japan. All the chemicals were used without further purification.

2.2. Liquid-Phase Ligand Exchange PbS CQD Ink

Oleic acid-capped CQDs were synthesized by a previously published method [22]. The liquid-phase ligand exchange was performed in a vail in air. Lead halides (lead iodide 0.10 mol L−1 and lead bromide 0.02 mol L−1) and ammonium acetate (0.04 mol L−1) were first dissolved in 5.0 mL N,N-dimethylformamide(DFM). A 5.0-mL CQD octane solution (10 mg mL−1) was added to this solution. This mixture was vigorously stirred for 5–10 min, until the CQDs had transferred to the DMF phase. The DMF solution was washed three times with octane. After the ligand exchange, the CQDs that had precipitated by adding a 5.0-mL toluene solution were separated by a centrifugation. After drying the CQDs for 20 min under an argon gas flow, the resulting PbI2-capped PbS CQDs ink was re-dispersed in butylamine (200 mg mL−1) to deposit PbS active layers.

2.3. Solar Cell Fabrication

The 100-nm-thick ZnO layers were formed on fluorine-doped tin oxide (FTO) substrates using a sol-gel method. To prepare the sol-gel precursors, a solution of zine acetate dihydrate (0.25 mol L−1) and ethanolamine (0.164 mol L−1) were mixed in methanol with a stirrer in a screw tube. This mixture solution was then spin-coated at 3500 rpm on the FTO substrates, which were subsequently annealed at 350 °C for 30 min in the air [20]. The PbS active layers (approximately 400 nm) were deposited on the ZnO layer by spin-coating the PbS ink at 1500 rpm for 30 s. The PbS active layers were annealed at five different temperatures (60 °C, 80 °C, 100 °C, 120 °C, and 140 °C) for 10 min on a hotplate in the air. Then, EDT-capped PbS QD layers (approximately 70 nm) were fabricated twice via a layer-by-layer method [27]. Finally, an Au back-contact electrode (100 nm), 2.7 mm in diameter, was deposited on top of the EDT-capped PbS QD layer by thermal evaporation. No device encapsulation was performed. A schematic illustration of the solar cells is shown in Figure 1a.

2.4. Device Characterization

Photovoltaic performance of the solar cells was evaluated by measuring current density–voltage (J-V) curves from which open-circuit voltage (Voc), short-circuit current density (Jsc), fill factor (FF), and PCE were obtained. The J-V curves were measured using a Keithley 2401 source unit under one-sun illumination (AM 1.5G, 100 mW/cm2), using a class A solar simulator (Bunko-keiki, Otento-Sun-VI AS). All measurements were carried out on the solar cells using a 2.5-mm-diameter optical mask placed on the top surface of the solar cells to define the exact active area size (0.049 cm2). The external quantum efficiency (EQE) spectra were measured from 300 to 1500 nm using a constant photon flux density of 1015 photon cm−2 (Bunko-keiki, CEP-2000). Complex impedance spectra of the solar cells were measured in the frequency range from 1 Hz to 8 MHz, and the amplitude of the alternating current voltage was fixed at 10 mV using a potentiostat and a frequency analyzer (Solartron, SI1260) [39]. The energy of the highest occupied quantum level of PbS (EHOQL) was determined by the onset-photon energy observed in the air using photoelectron spectroscopy (Riken Keiki, AC-3). Surface profiles of the PbS QD layers were recorded using atomic force microscopy (AFM) (Hitachi AFM5100N). In situ absorption measurements at different temperatures were carried out on PS QD films placed in an annealing chamber, set within a spectrophotometer (Hitachi UH4150). The PbS ink active layers deposited on a CaF2 substrate were annealed at different temperatures on a hotplate; Fourier transform infrared (FTIR) spectra of the active layers were obtained using a Shimadzu FTIR-8400S infrared spectrometer. Photoluminescence spectra of PbS QD films annealed under different thermal conditions were obtained using a JUSCO FR-8700 spectrofluoro-photometer.

3. Results and Discussion

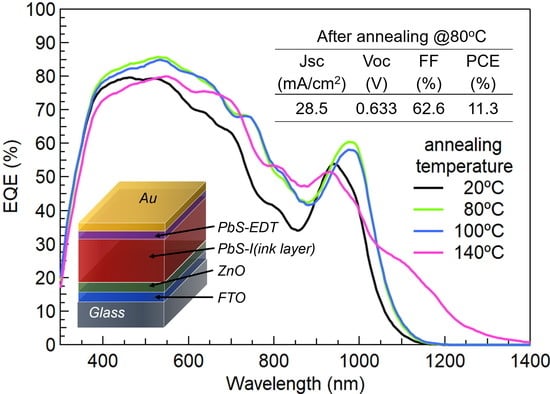
3.1. Solar Cell Performance

The photocurrent density vs. voltage curves for the solar cells showed a strong annealing temperature dependence (Figure 1b). The Voc, Jsc, and FF values that were obtained from the J-V curves increased with increasing annealing temperature, reaching a maximum value at approximately 80–100 °C, and then decreased for higher annealing temperatures (Figure 1c, See Supplementary Materials, Table S1). Defining the enhancement factors by (FT-F20 °C)/F20 °C (FT: Voc, Jsc, FF, and PCE), the maximum values of Voc and Jsc were approximately 10%. Contrastingly, the maximum value of FF, which occurred at 80 °C, reached higher than 30%, and was a leading factor contributing to PCE enhancement. The resulting maximum PCE of 10.8% (under one-sun illumination) was obtained on the solar cell treated at 80 °C, showing an increase of approximately 52%, compared with that of the as-made solar cells (fabricated at 20 °C and lacking any annealing process).
Figure 1d shows the EQE spectra of the solar cells treated at different annealing temperatures. The EQE spectral profiles changed with annealing temperatures, similar to the absorption spectra (Figure 2a). In addition, the bandwidth of the EQE, originating from the first exciton absorption, became broader as annealing temperature rose. With the PbS QD layer treated at 140 °C, the EQE spectrum became relatively featureless, tailing toward long wavelengths, and without a clear EQE signal originating from the exciton absorption. The EQE signal intensity (e.g., at 500 nm) also changed in accordance with the Jsc values. The integrated photocurrent density values from the EQE spectra showed good agreement with Jsc values (See Supplementary Materials, Table S1).

3.2. Optical Properties of the PbS Ink Films

When the films were annealed from 100 °C and 140 °C, their absorption was broad in the region from 900 nm to 1200 nm. This was chiefly due to increasing QD coupling, caused by a necking phenomenon, as confirmed by the broadening of the exciton band (Figure 2a). Similar annealing temperature dependency has been reported for PbS QD films prepared using a solid-phase ligand exchange method [29,30]. However, the temperature at which the absorption band began widening was lower in the liquid-phase ligand exchange films. These results indicated the QD films formed by the liquid-phase method aggregated at lower temperatures than QD films by the solid-phase ligand exchange, because original oleic acid ligands were more efficiently exchanged for iodine anion ligands using the liquid-phase ligand exchange method. The FTIR spectra of the active layers showed a distinct broad absorption band, peaking at 3175 cm−1, which was attributed to the N-H stretch mode (3175 cm1) of PbS-I-n-butylamine complexes (QD–amine complex) (Figure 2b) [33,37,40]. The amount of QD–amine complexes that were estimated from the absorption band area decreased with increasing annealing temperature and reached one-tenth of the original amount in the 140 °C annealed layers (an inserted figure in Figure 2b). Moreover, thermogravimetric (TGA) measurements clearly showed that the weight of the PbS QD film significantly decreased in the temperature range in which the film was annealed. As the temperature increased from 20 °C, the weight of the PbS QD film began to decrease, and a weak broad shoulder was observed between 90 °C and 150 °C. Thereafter, the weight gradually decreased with increasing annealing temperature (Figure S1). The removal of bulky n-butylamine molecules from the PbS QD active layers caused the interdot distance to decrease, making the active layer denser. However, the solar cell’s performance continuously decreased with annealing temperature, after reaching its maximum at approximately 80 °C (Figure 1c). This was mainly because of the grain-boundary-forming QD aggregation. The QD film thickness of the pristine PbS QD and annealed layers were measured to be 450–480 nm via SEM observation.
Steady-state photoluminescence spectra, ranging from 850 to 1650 nm, were measured on the as-deposited PbS QD films and films annealed at five different temperatures (Figure 2c)—the excitation wavelength was 450 nm and the optical density values of all films at 450 nm were approximately 2.5. Compared with the pristine films, only PL intensity increased till the annealing temperature reached 80 °C, indicating that the nonradiative recombination is reduced. This finding also suggests that the lifetime of the photoexcited states of the annealed films was prolonged. Moreover, when the annealing temperature reached 100 °C and higher, the PL spectra significantly red-shifted. This large red-shift is attributed to the increase in the QD size and/or QD aggregation, indicating the formation of narrow bandgap PbS QD regions working as carrier trap regions.

3.3. Atomic Force Microscopy Image of the PbS Ink Films After Annealing

We observed the surface profiles and the morphology of the PbS ink films using AFM measurement. When the annealing temperature was below 100 °C, the film surface morphology did not change significantly. Contrastingly, the root-mean-square (RMS) surface roughness of the PbS ink film became observably larger from 0.11 nm to 2.3 nm when the films were treated at 140 °C. AFM surface profiles showed even larger surface roughness in the films annealed at 120 and 140 °C (Figure 3). Annealing at such temperatures caused inhomogeneous volume contraction to occur, resulting in isolated QD aggregates with grain-like boundaries, thereby impeding carrier transportation. The QD size growth also caused the bandgap to narrow, resulting in the formation of carrier trap regions.

3.4. Carrier Transport Characteristics

Next, we focused on the PbS QD film properties, such as the amount of organic residue and defect density, and investigated the influence of these factors on carrier transport characteristics. We first estimated the defect density of the QD films using the following equations [36]:
W =   2 ε ε 0 ( V b i V ) q N a ;   N t =   V b i q W d C d ω ω k T ,
where Vbi (V) is the built-in potential obtained from the Mott–Schottky plot (Figure 4a), V is the applied voltage, A is the device active area 0.049 cm2, Na is the doping concentration (1015 cm−3), ε is the relative permittivity of the PbS QD films (19), ε0 is the permittivity of a vacuum, W is the depletion region width, and q is the element charge. The −ωdC/ versus ω plots of the pristine solar cell and annealed cells (Figure 4b) exhibit a peak value at a characteristic angular frequency, and the trap density is calculated using Equation (1). The dependence of the −ωdC/dω versus ω plots of the pristine solar cell and annealed cells on annealing temperature showed a valley-shaped profile. Here, a minimum value of 2.6 × 10¹⁷ (cm−3eV−1) was obtained in the device treated at 80 °C, which was one half of that observed for the as-made device (5.2 × 10¹⁷ (cm−3eV−1)) (Figure 4c). The 80 °C annealing treatment results had the highest Voc, as confirmed by the good correlation between the defect density number and the Voc values of the devices (Figure 4c). A decreasing Voc for higher temperatures was attributed to the QD size growth or aggregation, which was consistent with the above-mentioned annealing temperature-dependent broadening of absorption and EQE spectra (Figure 1d and Figure 2a, respectively) [41]. Notably, these values are higher than those obtained from PbS QD-based FETs [33,42,43], likely because, in our case, the complex impedance spectra were measured on the PbS QD solar cells. Thus, the −ωdC/ versus ω plots do not originate only from the signals of the PbS QD active layers, and should be considered to comprise a combination of three components: the active layer, ZnO layer, and EDT electron-blocking layer. Despite these additional factors, the annealing temperature dependence can be considered to originate mainly from the PbS QD layers. Furthermore, the overall trend of annealing temperature dependence is consistent with annealing temperature dependence of PL intensity of PbS QD films (Figure 2c).
Figure 4d,e show the annealing temperature dependence of carrier lifetime and mobility (See Supplementary Materials for detailed information for the calculation method), respectively. We evaluated the relaxation process in the solar cells using electrochemical impedance spectroscopy. The carrier lifetime (τt) of the solar cells is estimated using Equation (2),
τt = Rrec × Cn
where Rrec is the recombination resistance, and Cn is the chemical capacitance. These values were estimated from the Cole-Cole plot semicircles [44,45,46,47]. The carrier mobility values remained nearly constant for the solar cells treated below 80 °C, showing a maximum value in the device treated at 100 °C, and then decreased with increasing annealing temperature. In accordance with these results, the annealing temperature dependence of the carrier lifetime showed a bell-shaped profile with a maximum at 80 °C, where the defect density yielded its minimum value. The annealing treatment removed some of the residual ammines in the QD layers, which improved QD coupling strength, thereby increasing carrier mobility and lifetime. Contrastingly, over-annealing at the higher temperatures caused the formation of QD aggregates or QD grains, which hindered carrier transportation at the grain boundary. With the carrier lifetime and the carrier diffusion coefficient values defined as D = (kbT/q)μe, the carrier diffusion length L (~(Dτ)1/2) was estimated (Figure 4f). The diffusion length of the PbS QD active layers annealed at 80 °C was found to reach a maximum value of 425 nm, which was close to the carrier diffusion lengths reported by PbS QD solar cells formed with PbS QD inks [33,43,48,49], and was by approximately 100 nm longer than that of the as-made device. Finally, we then fabricated devices with iodine-capped PbS QD layers with a thickness close to the diffusion length (430 ± 20 nm). The resulting power conversion efficiency reached 11.3% under one-sun illumination (Figure 5a). In addition, for the air storage stability tests, the unencapsulated 80 °C annealed solar cells were stored under ambient conditions for 100 days. The devices maintained a high level performance and no noticeable degradation was observed (Figure 5b).

4. Conclusions

In summary, a range of appropriate thermal annealing temperatures can be applied to the liquid-phase ligand exchange of PbS QD active layers, wherein the annealing treatment densifies the active layers and the surface roughness becomes smaller. In such high-quality PbS QD active layers, the density of defects was confirmed to be lower. However, over-annealing temperatures caused grain-boundary-forming QD aggregation and trap-like narrow-bandgap PbS QD regions, resulting in a decrease in carrier transportation in the QD layers. A series of the experimental results show the importance of post-thermal treatment, so as to achieve good QD coupling over the entire PbS QD region. A PCE of 11.3% was obtained in the solar cells fabricated under an optimal condition. Moreover, the PCE could be further increased by annealing the PbS active layers under optimal conditions.

Supplementary Materials

The following are available online at https://www.mdpi.com/1996-1073/13/19/5037/s1, Table S1: Summary of the solar cell performance from the PbS QD solar cells treated with different annealing temperature. Figure S1: TGA curve obtained on PbS QD powder. Figure S2: J-V characteristics in the dark condition of those devices. Figure S3: Typical Nyquist plots on those ZnO/PbS QD solar cells.

Author Contributions

A.T. and H.W. contributed equally to this work. Conceptualization, A.T., H.W. and T.K.; Experiments and data analysis, A.T. and H.W.; Complex impedances measurement, N.K. and T.F.; Writing—original draft preparation, A.T.; Writing—review and editing, H.W., A.T., T.F. and T.K.; Project administration, T.K. and H.S.; All authors have read and agreed to the published version of the manuscript.

Funding

This research was funded by Japan Society for the Promotion of Science (JSPS) for a Grant-in-Aid for Scientific Research (No. 16H03824 and No. 19H02534).

Conflicts of Interest

The authors declare no conflict of interest.

References

  1. Alivisatos, A.P. Semiconductor Clusters, Nanocrystals, and Quantum Dots. Science 1996, 271, 933–937. [Google Scholar] [CrossRef] [Green Version]
  2. Murray, C.B.; Kagan, C.R.; Bawendi, M.G. Synthesis and Characterization of Monodisperse Nanocrystals and Close-packed Nanocrystal Assemblies. Annu. Rev. Mater. Sci. 2000, 30, 545–610. [Google Scholar] [CrossRef] [Green Version]
  3. Carey, G.H.; Abdelhady, A.L.; Ning, Z.; Thon, S.M.; Bakr, O.M.; Sargent, E.H. Colloidal Quantum Dot Solar Cells. Chem. Rev. 2015, 115, 12732–12763. [Google Scholar] [CrossRef] [PubMed]
  4. Gur, I.; Fromer, N.A.; Geier, M.L.; Alivisatos, A.P. Air-Stable All-Inorganic Nanocrystal Solar Cells Processed from Solution. Science 2005, 310, 462–465. [Google Scholar] [CrossRef] [PubMed] [Green Version]
  5. McDonald, S.A.; Konstantatos, G.; Zhang, S.; Cyr, P.W.; Klem, E.J.; Levina, L.; Sargent, E.H. Solution-processed PbS Quantum Dot Infrared Photodetectors and Photovoltaics. Nat. Mater. 2005, 4, 138–142. [Google Scholar] [CrossRef]
  6. Kamat, P.V.; Tvrdy, K.; Baker, D.R.; Radich, J.G. Beyond Photovoltaics: Semiconductor Nanoarchitectures for Liquid-Junction Solar Cells. Chem. Rev. 2010, 110, 6664–6688. [Google Scholar] [CrossRef]
  7. Nozik, A.J.; Beard, M.C.; Luther, J.E.; Law, M.; Ellingson, R.J.; Johnson, J.C. Semiconductor Quantum Dots and Quantum Dot Arrays and Application of Multiple Exciton Generation to Third-Generation Photovoltaic Solar Cells. Chem. Rev. 2010, 110, 6873–6890. [Google Scholar] [CrossRef]
  8. Kamat, P.V. Quantum Dot Solar Cells. The Next Big Thing in Photovoltaics. J. Phys. Chem. Lett. 2013, 4, 908–918. [Google Scholar] [CrossRef]
  9. Shrestha, A.; Batmunkh, M.; Tricoli, A.; Qiao, S.Z.; Dai, S. Near-Infrared Active Lead Chalcogenide Quantum Dots: Preparation, Post-Synthesis Ligand Exchange, and Applications in Solar Cells. Angew. Chem. Int. Ed. 2019, 58, 5202–5224. [Google Scholar] [CrossRef]
  10. Lu, K.; Wang, Y.; Liu, Z.; Han, L.; Shi, G.; Fang, H.; Chen, J.; Ye, X.; Chen, S.; Yang, F.; et al. High-Efficiency PbS Quantum-Dot Solar Cells with Greatly Simplified Fabrication Processing via “Solvent-Curing”. Adv. Mater. 2018, 30, 1707572. [Google Scholar] [CrossRef] [Green Version]
  11. Hoogland, S.; Sukhovatkin, V.; Howard, I.; Cauchi, S.; Levina, L.; Sargent, E.H. A Solution-processed 1.53 μm Quantum Dot Laser with Temperature-invariant Emission Wavelength. Opt. Express 2006, 14, 3273–3281. [Google Scholar] [CrossRef]
  12. le Feber, B.; Prins, F.; De Leo, E.; Rabouw, F.T.; Norris, D.J. Colloidal-Quantum-Dot Ring Lasers with Active Color Control. Nano Lett. 2018, 18, 1028–1034. [Google Scholar] [CrossRef]
  13. Sun, Q.; Wang, Y.A.; Li, L.S.; Wang, D.; Zhu, T.; Xu, J.; Yang, C.; Li, Y. Bright, Multicoloured Light-emitting Diodes Based on Quantum Dots. Nat. Photonics 2007, 1, 717–722. [Google Scholar] [CrossRef]
  14. Qian, L.; Zheng, Y.; Xue, J.; Holloway, P.H. Stable and Efficient Quantum-dot Light-emitting Diodes Based on Solution-processed Multilayer Structures. Nat. Photonics 2011, 5, 543–548. [Google Scholar] [CrossRef]
  15. Wegner, K.D.; Hildebrandt, N. Quantum Dots: Bright and Versatile in Vitro and in Vivo Fluorescence Imaging Biosensors. Chem. Soc. Rev. 2015, 44, 4792–4834. [Google Scholar] [CrossRef] [Green Version]
  16. Umakoshi, T.; Udaka, H.; Uchihashi, T.; Ando, T.; Suzuki, M.; Fukuda, T. Quantum-dot Antibody Conjugation Visualized at the Single-Molecule Scale with High-Speed Atomic Force Microscopy. Colloids Surf. B 2018, 167, 267–274. [Google Scholar] [CrossRef]
  17. Moreels, I.; Lambert, K.; Smeets, D.; De Muynck, D.; Nollet, T.; Martins, J.C.; Vanhaecke, F.; Vantomme, A.; Delerue, C.; Allan, G.; et al. Size-dependent Optical Properties of Colloidal PbS Quantum Dots. ACS Nano 2009, 3, 3023–3030. [Google Scholar] [CrossRef] [Green Version]
  18. Wang, H.; Kubo, T.; Nakazaki, J.; Segawa, H. Solution-Processed Short-Wave Infrared PbS Colloidal Quantum Dot/ZnO Nanowire Solar Cells Giving High Open-Circuit Voltage. ACS Energy Lett. 2017, 2, 2110–2117. [Google Scholar] [CrossRef]
  19. Choi, M.J.; Garcia de Arquer, F.P.; Proppe, A.H.; Seifitokaldani, A.; Choi, J.; Kim, J.; Baek, S.W.; Liu, M.; Sun, B.; Biondi, M.; et al. Cascade Surface Modification of Colloidal Quantum Dot Inks Enables Efficient Bulk Homojunction Photovoltaics. Nat. Commun. 2020, 11, 103. [Google Scholar] [CrossRef]
  20. Wang, H.; Kubo, T.; Nakazaki, J.; Segawa, H. PbS Colloidal Quantum Dot/ZnO-based Bulk-Heterojunction Solar Cells with High Stability under Continuous Light Soaking. Phys. Status Solidi RRL 2014, 8, 961–965. [Google Scholar] [CrossRef]
  21. Tan, L.; Li, P.; Sun, B.; Chaker, M.; Ma, D. Stabilities Related to Near-Infrared Quantum Dot-Based Solar Cells: The Role of Surface Engineering. ACS Energy Lett. 2017, 2, 1573–1585. [Google Scholar] [CrossRef]
  22. Choi, J.; Choi, M.J.; Kim, J.; Dinic, F.; Todorovic, P.; Sun, B.; Wei, M.; Baek, S.W.; Hoogland, S.; Garcia de Arquer, F.P.; et al. Stabilizing Surface Passivation Enables Stable Operation of Colloidal Quantum Dot Photovoltaic Devices at Maximum Power Point in an Air Ambient. Adv. Mater. 2020, 32, e1906497. [Google Scholar] [CrossRef]
  23. Klem, E.J.D.; MacNeil, D.D.; Cyr, P.W.; Levina, L.; Sargent, E.H. Efficient Solution-processed Infrared Photovoltaic Cells: Planarized All-inorganic Bulk Heterojunction Devices via Inter-quantum-dot Bridging during Growth from Solution. Appl. Phys. Lett. 2007, 90, 183113. [Google Scholar] [CrossRef] [Green Version]
  24. Tang, J.; Kemp, K.W.; Hoogland, S.; Jeong, K.S.; Liu, H.; Levina, L.; Furukawa, M.; Wang, X.H.; Debnath, R.; Cha, D.K.; et al. Colloidal-Quantum-Dot Photovoltaics using Atomic-Ligand Passivation. Nat. Mater. 2011, 10, 765–771. [Google Scholar] [CrossRef]
  25. Pattantyus-Abraham, A.G.; Kramer, I.J.; Barkhouse, A.R.; Wang, X.H.; Konstantatos, G.; Debnath, R.; Levina, L.; Raabe, I.; Nazeeruddin, M.K.; Gratzel, M.; et al. Depleted-Heterojunction Colloidal Quantum Dot Solar Cells. ACS Nano 2010, 4, 3374–3380. [Google Scholar] [CrossRef] [PubMed]
  26. Wang, Y.; Lu, K.; Han, L.; Liu, Z.; Shi, G.; Fang, H.; Chen, S.; Wu, T.; Yang, F.; Gu, M.; et al. In Situ Passivation for Efficient PbS Quantum Dot Solar Cells by Precursor Engineering. Adv. Mater. 2018, 30, e1704871. [Google Scholar] [CrossRef]
  27. Chuang, C.H.; Brown, P.R.; Bulovic, V.; Bawendi, M.G. Improved Performance and Stability in Quantum Dot Solar Cells through Band Alignment Engineering. Nat. Mater. 2014, 13, 796–801. [Google Scholar] [CrossRef] [Green Version]
  28. Cao, Y.; Stavrinadis, A.; Lasanta, T.; So, D.; Konstantatos, G. The Role of Surface Passivation for Efficient and Photostable PbS Quantum Dot Solar Cells. Nat. Energy 2016, 1, 16035. [Google Scholar] [CrossRef]
  29. Wang, H.; Yang, S.; Wang, Y.; Xu, J.; Huang, Y.; Li, W.; He, B.; Muhammad, S.; Jiang, Y.; Tang, Y.; et al. Influence of Post-Synthesis Annealing on PbS Quantum Dot Solar Cells. Org. Electron. 2017, 42, 309–315. [Google Scholar] [CrossRef]
  30. Shi, Y.; Hu, J.; Jiang, Y.; Sulaman, M.; Yang, S.; Tang, Y.; Zou, B. Influence of the Post-Synthesis Annealing on Device Performance of PbS Quantum Dot Photoconductive Detectors. Phys. Status Solidi (a) 2018, 215, 1800408. [Google Scholar] [CrossRef]
  31. Lan, X.; Voznyy, O.; Garcia de Arquer, F.P.; Liu, M.; Xu, J.; Proppe, A.H.; Walters, G.; Fan, F.; Tan, H.; Liu, M.; et al. 10.6%-Certified Colloidal Quantum Dot Solar Cells via Solvent-Polarity-Engineered Halide Passivation. Nano Lett. 2016, 16, 4630–4634. [Google Scholar] [CrossRef]
  32. Liu, M.; Voznyy, O.; Sabatini, R.; Garcia de Arquer, F.P.; Munir, R.; Balawi, A.H.; Lan, X.; Fan, F.; Walters, G.; Kirmani, A.R.; et al. Hybrid Organic-Inorganic Inks Flatten the Energy Landscape in Colloidal Quantum Dot Solids. Nat. Mater. 2017, 16, 258–263. [Google Scholar] [CrossRef] [PubMed]
  33. Xu, J.; Voznyy, O.; Liu, M.; Kirmani, A.R.; Walters, G.; Munir, R.; Abdelsamie, M.; Proppe, A.H.; Sarkar, A.; Garcia de Arquer, F.P.; et al. 2D Matrix Engineering for Homogeneous Quantum Dot Coupling in Photovoltaic Solids. Nat. Nanotechnol. 2018, 13, 456–462. [Google Scholar] [CrossRef] [PubMed]
  34. Aqoma, H.; Al Mubarok, M.; Hadmojo, W.T.; Lee, E.H.; Kim, T.W.; Ahn, T.K.; Oh, S.H.; Jang, S.Y. High-Efficiency Photovoltaic Devices using Trap-Controlled Quantum-Dot Ink prepared via Phase-Transfer Exchange. Adv. Mater. 2017, 29, 1605756. [Google Scholar] [CrossRef]
  35. Jia, D.; Chen, J.; Zheng, S.; Phuyal, D.; Yu, M.; Tian, L.; Liu, J.; Karis, O.; Rensmo, H.; Johansson, E.M.J.; et al. Highly Stabilized Quantum Dot Ink for Efficient Infrared Light Absorbing Solar Cells. Adv. Energy Mater. 2019, 9, 1902809. [Google Scholar] [CrossRef]
  36. Wang, L.; Wang, Y.; Jia, Y.; Liu, X.; Liu, T.; Fu, T.; Li, J.; Weng, B.; Zhang, X.; Liu, Y. Manipulation of Phase-Transfer Ligand-Exchange Dynamics of PbS Quantum Dots for Efficient Infrared Photovoltaics. J. Phys. Chem. C 2019, 123, 30137–30144. [Google Scholar] [CrossRef]
  37. Gu, M.; Wang, Y.; Yang, F.; Lu, K.; Xue, Y.; Wu, T.; Fang, H.; Zhou, S.; Zhang, Y.; Ling, X.; et al. Stable PbS Quantum Dot Ink for Efficient Solar Cells by Solution-phase Ligand Engineering. J. Mater. Chem. A 2019, 7, 15951–15959. [Google Scholar] [CrossRef]
  38. Sun, B.; Johnston, A.; Xu, C.; Wei, M.; Huang, Z.; Jiang, Z.; Zhou, H.; Gao, Y.; Dong, Y.; Ouellette, O.; et al. Monolayer Perovskite Bridges Enable Strong Quantum Dot Coupling for Efficient Solar Cells. Joule 2020, 4, 1542–1556. [Google Scholar] [CrossRef]
  39. Fukuda, T.; Takahashi, A.; Wang, H.; Takahira, K.; Kubo, T.; Segawa, H. Impedance Analysis of PbS Colloidal Quantum Dot Solar Cells with Different ZnO Nanowire Lengths. Jap. J. Appl. Phys. 2018, 57, 03EJ02. [Google Scholar] [CrossRef]
  40. Ramis, G.; Busca, G. FTIR Spectra of Adsorbed n-Butylamine. J. Mol. Struct. 1989, 193, 93–100. [Google Scholar] [CrossRef]
  41. Gao, J.B.; Jeong, S.; Lin, F.; Erslev, P.T.; Semonin, O.E.; Luther, J.M.; Beard, M.C. Improvement in Carrier Transport Properties by Mild Thermal Annealing of PbS Quantum Dot Solar Cells. Appl. Phys. Lett. 2013, 102, 043506. [Google Scholar] [CrossRef]
  42. Proppe, A.H.; Xu, J.; Sabatini, R.P.; Fan, J.Z.; Sun, B.; Hoogland, S.; Kelley, S.O.; Voznyy, O.; Sargent, E.H. Picosecond Charge Transfer and Long Carrier Diffusion Lengths in Colloidal Quantum Dot Solids. Nano Lett. 2018, 18, 7052–7059. [Google Scholar] [CrossRef] [PubMed]
  43. Liu, M.; Che, F.; Sun, B.; Voznyy, O.; Proppe, A.; Munir, R.; Wei, M.; Quintero-Bermudez, R.; Hu, L.; Hoogland, S.; et al. Controlled Steric Hindrance Enables Efficient Ligand Exchange for Stable, Infrared-Bandgap Quantum Dot Inks. ACS Energy Lett. 2019, 4, 1225–1230. [Google Scholar] [CrossRef]
  44. Fukuda, T.; Takahashi, A.; Takahira, K.; Wang, H.; Kubo, T.; Segawa, H. Limiting Factor of Performance for Solution-Phase Ligand-Exchanged PbS Quantum Dot Solar Cell. Sol. Energy Mater. Sol. Cells 2019, 195, 220–227. [Google Scholar] [CrossRef]
  45. Lai, L.H.; Protesescu, L.; Kovalenko, M.V.; Loi, M.A. Sensitized Solar Cells with Colloidal PbS-CdS Core-Shell Quantum Dots. Phys. Chem. Chem. Phys. 2014, 16, 736–742. [Google Scholar] [CrossRef] [Green Version]
  46. Jin, Z.; Wang, A.; Zhou, Q.; Wang, Y.; Wang, J. Detecting Trap States in Planar PbS Colloidal Quantum Dot Solar Cells. Sci. Rep. 2016, 6, 37106. [Google Scholar] [CrossRef]
  47. Bisquert, J.; Fabregat-Santiago, F.; Mora-Seró, I.; Garcia-Belmonte, G.; Giménez, S. Electron Lifetime in Dye-Sensitized Solar Cells: Theory and Interpretation of Measurements. J. Phys. Chem. C 2009, 113, 17278–17290. [Google Scholar] [CrossRef]
  48. Sun, B.; Vafaie, M.; Levina, L.; Wei, M.; Dong, Y.; Gao, Y.; Kung, H.T.; Biondi, M.; Proppe, A.H.; Chen, B.; et al. Ligand-Assisted Reconstruction of Colloidal Quantum Dots Decreases Trap State Density. Nano Lett. 2020, 20, 3694–3702. [Google Scholar] [CrossRef]
  49. Sun, B.; Voznyy, O.; Tan, H.; Stadler, P.; Liu, M.; Walters, G.; Proppe, A.H.; Liu, M.; Fan, J.; Zhuang, T.; et al. Pseudohalide-Exchanged Quantum Dot Solids Achieve Record Quantum Efficiency in Infrared Photovoltaics. Adv. Mater. 2017. [Google Scholar] [CrossRef]
Figure 1. (a) Schematic of the structure and energy diagrams of the PbS CQD solar cells (PbS QD active layer thickness: 450–480 nm (including EDT-HTL thickness of 60–80 nm); (b) the J-V characteristics of the different annealing temperature solar cells under AM 1.5 G one sun illumination; (c) the annealing temperature-dependent solar cell performances and their enhancement factors. The average (symbols) and standard deviation (error bars) were calculated from a sample of six devices; (d) the external quantum efficiency (EQE) spectra of the solar cells with different annealing temperatures.
Energies 13 05037 g001
Figure 2. (a) Absorption spectra of the liquid-phase ligand exchanged PbS ink films; (b) Transmittance FTIR spectra of the PbS ink films after annealing at different temperatures. The dotted-line represents the FTIR spectrum of liquid butylamine and FTIR absorption band area vs. annealing temperature; (c) Steady state photoluminescence spectra of the PbS ink films annealed at different temperatures.
Energies 13 05037 g002
Figure 3. The AFM images of the PbS ink films annealed at different temperatures. Root-mean-square (RMS) surface roughness values of the pristine PbS ink film and the films annealed at 60, 80, 100, 120, and, 140 °C are 0.26, 0.11, 0.27, 1.1, and 2.3 nm, respectively.
Energies 13 05037 g003
Figure 4. (a) A Mott–Schottky plot of the solar cells, (b) The −ωdC/ versus ω plots of the pristine solar cell and annealed cells. (c) Annealing temperature dependence of defect density, (d) lifetime, (e) carrier mobility and (f) carrier diffusion length.
Energies 13 05037 g004
Figure 5. (a) Device performance and the cross-section SEM image of the best performing solar cell; (b) the time course of air stability test of unencapsulated solar cells treated at 80 °C.
Energies 13 05037 g005

