1. Introduction
Thermal coal pyrolysis is the process of coking (coke production) where the organic substance of coal, influenced by temperature, is subjected to destruction (decomposition). A significant component of the coking process is the heat delivery system. In coke production, coke oven batteries are fueled with a portion of the coke oven gas burned between the walls of adjacent chambers. Coal-to-coke conversion progresses over time, but, contrary to the models currently used, the quantity of coke oven gas brought to the heating wall (burned) in industrial practice does not depend on the instant heat demands of the coking process. Instead, the pyrolysis process heat demand depends on the course of coal decomposition, and heat demand calculations must incorporate both the endothermic and exothermic effects of the process.
The quantity of heat delivered to the process using coke oven gas as a fuel should be the result of the heat demand needed to heat up the coke and volatile products (physical enthalpy), plus the quantity needed to provoke the chemical reactions (changes in chemical enthalpy) within the coke oven chamber, plus an additional quantity to compensate for all heat losses.
Until recently, the zero-total heat effect of chemical reactions in the coking chamber was adopted to meet the needs of heat demand balance in the coking process [
1]. Use of this zero-total effect was indicated by practical experience gained from operating various coke oven batteries using various coal blends at different coking times. The estimated heat demand [
2] for the coking process calculated on this zero-total effect assumption was practical because it incorporated sufficient excess to cover the heat demand in all stages of the coking process. However, detailed studies on energy transfer in the coking chamber show that, as a result of unaccounted for chemical reactions, the coal coking process in a coking chamber can produce energy excesses in the full coking cycle of up to 100–150 kJ/kg of coal charge [
3]. In addition, significant changes in the coking chamber wall temperature can be observed, particularly during the initial coking period, indicating substantial differences in heat demand over time. Variations in the wall temperature not only result from evaporating moisture during the initial coking period, but also from the heat effect of the decomposition reactions that occur within the chamber. The intensity of the variations depends on the type of coal used for the coking process; however, it has been hard to obtain reliable numerical information without a suitable balancing method that accounts for all the basic products, and progress toward a better model has been relatively slow.
Especially important to any description of the heat transfer phenomena in a coking chamber are the results of studies conducted by Merrick in 1983 [
4,
5] and Barr and Osinski in 1993 [
6]. Unfortunately, for almost 20 years, few papers relevant to this inquiry were published. In recent years, however, additional studies have been performed, contributing to the knowledge base and enabling the development of new analytical models of the pyrolytic coking process, making it possible to fully define thermal conversions at particular process stages. The results of these studies are included in the following publications [
7,
8,
9].
To date, the most comprehensive approach to coal pyrolysis kinetics has been presented in a study conducted by Merrick [
4,
5]. He assumed a few basic criteria for a model, which incorporates several chemical components present in a gaseous product of pyrolysis and provided a means of performing mass and energy balancing. This model has been of great value to the modeling process, and the approach was even effectively applied by Buczynski et al. [
10,
11] to a non-recovery coke oven. Other balancing models developed over the ensuing decades have almost entirely focused on a few selected aspects of the thermal decomposition mechanisms of coal, and thus, they are not applicable for complex process analyses.
The model developed by Merrick does return some inconsistencies. For example, the yield of tar can give negative results for some types of coal, which frustrates efforts to mass balance. Additionally, the frequency factor unreasonably employs the same value for all components released during carbonization. Activation energy is assumed to follow the Gaussian or any other distribution model, which is troublesome as this is not in any way supported by experimental data. Char yield is calculated by the difference between input mass of coal and the sum of all the released components including tar, but this is based on starting point assumptions and may be misleading; final tar yield is very much dependent on the heating rate applied, and generally, models should be capable of incorporating the effects of secondary pyrolytic reactions. Use of this model makes it necessary to accept a constant chemical composition of the resulting coke that is merely a very rough approximation. Additionally, finally, the model does not account for heating rates, a substantial limitation on its application in other processes like fluid bed pyrolysis, where coal particles are heated at the rate of about 5000 K/min.
This paper presents a newly integrated kinetic model of coal pyrolysis that allows for tracking the conversions that occur at each heating stage by identifying the yields of particular products and analyses of the related conversion heat effects as well as pyrolytic heat demands. The merit of this new model is its ability to resolve gaps in previously employed coking process models.
2. Kinetic Models of Coal Pyrolysis
Sciazko has previously developed a coal pyrolysis model [
9] based on first order kinetics, which includes the heating rate effect on activation energy and the frequency factor. That model accounts for a temperature shift between the maximum rate of total volatile matter evolution and that of individual gaseous components. Below, a brief description of the coal pyrolysis model is presented with a reference to the detailed analysis discussed in [
9].
A pyrolysis of coals with various coalification degrees was carried out on a laboratory scale using a LECO TGA-501 thermogravimetric analyzer on samples weighing 1–5 g [
12]. The instrument measures the changes in mass with a balance sensitivity of 0.00025 g. The studies were carried out under nitrogen atmosphere at the heating rates of 5 K/min, 20 K/min, 40 K/min, and 99 K/min and at final temperatures of 450, 550, 600, 650, 700, 750, 800, 850, and 900 °C. Coal samples were initially dried at 105 °C to provide a fixed mass.
Coals used for coking blend preparations for Polish coking plants and thermal coals used for power generation were investigated (
Table 1).
As a result, the methodology briefly described below was developed, allowing for the computation of the coal decomposition rate and product yields and giving the closed mass an element balance. In turn, this complete mass balance method allows for an energy balance analysis. Where there are differences in coal origins or process conditions, relevant parameters may be properly adjusted as described below.
The general idea of coal pyrolysis can be expressed by Equation (1):
In accordance with this scheme, coal decomposition can be approximated as a first order reaction occurring evenly across the entire volume of the sample. The rate of volatile matter released can therefore be described by Equation (2):
where
is the reaction constant and
is the quantity of total volatiles released when time
. The reaction constant is assumed to follow the Arrhenius law, Equation (3):
Heating rate (
m) is expressed by Equation (4) and is assumed to be constant over the reaction path.
Replacing
k in Equation (2) with Arrhenius law, Equation (3), and inserting Equation (4), Equation (5) is formulated:
After separation of variables and integration on the interval
, Equation (6) is produced. It expresses the total quantity of volatile matter released from the beginning of the process through the end when the coal temperature reaches its target (
T).
The kinetic parameters (activation energy and frequency factor) in Equation (6) are parameters that effectively reflect two pyrolytic stages: the primary thermal decomposition of coal and the secondary reactions of tar cracking.
The experimental results collected for coals characterized in
Table 1 were used to find suitable kinetic parameters by minimizing Equation (7), where
is the experimental value of released volatile matter at the final process temperature
T and at the heating rate
m. The equation was solved numerically using MathCad 14 (PTC, Needham, MA, USA) software to find k∞ and
E.
As a result, it was discovered that the values for the kinetic parameters were very much dependent on coal quality and heating rates. For a particular heating rate, activation energy and a natural logarithm of frequency factor can be calculated with good accuracy from linear correlations, Equations (8) and (9), yielding a total volatile matter content in coal, expressed in wt % (
. The details are described elsewhere [
9].
and
Coefficients
,
,
, and
are dependent on the heating rate and can be correlated with the natural logarithm of the heating rate, expressed in K/min, Equations (10)–(13).
The experimental validation of Equation (9) shows that the frequency factor values obtained are modestly overstated for higher heating rates. To better describe the pyrolytic kinetic dependence on heating rate, Equation (9) should be modified as illustrated in Equation (14):
where:
;
.
While analyzing DTG curves obtained from different heating rates, it was noted that the peaks of the release rates of individual gaseous components shifted toward higher temperatures as heating rates increased. This phenomenon was also observed for curves illustrating total volatile matter release. Furthermore, the temperature characteristics of the peaks of individual gaseous component release and of the peaks of overall volatile matter release are significantly different.
Despite these differences, the pyrolysis process remains the same; hence, the conclusion can be drawn that, in every case, there is a computational temperature, which corresponds to the same kinetic state of coal as determined for a particular heating rate. Moreover, we can assume that the kinetic curves of an individual gaseous component release are coherent with the curve of overall volatile matter release. Based on these assumptions, a new model to predict pyrolytic product formation was developed, one that especially compensates for activation energy and frequency factor.
The difference between reference activation energy
computed for total volatile matter release and the activation energy for an individually considered gaseous component can be approximated by the linear relationship with a temperature shift Δ
T between the total volatile release rate and specific gaseous component release rate, Equation (15).
Equation (16) shows the relation between the ratio of frequency factors of total volatiles released and the release of an individually considered gaseous component with respect to temperature shift Δ
T. This can be approximated with a linear relationship.
In-depth experimental data analysis leads to Equations (17) and (18), which allow for the calculation of correction factors dependent on the type of coal (based on volatile matter content) and the heating rate.
Coefficients of the correlations above are respectively equal: ; ; ; ; ; ; ; ; ; and . The approximation error for the correlation of activation energy is 5%, and for the frequency factor, it is 0.6%.
Following the model described above, it may be concluded that the most important assumptions about individual pyrolytic product formation are as follows:
Individual volatile product yields are primarily dependent on the overall volatile content in coal.
This model calculates the generation of the following gaseous products: H2, CH4, CO, CO2, H2O, C2H6, C6H6; H2S, and NH3.
Individual gaseous product release evolves as temperature shifts with respect to the maximum rate of total volatile matter release, and this temperature shift can be determined by identifying the maximum rate of individual component release.
Temperature shift can be defined as a difference between the peak temperature of an individual gas release curve and the peak temperature for volatile matter release in general, and it is minimally affected by the coal type and test equipment used.
The yield of every volatile component is proportional to the overall volatile content in coal, as shown in Equation (19):
where
is the maximum yield of particular volatile compound, and
is the ultimate share of an individual volatile compound in the total volatile matter yield.
Activation energy and frequency factor of an individual gaseous pyrolytic product can be calculated from Equations (20) and (21), respectively, as being the result of the transformation of Equations (15) and (16):
The relation between the quantity of an individual component released
and temperature is expressed by Equation (22):
Tar yield can be calculated as the difference between the yield of total volatile matter and the sum of gaseous component yields, Equation (23):
Char yield is calculated from the difference between the mass of introduced coal and the total volatile matter yield, Equation (24):
2.1. Ultimate Yield of Pyrolytic Products
For the model calculations, it was assumed that released volatile components are represented by the following components: CH4, C2H6, H2, CO, CO2, H2O, H2S, NH3, and C6H6 (representing BTX) and naphthalene (representing tar).
Since the levels of S and N elements in a thermally stable organic substance like coal are not subject to significant change, it was assumed that the maximum yield for H
2S and NH
3 is dependent on the content of key elements (S and N), in dry and ash free forms, and the total volatile matter content (
) [
13]. The maximum mass yields for hydrogen sulphide and ammonia were calculated from Equations (25) and (26) [
9]:
Numerous studies and literature data [
14] show that the CO concentration can be determined by using the correlation ratio of oxygen to the total volatile matter from Equation (27):
The maximum mass of pyrogenic water yield was determined using the correlation ratio of oxygen to hydrogen from Equation (28):
Having calculated
and
, the maximum mass yield
was determined using proper oxygen balance, as illustrated in Equation (29):
The maximum mass yields of BTX, represented by benzene, Equation (30), ethane Equation (31), and tar Equation (32) were assumed with arbitrary chosen values:
The maximum mass yield of BTX-
was assumed to be zero at the primary step as it is only generated as a result of secondary decomposition reactions, or more precisely, by decomposing primary tar during further pyrolytic stages. The maximum mass yield for hydrogen
, Equation (33), was determined by solving the following balance equation using the numerical method:
Knowing the maximum mass yield for hydrogen
, it is possible to determine the maximum methane yield from Equation (34):
These calculations took into account the secondary decomposition of primary tar according to the stoichiometric equation of the naphthalene decomposition (used as a chemical representative of tar), as shown in Equation (35):
It was assumed that at
T = 600 K, 5% of generated tar decomposes, while at
T = 1300 K, 70% of tar is subjected to decomposition. Lineal equation coefficients were determined to model primary tar decomposition progress, Equation (36):
where
and
.
Equation (35) shows that during the reaction of primary tar decomposition, BTX and additional amounts for the quantities of ethane, methane, hydrogen, and remaining solid matter are generated. Equation (37) presents the method of calculation based on generated BTX:
Yields for ethane, methane, and hydrogen were determined by analogy. The total tar yield was determined from the following formula, Equation (38):
The quantity of solid carbon, which increases the yield of coke, was calculated using Equation (39):
2.2. Energy Balance
The material balance for the process of coal pyrolysis is calculated by following the fundamental principle of mass conservation: The mass of coal must be equal to the mass of its products. Due to significant differences in the chemical composition of various coal types, element balance can be used to detect the differences in product composition and the thermal effects in the chemical conversion of a substance as complex as coal. Energy balancing of the pyrolytic/coking reaction was developed by following the first law of thermodynamics, which requires that the change in system enthalpy equals the heat delivered. The change in the enthalpy of a substance under consideration can be defined by Equation (40):
The formation enthalpy of pure chemical substances at standard conditions is listed in thermodynamic tables [
15,
16]. While the formation enthalpy of coal or char has not been formally tabulated, it is defined by Sciazko for any coal [
9]. The specific heat for particular coal samples was computed according to Kirov [
17] by splitting the samples into a few basic components, i.e., ash, primary volatile matter, secondary volatile matter, and fixed carbon. This approach has been recommended by many authors [
18].
It is possible to calculate the heat demand for coal pyrolysis using Equation (41):
Thus, the heat demand for pyrolysis can be defined as the quantity of heat to be delivered per 1 kg of coal to yield a solid product and volatile components each heated to the temperature at which they leave the reaction system. This value is affected by, among other things, the degree of coal metamorphism, ash and moisture levels, and the temperature for executing the process. Assuming the reference temperature equals
T0, Equation (41) can be written as follows in Equation (42):
The standard enthalpy of pyrolytic reactions can be defined as a difference between the enthalpy values of substrates and products at specified standard conditions (298 K and 0.1 MPa).
For the case under consideration herein, this can be expressed as Equation (43):
Standard pyrolytic enthalpy indicates the types of conversions that take place during coal decomposition by taking into account standard enthalpies for particular chemical components. The difference in the enthalpy of products and the substrate indicates the heat effect of the conversion. In the case of an exothermic effect (negative value), the quantity of heat to be delivered to the system from flue gas obtained from the gas combustion needed to heat coal to the appropriate temperatures for pyrolysis, and it can be determined accordingly.
3. Experiment
Coals and charge blends used in Polish coke plants were selected for tests and model analyses. For all coals, the following physical and chemical analyses were carried out:
Proximate analysis—volatile matter, ash, and moisture content;
Ultimate analysis—carbon, hydrogen, nitrogen, sulphur, and oxygen;
Calorimetry—gross calorific value and net calorific value.
For all coals under analysis, a laboratory coking test was conducted to determine the mass balance for the coking process and to verify the calculation model. This was performed by using an experimental set up for retort coking under thermal conditions similar to those present in industrial coke ovens.
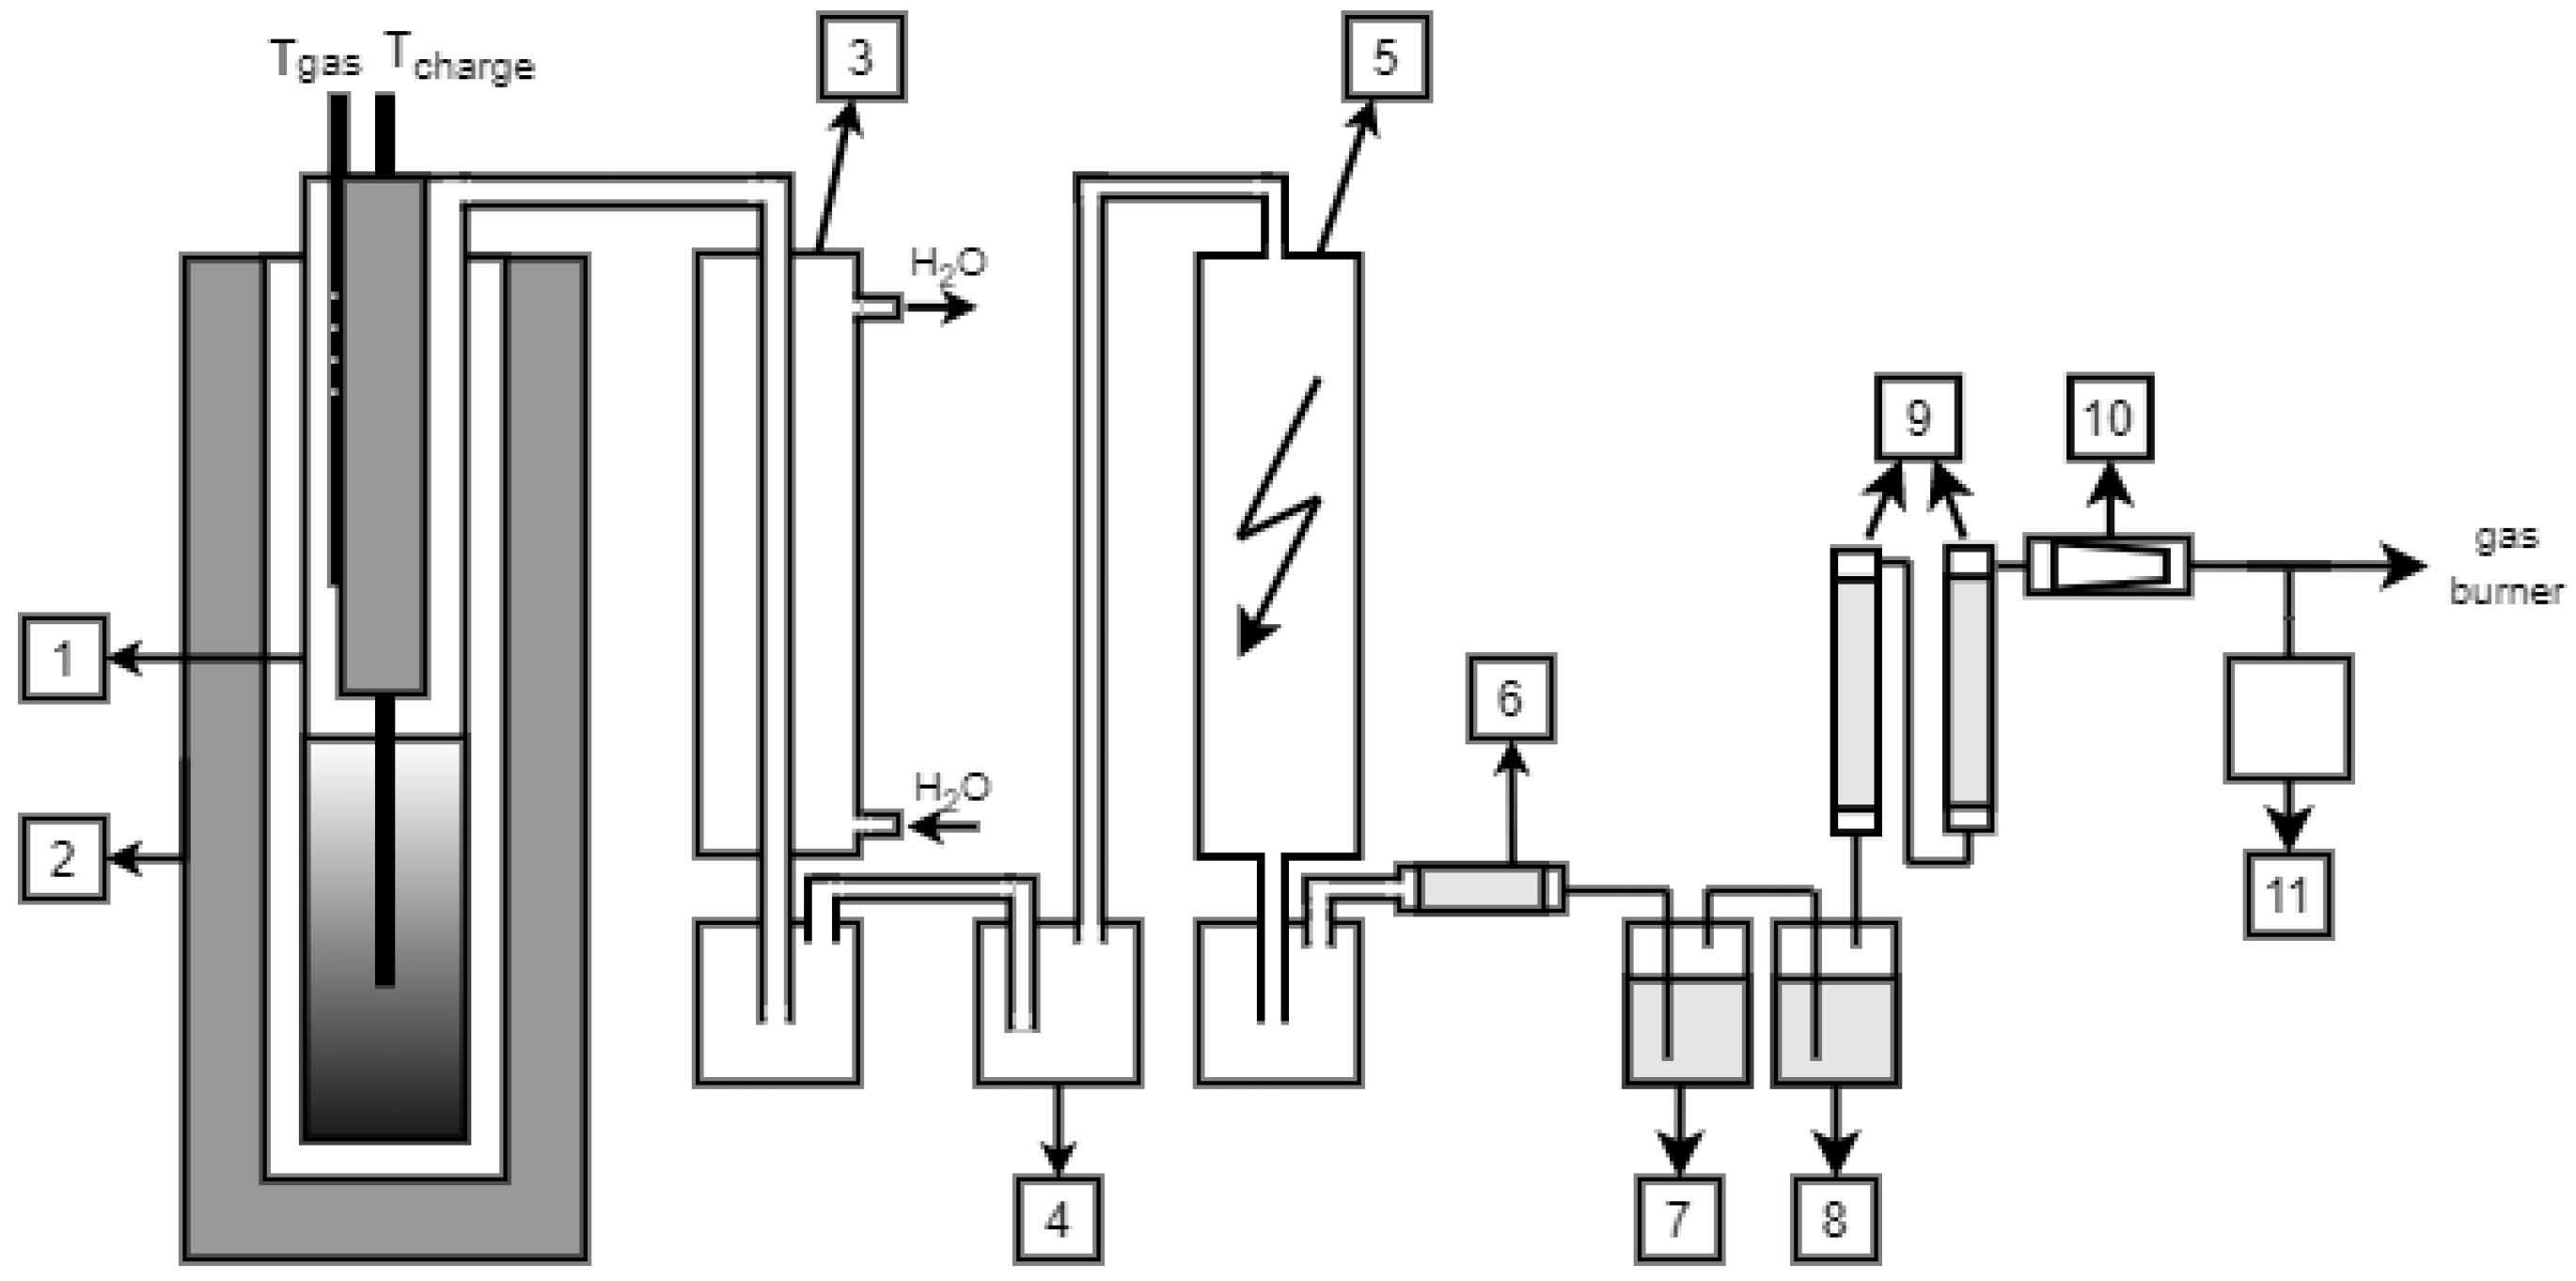
A schematic diagram for experimental coking is presented in
Figure 1. Apart from the carbonization chamber (1), the plant was additionally equipped with systems to collect released liquid and gaseous products (e.g., a water cooler) (3), a gas pressure regulator (4), electrostatic precipitator (5), and container for gas samples (11). Based on the results of measurement and analyses, a mass balance for the coking process was completed.
The coking process proceeds as follows: The retort with the coal charge (1) was placed in an oven (2) and heated up to 900–920 °C. Twenty min after placing the retort in the oven and reconnecting the oven heating sections to the mains, the temperature at the retort wall reached about 800 °C. Further heating was adjusted to produce temperature increase increments for the oven heaters of 1.5 °C per min. Once the heater temperature of 950 °C was obtained, the retort was held at this temperature until the gas emission rate decreased below 0.5 dm3 per min.
The total coking time was about three hours. Once the process was complete, the retort was taken out of the oven and introduced into the cooler. The cooled coke was discharged from the retort when it reached approximately 50 °C.
During the coking process the following values were recorded:
Temperature at retort walls (temperature of selected heating sections);
Temperature inside the pyrolysis chamber;
Temperature inside the coal charge;
Gas pressure in the retort;
Quantity of released gas.
At equal volume intervals, samples of the released gas were taken (11). To balance the coking process, mass yields were determined for individual coking products, and physical and chemical analyses were performed, yielding the following data: tar, BTX, process gas, pyrogenic water, ammonia, and hydrogen sulphide [
19].
Properties of Coals
Testing assessed nine coals types, whose properties are presented in
Table 2. To perform balance and calculations for all coals, the following analyses were carried out:
Proximate analysis (moisture W, volatile matter V, and ash A);
Ultimate analysis (carbon C, hydrogen H, nitrogen N, and total sulphur S) and oxygen O;
Determination of gross calorific value qv,gr and net calorific value qv,net.
4. Analysis of Results
Based on the determined yields of coke and remaining pyrolytic products (liquid and gas), the mass balances of the process were developed. The results are presented in
Table 3.
During the coking process, temperatures and volumes of gas released were monitored. Based on the measurement results, an average temperature of gas for the whole process was calculated. On average for all coals under analysis, the temperature of the gas was 810 °C, while the final coke process temperature was 950 °C.
4.1. Verification of the Model Parameters
The developed model was used to perform balance calculations for all coal types under analysis. The results obtained are presented in subsequent figures,
Figure 2a–d, and were compared with the results from the laboratory plant. The diagrams presented also show the experimental results’ laboratory uncertainty in the form of bars. Measurement uncertainty characterizes the dispersion of the quantity values being attributed to a measurand, based on the information use. It informs about the range where the true results lies, the probability (usually with the confidence level of 95%), and it always should be stated with the test result.
To estimate the deviations of the experimentally determined values, standardized variable
Z was introduced and described by the following formula, Equation (44):
In the case of full compliance of calculated results with the measured ones, the expected value for
Z is 1, a zero hypothesis for statistical testing. To estimate the deviation level from the average, a standard deviation (SD) was calculated. The proper assumption of the zero hypothesis H
0 is confirmed; for the analysis conducted using the Student’s
t-test,
Z = 1.
Z variable values for coals and pyrolytic products under analysis are presented in
Table 4, while Student’s
t statistical values are presented in
Table 5.
When assuming the significance level of 0.05, t = 2.306, and for all products under analysis, the zero hypothesis cannot be rejected. This means that the predicted results obtained can be considered correct.
Similar results were obtained for the coke gas composition; for the main components—comprising of <95% of the gas composition—the differences were also not higher than 5%. This confirms the utility of balance testing using the model developed herein.
Major differences did occur for H2S and NH3 (average 40%), however, when the proportion of concentration within the gas (1.5 wt %) was taken into consideration, there was no significant effect on the whole balance.
4.2. Verification of Additivity of Blend Component Parameters
To verify the additivity of coal quality parameters in the coal blend for balancing purposes, the coke plant established a specified blend composition. The composition is presented in
Table 6.
The coal blend prepared was subject to pyrolysis consistent with the pyrolysis of component coals. The yields of products obtained were compared with the results obtained according to the model. The results are presented in
Table 7.
These results confirm that the use of this model, adopting the rule of additivity on coal quality parameters in the blend, allowed us to obtain correct results that did not differ among the individual components by more than 5%.
4.3. The Heat Effect of Coal Coking
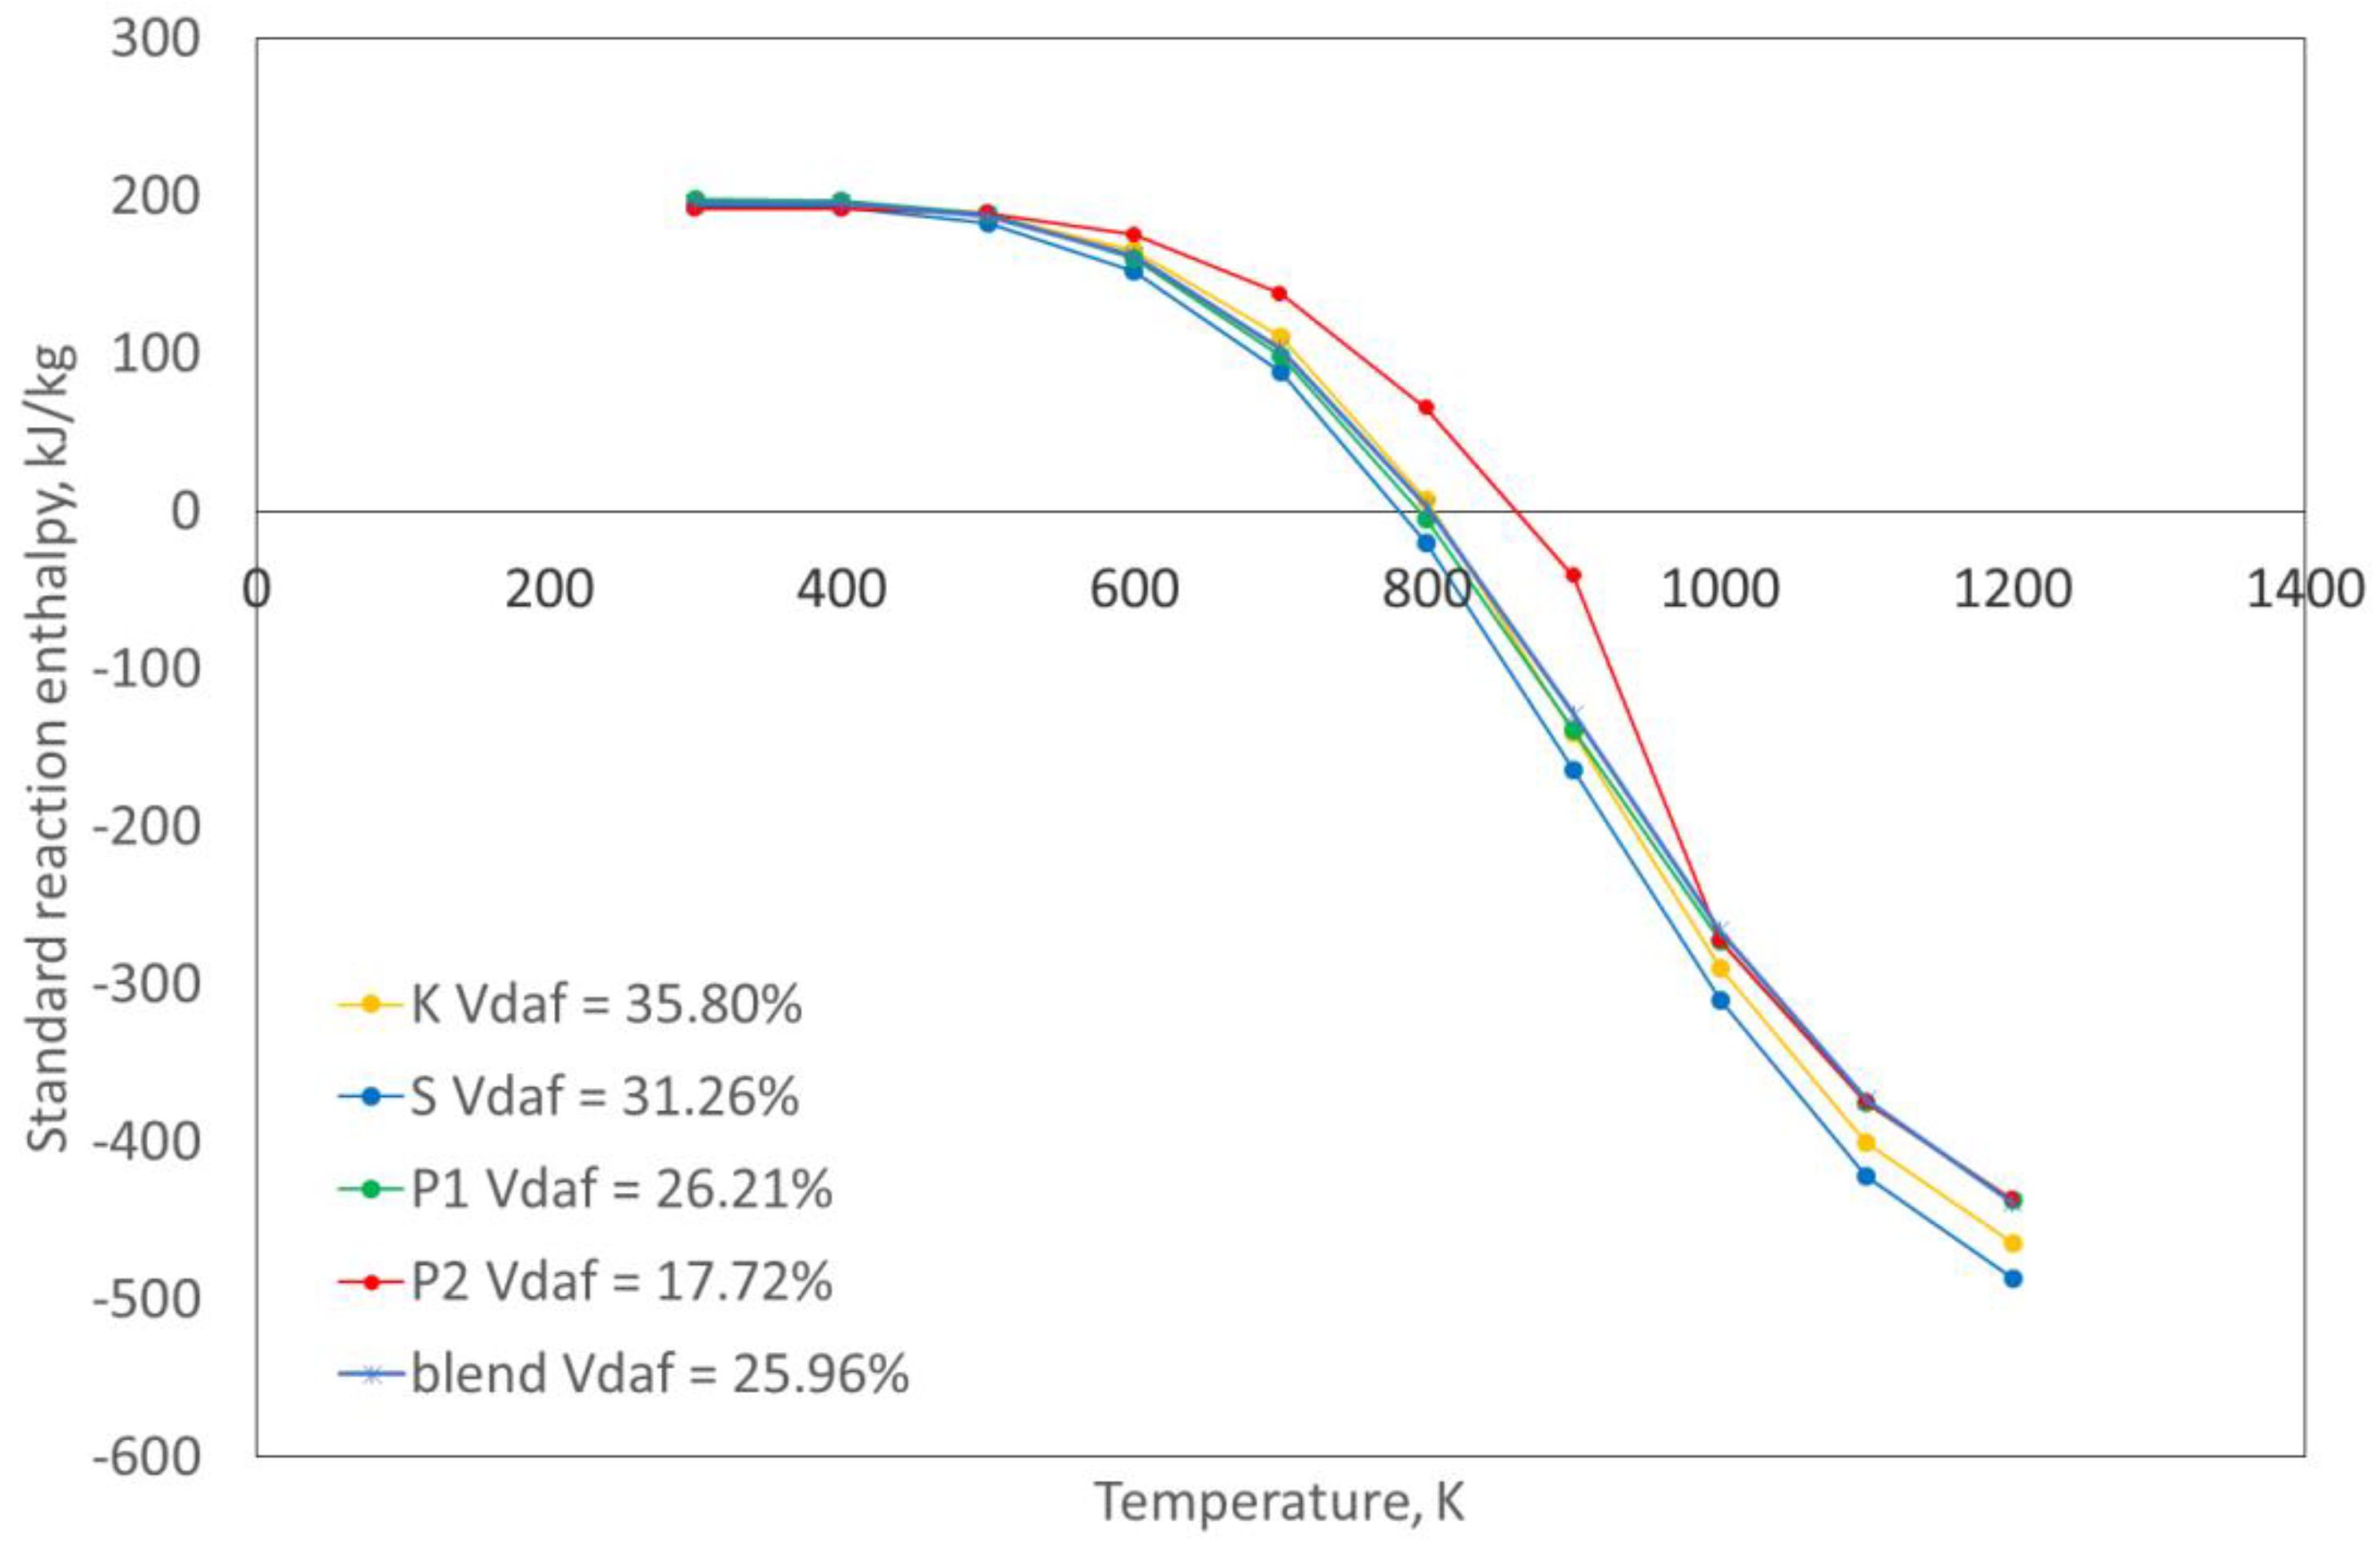
Calculations of reaction standard enthalpy with the changing temperature for all coals and coal blends under analysis were performed. For example, for the four selected coals and the tested blend,
Figure 3 presents the standard reaction enthalpy with the increasing temperatures.
As shown in
Figure 3, the heat effect of the standard conditions of the pyrolytic reaction up to 550 °C was positive, which indicates that the reaction was endothermic. Once the approximate temperature of 550 °C was exceeded, the effect changed until the process end became exothermic. Taking this into account, an average value of reaction enthalpy over the entire temperature range is presented in
Table 8. By analyzing the obtained results, it can be observed that the heat effect for the whole pyrolysis under laboratory conditions was slightly exothermic.
Based on the obtained product yields, the physical enthalpy was calculated, which was based on the specific heat capacity of the reaction products. Tar and BTX are complex blends of hydrocarbons, the most common simplification was used for calculations assuming naphthalene for tar, and benzene for BTX. For the physical enthalpy of coking products in the experimental plant, it was assumed that the average gas temperature was 810 °C, while the coke temperature had the final process temperature of 950 °C.
4.4. Model Verification for Industrial Testing
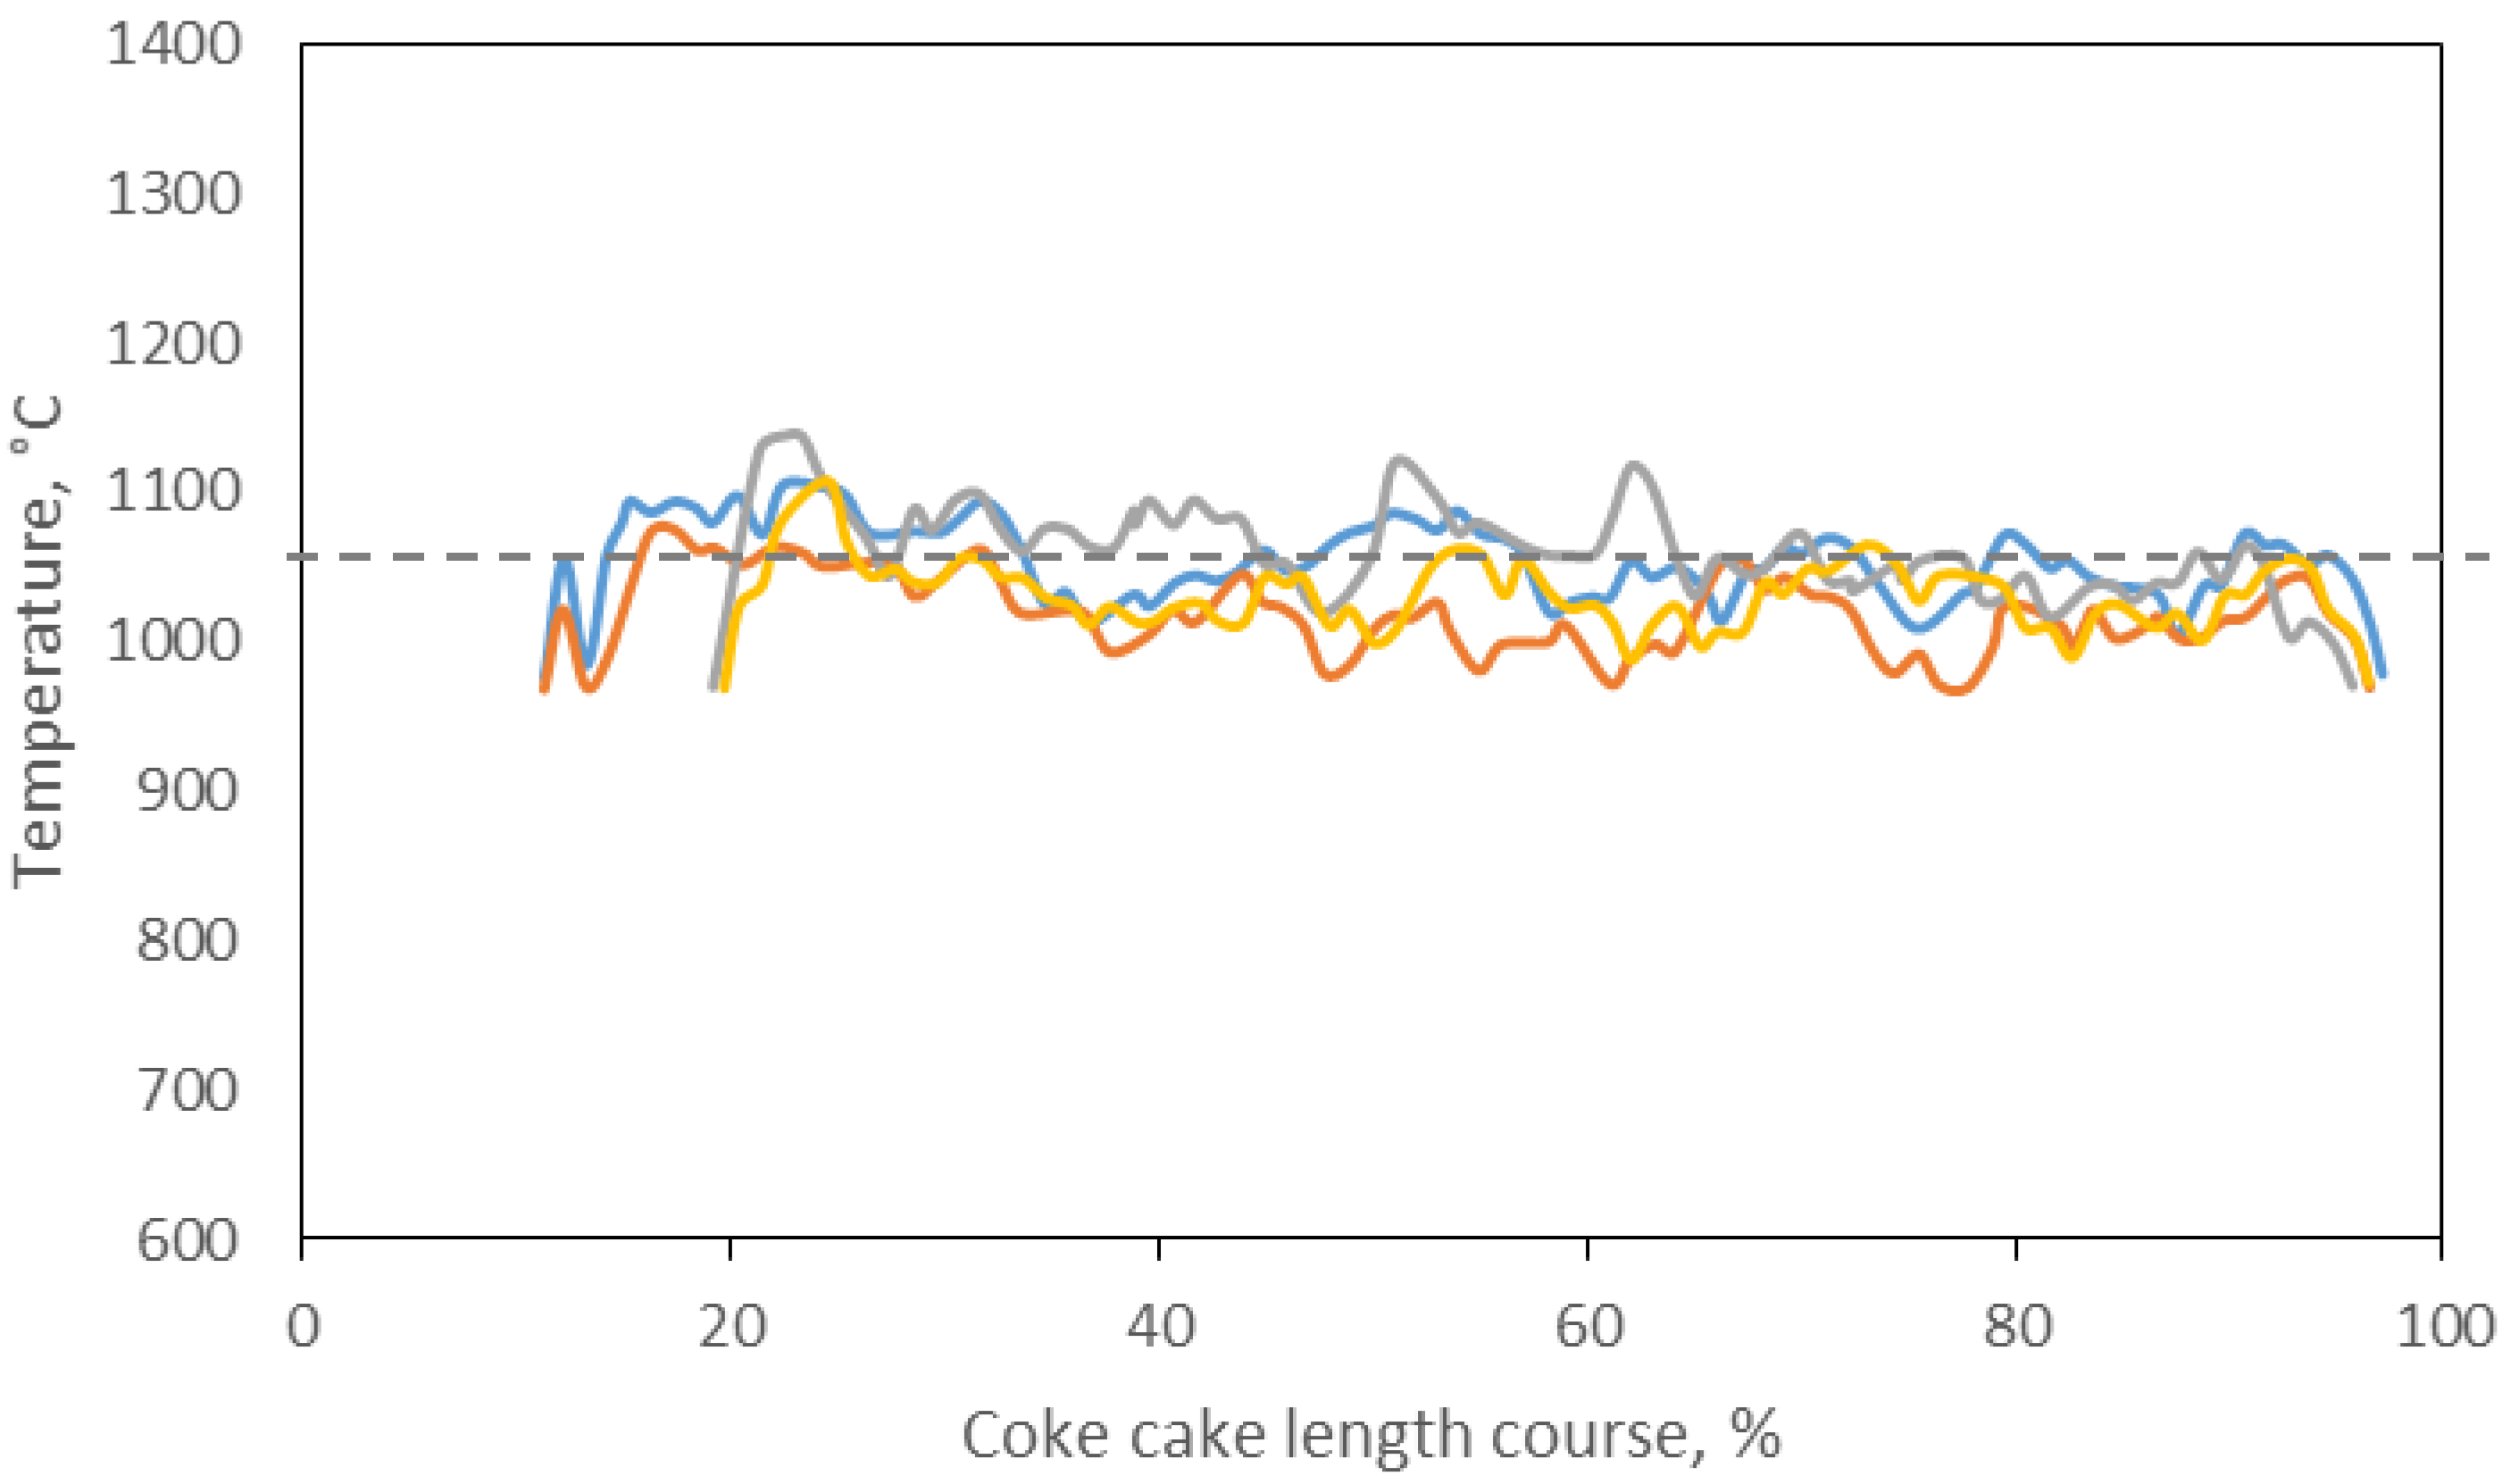
The distribution of temperature along the discharged coke in one of the Polish coke plants was periodically tested with a pyrometer. Tests performed with a Cyclops pyrometer are presented in
Figure 4.
By analyzing the curve of hot coke temperatures, an average temperature of 1050 °C was assumed for the coke and 850 °C for the gas for the entire process.
4.5. Chemical Composition of Coke Oven Gas
From the coke oven battery receiver in the coke plant, three samples of raw coke oven gas were taken. The average chemical composition of raw coke oven gas is presented in the first column of
Table 9. For the analyses checking the model for chamber conditions, industrial data regarding the blend composition from the coke plant were used and are presented in
Table 7.
Correcting coefficients were then applied to the model, and calculations for the composition of coke oven gas were performed again to evaluate the conditions of the coking chamber. The changes included:
Final yield CH4, ;
Final yield C2H6, ;
Final coke temperature = 1050 °C.
The results obtained are presented in the third column of
Table 9.
By comparing the results of calculations for gas from the laboratory plant with the results of the industrial gas composition, discrepancies were discovered, especially in the content of hydrogen and methane. Changes were introduced to the model in the calculation procedure, taking into account the differences in coking process conditions in the laboratory plant and coke oven battery. Once implemented, these changes allowed the model to produce comparable results.
The differences in the composition of raw coke oven gases between the model and the results taken from the coke oven battery for two components, hydrogen and methane, did not differ by more than by 0.5%, relative.
5. Conclusions
A comprehensive coal pyrolysis model was developed using thermogravimetric data, which was then validated against the lab scale retort coking results and full-scale industrial oven. A number of tests were performed allowing for the collection of different data sets revealing product yields for: H2, CH4, CO, CO2, H2O, C2H6, C6H6; H2S, NH3, BTX, tar, and coke. The characteristic feature of the described model is closed mass balance based on an assessment of basic coal elements. The methodology adopted both for the total streams alignment and element balancing for the main products falls in the range of ±5%. Due to differences in the chemical composition of various coal types, element balancing allowed detection of the difference in product compositions and the heat effects of chemical conversion.
For the coals tested using the developed method, the enthalpy of the pyrolytic reaction was defined at each stage, i.e., for subsequent charge temperatures. Based on the results obtained, it can be stated that:
In the first coking period, there are endothermic reactions, while in the second, exothermic reactions occur.
The average heat effect of the reaction for the whole coking period is exothermic, and depending on the coal type, ranges from −5 to −50 kJ/kg.
This effect is insignificant considering the whole coking balance, which is indicated by the value of physical enthalpy for the products of about 1900 kJ/kg of charge coal.
Summing up, it should be emphasized that the methodology developed herein is the result of research and experimental work conducted over the last few years. It provides new knowledge regarding the coking process, primarily in the field of coal conversion thermodynamics by defining coal enthalpy formation and by building a verified kinetic pyrolysis model covering all basic gas components, tar, BTX, and coke. As a result, it is now possible to perform the process balance calculations with uncertainty not higher than that for the known and commonly balanced combustion processes used within the power industry.


