Article

An Air Terminal Device with a Changing Geometry to Improve Indoor Air Quality for VAV Ventilation Systems

by
Nina Szczepanik-Scislo
1,2,* and
Jacek Schnotale
1
1
Faculty of Environmental and Power Engineering, Cracow University of Technology, 24 Warszawska Str., 31-155 Krakow, Poland
2
CERN, European Organization for Nuclear Research, Esplanade des Particules 1, 31-155 Geneva, Switzerland
*
Author to whom correspondence should be addressed.
Energies 2020, 13(18), 4947; https://doi.org/10.3390/en13184947
Submission received: 8 August 2020 / Revised: 4 September 2020 / Accepted: 17 September 2020 / Published: 21 September 2020

Abstract

:
This study aimed to develop a new concept for an air terminal device for a VAV (variable air volume) ventilation system that would improve overall ventilation efficiency under a varying air supply volume. In VAV systems, air volume is modified according to the thermal load in each ventilated zone. However, lowering the airflow may cause a lack of proper air distribution and lead to the degradation of hygienic conditions. To combat this phenomenon, an air terminal device with an adapting geometry to stabilize the air throw, such that it remains constant despite the changing air volume supplied through the ventilation system, was designed and studied. Simulations that were performed using the RNG k–ε model in the ANSYS Fluent application were later validated on a laboratory stand. The results of the study show that, when using the newly proposed terminal device with an adaptive geometry, it is possible to stabilize the air throw. The thermal comfort parameters such as the PMV (predicted mean vote) and PPD (predicted percentage of dissatisfied) proved that thermal comfort was maintained in a person-occupied area regardless of changing airflow though the ventilation system.

1. Introduction

The building sector accounts for 40% of primary energy use, and a considerable fraction of this energy is utilized to construct a desirable indoor environment for occupants [1,2]. At the same time, we spend more than 90% of our time indoors and have higher requirements for indoor thermal and environment comfort [3,4]. Good indoor air quality, energy-saving performance, and flexible area control have made VAV (variable air volume) air-conditioning systems widely popular in office, commercial, and industrial buildings [5,6,7].
To save energy, VAV systems regulate airflow according to the current needs in a ventilated zone [8,9]. When less air is needed, less energy is consumed by the system. These changes result in lowering the power needed to supply the fan in the air-handling unit and, as a consequence, in saving energy [8,10]. Equation (1) shows that, by lowering the air flow by 20%, it is possible to lower the energy consumption of the ventilators by almost 50% [11,12,13,14,15,16].
P 2 P 1 = ( n 2 n 1 ) 3 = ( V ˙ 2 V ˙ 1 ) 3 ,
where P1, P2 is the electric power consumed by the fan, n1, n2 is the rotational speed of the fan, and V ˙ 1 ,   V ˙ 2 is the air flow volume through the fan.
Equation (1) shows that VAV systems have energy-saving potential. However, when lowering the airflow, the system may not be able to remove all the contaminants [9] and may cause their accumulation within buildings, leading to dead zones [9]. The recommended parameters for systems with variable air flow, including the fresh air rate and criteria for the indoor environment (thermal, air quality, noise, light), are provided by standards EN 15251:2012 [17], ISO 7730 [18], and ANSI/ASHRAE-62.1 [19]. Despite these regulations, the problem of high contaminant concentration and the lack of thermal comfort have been proven in both buildings built in the classic standard [20,21,22] and airtight buildings (passive and zero-energy) [23,24]. This problem occurs in households, sports facilities [25,26], schools [27,28,29,30], kindergartens [31], office environments [32] etc., which means it is a concern in the entire building sector. When regarding VAV systems, studies have shown that, when they are not properly regulated, there is a risk of contaminant accumulation [8,13,33,34].
To counteract the problems concerning VAV systems, a laboratory stand with an adaptive ATD (air terminal device) was created and CFD (computational fluid dynamics) simulations were carried out. The aim was to test the possibilities of a device that had a steady air throw, meaning that the range of air leaving the ATD would remain constant despite the changing flow in the VAV system. This could prevent the accumulation of contaminants in specific zones when the airflow was lowered. Thanks to the new design of the ATD and the research carried out, a target zone could be continually ventilated despite the changes in the flow, and fresh air would be constantly supplied to the occupants.
Laboratory tests of air terminal devices were carried out by various researchers, proving that their geometry influences airflow. Kalmar used different types of air terminal devices to evaluate their influence on the comfort of occupants [35], while Rabani et al. assessed heating in an office cubicle using an active supply diffuser in a cold climate [36]. Both found that the adaptation of ATD geometry improved the conditions in the ventilated zone. Nielsen studied the influence of wall-mounted air terminal devices used in displacement ventilation and its influence on velocity distribution close to the floor [37]. The study showed that openings between obstacles placed directly on the floor generate a flow similar to the air movement in front of a diffuser. Similar studies were done by Hurnik who discussed the difference in the geometry of a cleaning inlet of a VAV system that had a changing geometry to keep the fresh air from centering directly below the air supply and not dispersing throughout the ventilated zone [38].
Additionally, CFD simulations are a powerful tool for estimating the airflow patterns and thermal environment of various HVAC (heating, ventilation, and air conditioning) systems. They were used for the estimation and control of indoor environment and space ventilation when using a VAV system by Sun and Wang [39], Du et al. [40], Gangisetti et al. [41], and Nada et al. [42], among others. Furthermore, they were used to analyze the influence of structures on airflow, for example, by Mu et al. [43]. In their research, they designed a novel damper torque airflow sensor for VAV terminals and used CFD methodology to analyze the airflow characteristics at different speeds and positionings of the damper. Similar studies using CFD to show the influence of an element’s geometry with VAV systems were done by Hurnik [44], Liu et al. [45], and Pasut et al. [46].
According to the evidence that applying laboratory measurements and CFD analysis are valid choices in analyzing VAV systems, it was decided to use these methods in the study. The aim of the new ATD was to maintain a steady air throw under changing conditions so that a desired zone would be properly ventilated. The air throw is the distance from the ATD in the center of the penetrating air current to the point where a minimal air speed is measured. For the purpose of this study, the air speed that marked the end of the ventilated zone was assumed to be 0.5 m/s. It was chosen as a boundary value, after which the air velocity was assumed so low that it would not flow further into the ventilated room. The design of the ATD, as well as the analyses carried out in the study, shows that there is a possibility to improve the air distribution for VAV systems.

2. Materials and Methods

2.1. Experimental Study

The construction of the air terminal device was based on the change in its diameter. The design concept is shown in Figure 1 and Figure 2. The goal was to adapt the ATD geometry to change the inlet diameter as the flow of the system lowered, allowing the air throw to remain constant. The air flow was changed in steps and the diameter of the ATD was changed by installing a gasket between the elements. The detailed geometry of the device can be found in [47].
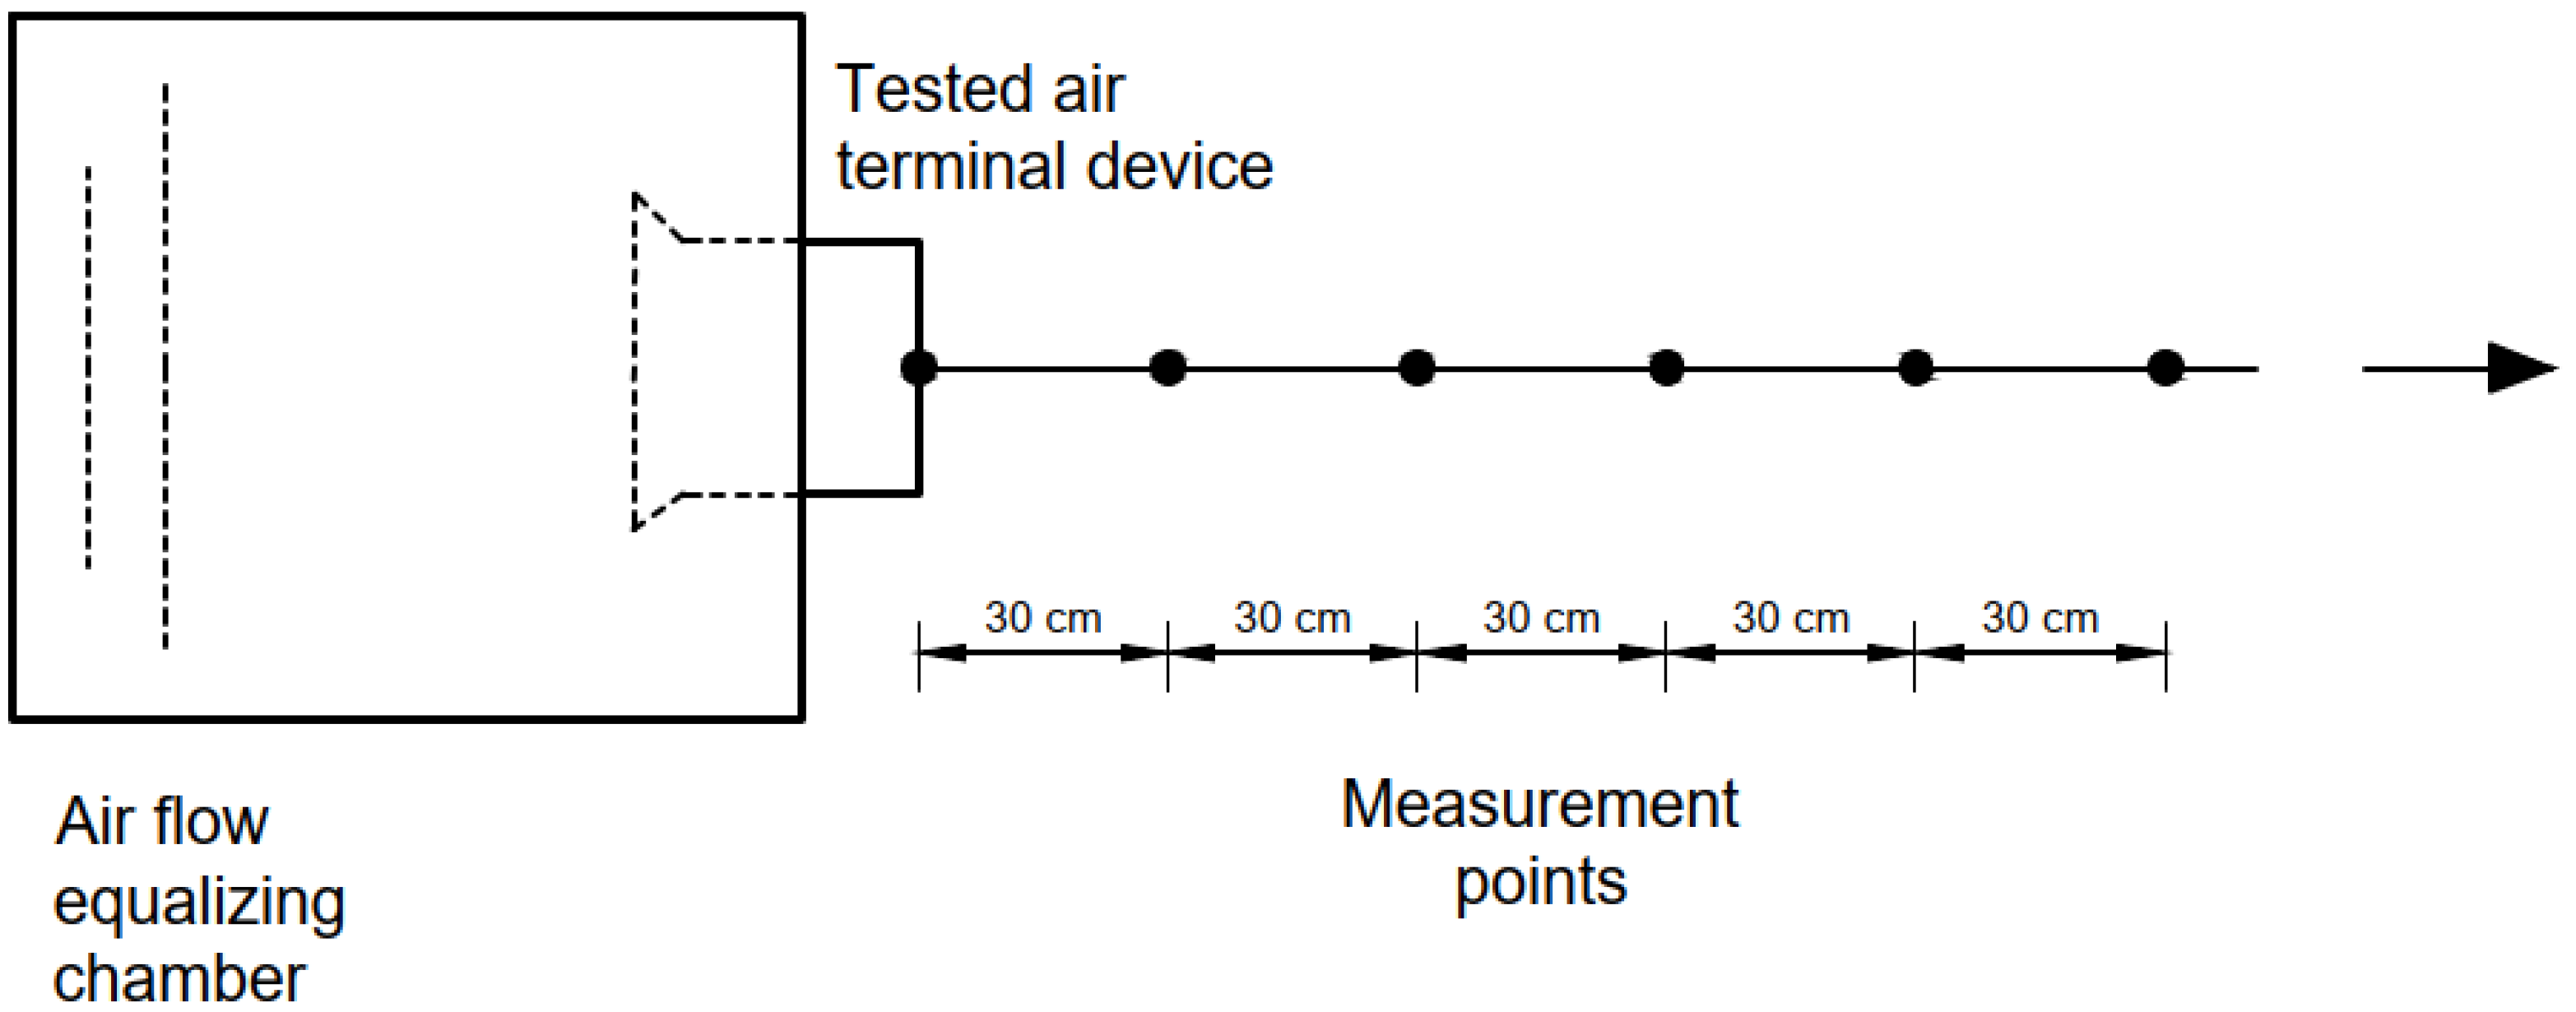
To test the ATD, a laboratory stand was constructed and installed in a space with controlled environmental conditions. It was designed according to European standard EN12238: 2002 [48], and the concept of the stand is shown in Figure 3.
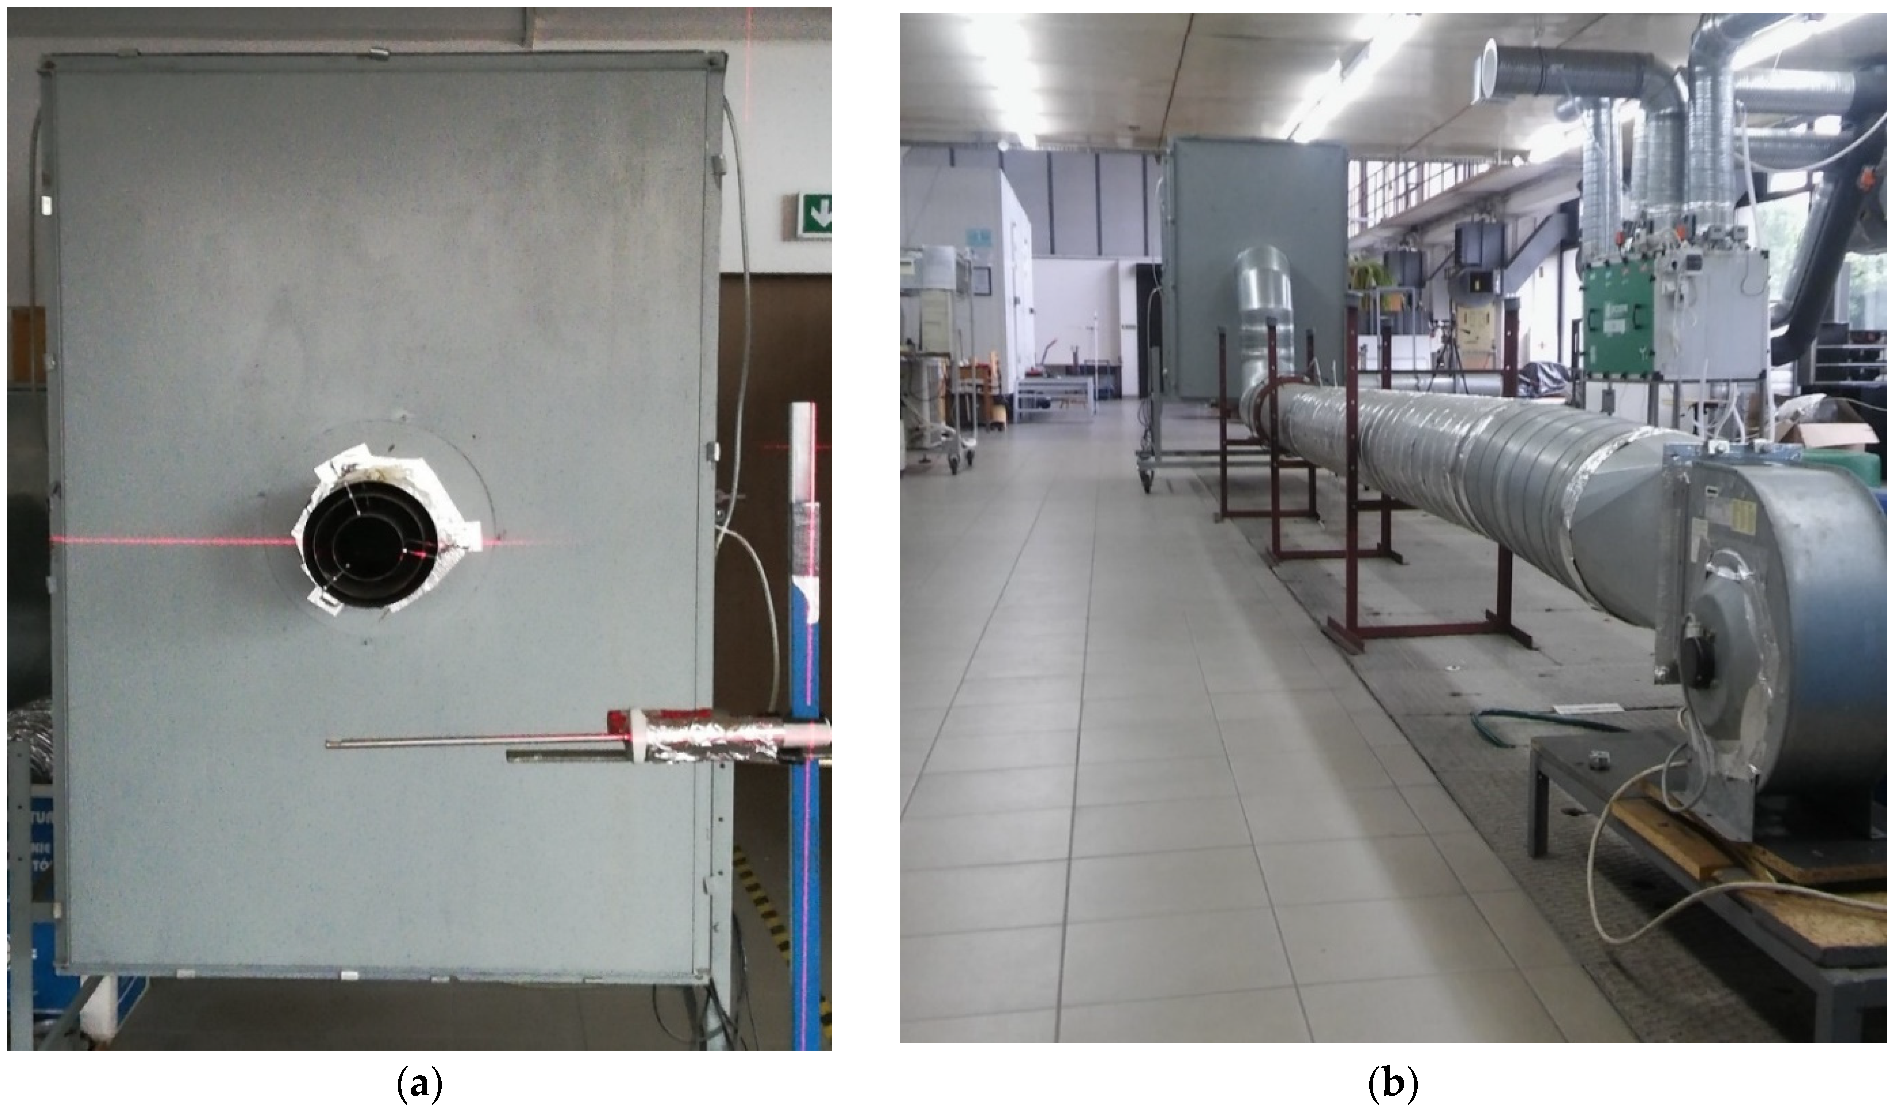
The temperature and humidity of the controlled lab space where the experiments were conducted were equal to 20 °C and 48%, respectively. The ambient air velocity was equal to zero as the laboratory was a closed room. A VAV system with a frequency inverter attached to the fan was installed, which allowed alteration of the airflow. The airflow itself was calculated according to the current standards and regulations [49] by using an orifice plate. The laboratory set up in shown in Figure 4.
The pressure drop on the orifice was measured using a micromanometer with the range of ±3500 Pa and the accuracy of ±1% at temperature equal to 20 °C. After the orifice, the air flew into the equalizing chamber where the flow was evened out by a series of grilles to eliminate turbulence. The air stream then flew into the ATD; turbulence from ducts and bends did not influence the flow into the test room thanks to the equalizing chamber.
After the air flew into the test zone, a thermal-resistant anemometer was used to measure its velocity and temperature. It had the range of 0.08 m/s to 20 m/s and an accuracy of ±2%. The summarized accuracy of the instruments used in the analysis are shown in Table 1. Velocity measurements were conducted every 30 cm from the air terminal device (Figure 5). The position of the anemometer was established for each measuring point by laser beam guidance. Thanks to the small diameter of the probe (6 mm), disruption of the air stream was minimalized. The anemometer can be seen in Figure 4 along with a cross laser beam. Velocity measurements were carried out for a period of one minute. The sampling frequency of the anemometer was 6 s, meaning that the final result was the average of 10 partial measurements.
According to EN ISO 5167-1 [50], the mass flow was calculated by defining the correlation between the flow and the pressure drop on an orifice using the following equation:
q m = C 1 β 4 ε t π d 2 4 2 Δ p · ρ 1 ,
where C is the flow coefficient, β is the ratio of the diameter of the duct to the diameter of the orifice, ε t is the expansion number, d is the diameter of the orifice (m) with its uncertainty equal to 0.0005 m, Δ p is the measured pressure drop (Pa), and ρ 1 is the air density (kg/m3).
When the flow is calculated according to Equation (2), the measurement uncertainty is defined according to ISO 5167 [50], and the error propagation rule as follows:
Δ q ˙ m = ( q ˙ m C ) 2 Δ C 2 + ( q ˙ m ε ) 2 Δ ε t 2 + ( q ˙ m d ) 2 Δ d 2 + ( q ˙ m β ) 2 Δ β 2 + ( q ˙ m ( Δ p ) ) 2 Δ ( Δ p ) 2 + ( q ˙ m ρ 1 ) 2 Δ ρ 1 2 .
To calculate the uncertainty shown in Equation (3), the uncertainty of each individual element must be defined. The uncertainty was calculated for the maximum flow as it differed the most from the simulations.
In Equations (2) and (3), the flow coefficient when using an orifice plate is defined as follows:
C = 0.5961 + 0.0261 β 2 0.216 β 8 + 0.000521 ( 10 6 β R e ) 0.7 + + ( 0.0188 + 0.0063 A ) β 3.5 ( 10 6 R e ) 0.3 + + ( 0.043 + 0.08 e 10 L 1 0.123 e 7 L 1 ) ( 1 0.11 A ) β 4 ( 1 β 4 ) + 0.031 ( M 2 0.8 M 2 1.1 ) β 1.3 + M 3 ,
where D is the diameter of the duct, equal to 0.315 m, and d is the diameter of the orifice, equal to 0.09 m.
A = ( 1900 β R e D ) 0.8 , L 1 = L 2 = 0.0254 D , M 2 = 2 L 2 1 β .
M 3 = { 0   f o r   D 0.07112   m 0.011 ( 0.75 β ) ( 2.8 D 0.0254 )   f o r   D < 0.07112   m .
The calculation of the uncertainty of the flow coefficient is shown below in Equation (7).
Δ C = ( C β ) 2 Δ β 2 + ( C A ) 2 Δ A 2 + ( C D ) 2 Δ D 2 ,
and
Δ A = A β Δ β .
The value of coefficient A was equal to 3.6477 with an uncertainty of 1.95 × 10⁻⁵.
The calculation of the uncertainty of β (ratio of the diameter of the duct to the diameter of the orifice) is shown below in Equation (9).
Δ β = ( β d ) 2 Δ d 2 + ( β D ) 2 Δ D 2 ,
where D is the diameter of the duct, equal to 0.315 m, and d is the diameter of the orifice, equal to 0.09 m.
Consequently, Δ β was calculated to be equal to 1.9 × 10⁻⁶ and Δ C was calculated to be equal to 1.898 × 10⁻⁷.
The expansion number ε t , presented in Equation (2), can be shown as
ε t = 1 ( 0.351 + 0.256 β 4 + 0.93 β 8 ) [ 1 ( p 2 p 1 ) 1 2 ] ,
where p1 and p2 are the pressure upstream and downstream from the orifice, respectively, with their uncertainties equal to 0.1 Pa.
The uncertainty of ε t can be calculated as shown below.
Δ ε t = ( ε β ) 2 Δ β 2 + ( ε p 1 ) 2 Δ p 1 2 + ( ε p 2 ) 2 Δ p 2 2 .
The calculations gave the results of the expansion number ε t equal to 0.9993 with its uncertainty Δ ε t equal to 3.52 × 10⁻⁶.
Additionally, the density of the air in Equation (2) can be defined as shown below.
ρ 1 = p 1 R w θ 1 ,
where p1 is the air pressure in the duct before the orifice (Pa), with its uncertainty equal to 0.1 Pa, θ 1 is the temperature of the air inside the duct (K), with an uncertainty of 1 K, and R w is the gas constant, calculated using Equation (13).
R w = 287 1 0.78 p v p a ,
where pa is the atmospheric air pressure (Pa), with its uncertainty equal to 0.1 Pa, and pv is the partial pressure for water vapor at temperature θ 1 (Pa).
The values of air density and gas constant were equal to 1.192 kg/m3 and 288.15 J/(kg∙K), respectively.
The uncertainty of partial pressure for water vapor can be calculated from the following formula:
Δ ρ v = ( p v φ 1 ) 2 Δ φ 1 2 + ( ρ 1 p s a t ) 2 Δ p s a t 2 ,
where psat is the saturation pressure of water vapor according to the dry-bulb thermometer.
The uncertainty of the gas constant can be calculated as follows:
Δ R w = ( R w p v ) 2 Δ p v 2 + ( R w p a ) 2 Δ p a 2 .
In order to obtain Δ ρ 1 from Equation (3), the following equation should be used:
Δ ρ 1 = ( ρ 1 p 1 ) 2 Δ p 1 2 + ( ρ 1 R w ) 2 Δ R w 2 + ( ρ 1 θ 1 ) 2 Δ θ 1 2 .
The calculation results were Δ ρ v = 6.42 Pa, Δ R w = 0.019 J/(kg∙K), and Δ ρ 1 = 0.004 kg/m3.
After the calculation of each individual component’s uncertainty, it was possible to calculate the uncertainty for Equation (3), which was Δ q ˙ m = 0.00026 kg/s, giving a relative uncertainty of mass flow measurement equal to 0.25%. Such a small value indicates the very high quality of the measurements and the measurement stand.

2.2. Numerical Simulation

Air distribution has been extensively studied with CFD methods. CFD was first introduced in the ventilation industry in the 1970s, and it is widely used today to assist in the design of ventilation systems [51]. The purpose of the CFD study was to develop and validate a computer model that could be used for accurate airflow assessment, considering different strategies, as well as different structures. CFD methods have been used by researchers before to evaluate air distribution methods [40,44,52,53,54].
The program ANSYS Fluent version 17.0 was chosen for the study as it provides comprehensive modeling capabilities for a wide range of incompressible and compressible, laminar, and turbulent fluid flow problems [55] where steady-state or transient analyses can be performed. The CFD simulations were carried out for the same conditions as the laboratory measurements. This allowed the simulation to be evaluated and used for future research. It was also used for the investigation of the thermal confront conditions.
To test how the turbulence models available in the ANSYS Fluent application preformed in this study, simulations were carried out to compare the k–ε and k–ω models, which are widely used for turbulent flow simulations [56,57]. For all cases, the ATD had the maximum diameter and maximum flow. Numerical studies were performed by selecting different turbulence models to determine the flow characteristics. The experimental and numerical results of the average velocities along the axis of the flow in the occupancy zone are compared in Table 2. The numerical results were compared with the experimental results, and the RNG k–ε turbulence model gave the best results.
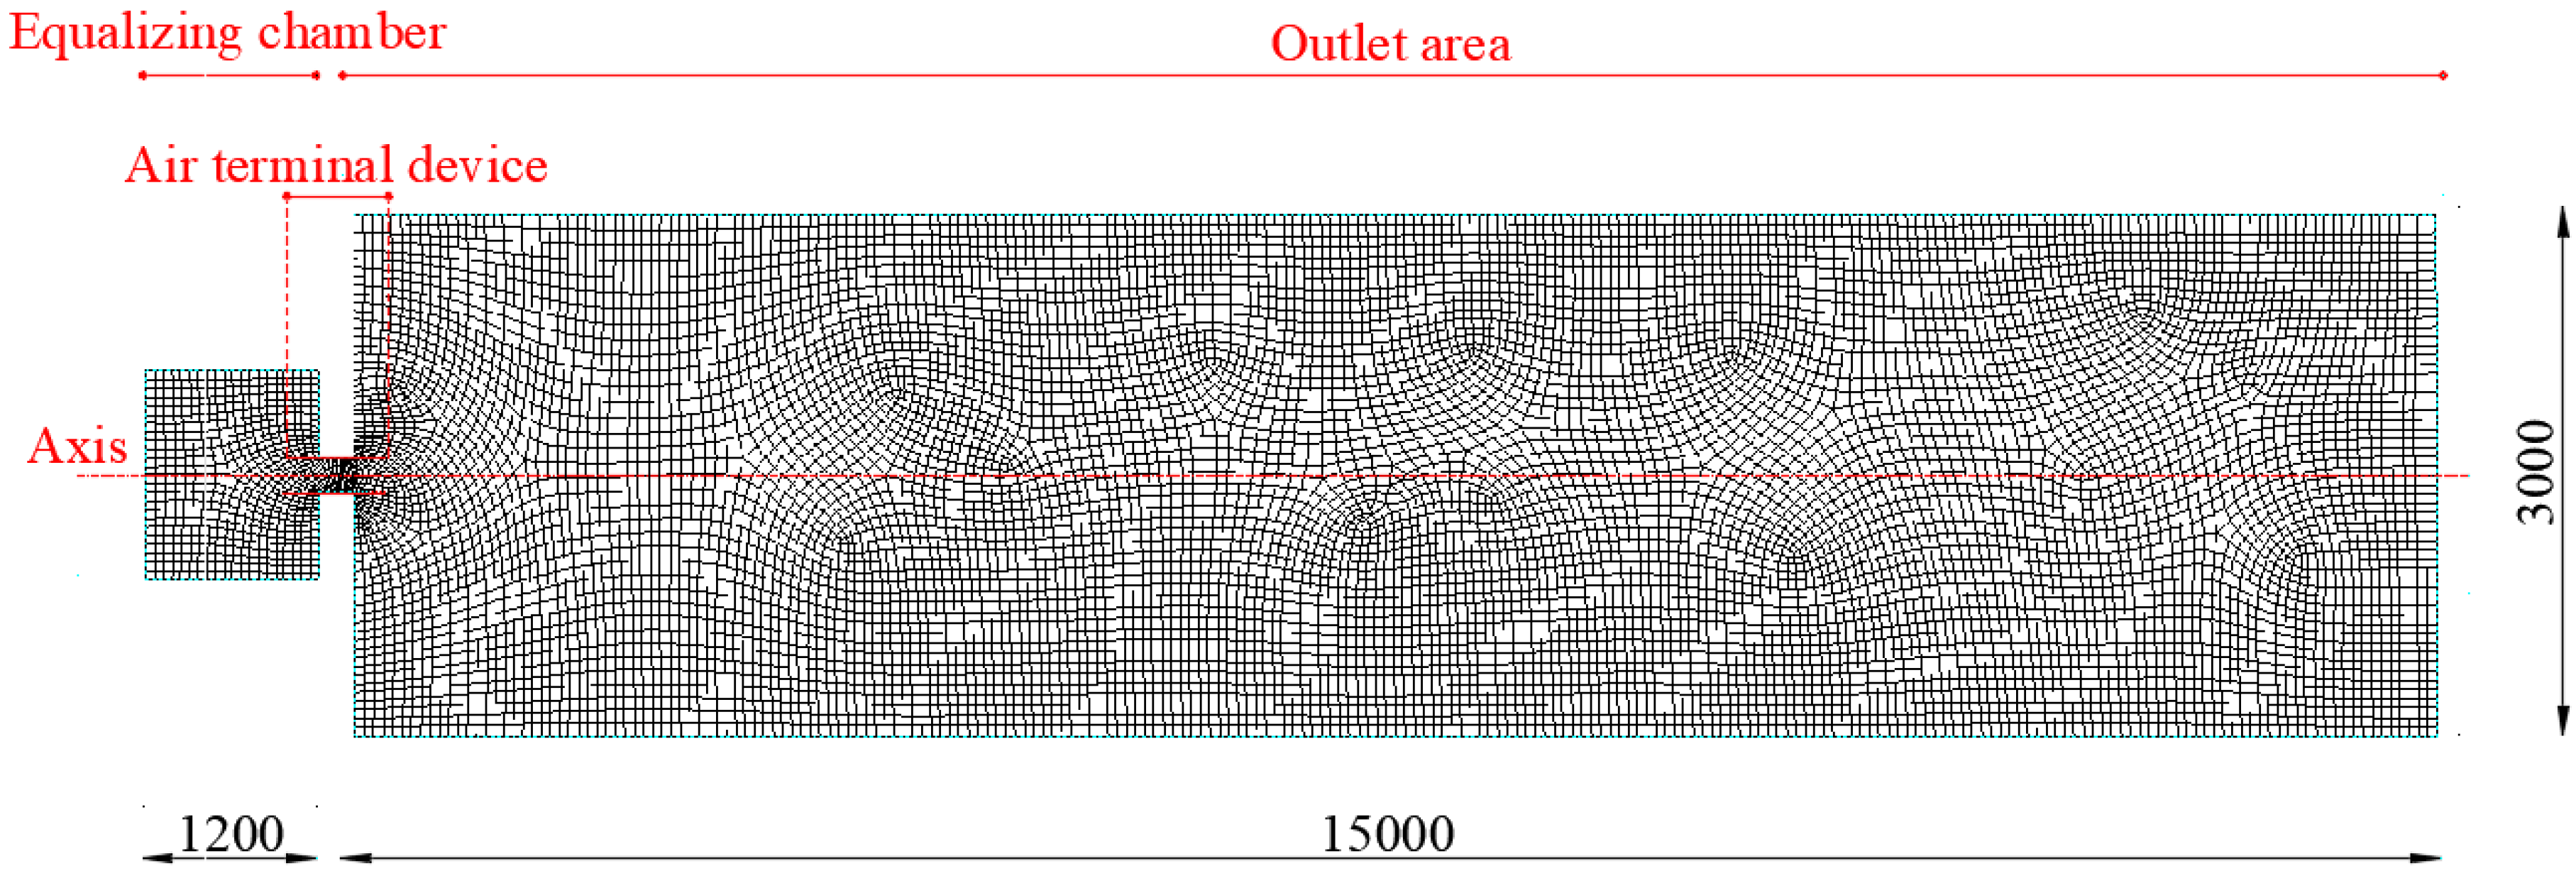
For the geometry of the experiment, an axisymmetric model was used. The geometry of the case is shown in Figure 6 and was adapted to reflect the conditions in the laboratory stand. An equalizing chamber was designed, which served as the air inlet boundary condition. The outlet boundary conditions were located along the edges of the outlet area (Figure 6) and were 15 m long, deliberately much larger than the air throw to not influence the simulation results.
A mech independence analysis was conducted to check how the number of elements influenced the results of the simulation. The results are shown in Table 3. The mesh with 8,799,416 elements was used in the simulations as it had suitable parameters and the number of elements was optimal for the simulation to converge.
As shown in Figure 6, cells with different element sizes were created in different parts of the model for a better mesh structure. Smaller cell sizes were created in the regions near the ATD and equalizing chamber, resulting in a better-quality mesh structure. The dimensional properties of these regions are given in Table 4. Additionally, the y+ parameter was calculated as it is an important parameter concerning the wall function and is the nondimensional distance from the wall to the first node from the wall [55]. Ideally, while using the enhanced wall treatment option, the wall y+ should be on the order of 1 (at least less than 5) to resolve the viscous sublayer [55]. In this study, the value of the parameter was below 1 for all the wall boundaries.
After conducting the above analyses, it was decided that the simulations would be carried out using the RNG k–ε model with enhanced wall treatment and took into account gravity working in the Y-direction. The solution method settings are displayed in Table 5. The convergence criterion was set to 10−6 which is adequate according to the literature [58,59].
To study how adapting the ATD changed the air distribution, three cases were taken under consideration for three different airflows. The flow was assessed by previous measurements done in a typical office building. The air magnitude in the cases was equal to the following:
  • 330 m3/h as the maximum airflow,
  • 220 m3/h as the medium airflow,
  • 150 m3/h as the minimum airflow.
The air terminal device settings were as follows:
  • ATD setting 1—all three rings are opened; ATD diameter DATDef = 200 mm, ATD area AATD = 30,961 mm2;
  • ATD setting 2—the largest ring is closed and two smaller are opened; ATD diameter DATDef = 160 mm, ATD area AATD = 19,745 mm2;
  • ATD setting 3—only the smallest ring is opened; ATD diameter DATD = 100 mm, ATD area AATD = 7631 mm2.

3. Results

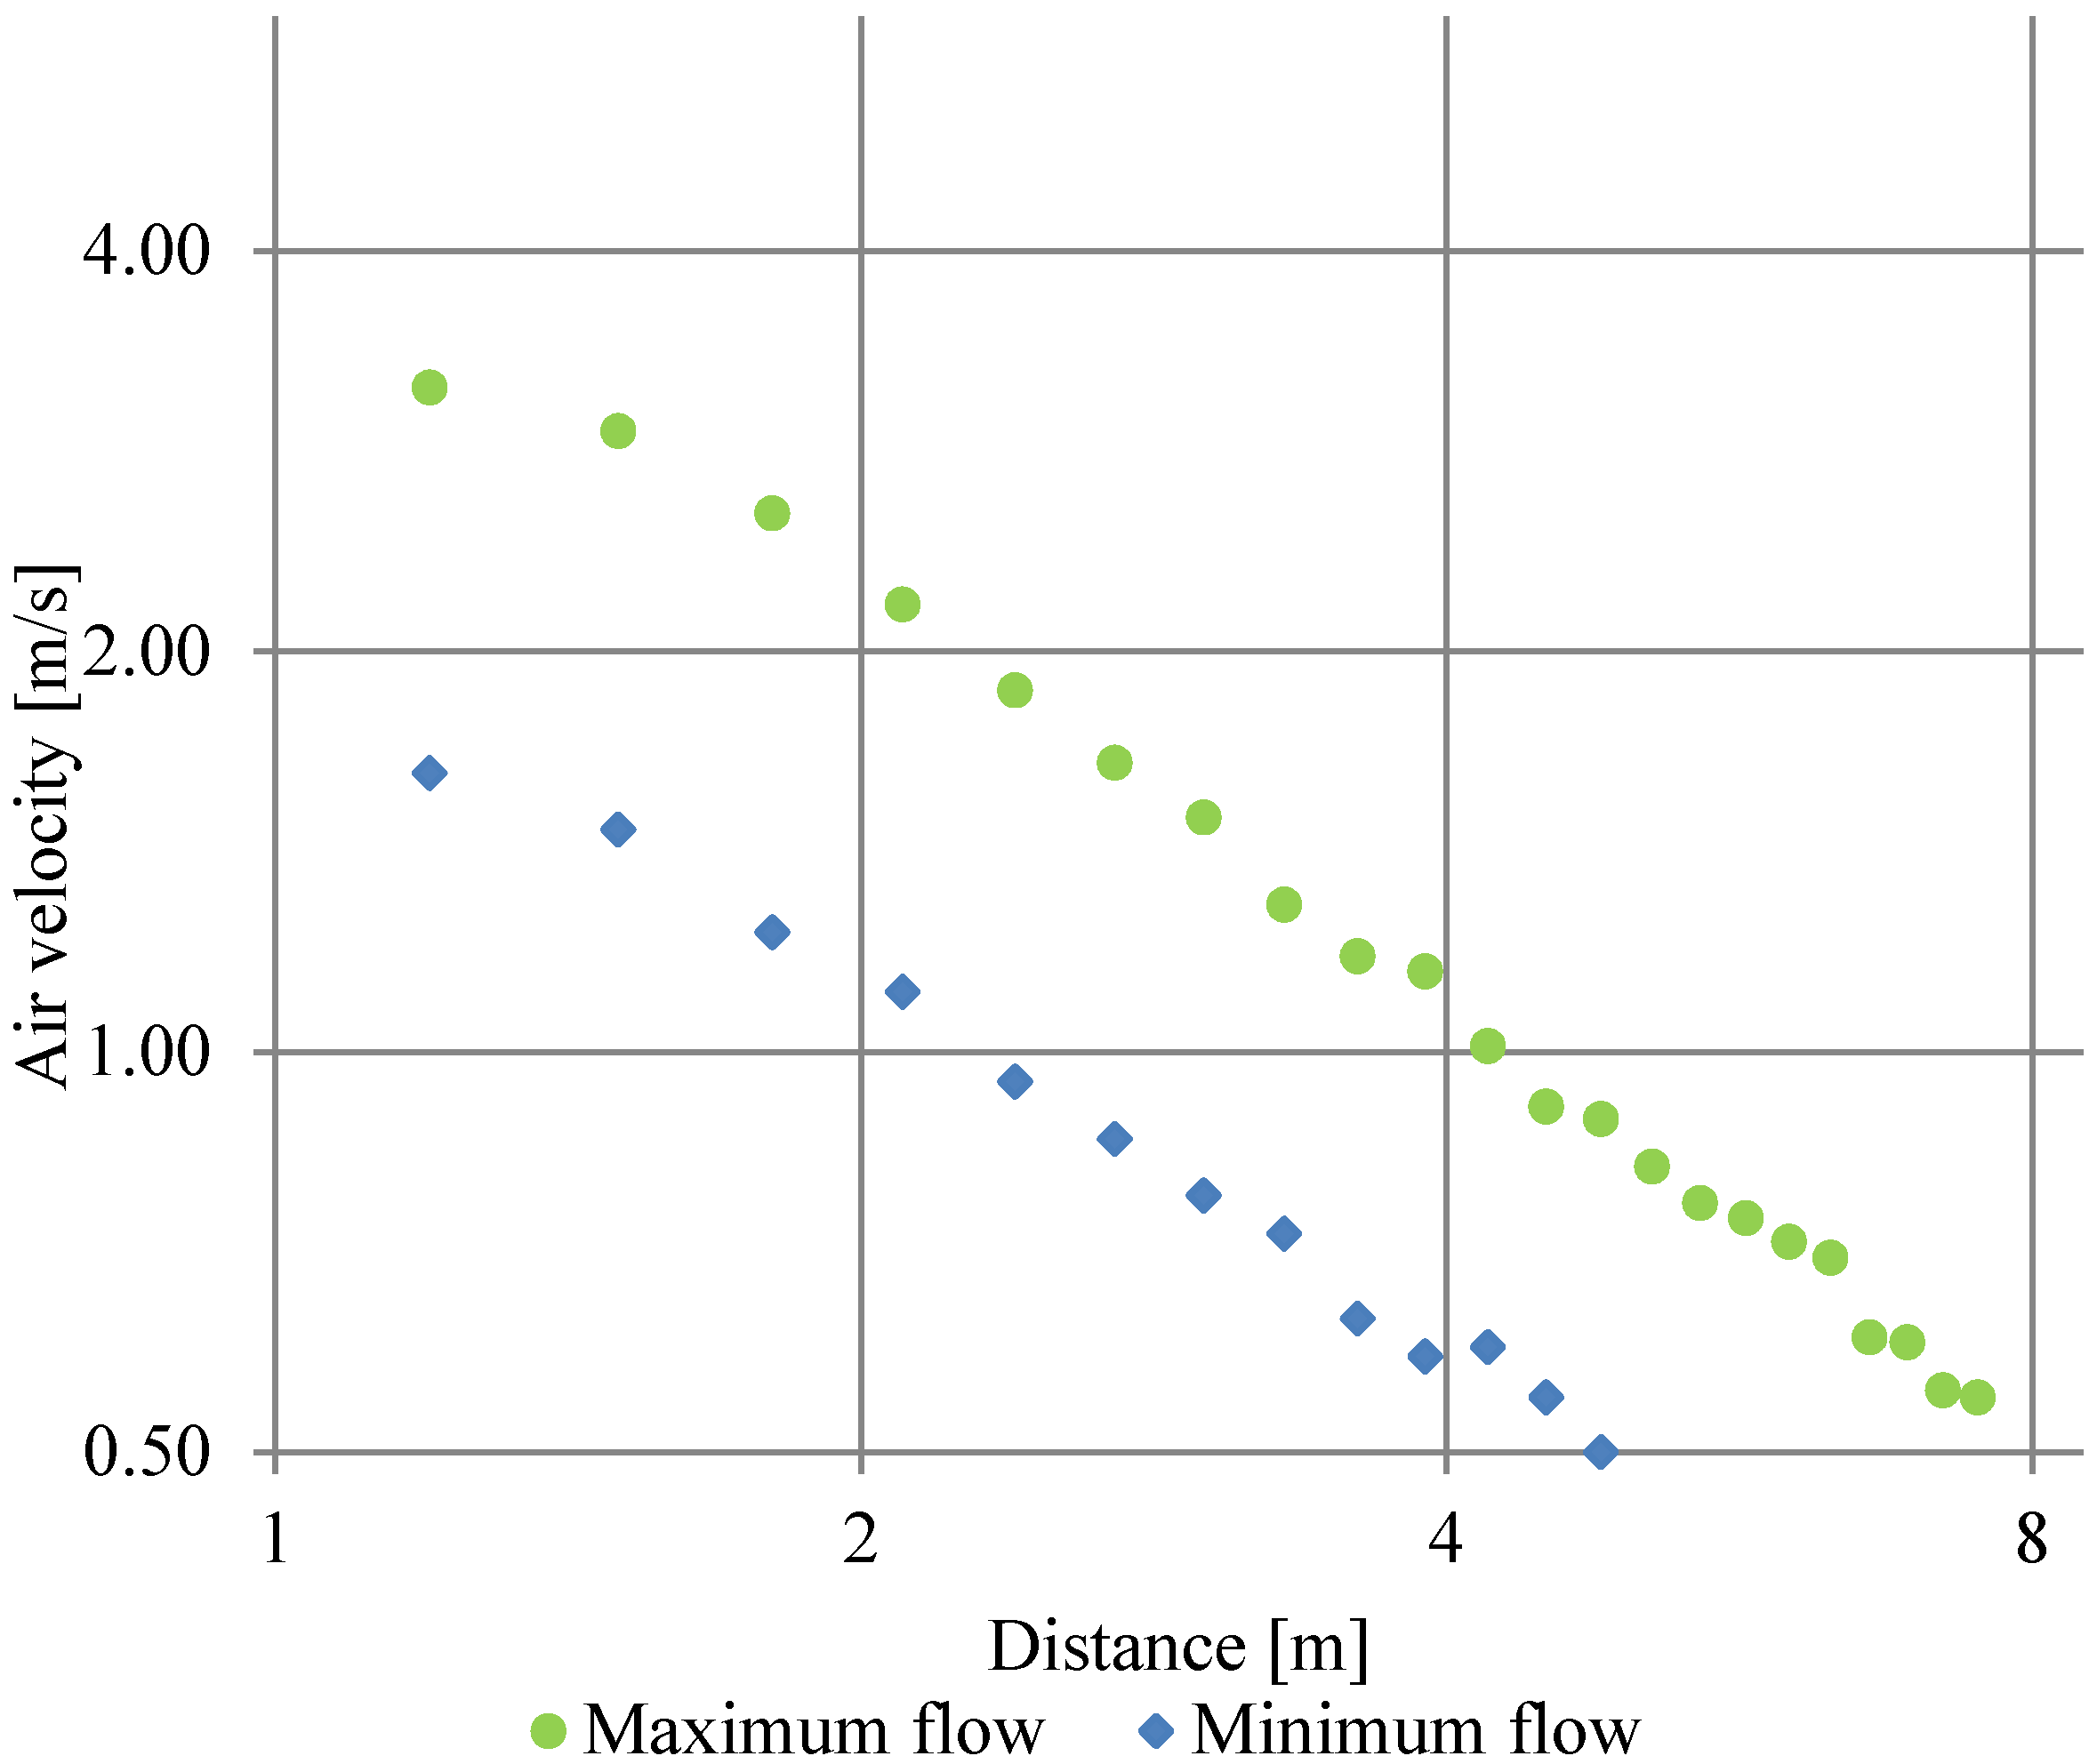
To determine if a change in the construction of the ATD improved the conditions of the VAV system, the first step was to see how the air throw changed without it as a basis for comparison. The device was fixed to setting ATD 1—all three rings opened and diameter DATDef = 200 mm. This ATD setting was chosen as the basis for comparison as it does not use the new elements that interfere with its geometry. This is also shown in Figure 7, which presents the results without a change in the air terminal device geometry but with changing airflow. This shows how the system reacts without a geometry change of the ATD.
First, the maximum airflow was supplied, and the air throw was measured. Afterward, the flow was changed to the minimum without changing the diameter of the ATD. As suspected, when lowering from the maximum (330 m3/h) to the minimum flow (150 m3/h) with the ATD constant setting 1, the throw lowered. It changed from 8 m to around 4.5 m. The results are shown in Figure 7.
To countereffect the lowering of the air throw shown in Figure 7, the ATD with adaptive geometry was used. During the tests with changing geometry, the diameter was altered according to the design shown in Figure 1, Figure 2 and Figure 3. The airflow was changed in steps from the maximum (330 m3/h) to the medium (220 m3/h) and minimum (150 m3/h). While lowering the airflow, the diameter of the air terminal device was also altered from ATD setting 1 to ATD setting 2 and ATD setting 3 for the medium and minimal flow, respectively. The results are shown in Figure 8.
The results and the comparison between the laboratory tests and simulations are shown in Figure 8 where the velocity along the axis is compared for all three cases. This figure clearly proves that, in both the simulations and the measurements, the air throw in the test zone could be evened out by changing the geometry of the ATD. By adapting the air terminal device geometry, it was possible to stabilize the air throw when changing the air supply volume from 330 m3/h to 150 m3/h.
Figure 9 shows how the flow pattern changed in the cross-section of the airflow in the distances from the ATD equal to 0.5 m, 1.5 m, 3 m, and 4.5 m. The figure shows that the geometry of the airflow remained concentrated and slowly dispersed as the flow continued. The case shown in the figure was for the medium velocity and ATD setting 2. It presents the change in dispersion of the airflow within the test area during the simulations.
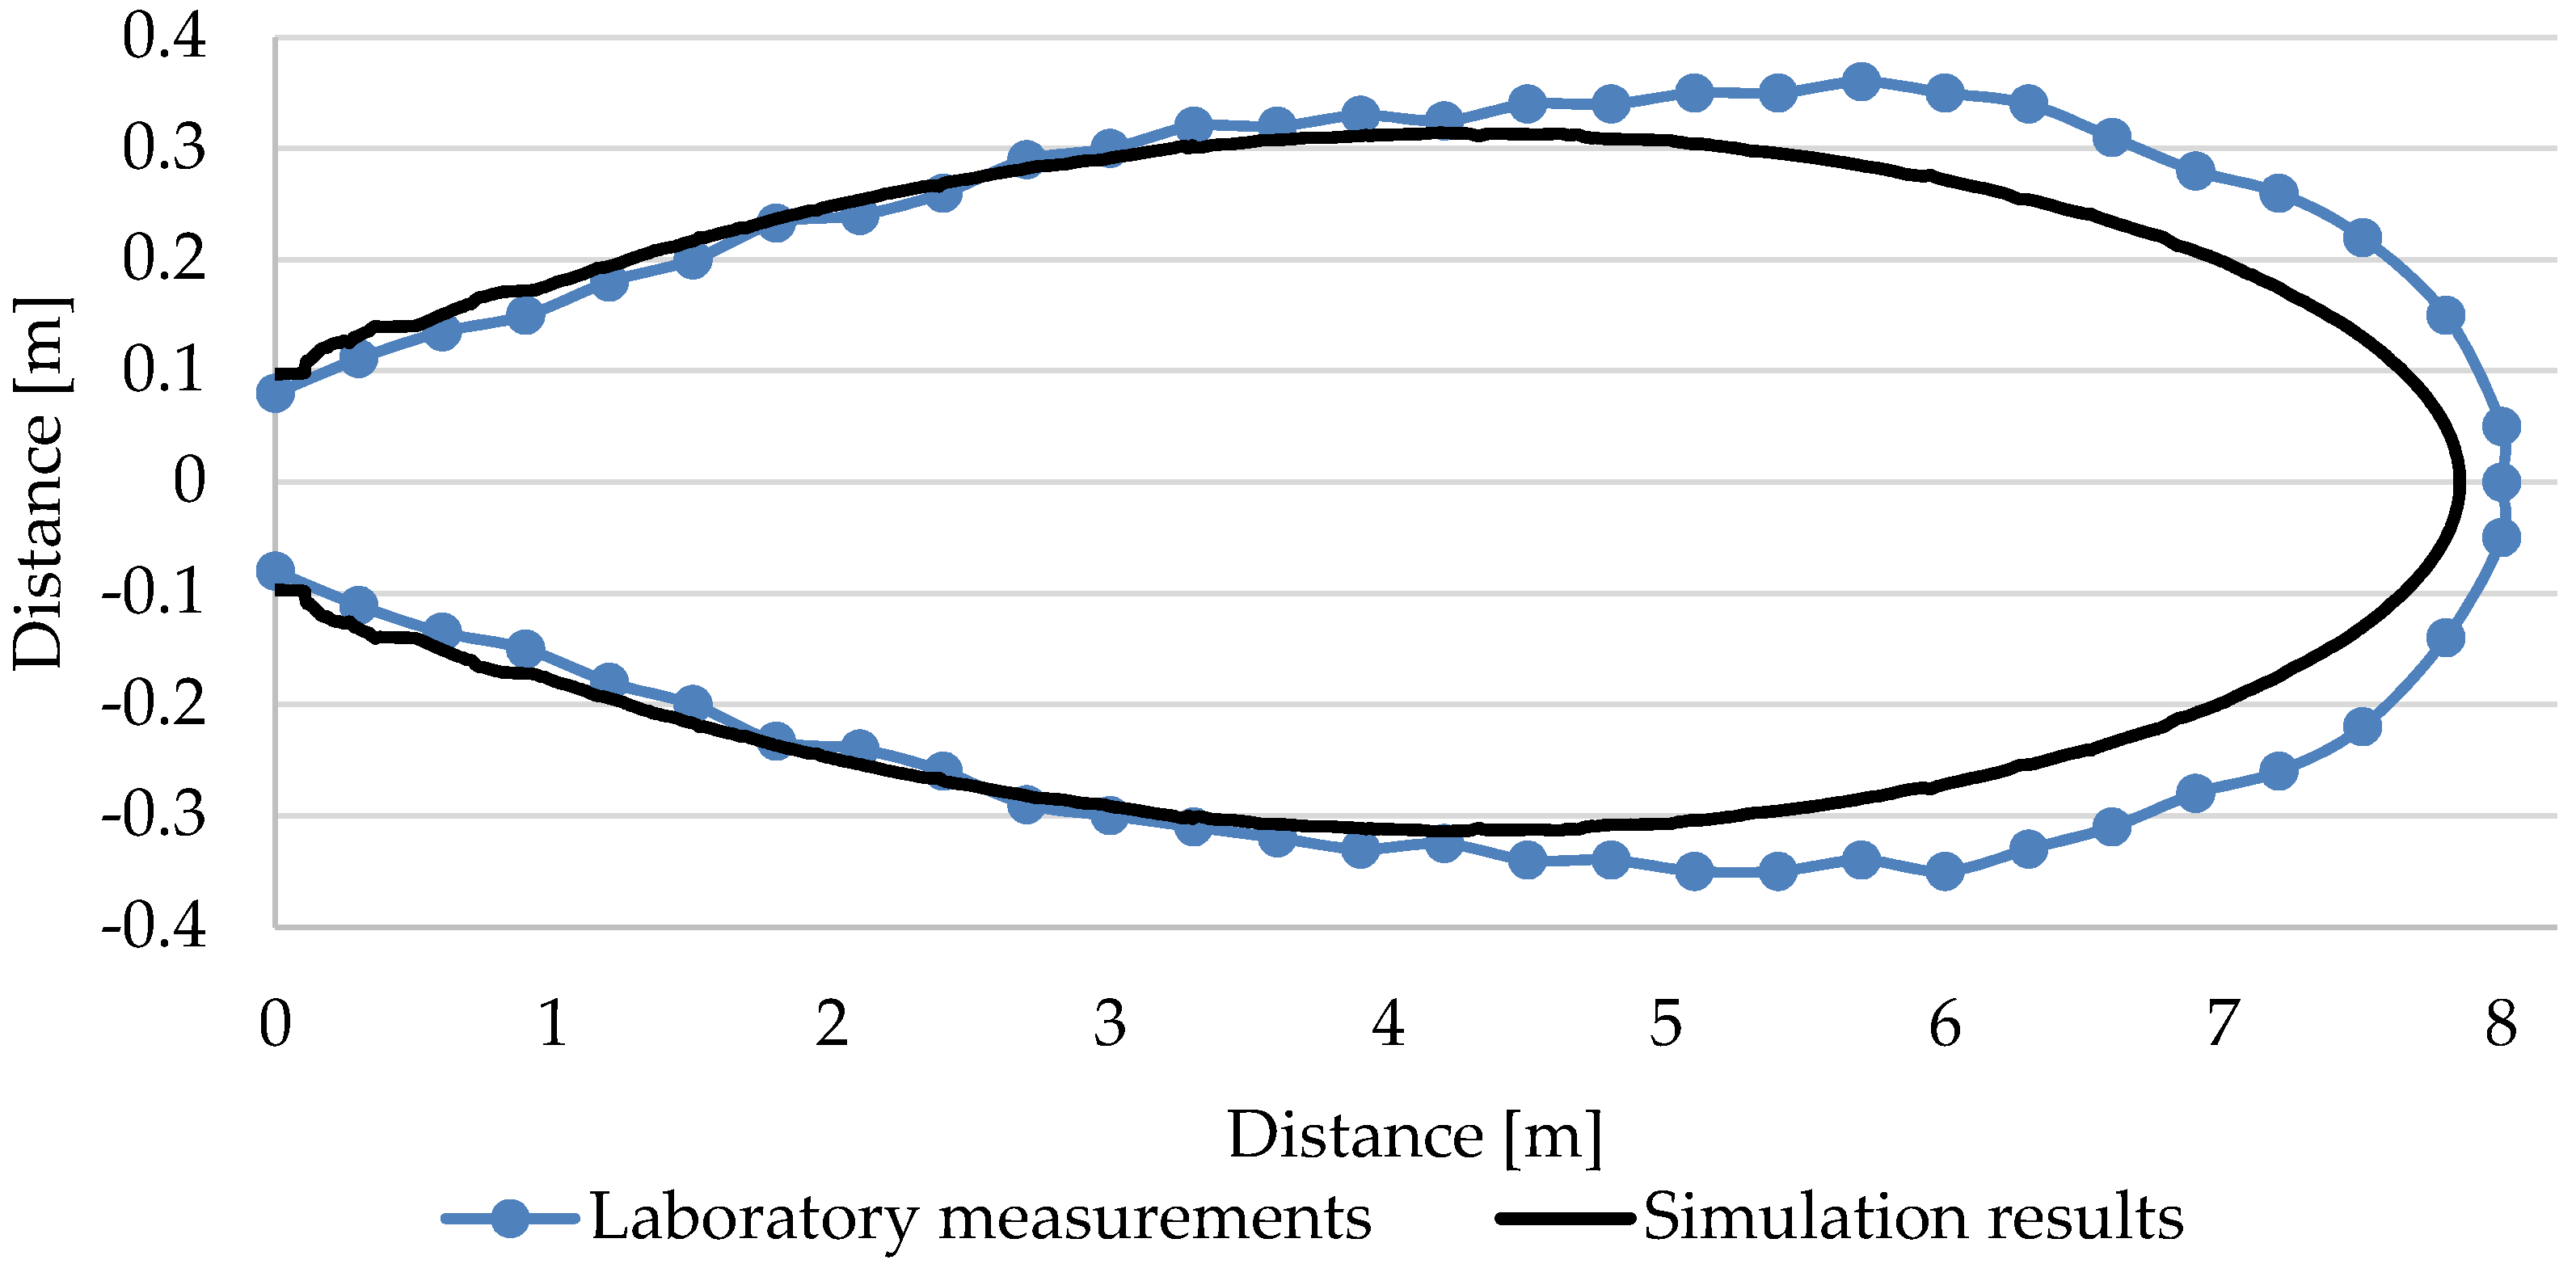
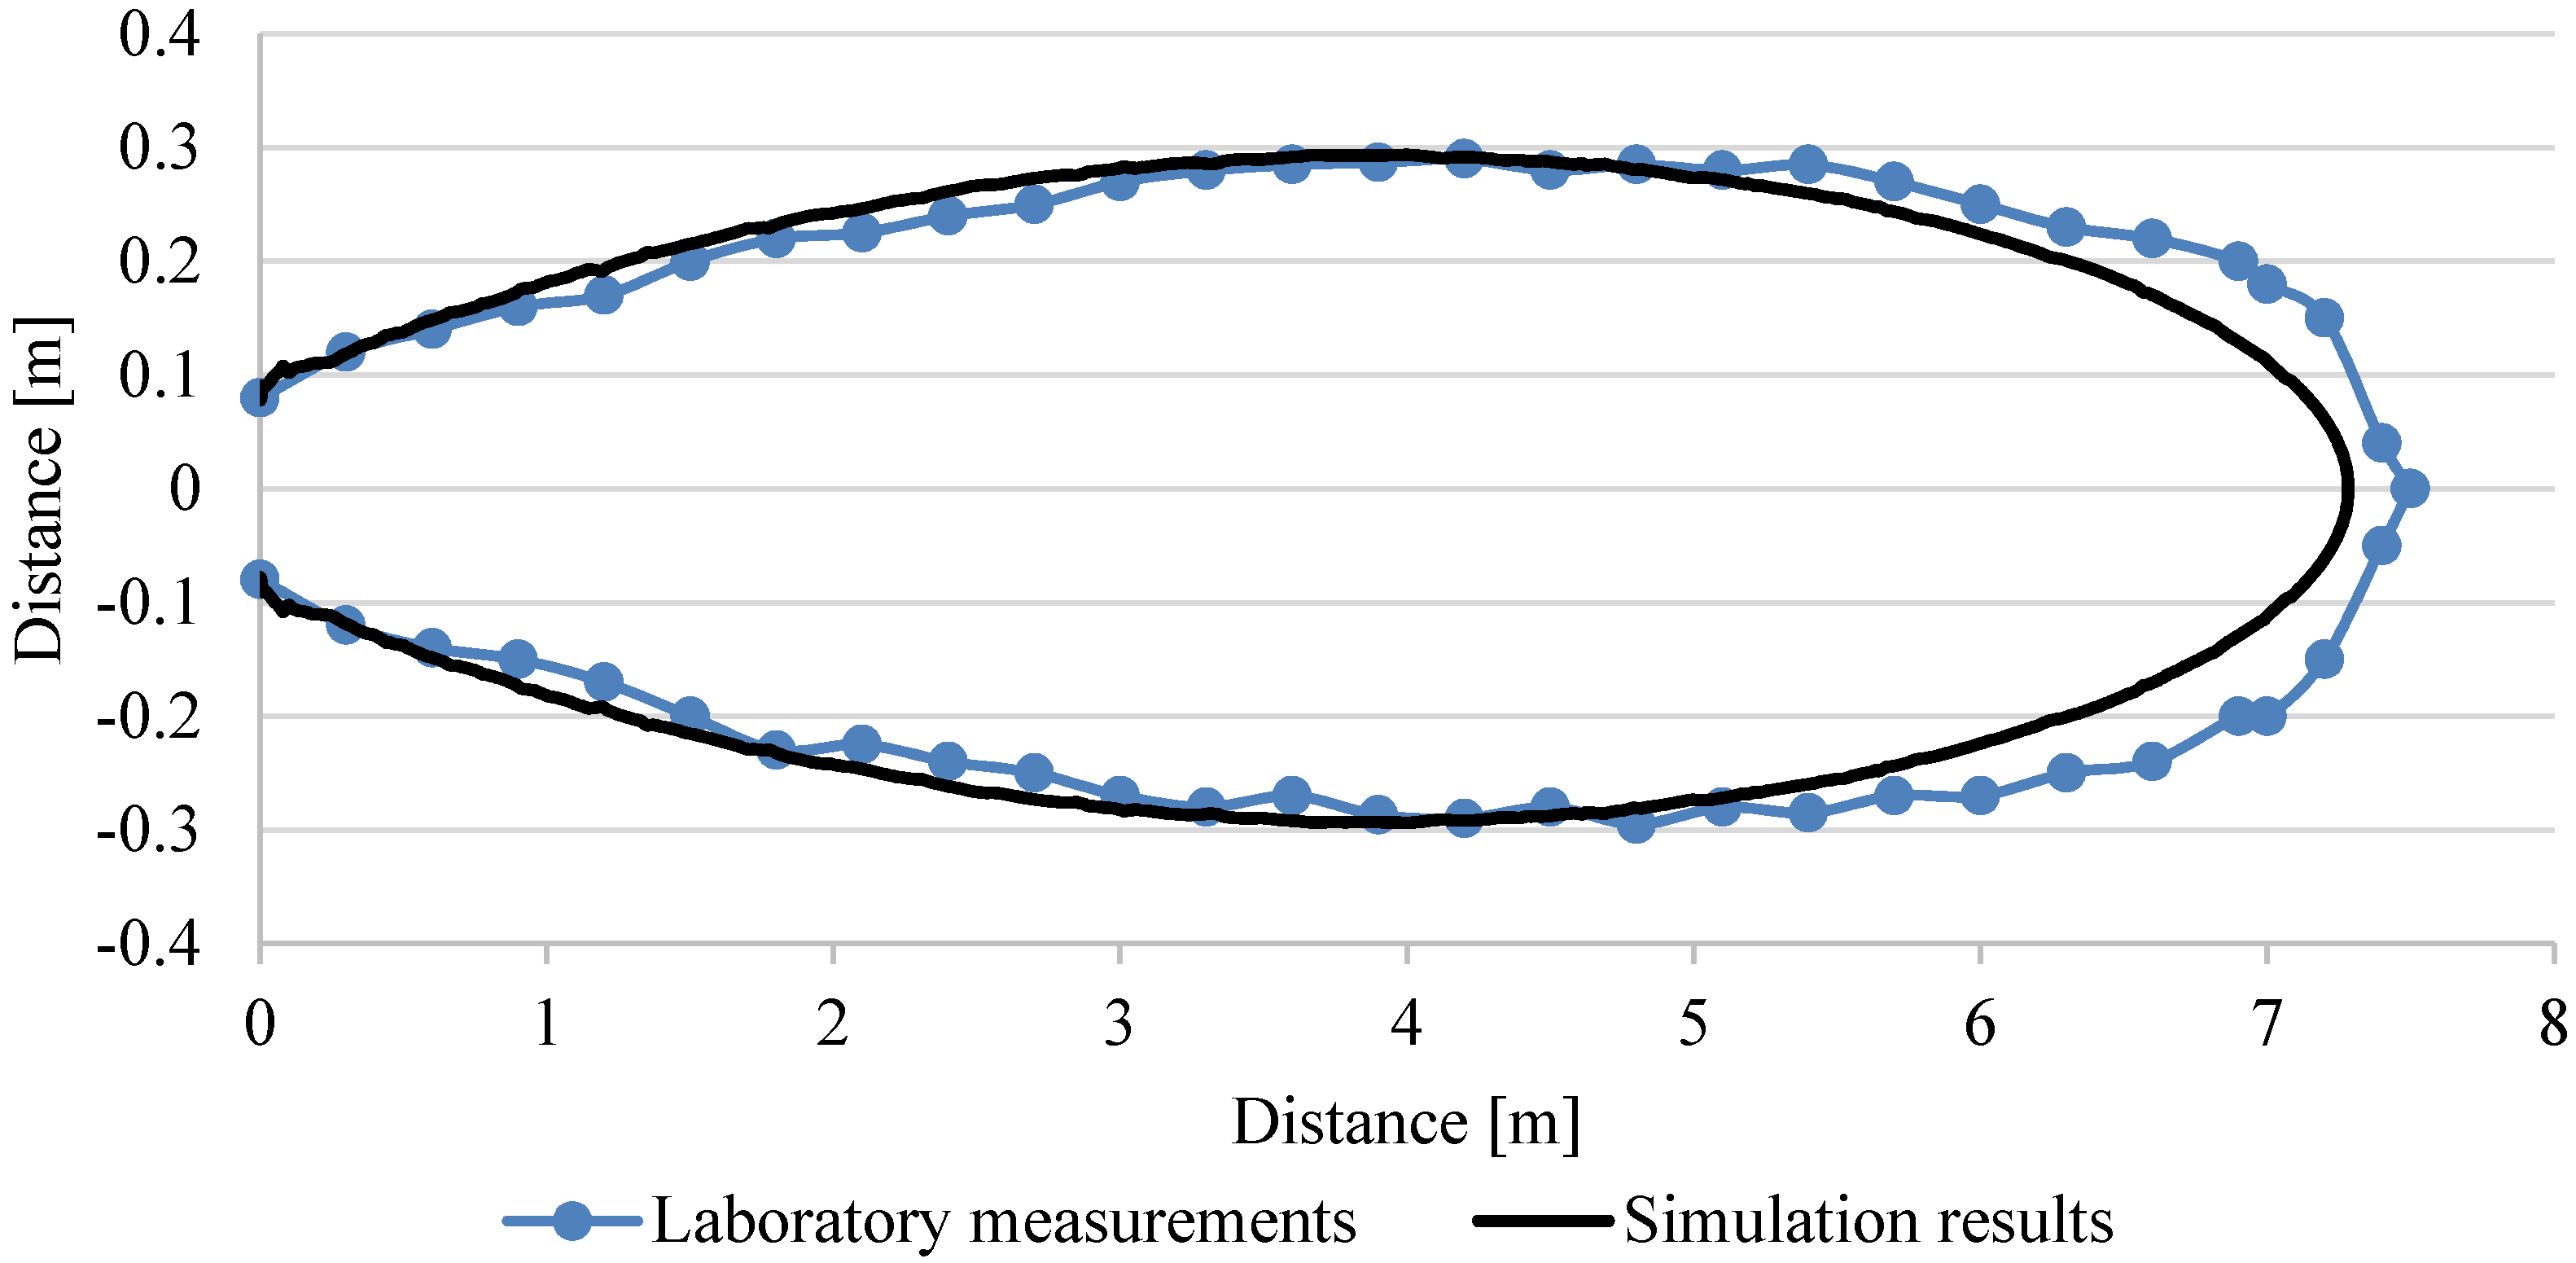
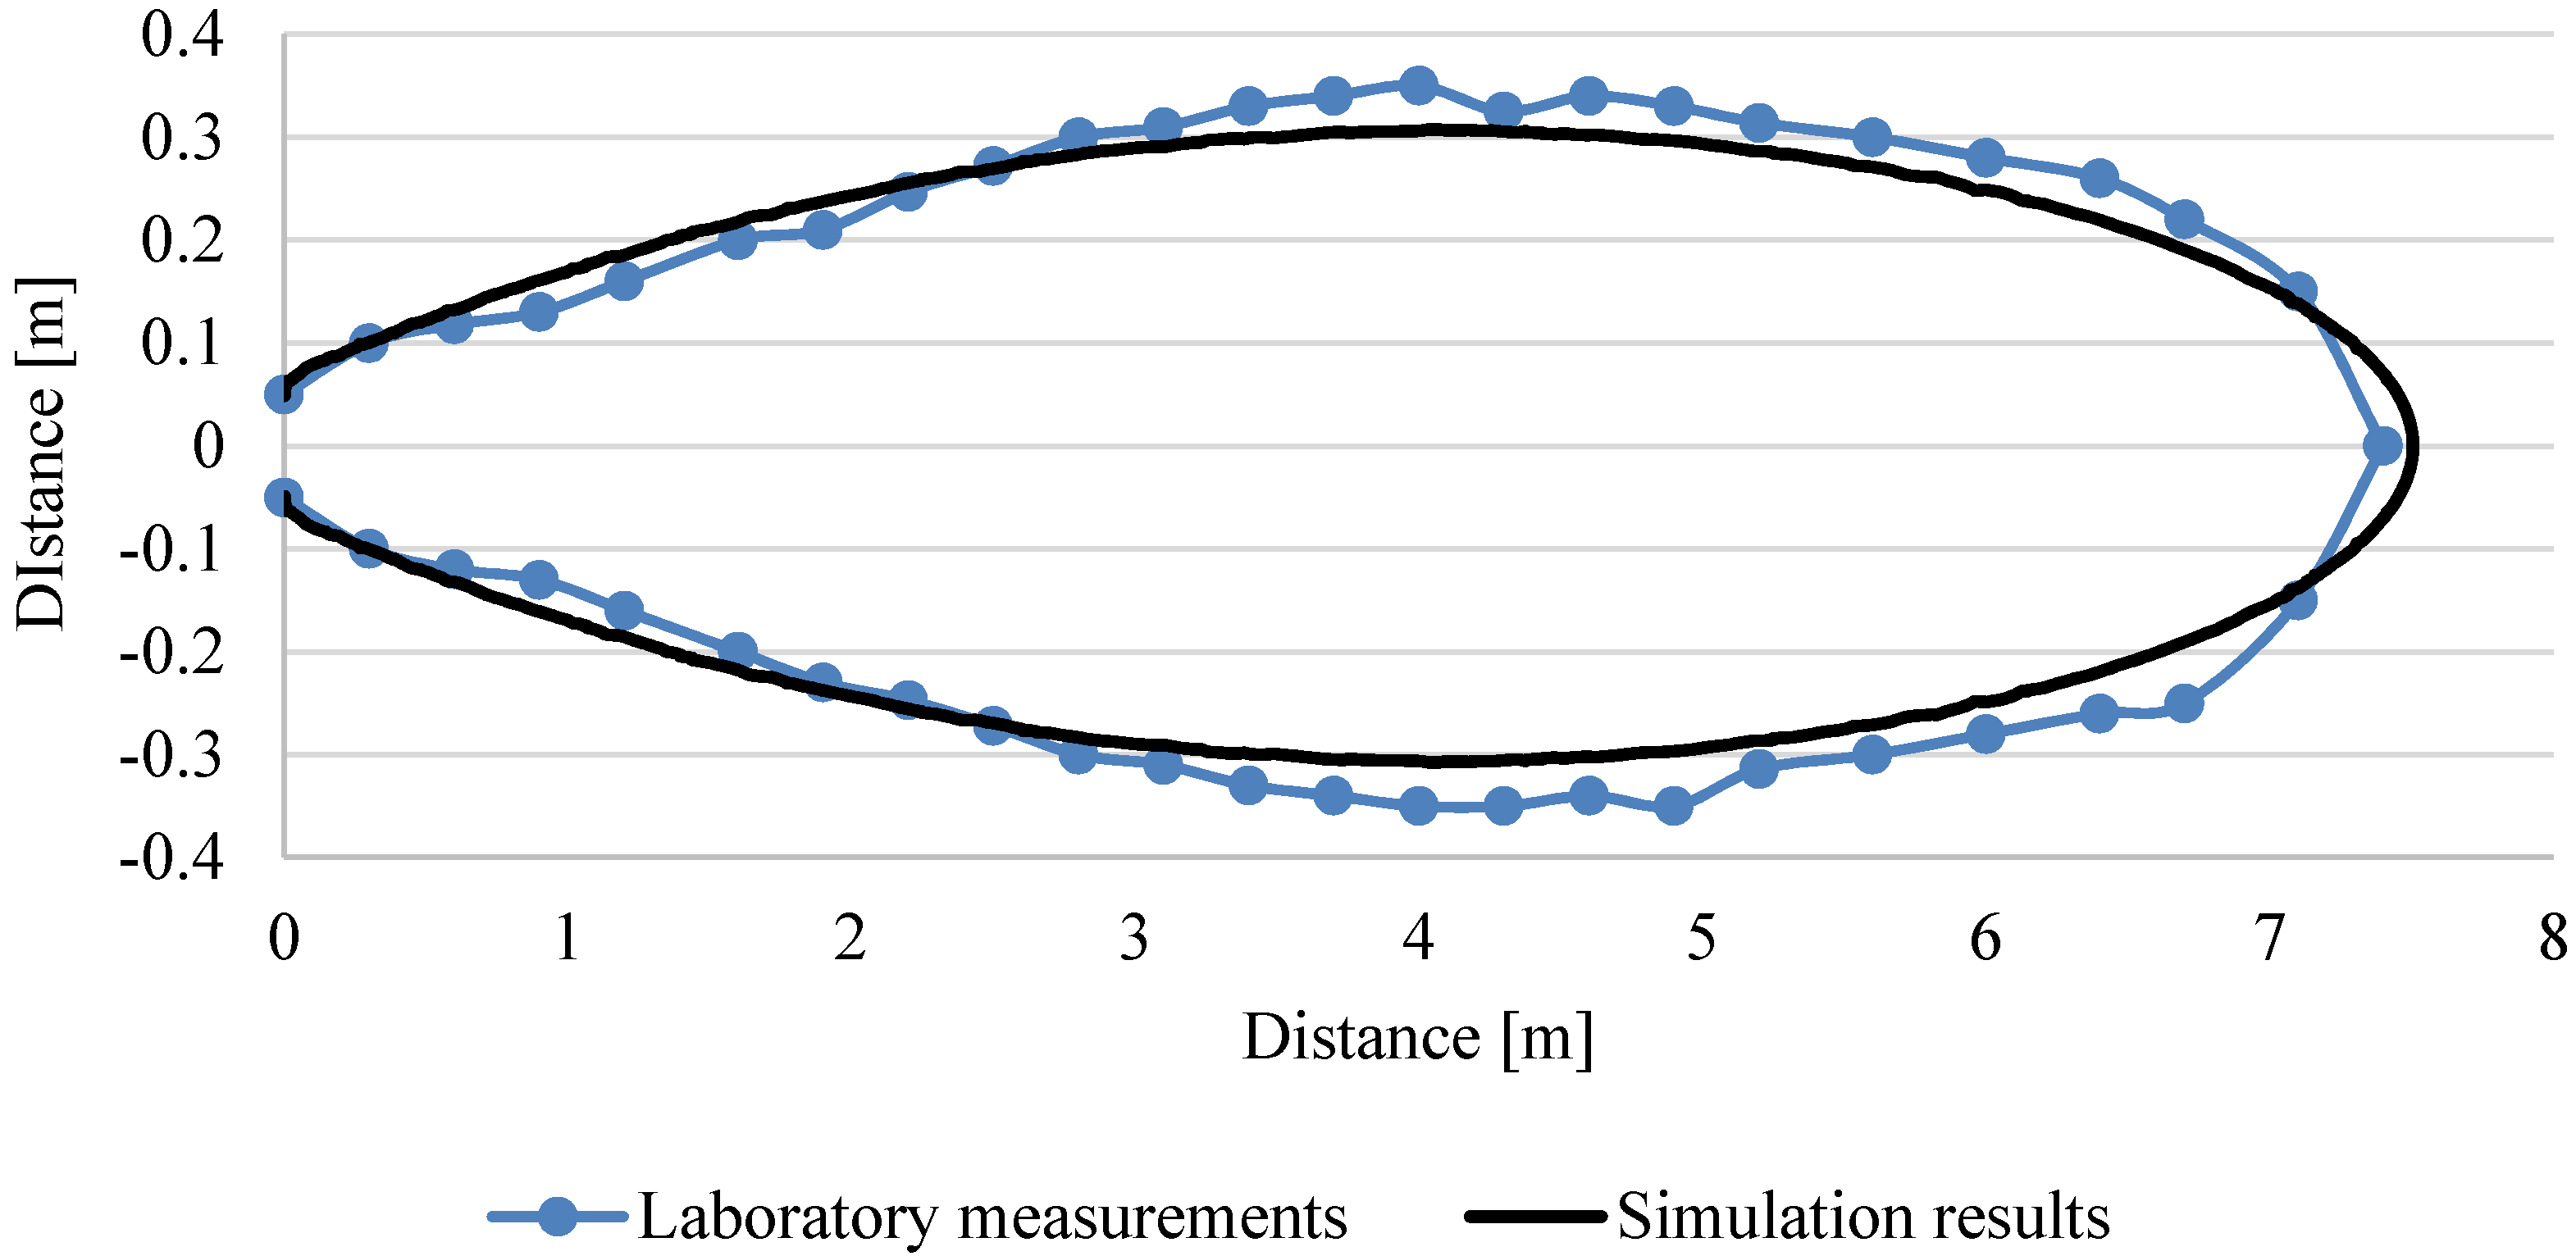
As the main interest of this study was focused on the air throw, another series of tests was conducted to present the air flow spread. This was done to analyze the air throw not only along the axis as in Figure 8, but in the entire test area. The distance from the ATD was measured both horizontally and vertically in the place where the velocity reached 0.5 m/s. Once again, the measurements were done every 30 cm.
The tests were conducted as there are a series of fluid dynamic effects that can influence the flow pattern of the air, especially when its velocity lowers. The most important are [50] the velocity profile, flow pulsations, mechanical effects, and the surrounding atmosphere, including the thermal effects.
In this study, the surrounding atmosphere was not an issue as the test zone was kept in a stable environment and tests were performed under isothermal conditions.
Figure 10, Figure 11 and Figure 12 show the individual cases for each airflow spread comparing the simulation results to the measurements. Point zero on the vertical axis represents the center of the ATD where the air flew into the test room. The thee figures were used to not only compare how the simulations reflected the measurements in the axis of the flow but also to assess how the dispersal of the fresh air into the room would change with the different ATD settings.
The air flow spread was quite concentrated as shown in Figure 10, Figure 11 and Figure 12, and further studies should be taken under consideration to widen the airflow. The standard deviation of the simulations from the measurements was calculated for each air spread and is presented in Figure 13a–c. In this figure, the measured air spread is represented by the continuous line, while the calculated spread is represented by the scattered points. Both the x-axis and the y-axis represent the vertical distance from the axis of the ATD (above or below the axis of the flow). The highest discrepancy between the simulations and the measurements was registered for the maximum airflow. The lowest was registered for the minimum airflow. These results prove the good convergence of the CFD model as more than 75% of the results had a discrepancy lower than 8% [59,60].

Thermal Comfort

While maintaining a steady air throw may be the answer to removing contaminants, it may not be enough to achieve proper thermal comfort conditions. It is essential for potential occupants that comfort is maintained, as it ensures the appropriate quality of the indoor environment [61,62].
There are many thermal comfort models and indices that help to define the thermal comfort, each with its advantages and disadvantages [63]. However, the most advanced indices are the PMV (predicted mean vote) and the PPD (predicted percentage of dissatisfied). The PMV/PPD model was developed by Fanger [64] using heat-balance equations and empirical studies of skin temperature to define comfort. The calculation of the parameters can be found in EN ISO 7730 [18]. The PMV index is used to predict the average values of the votes of a large group of people using a seven-point thermal sensation scale on the basis of the heat balance of the human body [18].
The best case is when the PMV is equal to zero, meaning that the comfort level is neutral, and no one feels uncomfortable. PMV is a function of many environmental factors, including the metabolic rate, effective mechanical power, sensitive heat loss, heat exchange by evaporation on the skin, and air velocity. The detailed equations can be found in in EN ISO 7730 [18]. PPD is a function of PMV and is calculated on its basis.
The thermal conditions provided by the tested ATD were evaluated by conducting a PMV and PPD analysis using the thermal comfort application suitable for ANSYS Fluent v 17. This application allows the adjustment of different parameters including the metabolic rate and clothing resistance value, as well as the conditions for various thermal scenarios. Because the airflow patterns in the simulations were evaluated on the laboratory stand in the previous sections, the application is a valid tool for conducting thermal comfort analysis.
The following parameters were used in all the simulations to represent a situation that could occur in the summer season:
  • Humidity value: 50%,
  • Temperature value: 300 K,
  • Velocity values for PMV and PPD calculation were taken from the solution field,
  • Radiation temperature: 300 K,
  • The following clothes were selected with the ensemble clothing resistance value of 0.43: underwear, 0.03; shirts/blouses, lightweight, long sleeves 0.2; trousers, normal 0.2;
  • The metabolic rate value of 1.2 was chosen for sedentary activity.
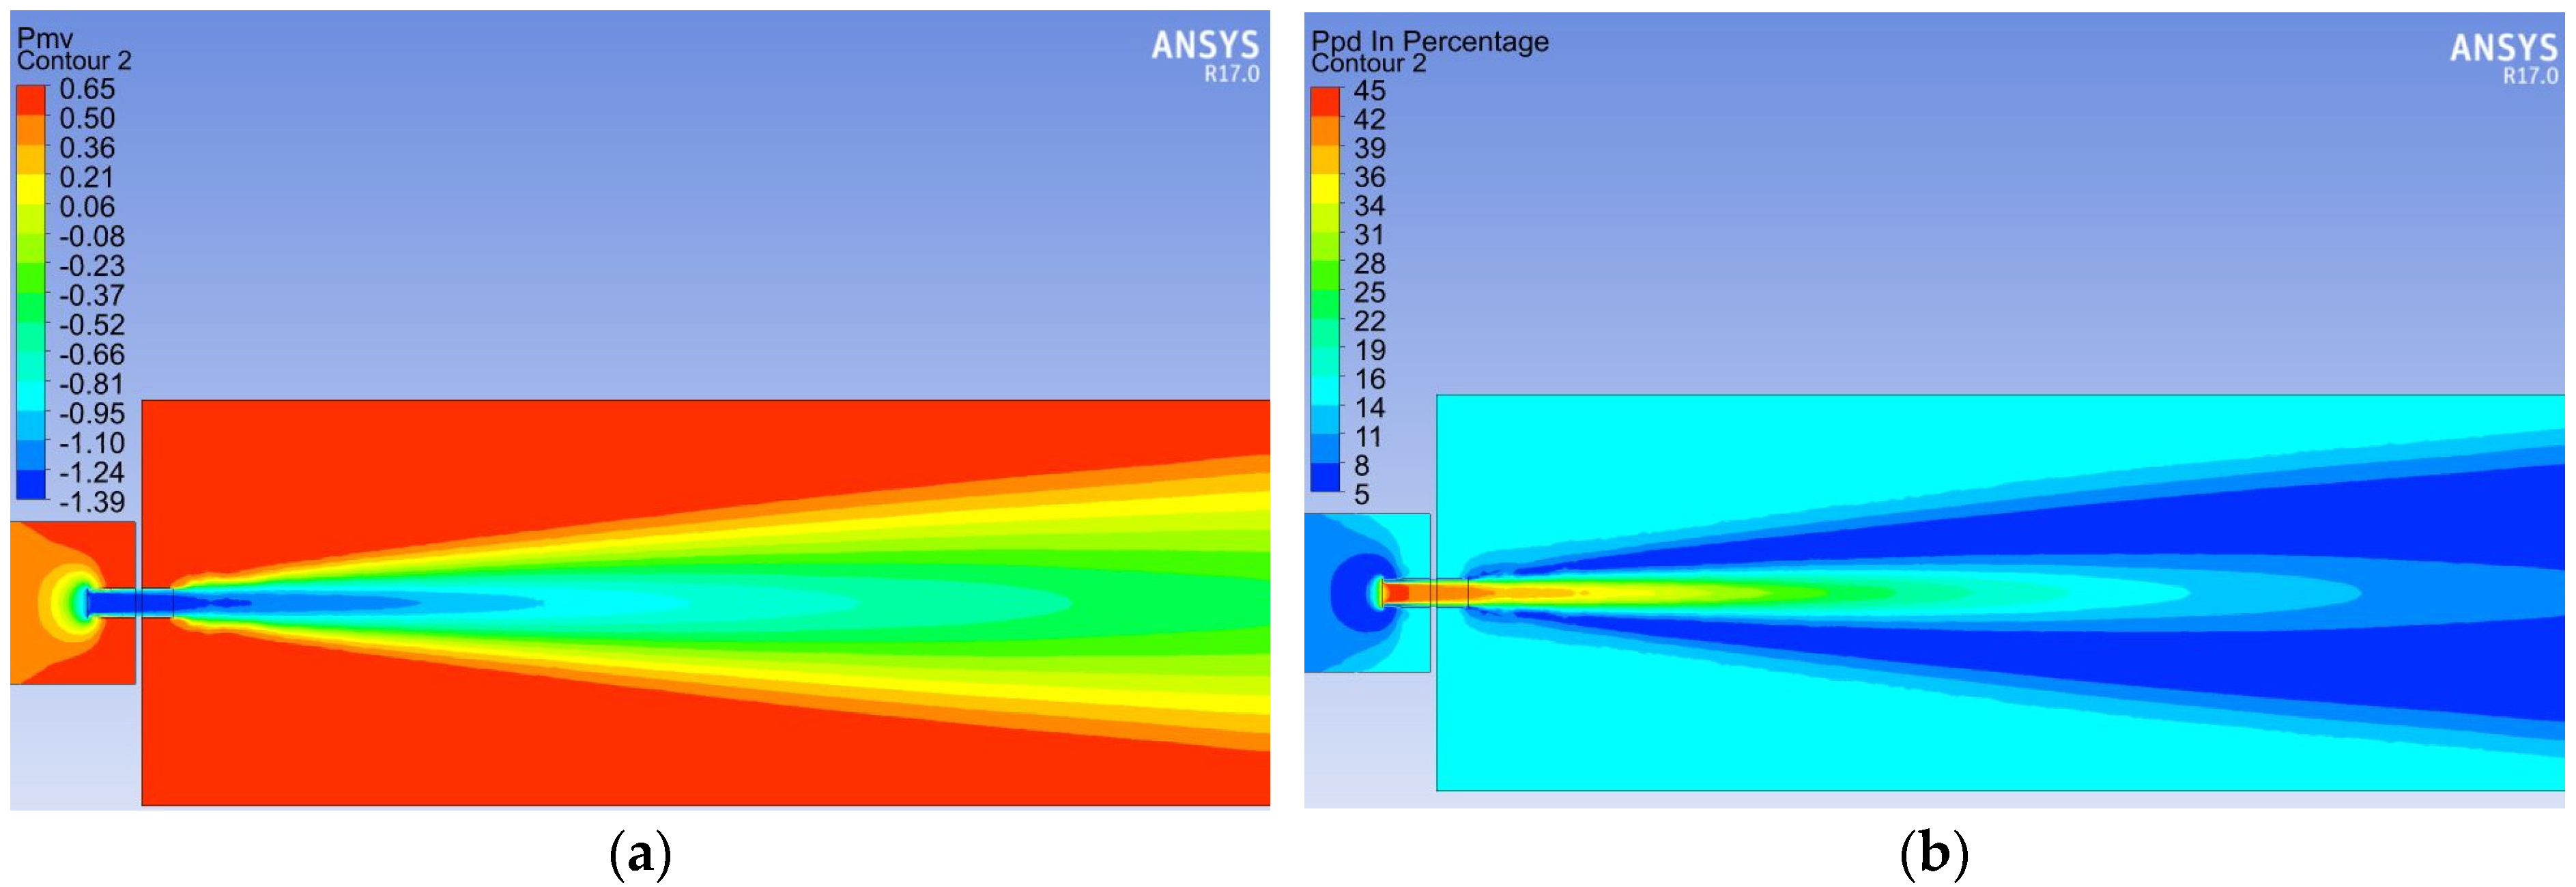
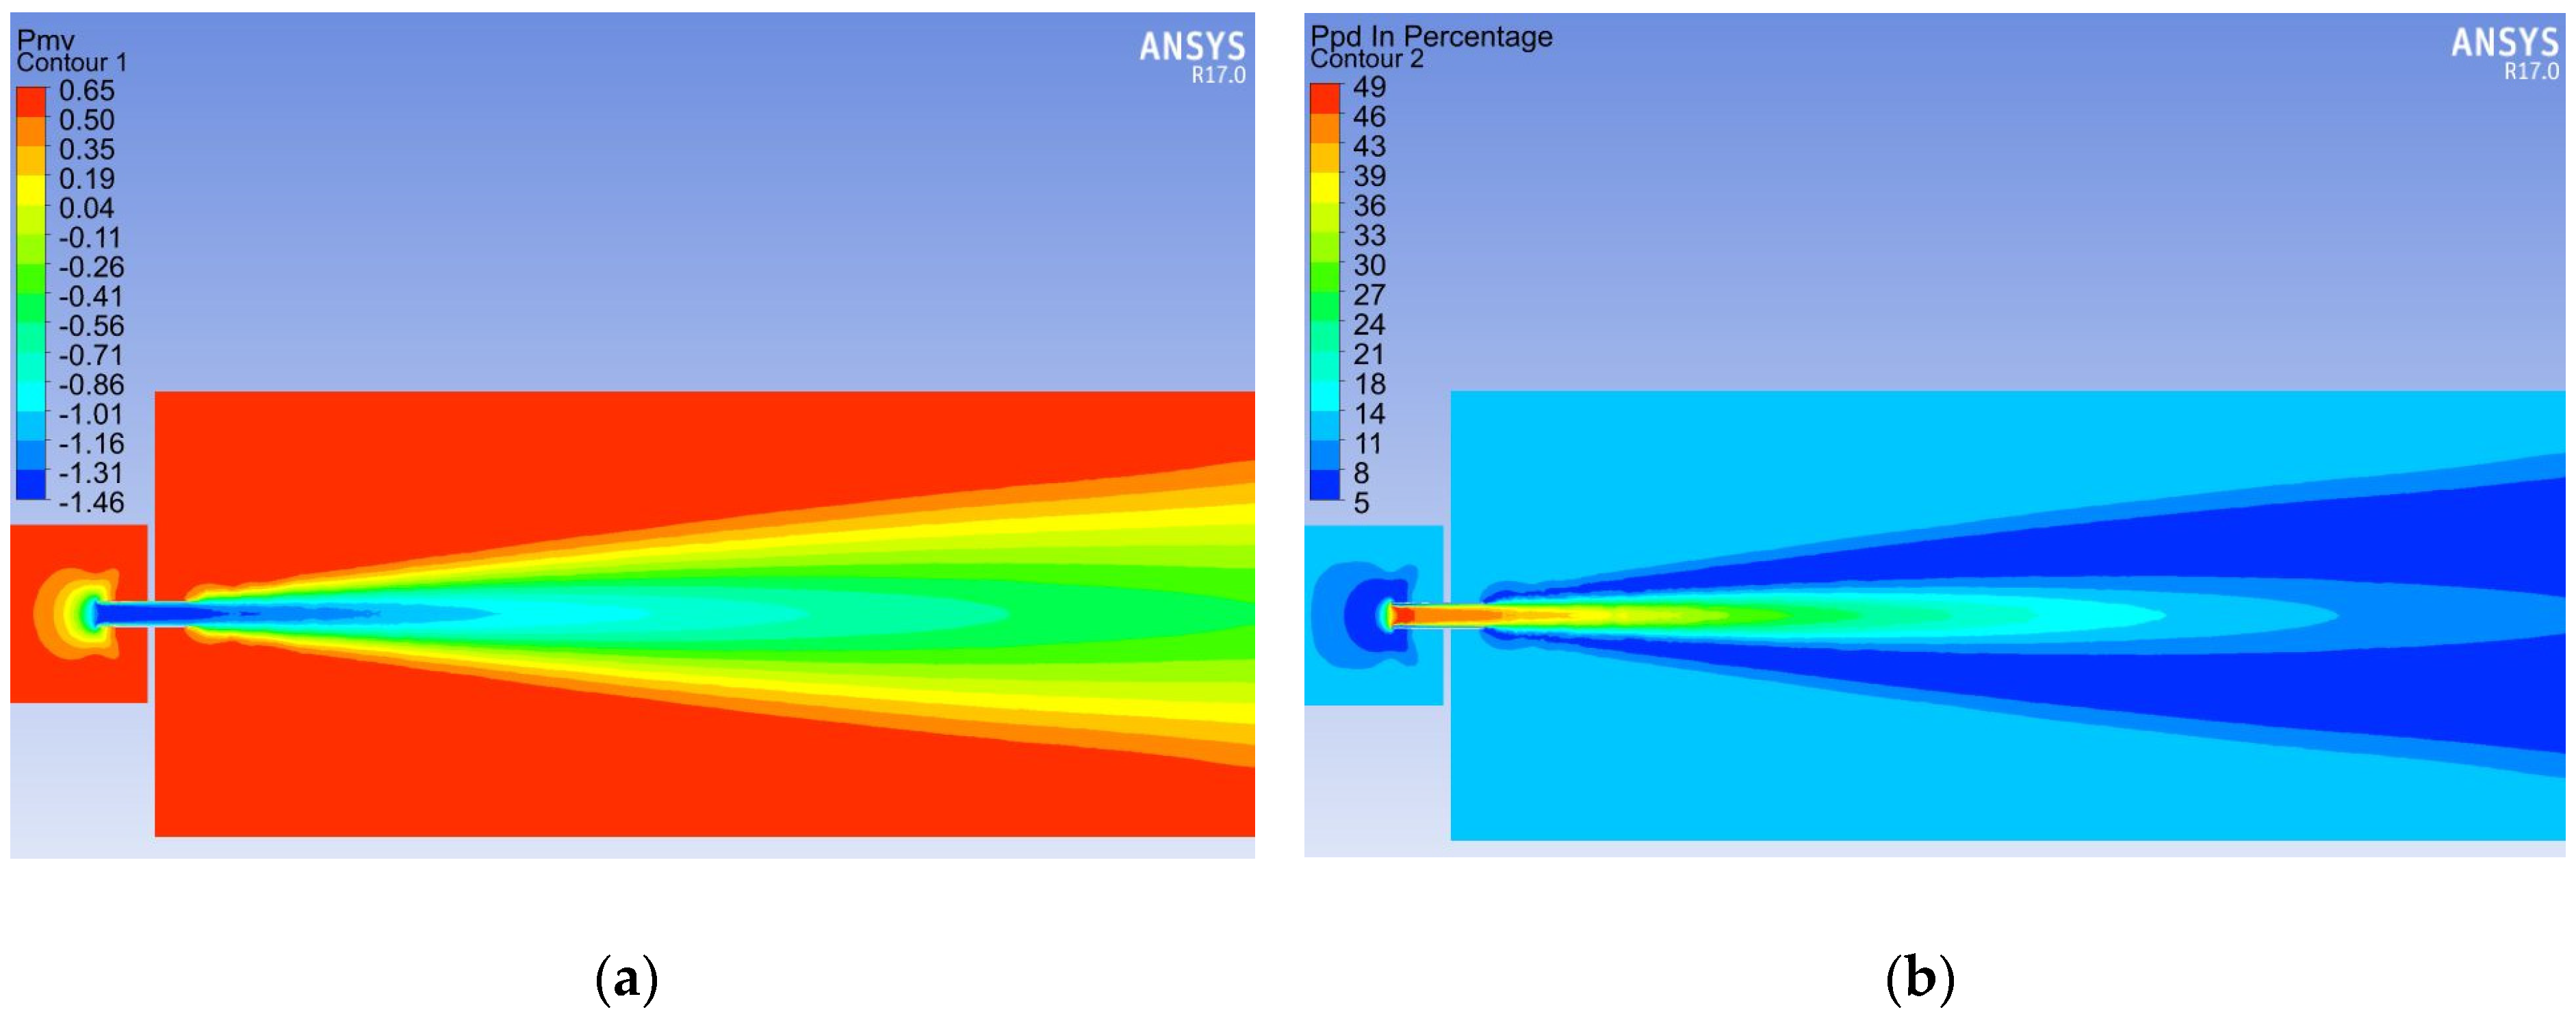
The results for the maximum airflow are shown in Figure 14 and Table 6. The results in the table show that both thermal comfort parameters ranged from complete comfort to major discomfort. PMV and PPD contours presented in Figure 14 show a detailed layout of both parameters. The PMV was equal to −1.4 just as the air flowed out of the air terminal device meaning that the occupants would feel a sense of cold. The zone in which the occupants would have a lack of comfort continued up to 6 m from the ATD. After that length, the area from 6 to 8 m is where the occupants would feel thermal comfort. Similar results were seen in the cases for the other airflow settings. The PPD results show a similar pattern, where, in the first 6 m of the air stream, the occupants would feel a cooling sensation. However, after this area, the occupants would be in a zone of comfort.
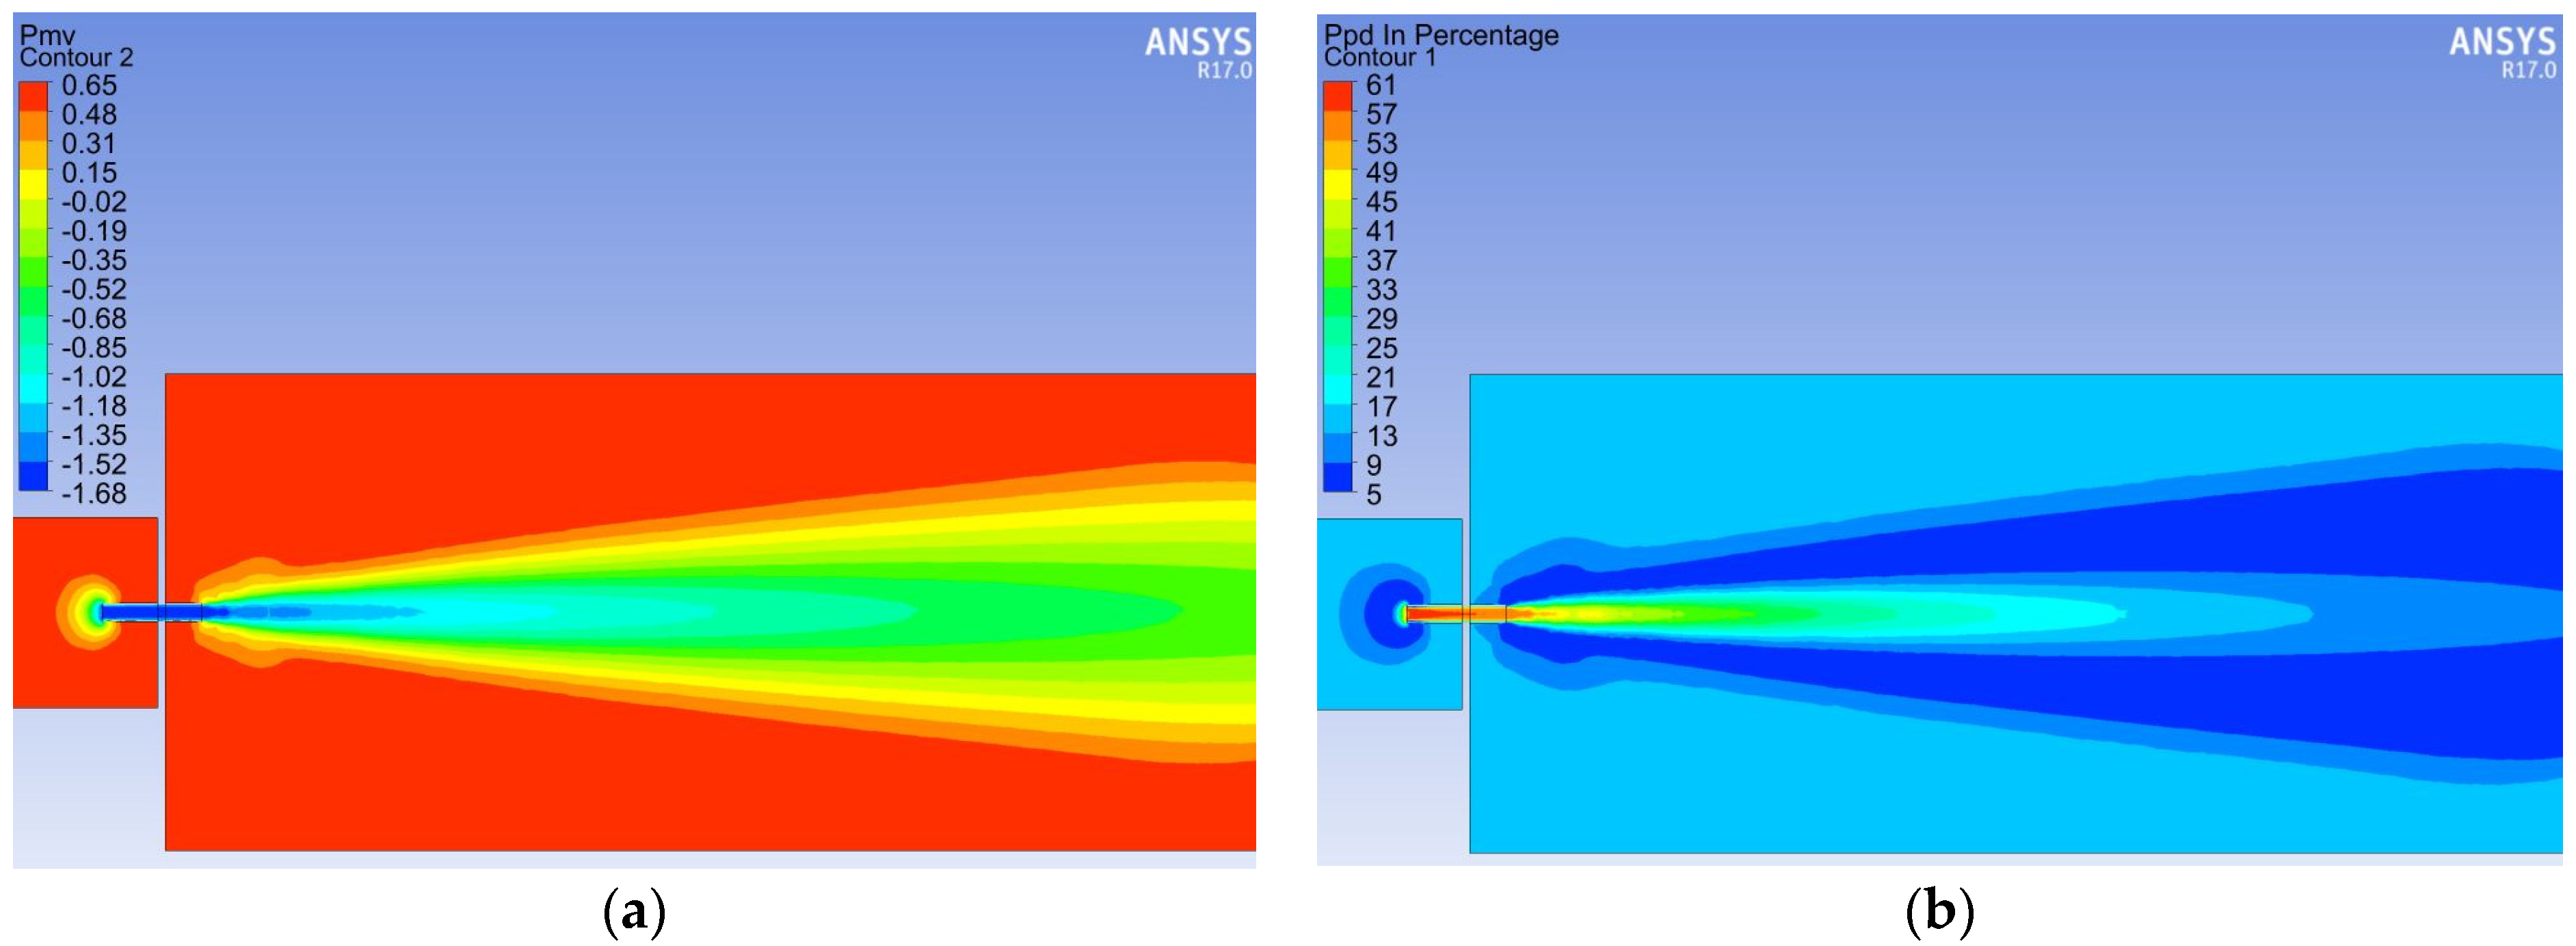
Similar results can be observed for the medium and minimum airflows. The results can be seen in Figure 15 and Figure 16. Table 6 presents the extreme PMV and PPD results in the test zone for all cases (not including the equalizing chamber and ATD).
Considering the PMV and PPD results, while using the ATD, there is a risk of a draught and/or cool sensation close to the element. However, in the area between 6 and 8 m from the ATD, thermal comfort is maintained, and fresh air is sufficiently supplied to that area in all three ATD settings.
The ATD would not be suitable in cases such as a ceiling element for office or residential buildings, in which the floor height is lower than 6 m. It may be applied as a wall-mounted element for installations in large rooms that use mixing ventilation, as well as a ceiling-mounted element for objects such as industrial production halls, which are much taller than a standard building.

4. Conclusions

A new type of ATD with an adaptive geometry was proposed to maintain a steady air throw for VAV ventilation systems. A prototype of the element was built and analyzed through laboratory tests and CFD simulations. The geometry of the device was altered according to the airflow changes in the ventilation system.
CFD simulations and laboratory tests were conducted for three different ATD settings and three different airflows. Both concluded that, with the changing geometry, the air throw was stable despite the flow changing from 330 m3/h to 150 m3/h. Without the change in the geometry of the ATD, air throw lowered from 8 m to under 4 m, meaning that, if occupants were stationed 8 m away from the element, the system would not provide them with fresh air when the conditions changed. With the adaptive air terminal device, it was possible to maintain a steady air throw into the ventilated zone. The air flow spread, however, was quite concentrated, as shown in Figure 10, Figure 11 and Figure 12, and further research should be taken under consideration to widen the airflow. This could be a limitation in the use of the element.
Additionally, thermal comfort conditions were calculated and represented by the PMV and PPD. In each case, thermal comfort was maintained at a distance between 6 m and 8 m. However, in the area closer to the ATD, there was a decrease in comfort and risk of draught, meaning that this prototype should not be used for small spaces or as a ceiling device in office or residential buildings. The presented air terminal device could be used for VAV systems that use wall-mounted elements to distribute air or in large buildings such as production halls that have the average height over 6 m. In these cases, the risk of draught would be eliminated, and the system with the ATD could improve the air quality and maintain the thermal comfort for occupants.
Further studies should be undertaken to eliminate the possibility of draught close to the ATD so that it can be used in a broader spectrum of VAV systems. Additionally, when applying the ATD for different applications, it should be adapted to the conditions in the installation as they may vary from those in this study.

Author Contributions

Conceptualization, N.S.-S. and J.S.; methodology, N.S.-S. and J.S.; software, N.S.-S.; validation, N.S.-S. and J.S.; formal analysis, J.S.; investigation, N.S.-S.; resources, J.S.; data curation, N.S.-S.; writing—original draft preparation, N.S.-S.; writing—review and editing, N.S.-S.; visualization, N.S.-S.; supervision, J.S.; project administration, N.S.-S. All authors have read and agreed to the published version of the manuscript.

Funding

This research received no external funding.

Conflicts of Interest

The authors declare no conflict of interest.

References

  1. Carreira, P.; Costa, A.A.; Mansur, V.; Arsénio, A. Can HVAC really learn from users? A simulation-based study on the effectiveness of voting for comfort and energy use optimization. Sustain. Cities Soc. 2018, 41, 275–285. [Google Scholar] [CrossRef]
  2. Wyon, D.P. The effects of indoor air quality on performance and productivity. Indoor Air 2004, 14 (Suppl. S7), 92–101. [Google Scholar] [CrossRef]
  3. Aparicio-Ruiz, P.; Barbadilla-Martín, E.; Salmerón-Lissén, J.M.; Guadix-Martín, J. Building automation system with adaptive comfort in mixed mode buildings. Sustain. Cities Soc. 2018, 43, 77–85. [Google Scholar] [CrossRef]
  4. Ramos, N.M.M.; Almeida, R.M.S.F.; Simões, M.L.; Pereira, P.F. Knowledge discovery of indoor environment patterns in mild climate countries based on data mining applied to in-situ measurements. Sustain. Cities Soc. 2017, 30, 37–48. [Google Scholar] [CrossRef]
  5. Okochi, G.S.; Yao, Y. A review of recent developments and technological advancements of variable-air-volume (VAV) air-conditioning systems. Renew. Sustain. Energy Rev. 2016, 59, 784–817. [Google Scholar] [CrossRef]
  6. Zhao, T.; Hua, P.; Dai, W.; Zhang, J.; Ma, L. An optimal control method for discrete variable outdoor air volume setpoint determination in variable air volume systems. Build. Environ. 2020, 167, 106444. [Google Scholar] [CrossRef]
  7. Ben-David, T.; Rackes, A.; Lo, L.J.; Wen, J.; Waring, M.S. Optimizing ventilation: Theoretical study on increasing rates in offices to maximize occupant productivity with constrained additional energy use. Build. Environ. 2019, 166, 106314. [Google Scholar] [CrossRef]
  8. Anand, P.; Sekhar, C.; Cheong, D.; Santamouris, M.; Kondepudi, S. Occupancy-based zone-level VAV system control implications of thermal comfort, ventilation, indoor air quality and building energy efficiency. Energy Build. 2019, 204, 109473. [Google Scholar] [CrossRef]
  9. Brooks, J.; Goyal, S.; Subramany, R.; Lin, Y.; Liao, C.; Middelkoop, T.; Ingley, H.; Arpan, L.; Barooah, P. Experimental evaluation of occupancy-based energy-efficient climate control of VAV terminal units. Sci. Technol. Built Environ. 2015, 21, 469–480. [Google Scholar] [CrossRef]
  10. Kim, D.; Cox, S.J.; Cho, H.; Im, P. Evaluation of energy savings potential of variable refrigerant flow (VRF) from variable air volume (VAV) in the U.S. climate locations. Energy Rep. 2017, 3, 85–93. [Google Scholar] [CrossRef]
  11. Kim, H.; Cho, Y. A study on the Determination of Minimum Airflow setpoint of Single Duct VAV Terminal Units. In Proceedings of the IBPSA Asia Conference—ASimo2014, Nagoya, Japan, 2014; pp. 894–899. [Google Scholar]
  12. Kim, H.; Cho, Y.H. Development of a terminal control system with variable minimum airflow rate. Energies 2012, 5, 4643–4664. [Google Scholar] [CrossRef]
  13. Kang, S.-H.H.; Kim, H.-J.J.; Cho, Y.-H.H. A study on the control method of single duct VAV terminal unit through the determination of proper minimum air flow. Energy Build. 2014, 69, 464–472. [Google Scholar] [CrossRef]
  14. Kaam, S.; Raftery, P.; Cheng, H.; Paliaga, G. Time-averaged ventilation for optimized control of variable-air-volume systems. Energy Build. 2017, 139, 465–475. [Google Scholar] [CrossRef] [Green Version]
  15. Cho, Y.-H.; Liu, M. Minimum airflow reset of single duct VAV terminal boxes. Build. Environ. 2009, 44, 1876–1885. [Google Scholar] [CrossRef]
  16. Energy Design Resources, Advanced Variable Air Volume Vav System Design Guide. Available online: https://energydesignresources.com/ (accessed on 14 October 2018).
  17. EN 15251. Indoor Environmental Input Parameters for Design and Assessment of Energy Performance of Buildings Addressing Indoor Air Quality, Thermal Environment, Lighting and Acoustics; European Committee for Standardization: Brussels, Belgium, 2012. [Google Scholar]
  18. EN ISO 7730. Ergonomics of the Thermal Environment—Analytical Determination and Interpretation of Thermal Comfort Using Calculation of the PMV and PPD Indices and Local Thermal Comfort Criteria. 2005. Available online: https://www.iso.org/standard/39155.html (accessed on 5 August 2020).
  19. Taylor, S.T.; Persily, A.K.; Burge, H.; Daynard, R.; Fanger, P.O.; Fickes, E.A.; Fisher, F.J.; Gallo, F.M.; Halliwell, J.L.; Hart, K.Q.; et al. Ventilation for Acceptable Indoor Air Quality. 1999. Available online: https://www.ce.utexas.edu/prof/Novoselac/classes/ARE389H/Handouts/Std62-2001.pdf (accessed on 5 August 2020).
  20. Shin, M.S.; Rhee, K.N.; Lee, E.T.; Jung, G.J. Performance evaluation of CO2-based ventilation control to reduce CO2 concentration and condensation risk in residential buildings. Build. Environ. 2018, 142, 451–463. [Google Scholar] [CrossRef]
  21. Heracleous, C.; Michael, A. Experimental assessment of the impact of natural ventilation on indoor air quality and thermal comfort conditions of educational buildings in the Eastern Mediterranean region during the heating period. J. Build. Eng. 2019, 26, 100917. [Google Scholar] [CrossRef]
  22. Majd, E.; McCormack, M.; Davis, M.; Curriero, F.; Berman, J.; Connolly, F.; Leaf, P.; Rule, A.; Green, T.; Clemons-Erby, D.; et al. Indoor air quality in inner-city schools and its associations with building characteristics and environmental factors. Environ. Res. 2019, 170, 83–91. [Google Scholar] [CrossRef]
  23. Militello-Hourigan, R.E.; Miller, S.L. The impacts of cooking and an assessment of indoor air quality in Colorado passive and tightly constructed homes. Build. Environ. 2018, 144, 573–582. [Google Scholar] [CrossRef] [Green Version]
  24. Langer, S.; Bekö, G.; Bloom, E.; Widheden, A.; Ekberg, L. Indoor air quality in passive and conventional new houses in Sweden. Build. Environ. 2015, 93, 92–100. [Google Scholar] [CrossRef]
  25. Alves, C.A.; Calvo, A.I.; Castro, A.; Fraile, R.; Evtyugina, M.; Bate-Epey, E.F. Indoor air quality in two university sports facilities. Aerosol Air Qual. Res. 2013, 13, 1723–1730. [Google Scholar] [CrossRef] [Green Version]
  26. Kisilewicz, T.; Dudzińska, A. Summer overheating of a passive sports hall building. Arch. Civ. Mech. Eng. 2015, 15, 1193–1201. [Google Scholar] [CrossRef]
  27. Wargocki, P.; Porras-Salazar, J.A.; Contreras-Espinoza, S. The relationship between classroom temperature and children’s performance in school. Build. Environ. 2019, 157, 197–204. [Google Scholar] [CrossRef]
  28. Stabile, L.; Buonanno, G.; Frattolillo, A.; Dell’Isola, M. The effect of the ventilation retrofit in a school on CO2, airborne particles, and energy consumptions. Build. Environ. 2019, 156, 1–11. [Google Scholar] [CrossRef]
  29. Deng, S.; Lau, J. Seasonal variations of indoor air quality and thermal conditions and their correlations in 220 classrooms in the Midwestern United States. Build. Environ. 2019, 157, 79–88. [Google Scholar] [CrossRef]
  30. Liu, J.; Yang, X.; Jiang, Q.; Qiu, J.; Liu, Y. Occupants’ thermal comfort and perceived air quality in natural ventilated classrooms during cold days. Build. Environ. 2019, 158, 73–82. [Google Scholar] [CrossRef]
  31. Gładyszewska-Fiedoruk, K. Analysis of stack ventilation system effectiveness in an average kindergarten in north-eastern Poland. Energy Build. 2011, 43, 2488–2493. [Google Scholar] [CrossRef]
  32. Che, W.W.; Tso, C.Y.; Sun, L.; Ip, D.Y.K.; Lee, H.; Chao, C.Y.H.; Lau, A.K.H. Energy consumption, indoor thermal comfort and air quality in a commercial office with retrofitted heat, ventilation and air conditioning (HVAC) system. Energy Build. 2019, 201, 202–215. [Google Scholar] [CrossRef]
  33. Li, X.; Zhao, T.; Zhang, J.; Chen, T. Predication control for indoor temperature time-delay using Elman neural network in variable air volume system. Energy Build. 2017, 154, 545–552. [Google Scholar] [CrossRef]
  34. Ye, X.; Kang, Y.; Yang, F.; Zhong, K. Comparison study of contaminant distribution and indoor air quality in large-height spaces between impinging jet and mixing ventilation systems in heating mode. Build. Environ. 2019, 160, 106159. [Google Scholar] [CrossRef]
  35. Kalmár, F. Innovative Method and Equipment for Personalized Ventilation. Available online: https://s3.amazonaws.com/objects.readcube.com/articles/downloaded/wiley/578f96450a625d51181a6ad8602e9ffb4050698cd7ce9c86977bf4fb1709f42e.pdf?AWSAccessKeyId=AKIAIJZYFKH6APDFT3HA&Expires=1442620800&Signature=puirPVisC69kvEN6YlblLKp9Kk0%253D&response-content (accessed on 17 September 2015).
  36. Rabani, M.; Madessa, H.B.; Nord, N.; Schild, P.; Mysen, M. Performance assessment of all-air heating in an office cubicle equipped with an active supply diffuser in a cold climate. Build. Environ. 2019, 156, 123–136. [Google Scholar] [CrossRef]
  37. Nielsen, P.V. Velocity distribution in a room ventilated by displacement ventilation and wall-mounted air terminal devices. Energy Build. 2000, 31, 179–187. [Google Scholar] [CrossRef]
  38. Hurnik, M. Systemy Klimatyzacji o Zmiennej Ilości Powietrza z Indukcujnymi Regulatorami Przepływu; Wydawnictwo Politechniki Śląskiej: Gliwice, Poland, 2018. [Google Scholar]
  39. Sun, Z.; Wang, S. A CFD-based test method for control of indoor environment and space ventilation. Build. Environ. 2010, 45, 1441–1447. [Google Scholar] [CrossRef]
  40. Du, Z.; Xu, P.; Jin, X.; Liu, Q. Temperature sensor placement optimization for VAV control using CFD–BES co-simulation strategy. Build. Environ. 2015, 85, 104–113. [Google Scholar] [CrossRef]
  41. Gangisetti, K.; Claridge, D.E.; Srebric, J.; Paulus, M.T. Influence of reduced VAV flow settings on indoor thermal comfort in an office space. Build. Simul. 2016, 9, 101–111. [Google Scholar] [CrossRef]
  42. Nada, S.A.; El-Batsh, H.M.; Elattar, H.F.; Ali, N.M. CFD investigation of airflow pattern, temperature distribution and thermal comfort of UFAD system for theater buildings applications. J. Build. Eng. 2016, 6, 274–300. [Google Scholar] [CrossRef]
  43. Mu, Y.; Liu, M.; Ma, Z.; Zhang, J. Resistance characteristic analysis based study on a novel damper torque airflow sensor for VAV terminals. Build. Environ. 2020, 175, 106813. [Google Scholar] [CrossRef]
  44. Hurnik, M. Novel cylindrical induction controller and its application in VAV air conditioning system in an office building. Energy Build. 2016, 130, 341–349. [Google Scholar] [CrossRef]
  45. Liu, R.; Wen, J.; Waring, M.S. Improving airflow measurement accuracy in VAV terminal units using flow conditioners. Build. Environ. 2014, 71, 81–94. [Google Scholar] [CrossRef]
  46. Pasut, W.; Bauman, F.; De Carli, M. The use of ducts to improve the control of supply air temperature rise in UFAD systems: CFD and lab study. Appl. Energy 2014, 134, 490–498. [Google Scholar] [CrossRef]
  47. Szczepanik-Ścisło, N.; Schnotale, J. Modelowanie CFD nawiewnika z dynamicznie zmieniającą się geometrią w celu poprawy efektywności wentylacji w systemach VAV. Ciepłownictwo Ogrzew. Went. 2017, 1, 38–42. [Google Scholar] [CrossRef]
  48. PN EN 12238. Ventilation for Buildings—Air Terminal Devices—Aerodynamic Testing and Rating for Mixed Flow Application; Polish Committee for Standardization: Warsaw, Poland, 2002. [Google Scholar]
  49. ISO 5167-2. Measurement of Fluid Flow by Means of Pressure Differential dEvices Inserted in Circular-Cross Section Conduits Running Full—Part 2: Orifice Plates; Polish Committee for Standardization: Warsaw, Poland, 2003. [Google Scholar]
  50. ISO 5167-1. Measurement of Fluid Flow by Means of Pressure Differential Devices Inserted in Circular Cross-Section Conduits Running Full—Part 1: General Principles and Requirements; Polish Committee for Standardization: Warsaw, Poland, 2003. [Google Scholar]
  51. Nielsen, P.V. Fifty years of CFD for room air distribution. Build. Environ. 2015, 91, 78–90. [Google Scholar] [CrossRef]
  52. Pang, L.; Li, P.; Bai, L.; Liu, D.; Zhou, Y.; Yao, J. Optimization of air distribution mode coupled interior design for civil aircraft cabin. Build. Environ. 2018, 134, 131–145. [Google Scholar] [CrossRef]
  53. Al Assaad, D.; Habchi, C.; Ghali, K.; Ghaddar, N. Effectiveness of intermittent personalized ventilation in protecting occupant from indoor particles. Build. Environ. 2018, 128, 22–32. [Google Scholar] [CrossRef]
  54. Montazeri, H.; Montazeri, F. CFD simulation of cross-ventilation in buildings using rooftop wind-catchers: Impact of outlet openings. Renew. Energy 2018, 118, 502–520. [Google Scholar] [CrossRef]
  55. ANSYS. ANSYS FLUENT Theory Guide; Release 17.0; ANSYS Inc.: Canonsburg, PA, USA, 2017; Available online: http://www.ansys.com (accessed on 5 August 2020).
  56. Burchard, H.; Petersen, O. Models of turbulence in the marine environment—A comparative study of two-equation turbulence models. J. Mar. Syst. 1999, 21, 29–53. [Google Scholar] [CrossRef]
  57. Dijkstra, Y.M.; Uittenbogaard, R.E.; van Kester, J.A.T.M.; Pietrzak, J.D. In search of improving the numerical accuracy of the k-e(open) model by a transformation to the k-τ model. Ocean Model. 2016, 104, 129–142. [Google Scholar] [CrossRef]
  58. Geng, L.; Liu, H.; Wei, X. International Journal of Thermal Sciences CFD analysis of the flashing flow characteristics of subcritical refrigerant R134a through converging-diverging nozzles. Int. J. Therm. Sci. 2019, 137, 438–445. [Google Scholar] [CrossRef]
  59. Shan, X.; Luo, N.; Sun, K.; Hong, T.; Lee, Y.; Lu, W.; Engineering, C.; Kong, H.; Administrative, S. Coupling CFD and building energy modelling to optimize the operation of a large open office space for occupant comfort. Sustain. Cities Soc. 2020, 60, 102257. [Google Scholar] [CrossRef]
  60. Najafabadi, H.H.; Moraveji, M.K. CFD investigation of local properties of Al2O3/water nanofluid in a converging microchannel under imposed pressure difference. Adv. Powder Technol. 2017, 28, 763–774. [Google Scholar] [CrossRef]
  61. De Dear, R.J.; Akimoto, T.; Arens, E.A.; Brager, G.; Candido, C.; Cheong, K.W.D.; Li, B.; Nishihara, N.; Sekhar, S.C.; Tanabe, S.; et al. Progress in thermal comfort research over the last twenty years. Indoor Air 2013, 23, 442–461. [Google Scholar] [CrossRef]
  62. D’Ambrosio Alfano, F.R.; Olesen, B.W.; Palella, B.I.; Riccio, G. Thermal comfort: Design and assessment for energy saving. Energy Build. 2014, 81, 326–336. [Google Scholar] [CrossRef]
  63. Enescu, D. A review of thermal comfort models and indicators for indoor environments. Renew. Sustain. Energy Rev. 2017, 79, 1353–1379. [Google Scholar] [CrossRef]
  64. Fanger, P.O. Thermal Comfort; Kreiger: Malabar, FL, USA, 1982. [Google Scholar]
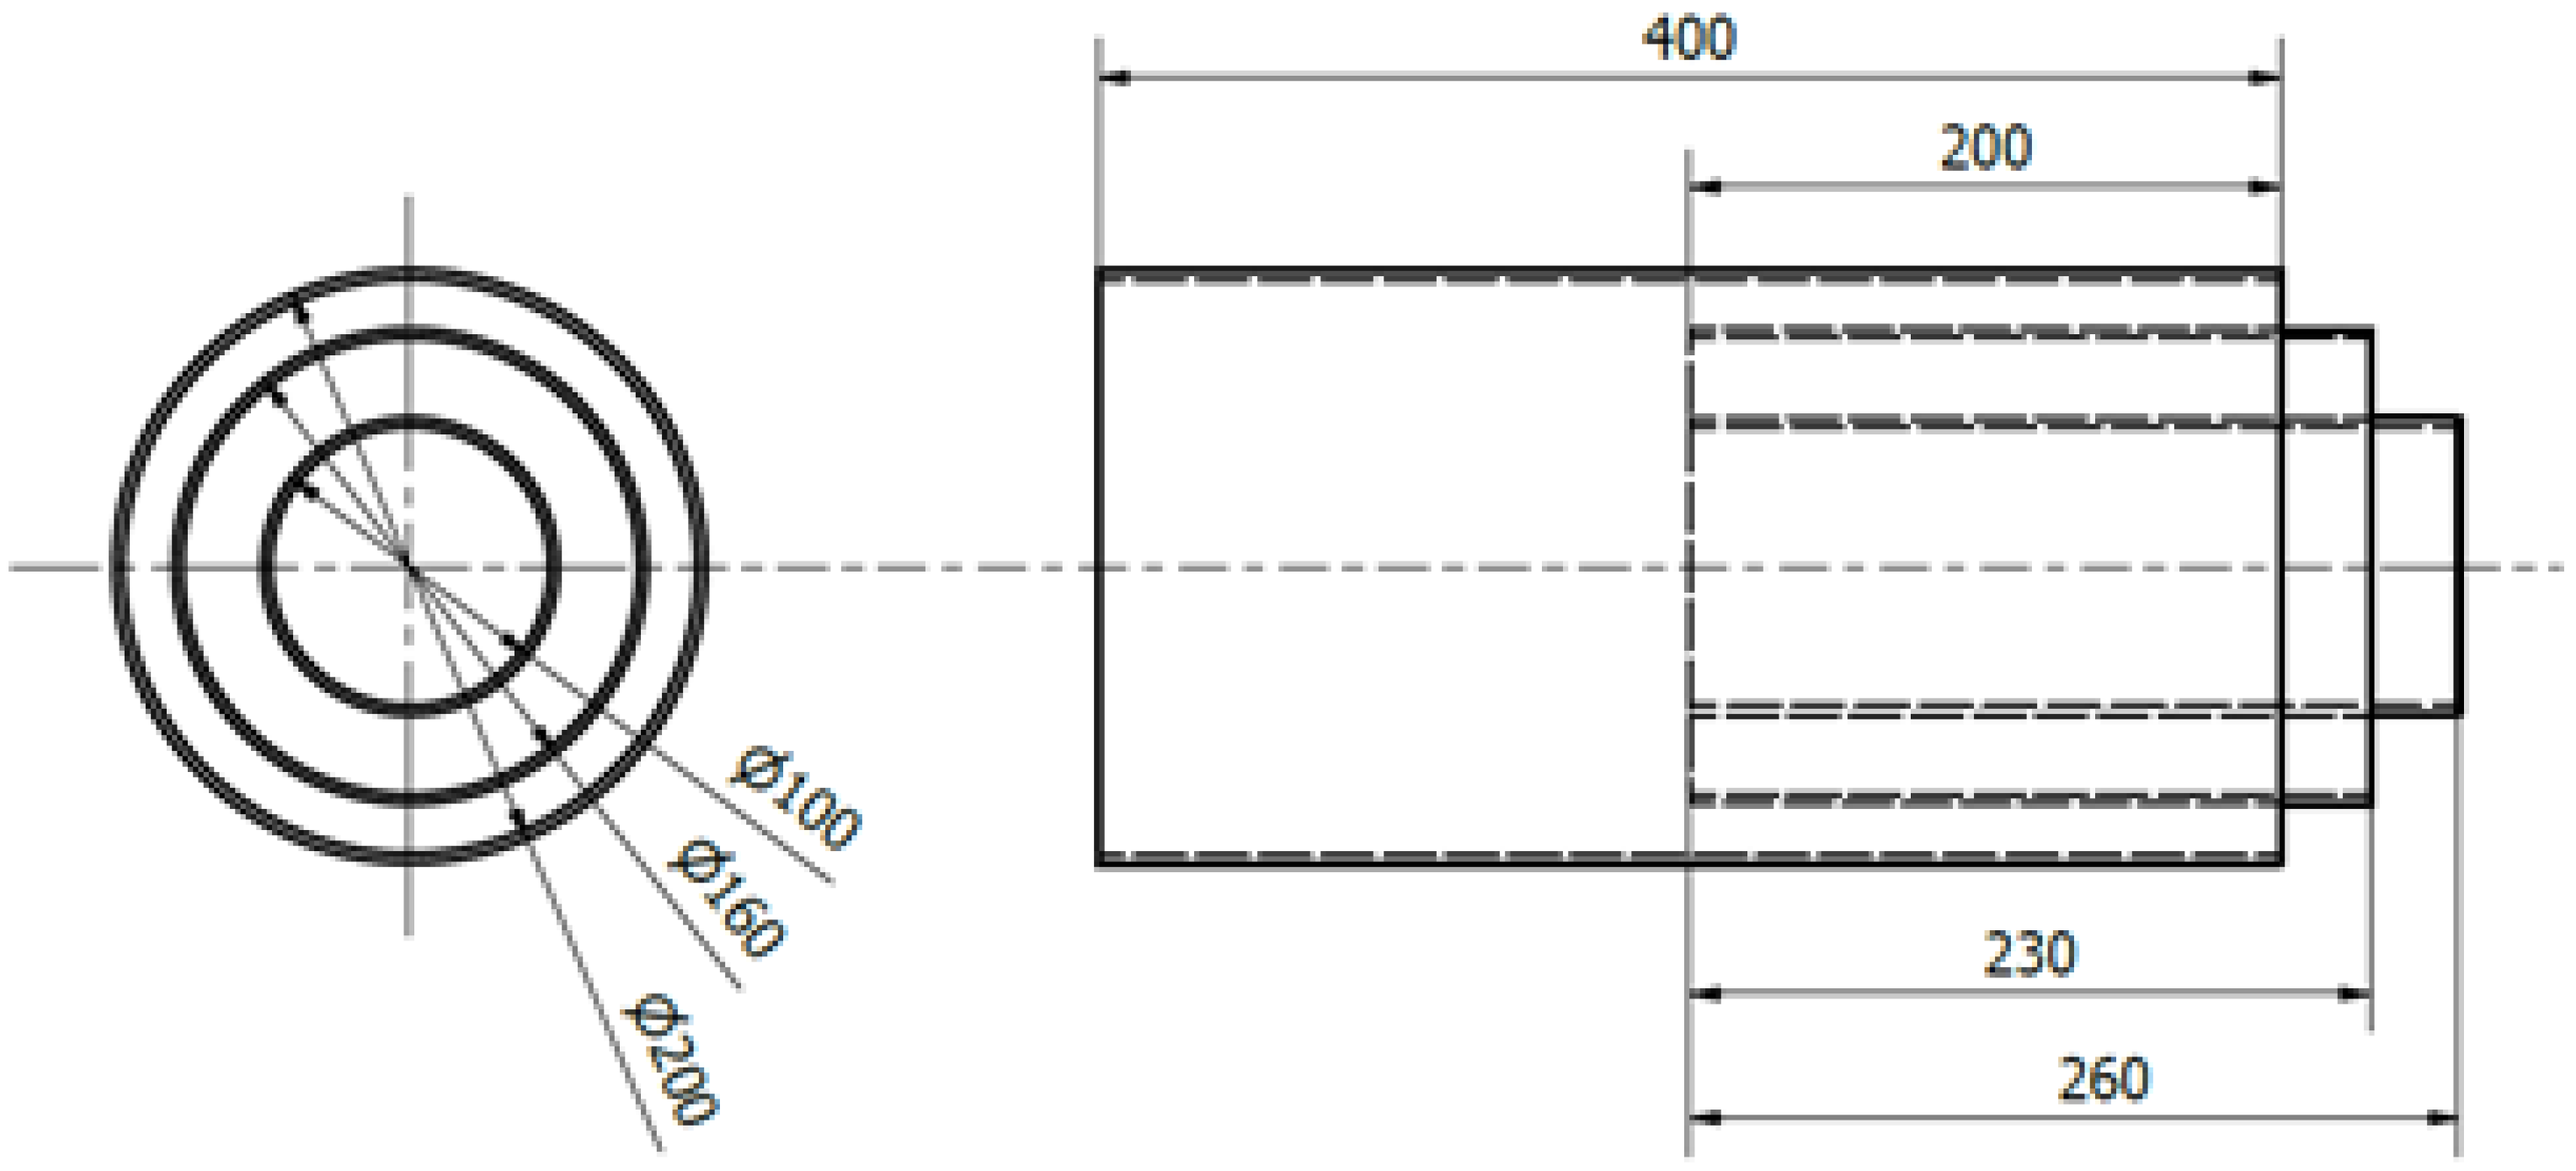
Figure 1. Concept of the air terminal device designed in the Inventor software (two-dimensional (2D) model)—units shown in mm.
Energies 13 04947 g001
Figure 2. Concept of the air terminal device designed in the Inventor software (three-dimensional (3D) model).
Energies 13 04947 g002
Figure 3. Laboratory stand layout according to PN-EN 12238:2002.
Energies 13 04947 g003
Figure 4. Photograph of the laboratory stand: (a) air terminal device with the thermal-resistant anemometer; (b) fan duct with orifice inserted orifice and equalizing chamber.
Energies 13 04947 g004
Figure 5. Measurement points along the axis of the flow.
Energies 13 04947 g005
Figure 6. Longitudinal section view of the model in the Fluent application—length in mm.
Energies 13 04947 g006
Figure 7. Simulation results without the change in air terminal device geometry; ATD setting 1.
Energies 13 04947 g007
Figure 8. Results when changing the geometry of the ATD: (a) simulation results; (b) laboratory results.
Energies 13 04947 g008
Figure 9. Cross-sections of the velocity vectors: (a) 0.5 m from the ATD; (b) 1.5 m from the ATD; (c) 3 m from the ATD; (d) 4.5 m from the ATD.
Energies 13 04947 g009aEnergies 13 04947 g009b
Figure 10. Air flow spread—maximum airflow, ATD setting 1.
Energies 13 04947 g010
Figure 11. Air flow spread—medium airflow, ATD setting 2.
Energies 13 04947 g011
Figure 12. Air flow spread—minimum airflow, ATD setting 3.
Energies 13 04947 g012
Figure 13. Standard deviation of the simulation from the measurements: (a) maximum flow; (b) maximum flow; (c) minimal flow.
Energies 13 04947 g013
Figure 14. (a) Predicted mean vote (PMV) contour for the maxim airflow; (b) predicted percentage of dissatisfied (PPD) contour for the maxim airflow; ATD setting 1.
Energies 13 04947 g014
Figure 15. (a) PMV contour for the medium airflow; (b) PPD contour for the medium airflow; ATD setting 2.
Energies 13 04947 g015
Figure 16. (a) PMV contour for the minimum airflow; (b) PPD contour for the minimum airflow; ATD setting 3.
Energies 13 04947 g016
Table 1. Technical properties of measuring devices.
Equipment TypeData RangeAccuracy
Differential pressure sensor−35,000 to 3500 Pa±35 Pa
Velocity sensor0.08 to 20 m/s±0.04 m/s
Temperature sensor−10 to 50 °C±0.3 °C
Table 2. Turbulence model. ATD, air terminal device.
Turbulence ModelVelocity (m/s)Convergence Rate (%)
MeasuredNumerical
Velocity at 3 m from the ATD
RNG k–ε 1.561.591.92
Standard k–ω 1.466.41
Standard k–ε0.9141.67
Velocity at 6 m from the ATD
RNG k–ε 0.740.731.35
Standard k–ω 0.6913.33
Standard k–ε0.4539.19
Table 3. Grid independence analysis.
Number of ElementsMax SkewnessAverage Air Velocity V (m/s)Convergence Rate (%)
ExperimentalNumerical
Velocity at 3 m from the ATD
4,233,0540.979281.561.623.85
8,799,4160.947151.591.92
11,731,0260.947051.485.12
Velocity at 6 m from the ATD
4,233,0540.979280.740.6413.51
8,799,4160.947150.731.35
11,731,0260.947050.796.75
Table 4. Geometric properties of mesh structure.
Inlet SectionEqualizing ChamberATDOutlet Section
Maximum element size20 mm10 mm5 mm20 mm
Growth rate1.2
Cell geometryQuadrilateral
Table 5. Simulation solution method settings
SolverPressure Based Solver
Convergence criterion10−6
Spatial discretization
GradientGradient least squares cell-based
PressurePressure second-order
MomentumMomentum second-order upwind
Turbulent kinetic energySecond-order upwind
Turbulent dissipation rateSecond-order upwind
EnergySecond-order upwind
Table 6. PMV and PPD results for the medium and minimum airflow.
Maximum AirflowMedium AirflowMinimum Airflow
Minimum PMV−1.38−1.68−1.46
Maximum PMV0.640.640.64
Minimum PPD5.00%5.00%5.00%
Maximum PPD44.95%60.84%48.85%