Article

Steady-State Performance Prediction for a Variable Speed Direct Expansion Air Conditioning System Using a White-Box Based Modeling Approach

1
Institute of Refrigeration and Cryogenics, Zhejiang University, Hangzhou 310058, China
2
Institute of Energy Utilization and Automation, Hangzhou Dianzi University, Hangzhou 310018, China
3
Parker Hannifin Motion & Control (Shanghai) Co., Ltd., Shanghai 201206, China
*
Author to whom correspondence should be addressed.
Energies 2020, 13(18), 4757; https://doi.org/10.3390/en13184757
Submission received: 17 August 2020 / Revised: 2 September 2020 / Accepted: 9 September 2020 / Published: 11 September 2020

Abstract

:
When using a certain type of Heating, Ventilation & Air Conditioning (HVAC) systems, it is primary to obtain their steady-state operating behaviors for achieving a better indoor thermal environment. This paper reports a development of a white-box-based dynamic model for a direct expansion (DX) air conditioning (A/C) system to predict its steady-state operating performance under variable speed operation. The established model consists of five sub-models, i.e., a compressor, an electronic expansion valve, an evaporator, a condenser and a conditioned space. Each sub-model was developed based on partial lumped parameter approach. Using the available data generated from an experimental DX A/C system, both transient and steady-state behaviors predictions agreed well with the experimental ones. With the help of the validated white-box model, the inherent steady-state operating performance expressed in terms of the relationship among total cooling capacity (TCC), equipment sensible heat ratio (E SHR) and coefficient of performance (COP) under various speed combinations of compressor and supply fan were further examined. The results show that a higher COP could be achieved when the DX A/C system was operated at a higher fan speed or a lower compressor speed for dealing with a larger required E SHR. This model could be helpful for A/C system design and controller development.

1. Introduction

Direct expansion (DX) air conditioning (A/C) systems are one of the predominated employed HVAC systems in buildings for providing a comfortable indoor thermal environment, particularly in residential buildings. Therefore, the energy consumed by DX A/C systems is one of the largest energy consumers in buildings. For a DX type air conditioning system, the sending air is directly cooled and dehumidified when passing through the evaporator, and thus it is advantageous due to its simple structure and flexible installation. In China, approximately 55 million DX A/C units are sold annually as of 2017 [1]. Therefore, it is urgent to develop energy efficient DX A/C systems to reduce their energy consumption, and consequently contribute to environmental protection and greenhouse gas emission reduction.
Recently, adjustable frequency drive has been increasingly applied in DX A/C systems, making it possible to simultaneously control compressor and supply fan speeds. Consequently, it provides tremendous opportunities for achieving a better energy efficiency and indoor thermal environment. It has been reported that, in a hot and humid region, the annual energy consumed by an A/C system can be reduced about 20% if it is equipped with a variable speed compressor for indoor thermal environment control [2]. This is because less energy may be consumed as the output cooling capacity can be regulated as guided by the varying cooling load [3]. In addition, through simultaneously varying compressor and supply fan speeds, it is possible to control indoor air temperature and humidity conditioned by a single DX A/C unit [4,5,6,7,8]. To achieve a better control of HVAC systems, it is indispensable to obtain their steady-state operating performances [9]. One of the most significant challenges existing in the simultaneous control over indoor temperature and humidity in a space conditioned by DX A/C units is the difficulties in obtaining the steady-state operating characteristics under various operational conditions.
Generally, experimentation and modeling are two commonly adopted approaches to gain the steady-state operating performance of HVAC system. For a A/C system, its total cooling capacity (TCC) and sensible heat ratio (SHR) are two important parameters indicating the ability to cool and dehumidify air. Li and Deng [10] experimentally studied the steady-state operating characteristics of a DX A/C system under various compressor and supply fan speed combinations. The results show that the output TCC of the DX A/C system was mainly affected by varying compressor speed. In addition, at a given compressor speed, decreasing supply fan speed would also reduce, but less significantly, the output TCC. On the other hand, a lower supply fan speed, or a smaller air-flow rate, gave a larger latent heat removal, thus a lower Equipment SHR. Later, experiments conducted by Xu, et al. [11] revealed that, for a DX A/C system, its output TCC and output E SHR under different compressor and fan speeds were mutually coupled and constrained within a trapezoid when these two parameters were presented on the same diagram. Li et al. [12] further studied the steady-state operating characteristics of the same experimental DX A/C system but at different inlet air states. Experiments demonstrated that the steady-state operating characteristics were strongly affected by the inlet air temperature and relative humidity level. At a constant inlet relative humidity, varying inlet air temperature would cause the position shifting of a TCC-E SHR trapezoid, but the trapezoid shapes were maintained. Varying inlet RH level would however result in both position shifting and changes in trapezoid shapes. A novel standalone DX A/C system but equipped with two evaporators for enhanced dehumidification was developed and experimental investigated by Chen et al. to study its operational characteristics in terms of TCC and E SHR [13]. The two evaporators were sequentially placed in an air duct. Experimental results reveal that its output TCC and E SHR were also mutually constrained but within an irregular TCC-E SHR diagram. Yang et al. [14] further proposed a DX A/C system with two sectional evaporators being arranged in parallel on its airside. Through experimentation, they showed that the proposed system could enlarge the output range of a DX A/C system.
As another primary way to investigate steady-state operating performance of HVAC systems, the modeling approach can be classified into three different categories: white-box-based, black-box-based and grey-box-based methods [15]. White-box models, or physics-based models, are developed by writing system equations based on physical laws. White-box models can provide clear descriptions of natural phenomena and illustrate detail operating characteristics of the modeled system. Although there exist several commercial software packages for white-box modeling HVAC system, such as EnergyPlus and TRNSYS, they treat the DX A/C system as a whole component without considering the characteristics of evaporator, compressor and condenser under various operational conditions on system operating performance. Thus, it is impossible to capture the operating characteristics and the dynamic behaviors of DX A/C systems using the available commercial software. Therefore, over the years, several white-box-based models have been established and reported for DX A/C systems [16,17,18,19,20]. Chen et al. [21] developed a steady-state physical-based mathematical model for a standalone air conditioning system equipped with two DX evaporators for providing enhanced dehumidification ability. The results indicate that that a lower surface area ratio of the two DX evaporators gave larger variation ranges of both TCC and E SHR. Black-box models, also known as data driven models, rely solely on measurement data without delving into the details of what is actually happening inside the system. One of the extensively employed data driven modeling methods for HVAC systems is the artificial neural network (ANN) [22,23,24]. Li et al. [25] developed a black-box-based model for an experimental DX A/C system using ANN to predict its output TCC and E SHR under different combinations of compressor and supply fan speeds. Study results show that using ANN-based modeling approach could successfully predict the operating characteristics of the DX A/C system with a relatively high accuracy. However, the fundamental weakness for the black-box-based model is the lack of detailed information on the relationships between inputs and outputs, and it does not allow accurate extrapolation beyond the range of data used for model training. A grey-box model could be regarded as a combination of the white- and black-box-based approaches. Both system physics and measured data are required to develop a grey-box-based model [26]. Xu et al. [27] proposed a hybrid modeling approach which uses the physical modeling approach to simulate the performance of evaporator for accurately acquiring the cooling and dehumidification processes under various operating conditions, and then it uses ANN to simulate all other components of a DX A/C system. However, similar to the black-box-based approach, it could not accurately extrapolate operating conditions beyond the range of the data used for training/estimating the model parameters. On the other hand, when it is impossible to preform experiments, the white-box modeling approach is advantageous and can help fully capture the inherent operational behaviors of a certain physical system within its entire operational range. Furthermore, while the operating characteristics of a DX A/C system have been extensively studied [10,11,12], in those reported studies, the operating performance in terms of its COP under various operating conditions were not taken into consideration.
Therefore, in this paper, the development of a white-box-based dynamic model for a DX A/C system is reported to examine the steady-state operating performance under different compressor and fan speeds. The organization of this paper is as follows. Section 2 presents the descriptions of the modeled DX A/C system and the detailed development of the white-box-based dynamic model for the DX A/C system. The validation results are reported in Section 3. This is followed by presenting the simulation results on the operating performance of the DX A/C system under variable speed operation in Section 4. Finally, the conclusions of this paper are given in Section 5.

2. Model Development for a DX A/C System

To extensively examine the steady-state performance of a DX A/C system under various operational conditions, numerical and experimental approaches were employed. The numerical study was realized by establishing a white-box-based dynamic model, and the developed model was then validated using experimental data from a real system. In this section, the details of the dynamic model development are presented, and its experimental validation results are introduced in Section 3.

2.1. Descriptions of the Modeled DX A/C System

The experimental DX A/C system was the same as in previous studies [10,11,12], which is schematically shown in Figure 1. The DX A/C system consisted of two part: a DX refrigeration plant (known as refrigerant side) and an air distribution sub-system (known as air side). The DX refrigeration plant was composed of four major components: a rotary compressor, an electronic expansion valve (EEV), a high-efficiency DX evaporator and an air-cooled condenser. The compressor was driven by a variable frequent drive, and thus its speed could be modulated. The evaporator and condenser were tube-louver-finned type and tube-plate-finned type, respectively. The specifications of each component are listed in Table 1.
The experimental DX A/C system was fully instrumented with high-precision sensors/transducers. The measured operating parameters include temperatures and flow rates of both air and refrigerant, pressures in the experimental DX A/C system, etc. Platinum RTD temperature sensors were used for measuring both air temperature and refrigerant temperature with an accuracy of ±0.1 °C. Refrigerant pressures in various locations of the refrigerant circuit were measured using pressure transmitters with a reported uncertainty of ±0.2% of full-scale reading. The refrigerant mass flow rate circulated in the DX plant was measured using a Coriolis mass flow meter with a reported accuracy of ±0.25% of full-scale reading. All measurements were computerized, so that all the measured data could be recorded for subsequent analysis.

2.2. Model Development

The white-box-based dynamic model was built up by dividing the DX A/C system into five different sub models: compressor sub-model, expansion valve sub-model, DX evaporator sub-model, air cooled condenser sub-model and conditioned space sub-model. Each sub-model was established based on the partial lumped parameter modeling approach. For simplicity, the following assumptions were given: (1) the air passing through evaporator, condenser and conditioned space is perfectly mixed; (2) two distinct regions on the air side of the DX evaporator are assumed, namely dry-cooling region and wet-cooling region; (3) thermal losses in all air ducts are ignored; and (4) constant pressure loss of refrigerant inside the condenser is assumed. Through writing the energy and mass conservation equations of each sub-model, the proposed white-box-based dynamic mathematic model for the DX A/C system could be built up.

2.2.1. Compressor Sub-Model

In comparison to the processes taking place inside the evaporator and condenser, the dynamic behavior of the compressor is negligible, and thus a steady-state process was assumed when modeling the compressor. The refrigerant mass flow rate, m ˙ r _ c o m leaving the compressor could be evaluated as follows:
m ˙ r _ c o m = ρ c o m _ i n V ˙ c o m
V ˙ c o m = λ × V ˙ c o m _ t = λ × n π r 2 l ε ( 2 ε )
where ρcom_in is the refrigerant density at inlet of the compressor; V ˙ c o m _ t the theoretical displacement volumetric flow rate; l and r are the stroke and rotor radius, respectively; ε is the relative eccentricity of rotor; and λ is the overall displacement coefficient, which could be obtained through curve fitting the related performance data of the compressor provided by the manufacture [28].
The indicated work done by the compressor, Wcom, could be evaluated by
W c o m = W c o m _ t / η = k k 1 P c o m _ i n ρ c o m _ i n [ ( P c o m _ o u t P c o m _ i n ) k k 1 1 ] / η
where Wcom_t is the theoretical isentropic work of the compressor; Pcom_in and Pcom_out are the suction pressure and discharge pressure, respectively; η is the indicated coefficient; and k is the compressor index. k was assumed to 1.18 in this model. Therefore, the enthalpy of the vapor refrigerant leaving the compressor, hrcom_out, could be obtained as follows
h r c o m _ o u t = W c o m + h r c o m _ i n

2.2.2. EEV Sub-Model

The throttling process across the EEV was treated as isenthalpic, and thus the enthalpy entering the EEV is equal to that leaving the EEV, hrv_in = hrv_out. The refrigerant mass flow rate, m ˙ r _ v , is given by
m ˙ r _ v = C v A v ρ v _ i n Δ P v = C v K v u v ρ v _ i n Δ P v
where ρv_in is the density of the liquid refrigerant entering the EEV; ΔPv is the pressure drop across the EEV; Cv and Kv are the flow coefficient and the valve opening per unit of pulse out of the specific valve used in the current study, respectively; and uv is the pulse output of the EEV which is determined by the EEV’s control algorithm. In the experimental system, the EEV was proportional-integral (PI) controlled, and thus pulse output, uv, was able to be modulated, so that the degree of refrigerant superheat (DS) could be maintained within a certain limit.

2.2.3. Evaporator and Condenser Sub-Models

When modeling the DX evaporator, two distinct regions, i.e., a two-phase region and a superheating region, were assumed and separately treated. Figure 2 is the schematic diagram of the evaporator sub-model. For the air-cooled condenser, on the other hand, three distinct regions, i.e., a desuperheating region, a two-phase region and a subcooling region, were adopted when modeling. Both the evaporator and the condenser were treated as counter flow heat exchangers. Considering the similarity when modeling the evaporator and condenser, the development of evaporator sub-model is detailed in this section.

Two-Phase Region

As shown in Figure 2, a liquid refrigerant zone designated by Ve_l and a vapor refrigerant zone designated by Ve_v were assumed in the two-phase region inside the evaporator. In comparison to the liquid refrigerant zone, the thermal capacitance and mass storage in the vapor refrigerant zone could be neglected. Therefore, writing the mass and energy conservation equations into the two-phase region of the evaporator yields
d ( ρ e _ l V e _ l ) d t = m ˙ r e _ i n m ˙ r e _ 1
d ( ρ e _ l V e _ l h r e _ l ) d t = m ˙ r e _ i n h r e _ i n m ˙ r e _ 1 h r e _ 1 + Q e _ t p
Q e _ t p = α e _ t p A e _ t p ( T w _ t p T r e _ i n + T r e _ 1 2 )
where m ˙ r e _ i n and hre_in are the mass flow rate and enthalpy of the refrigerant entering the evaporator, respectively. m ˙ r e _ 1 and hre_1 are, respectively, the refrigerant mass flow rate and refrigerant enthalpy leaving the two-phase region of the evaporator. ρe_l is the density of saturated liquid refrigerant, hre_l the enthalpy of saturated liquid refrigerant and Ve_l the volume of saturated liquid refrigerant. αe_tp is the two-phase convective heat transfer coefficient between the refrigerant and the tube wall inside the evaporator, which could be calculated using Kandlikar equation [29]. The internal heat transfer area in the two-phase region, Ae_tp, could be evaluated by
A e _ t p = V e _ t p V e A e = 1 1 Z e V e _ l × A e V e
where Ae and Ve are the internal area and internal volume of the evaporator. The void fraction, Ze, could be obtained using Zivi equation [30].
For the air side of the DX evaporator in two-phase region, as the temperature of evaporator surface is always below the dew-point temperature of air, wet-cooling of air occurs on the air side of the two-phase region. Neglecting the thermal capacitance and mass storage and applying energy balance in this region yield
Q e a _ t p = ρ a V ˙ e a ( h e a _ 1 h e a _ o u t )
where ρa is the air density; V ˙ e a is the volume rate of the supply air; V ˙ e a is proportional to the speed of supply fan; and hea_1 and hea_out are, respectively, the air enthalpies entering and leaving the wet-cooling region, which could be calculated using the air state equations when the air moisture content and air dry-bulb temperatures are given. The heat transfer between the supply air and the evaporator tube-fin surface, Qea_tp, could also be evaluated as
Q e a _ t p = α e a _ t p A e a _ t p ( T e a _ 1 T e a _ o u t ln ( T e a _ 1 T w _ t p T e a _ o u t T w _ t p ) )
where Tea_1 and Tea_out are, respectively, the air temperature entering and leaving the wet-cooling region, Aea_tp is the external heat transfer area of the wet-cooling region. The air side heat transfer coefficient for wet cooling, αea_tp, could be calculated from the CCWang correlations [31].
In wet-cooling region, considering the process of air cooling and dehumidification in a psychrometric chart, the air temperature, Tea_out, and moisture content, dea_out, at the outlet of the DX evaporator could be simply evaluated as follows,
T e a _ o u t = ( T e a _ 1 T w _ t p ) ( h e a _ o u t h w _ t p ) h e a _ 1 h w _ t p + T w _ t p
d e a _ o u t = ( d e a _ 1 d w _ t p ) ( h e a _ o u t h w _ t p ) h e a _ 1 h w _ t p + d w _ t p
where dw_tp and hw_tp are, respectively, the moisture content and enthalpy of saturated air corresponding to the temperature of evaporator wall in two-phase region, Tw_tp.
Furthermore, the variation of tube wall temperature of the evaporator in the two-phase region is determined by the heat transfer between refrigerant and evaporator tube wall, Qe_tp, and that between supply air and evaporator tube-fin surface, Qea_tp, and could be evaluated by
M w _ t p C p w d T w _ t p d t = Q e a _ t p Q e _ t p
where Mw_tp and Cpw are the mass of tube fin metal in the two-phase region and the equivalent specific heat for the tube and fin metal, respectively.

Superheating Region

In the superheating region, the thermal capacitance and mass storage in both refrigerant and sir sides are negligible, and dry-cooling of air is assumed. Therefore, the mass and energy balances in this region give
m ˙ r e _ out = m ˙ r e _ 1
Q e _ s h = m ˙ r e _ o u t ( h r e _ o u t h r e _ 1 ) = α e _ s h A e _ s h ( T r e _ o u t T r e _ 1 ln ( T r e _ o u t T w _ s h T r e _ 1 T w _ s h ) )
Q e a _ s h = C p a ρ a V ˙ e a ( T e a _ i n T e a _ 1 ) = α e a _ s h A e a _ s h ( T e a _ i n T e a _ 1 ln ( T e a _ i n T w _ s h T e a _ 1 T w _ s h ) )
M w _ s h C p w d T w _ s h d t = Q e a _ s h Q e _ s h
where Tre_out, hre_out and m ˙ r e _ out are the refrigerant temperature, enthalpy and mass flow rate leaving the evaporator, respectively. Ae_sh and Aea_sh are, respectively, the internal and external heat transfer area in the superheating region. The convective heat transfer coefficient between vapor refrigerant and evaporator tube wall, αe_sh, could be obtained from the Petukhov–Popov equations. The air side convective heat transfer coefficient for dry cooling, αe_sh, could also be calculated from the CCWang correlations [31].
The development of the condenser sub-model is almost the same as that of the evaporator sub-model, and the main difference lies on that three distinct zones, i.e., a desuperheating region; a two-phase region and a subcooling region were applied when modeling the condenser. Therefore, the development details are not specified in this section.

2.2.4. Conditioned Space Sub-Model

Given that the air circulated in the air ducts is perfect mixed without thermal and mass loss, the air temperature, Tsa_in, and moisture content, dsa_in, entering the conditioned space should be equal to those leaving the evaporator. The air temperature, Tsa_out, and moisture content, dsa_out, at the exit of the conditioned space are equal to those at the inlet of the evaporator. Therefore, energy and moisture balances in the conditioned space yield
C p a ρ a V s d T s a _ o u t d t = C p a ρ a V e a . ( T s a _ o u t T s a _ i n ) + Q l o a d + Q 0
ρ a V s d ( d s a _ o u t ) d t = ρ a V e a . ( d s a _ o u t d s a _ i n ) + W l o a d
Q 0 = U 0 A w a l l ( T o u t d o o r T s a _ o u t )
where vs. is the total volume of the space conditioned by the DX A/C system. U0 is the overall heat transfer coefficient between the conditioned space and the surrounding. Toutdoor is the surrounding temperature. The internal sensible heat gain and moisture load in the conditioned space due to both occupants and equipment are represented by Qload and Wload, while Q0 stands for heat loss caused by the temperature difference between conditioned space and outdoor surroundings.

2.2.5. Numerical Solution Procedure

When modeling, the thermophysical properties of the refrigerant was evaluated using the well-known Cleland correlations [32]. The properties of air under different states was calculated using the equations recommended by ASHRAE.
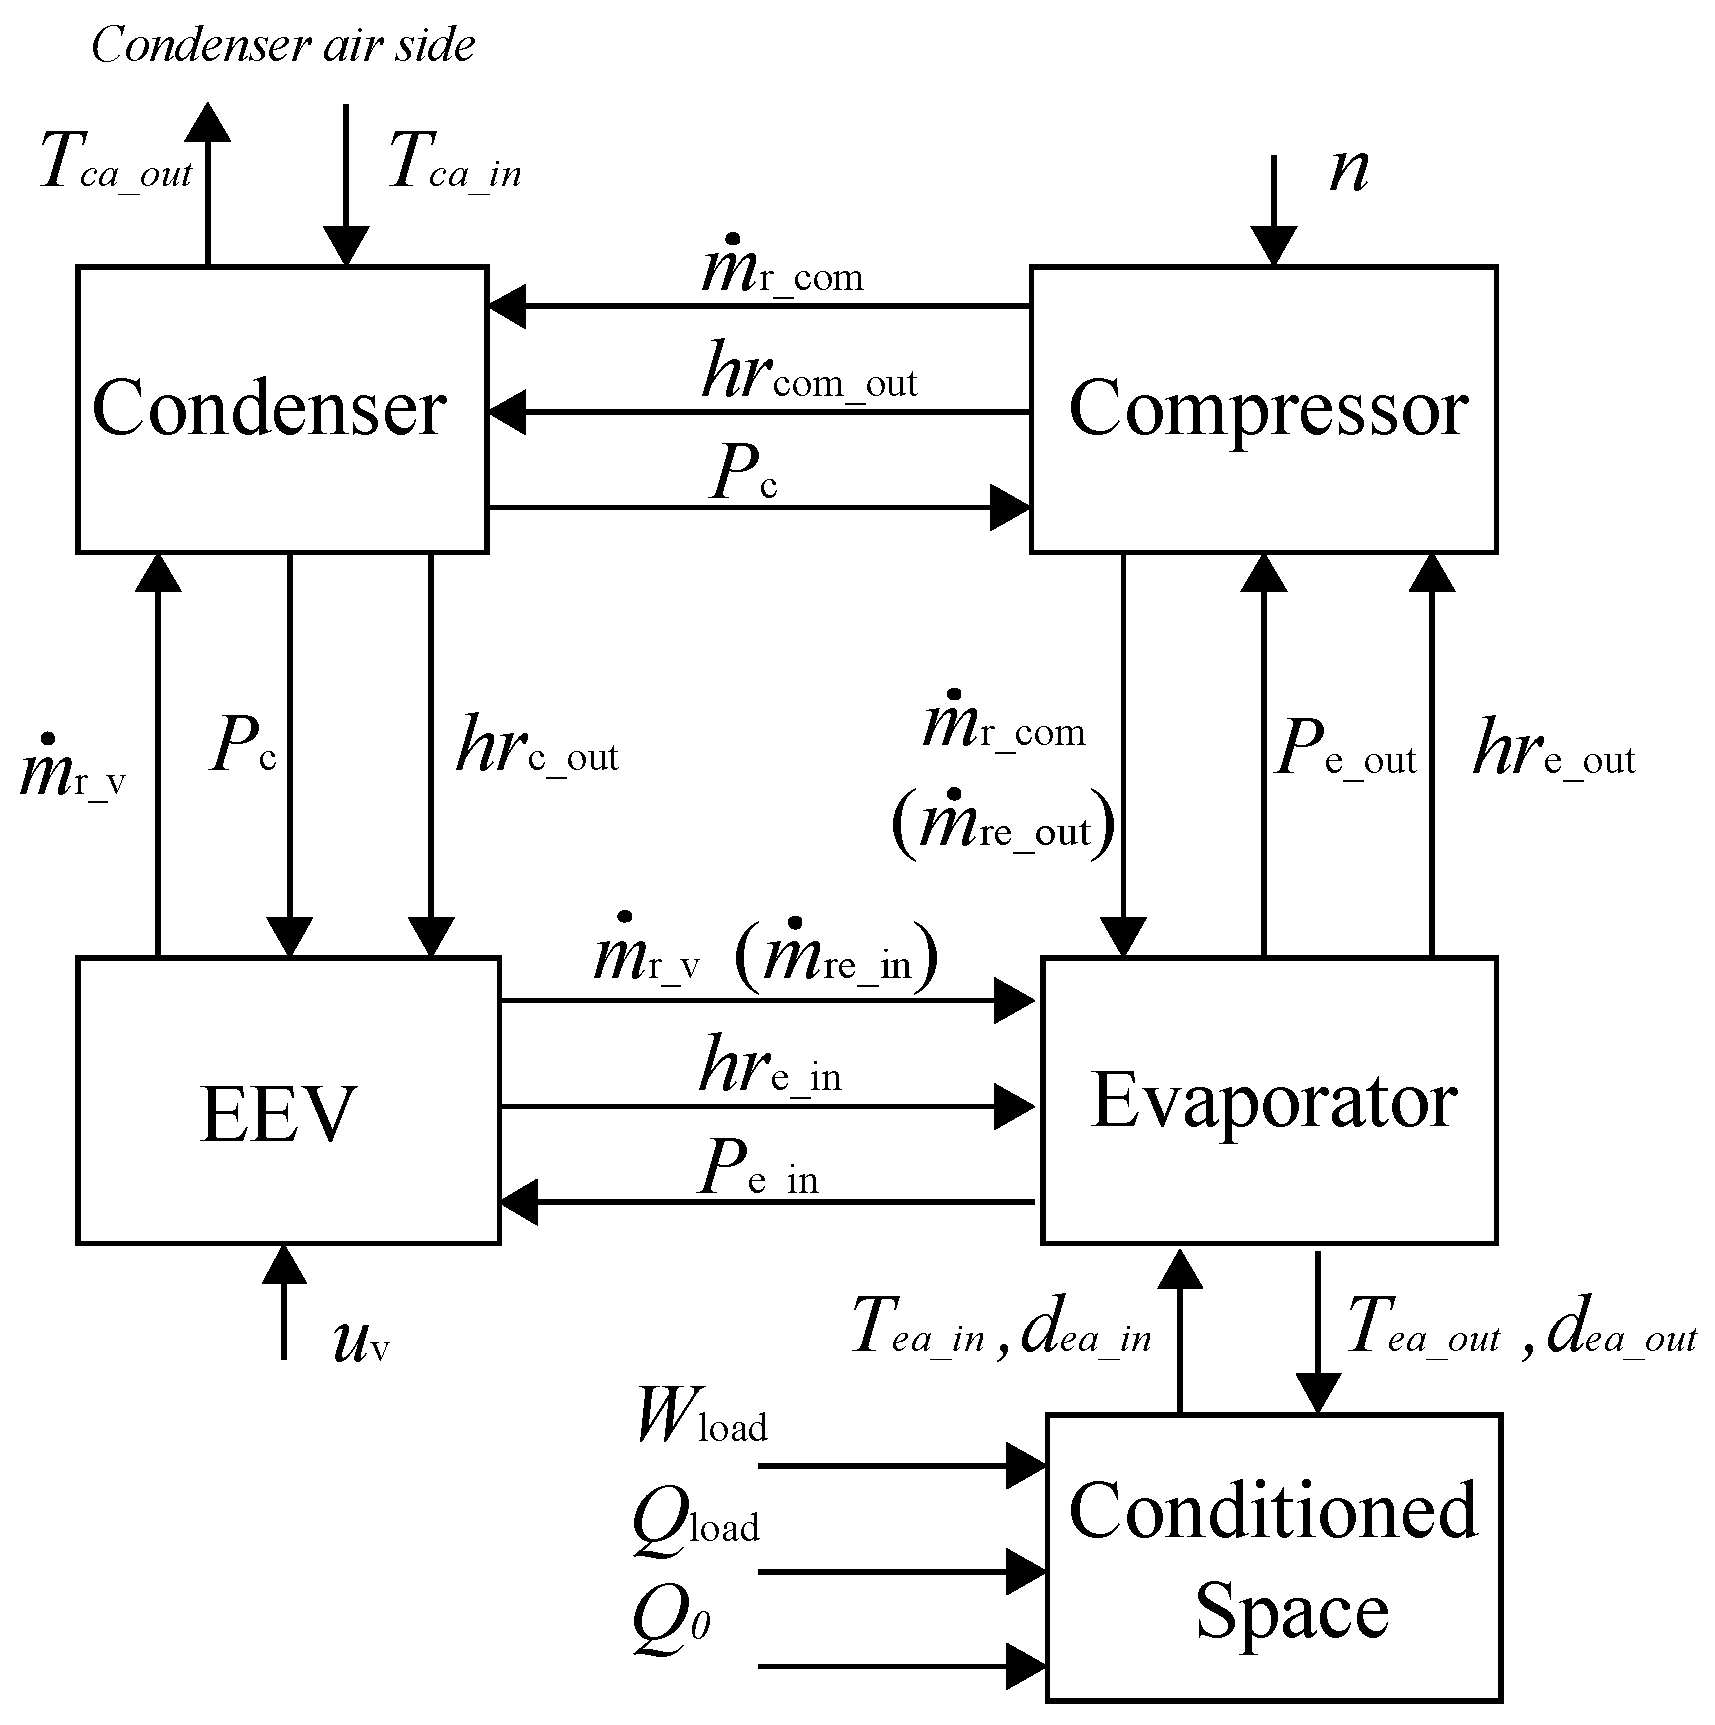
The coupling relationships among the conceptual sub-models of the DX A/C system is shown in Figure 3. Before solving the developed dynamic model, the geometrical parameters and initial values of various operating parameters at a steady-state point were required to be input to the model. The white-box-based dynamic model was solved initially from the evaporator and condenser sub-models. For the evaporator sub-model, the mass flow rate and enthalpy of the refrigerant entering the evaporator from the EEV sub-model, the refrigerant mass flow rate leaving the evaporator from compressor sub-model and air state entering the evaporator from conditioned space sub-model were known at the present time step. By numerically solving the evaporator sub-model, various operating parameters at next time step could be obtained, such as the liquid refrigerant volume inside the evaporator, Ve_l, saturated liquid refrigerant enthalpy, hre_l, vapor refrigerant enthalpy leaving the evaporator, hre_out, air state entering the conditioned space, etc. Following a similar solving procedure, after knowing the refrigerant mass flow rate and enthalpy entering the condenser, and the mass flow rate leaving the condenser at present time step, the various operating parameters of the condenser at next time step could be calculated through solving the condenser sub-model. When both heat exchangers sub-models were solved, the refrigerant mass flow rate and enthalpy leaving the compressor, and the those leaving the EEV could be updated by solving the compressor and EEV sub-model, respectively. The whole numerical solution process was then not stopped until the simulation time was satisfied with the required one.

3. Model Validation

Using a real DX A/C system, the developed white-box-based dynamic model could be experimentally validated by comparing the predicted results with the measured ones. The experimental system used in the current study was described in a previous study including its configuration and instrumentation [12], and thus it is not detailed in this section. For model validation, two sets of experiments were carried out, one for verifying the predicted transient responses and the other for testifying the predicted steady-state operating characteristics.
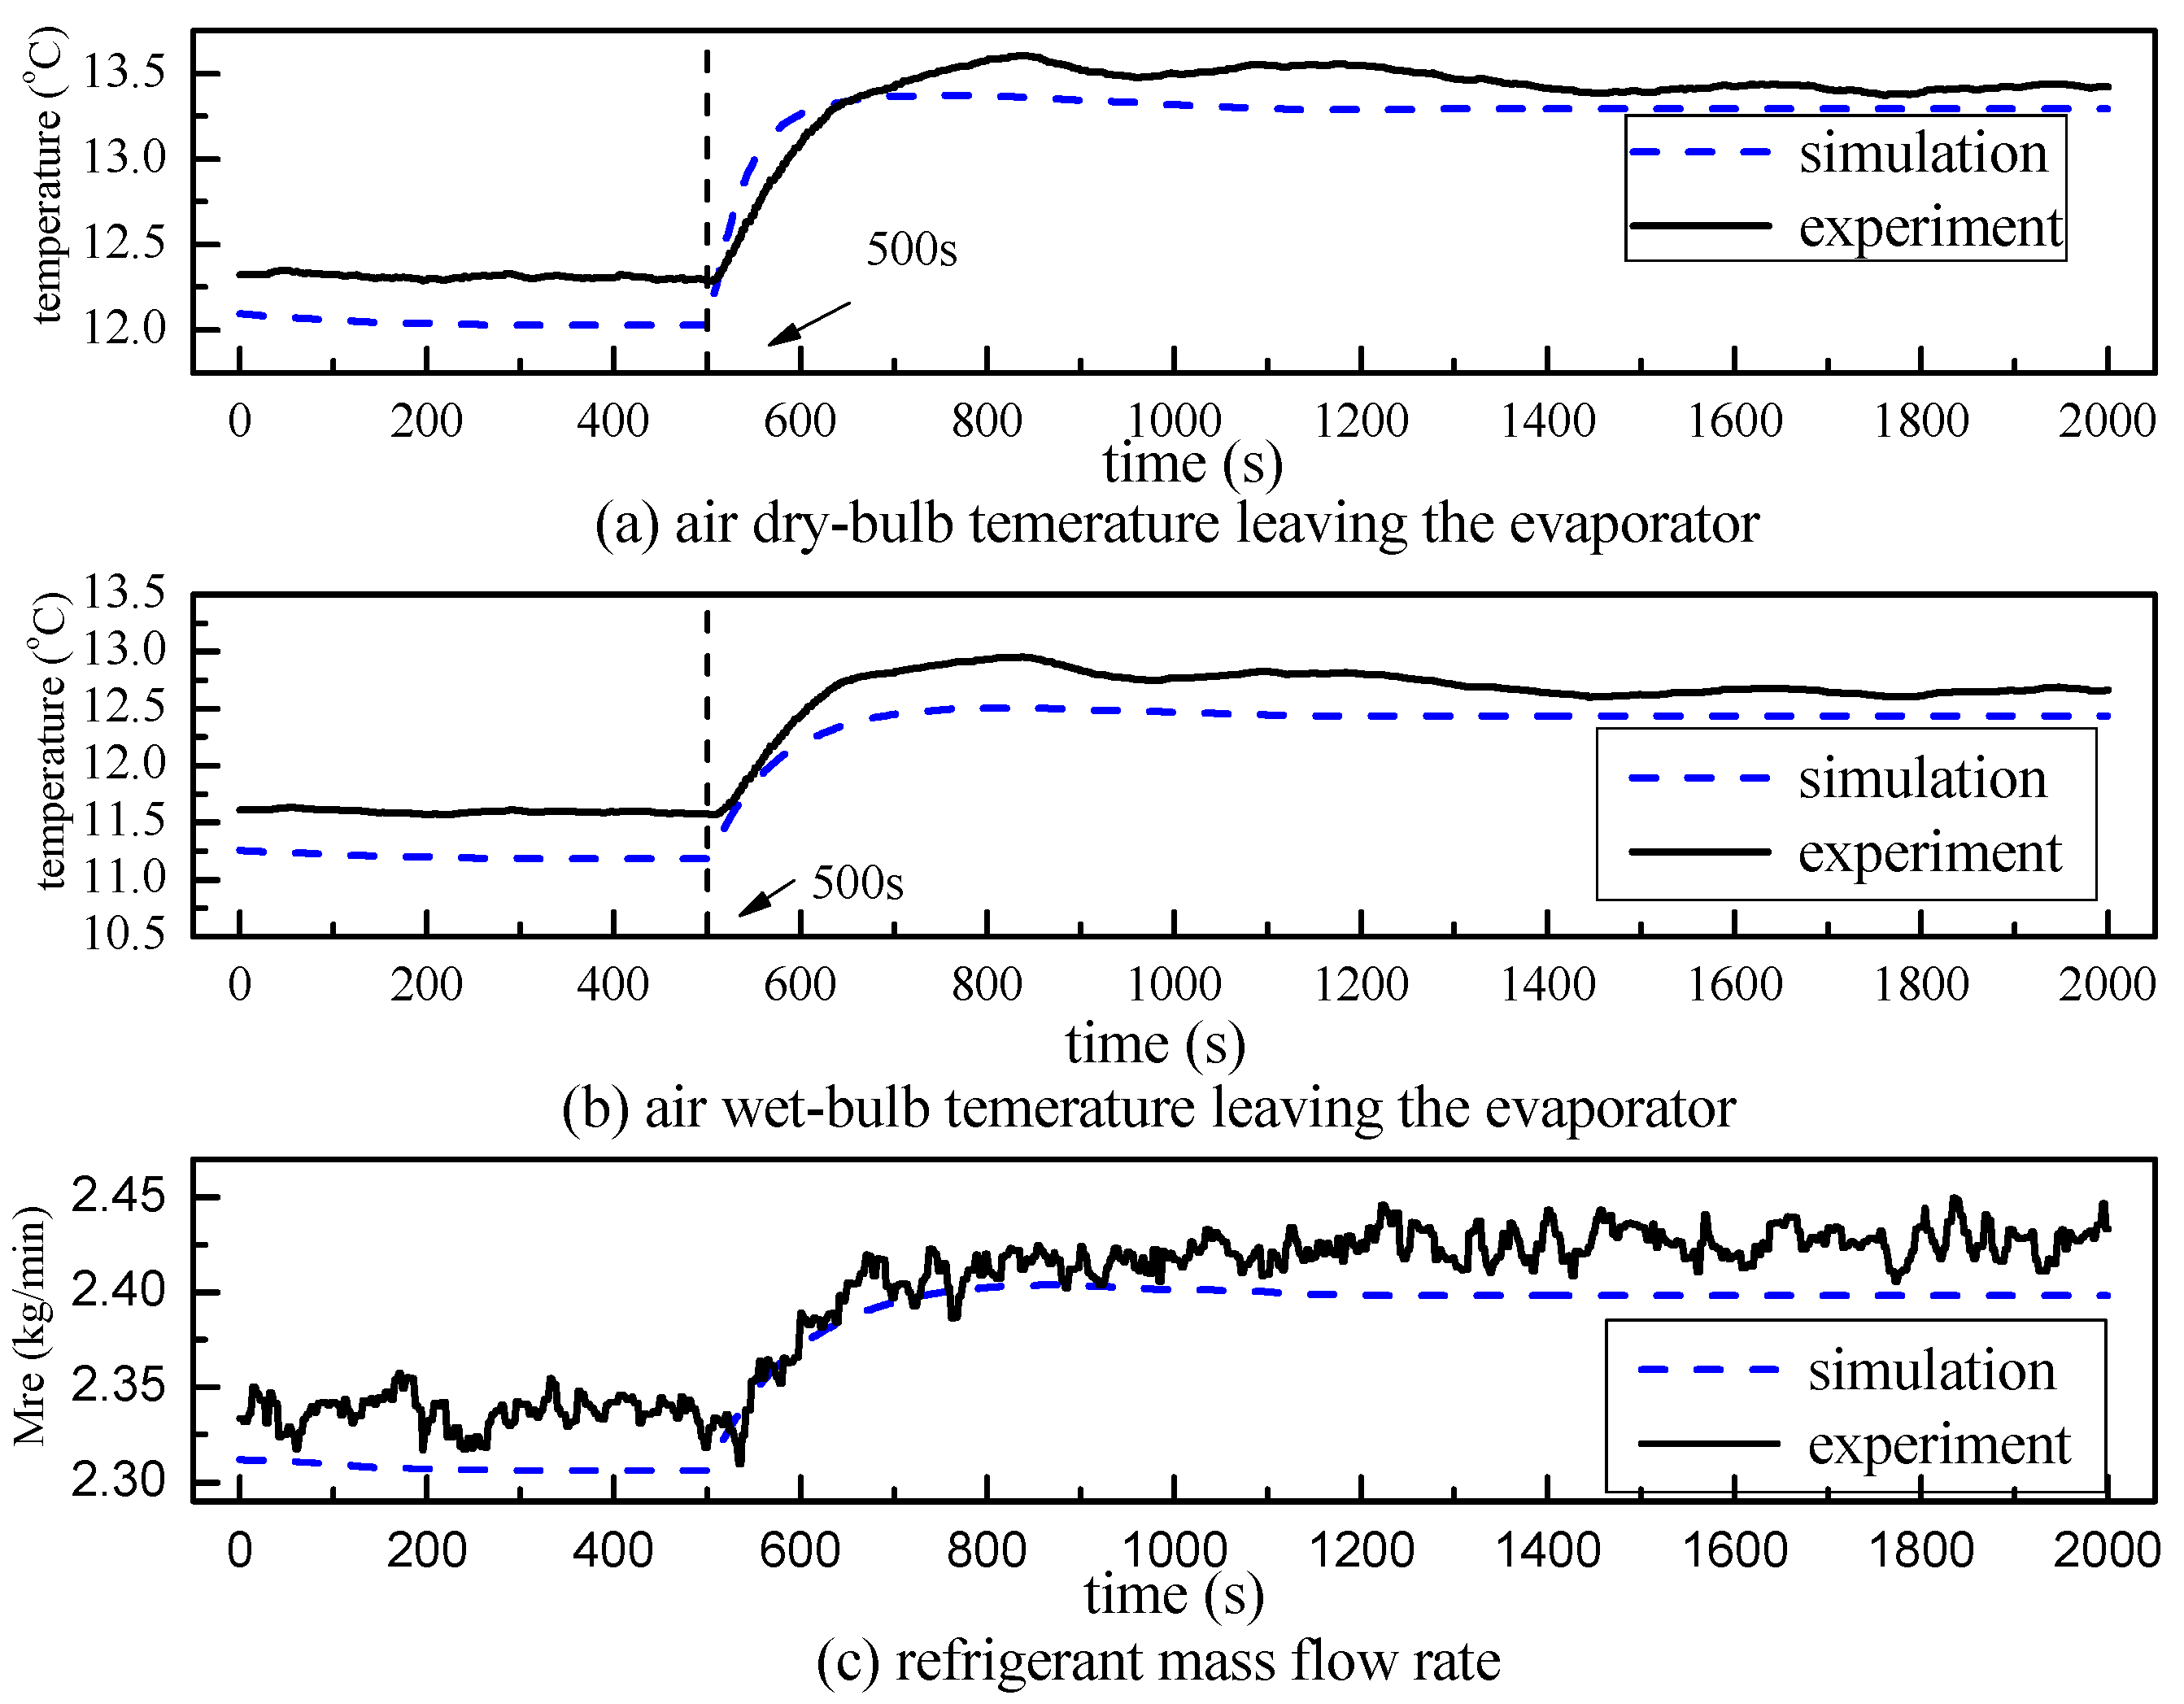
In the first set of experiments, the inlet air state entering the DX evaporator was maintained at 26 °C and 60%, respectively. The opening of EEV was regulated by a conventional proportional-integral (PI) controller, and the set point of the DS was at 6 K. During the experiments, the compressor speed and supply fan speed were, respectively, maintained at 3960 and 2736 rpm at first. Then, a sudden change of the supply fan speed to 3312 rpm was implemented at 500 s. The validation results for both measured and predicted open-loop responses are shown in Figure 4. The comparison results indicate that the predicted responses for various operating parameters agreed well with the measured ones, demonstrating the white-box-based dynamic model developed was able to capture the transient behavior of the DX A/C system.
The output sensible cooling capacity (SCC) and latent cooling capacity (LCC) of a DX A/C system are the two important parameters indicating its cooling and dehumidification capacities. Therefore, the steady-state operating characteristics in terms of the measured values of SCC and LCC under different compressor and supply fan speeds were also compared to the predicted ones. For the second set of experiments, the compressor speed and supply fan speed were initially fixed at certain values. Then, the load generation unit in the conditioned space was programmed so that the indoor air temperature and humidity could be maintained at 26 °C and 60%, respectively. After the DX A/C system reached a steady state, all operating parameters were recorded for subsequent analysis. Finally, the compressor and supply fan were modulated to another speed combination, and the same procedure was continued until the speed combinations reached the pre-set ones. The SCC and LCC could be evaluated by
SCC = C p a ρ a V e a . ( T e a _ i n T s a _ o u t )
LCC = ρ a V e a . ( h e a _ i n h s a _ o u t ) SCC
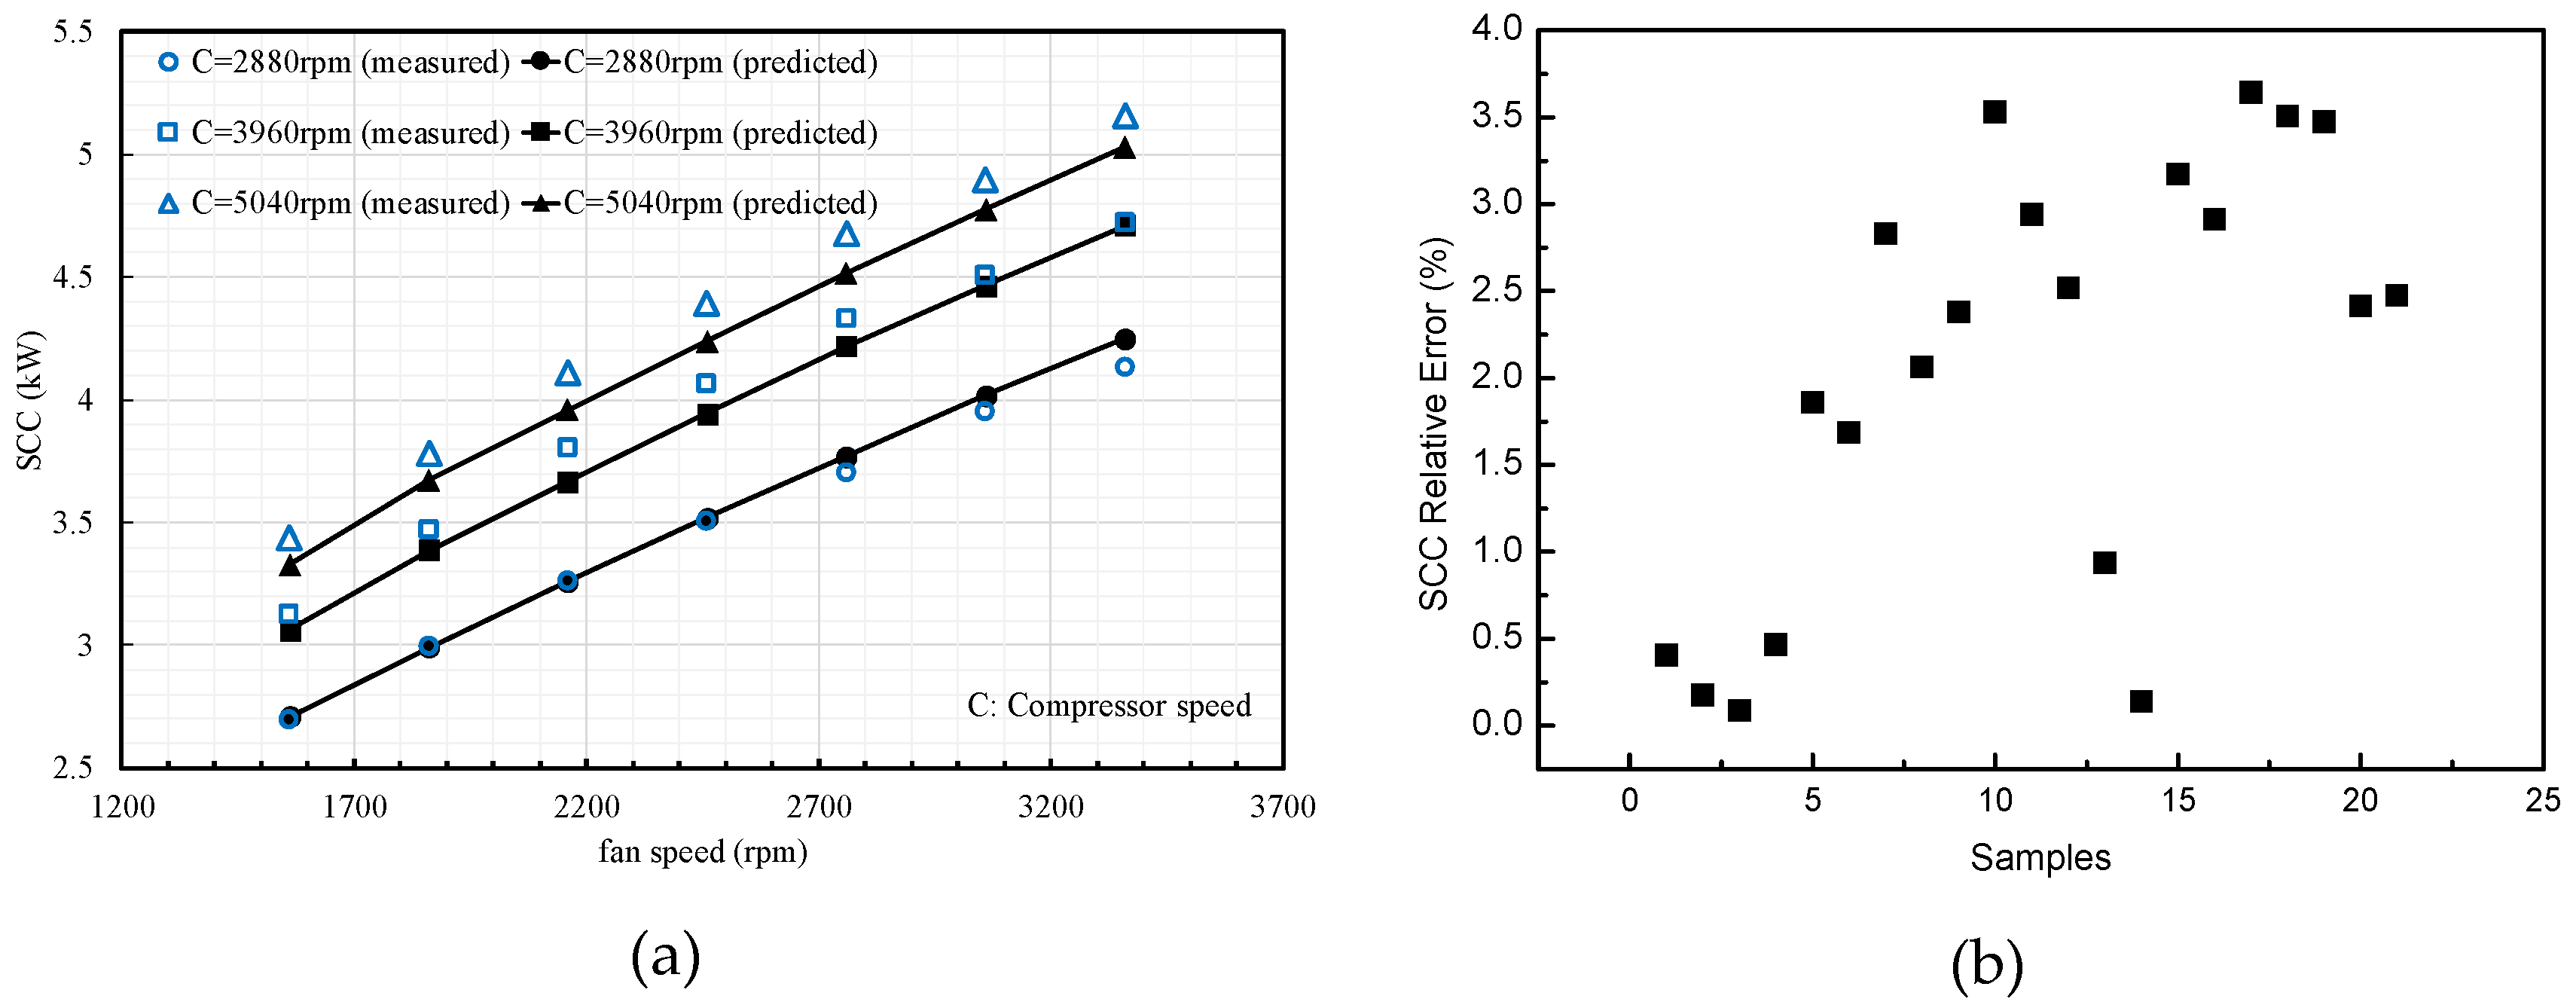
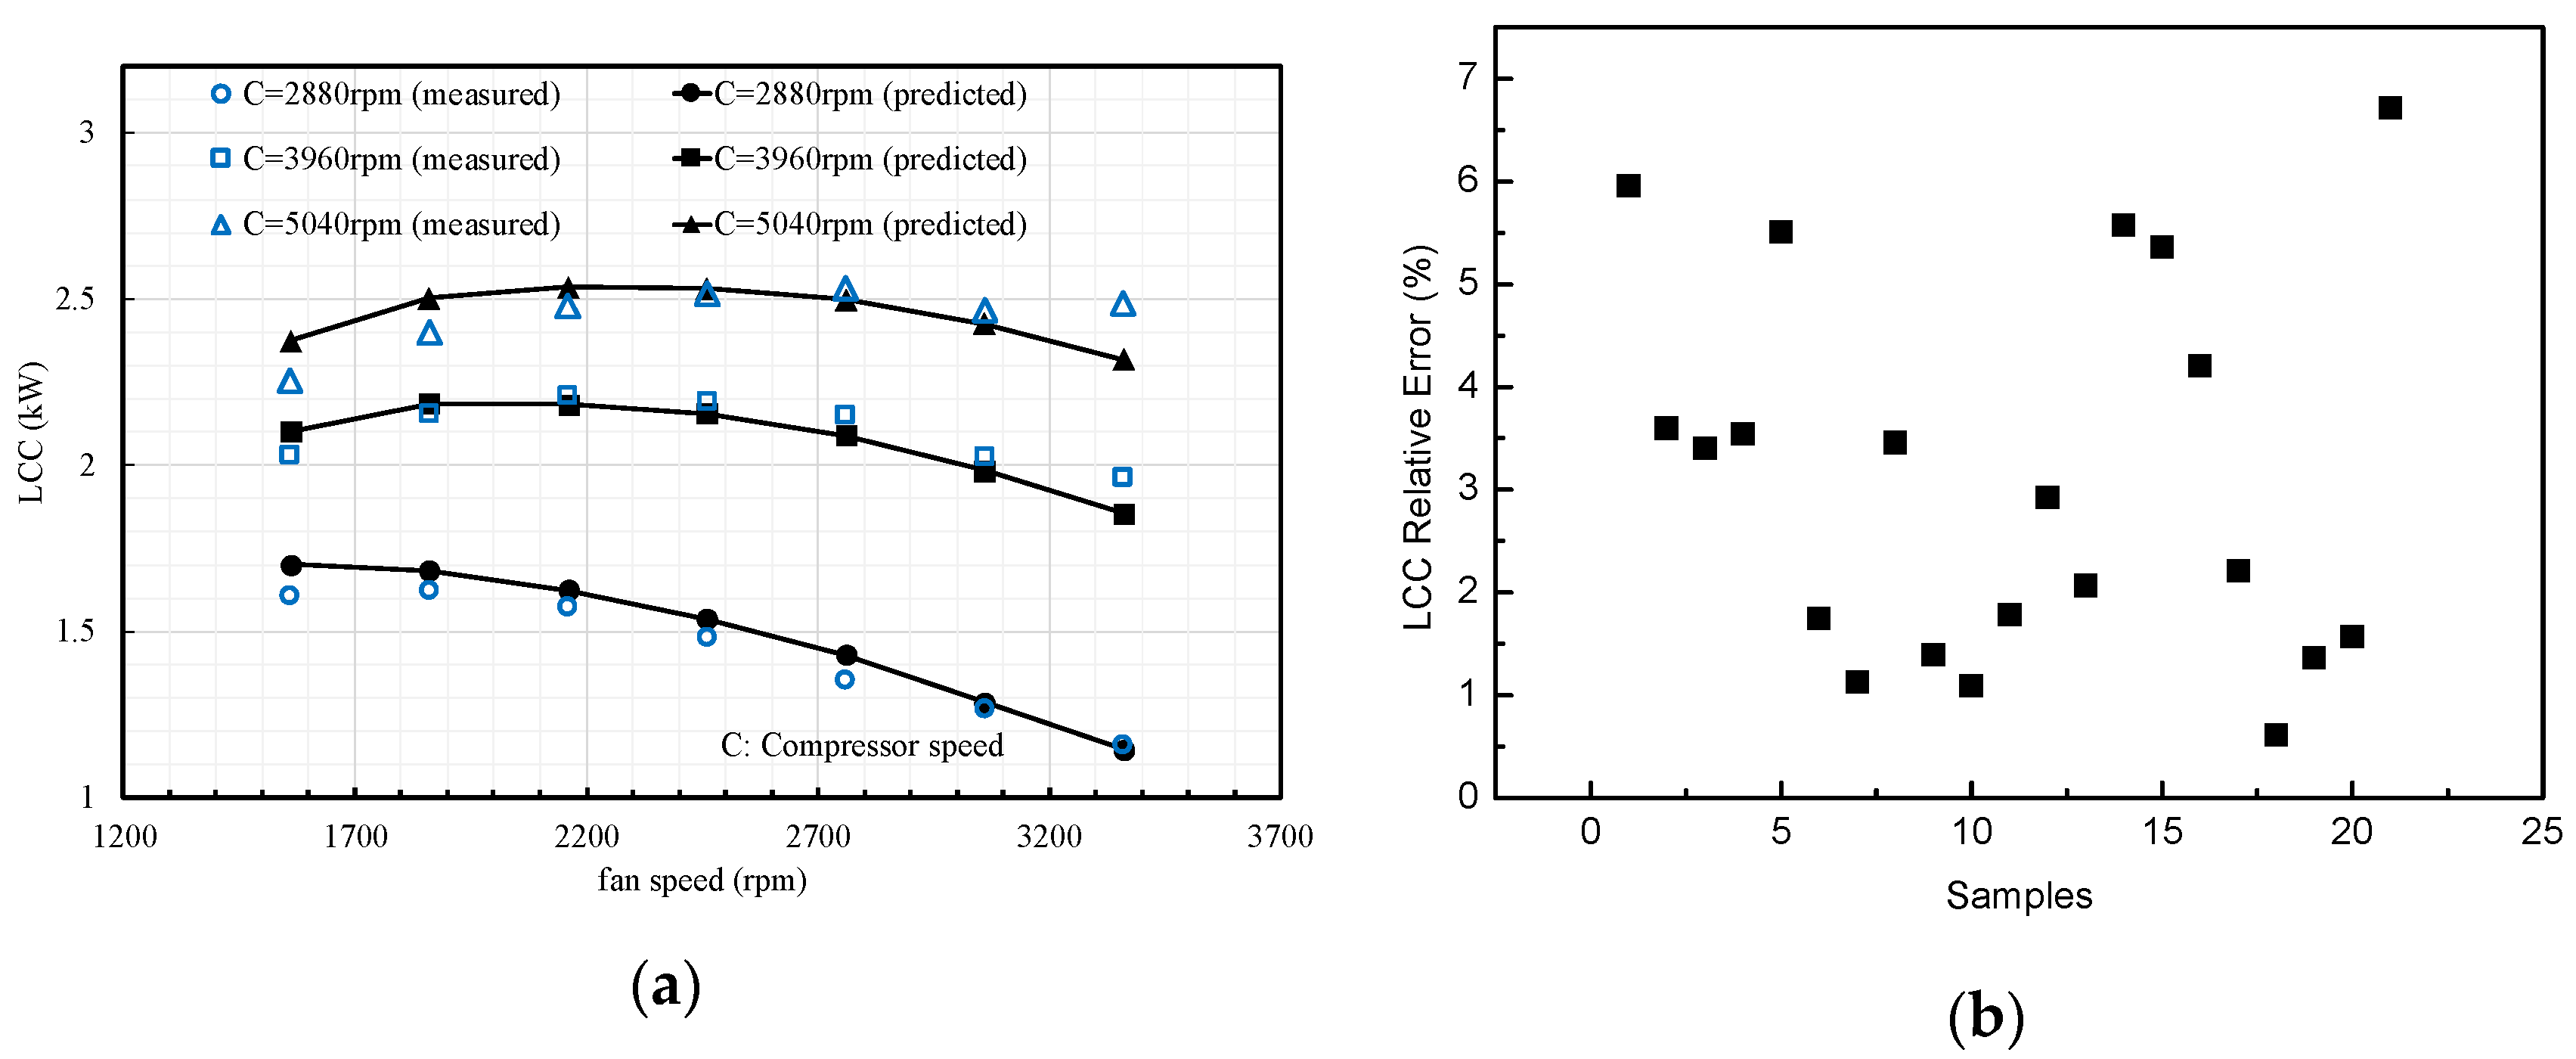
The validation results are shown in Figure 5 and Figure 6. The predicted operating characteristics in terms of SCC and LCC under various compressor and supply fan speeds agreed well with the measured ones. The average relative errors for SCC and LCC were evaluated at 3.1% and 3.2%, respectively. In addition, the maximum relative errors for SCC and LCC were evaluated at 3.6% and 6.7%, respectively. The validation results indicate that the white-box-based dynamic model had a reasonable accuracy when predicting the transient and steady-state operating characteristics of the DX A/C system.

4. Operating Performance Prediction under Various Operational Conditions

To further investigate the operating performance of the DX A/C system under various operational conditions, more simulation cases, as listed in Table 2, were performed. It should be pointed out that in all simulations the inlet air temperature and humidity were, respectively, fixed at 26 °C and 50%. While different inlet air states would influence the operating performance of the DX A/C system, the general variation trends observed and the related analysis should remain valid.

4.1. Relationships between SCC and LCC under Variable Speed Operation

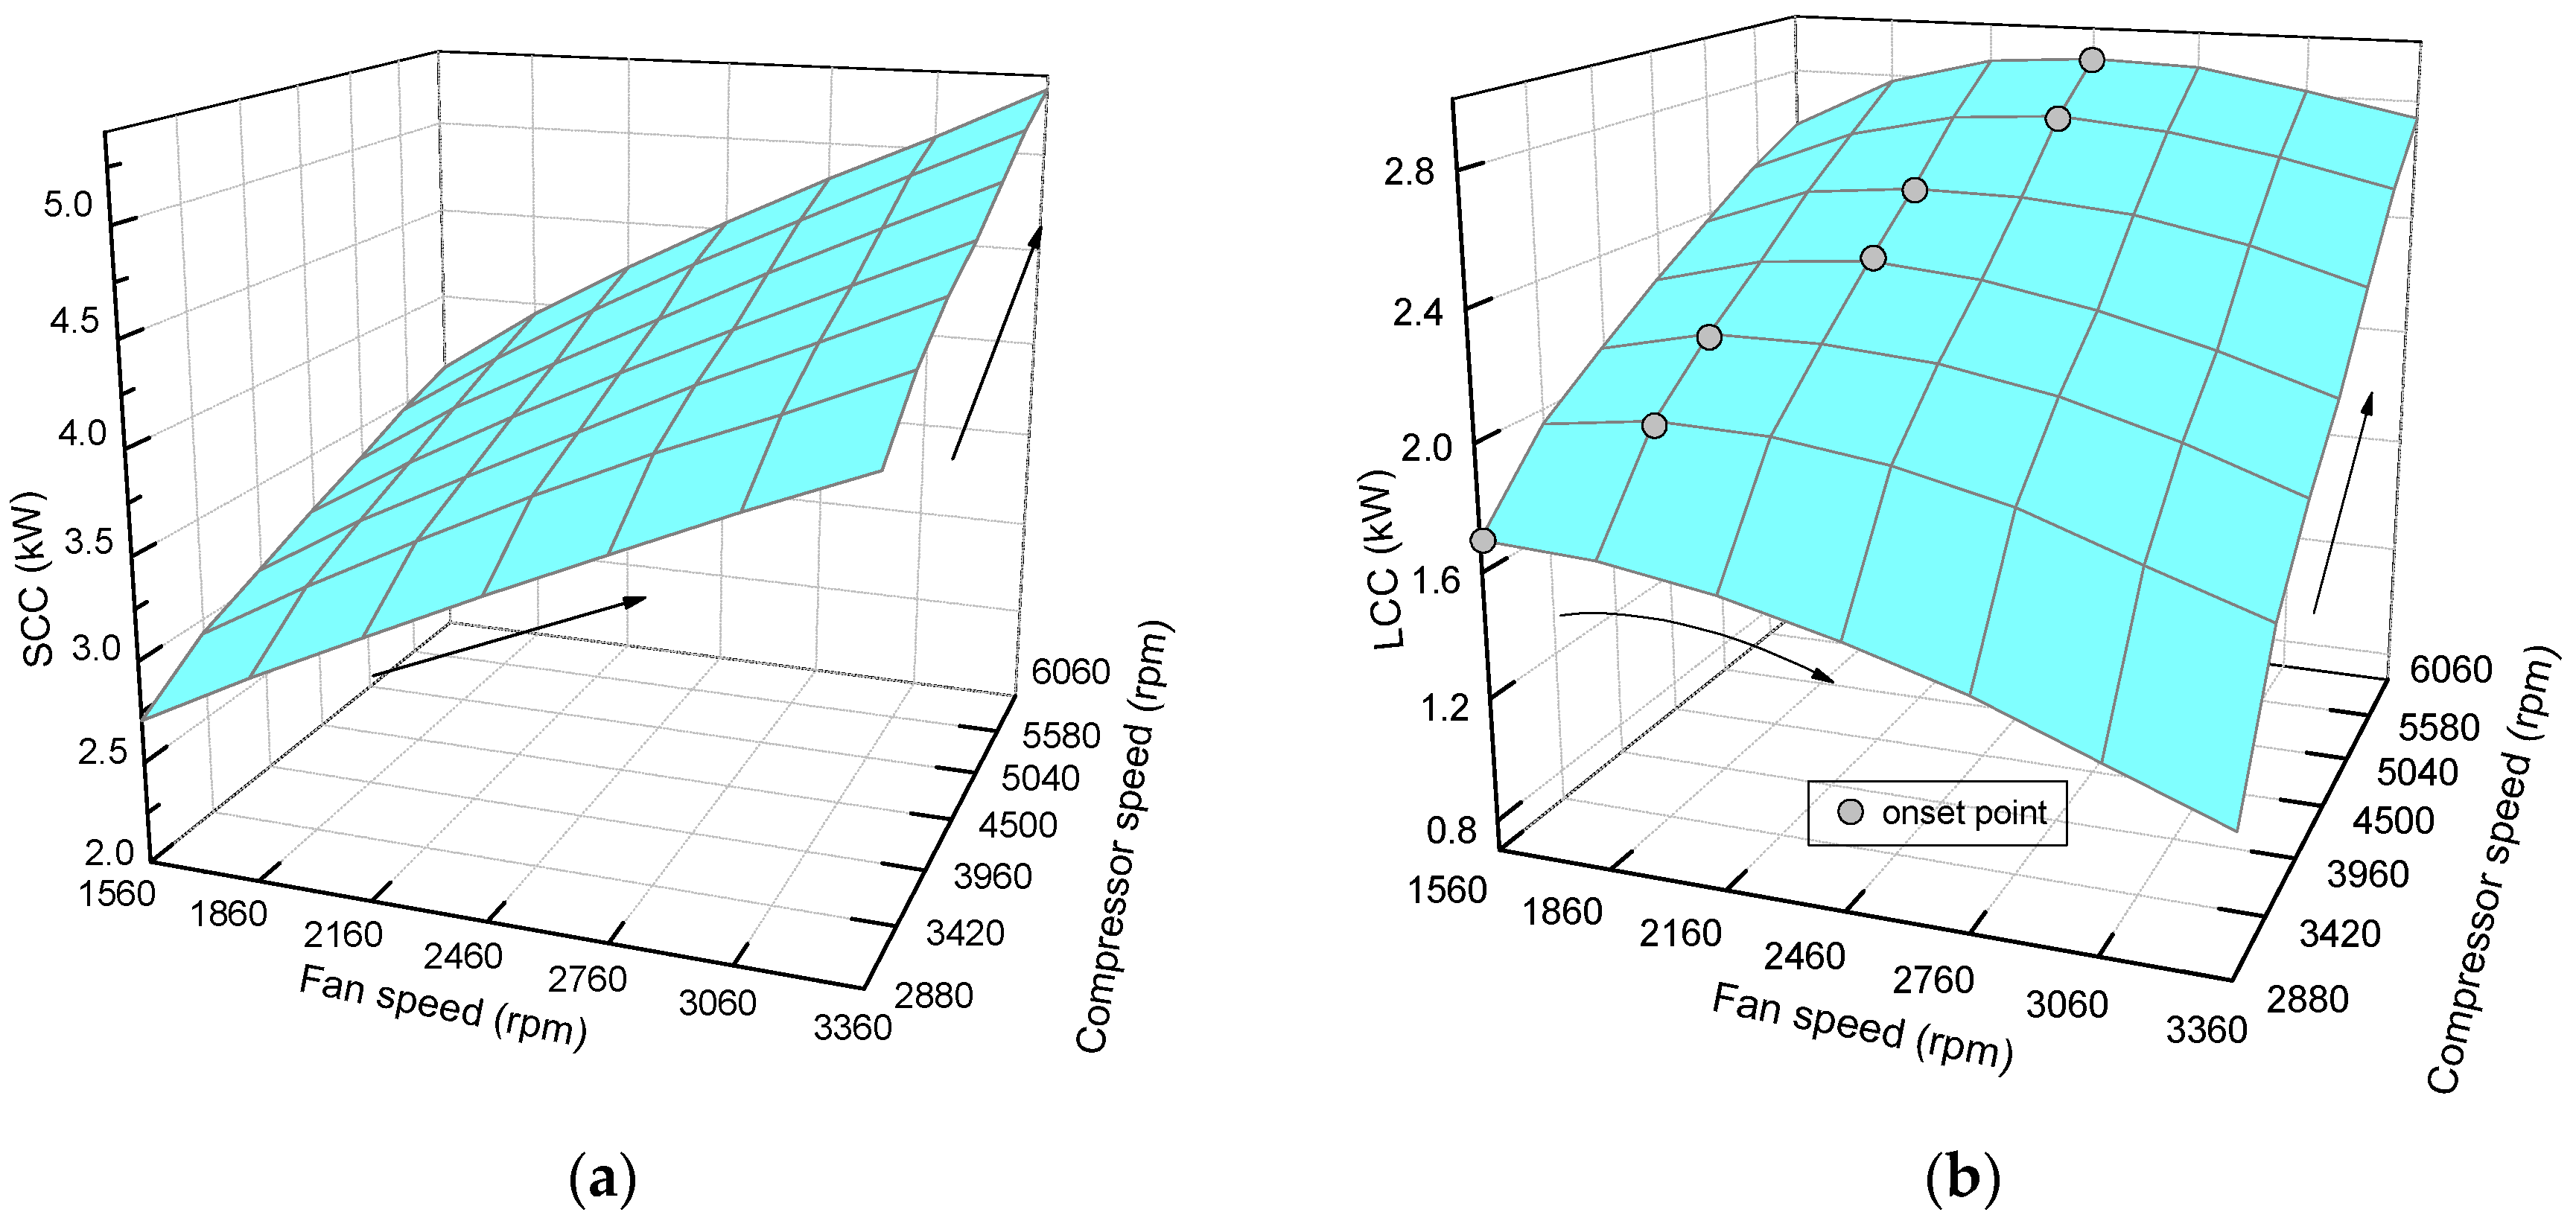
Figure 7 shows the inherent relationships between the output SCC and LCC of the modeled DX A/C system when the compressor speed was varied from 2880 to 6060 rpm and fan speed from 1560 to 3360 rpm. As shown in Figure 7a, the output SCC increased as rising the supply fan or compressor speed. The maximum output SCC could be achieved at 5.33 kW when both the fan and compressor speeds arrived their respective maximum value, namely 3360 rpm fan speed and 6060 rpm compressor speed. The minimum output SCC was 2.71 kW when the DX A/C system was operated at 1560 rpm fan speed and 2880 rpm compressor speed. It could be concluded that the output SCC can be regulated from 2.71 to 5.33 kW by varying both compressor and supply fan speeds. However, the tendency of output LCC under different compressor and supply fan speeds was different, as shown in Figure 7b. At a specific fan speed, a larger output LCC could be achieved when the system was operated at a higher compressor speed. At a given compressor speed, output LCC increased at first and then decreased while raising the supply fan speed. There existed an onset point of output LCC indicating the maximum dehumidification capacity as increasing supply fan speed, and onset point increased at a higher compressor speed. This was because, at a given compressor speed, increasing the supply fan speed would directly increase the refrigerant mass flow rate circulated in the DX A/C system, and consequently a larger output cooling capacity for both cooling and dehumidification. When the output LCC reached its maximum, further increasing the supply fan speed would lower the LCC as a higher evaporator surface temperature would result at a higher supply fan speed. The maximum output LCC was 2.90 kW at the speed compressor of supply fan and compressor at 2460 and 6060 rpm, respectively, and the minimum one was 1.15 kW at 3360 and 2880 rpm, respectively. Therefore, the output LCC could be modulated ranging from 1.15 to 2.90 kW through simultaneously varying compressor and supply fan speeds.

4.2. Improved Inherent Operating Performance in Terms of TCC E SHR and COP of the DX A/C System

As mentioned in the Introduction, TCC and E SHR are two important parameters that can be used to demonstrate cooling and dehumidification capacities of a DX A/C system. Therefore, the relationship between TCC and E SHR under variable speed operation of the DX A/C system was examined. TCC and E SHR could be easily evaluated as
TCC = SCC + LCC
E   SHR = SCC / ( SCC + LCC )
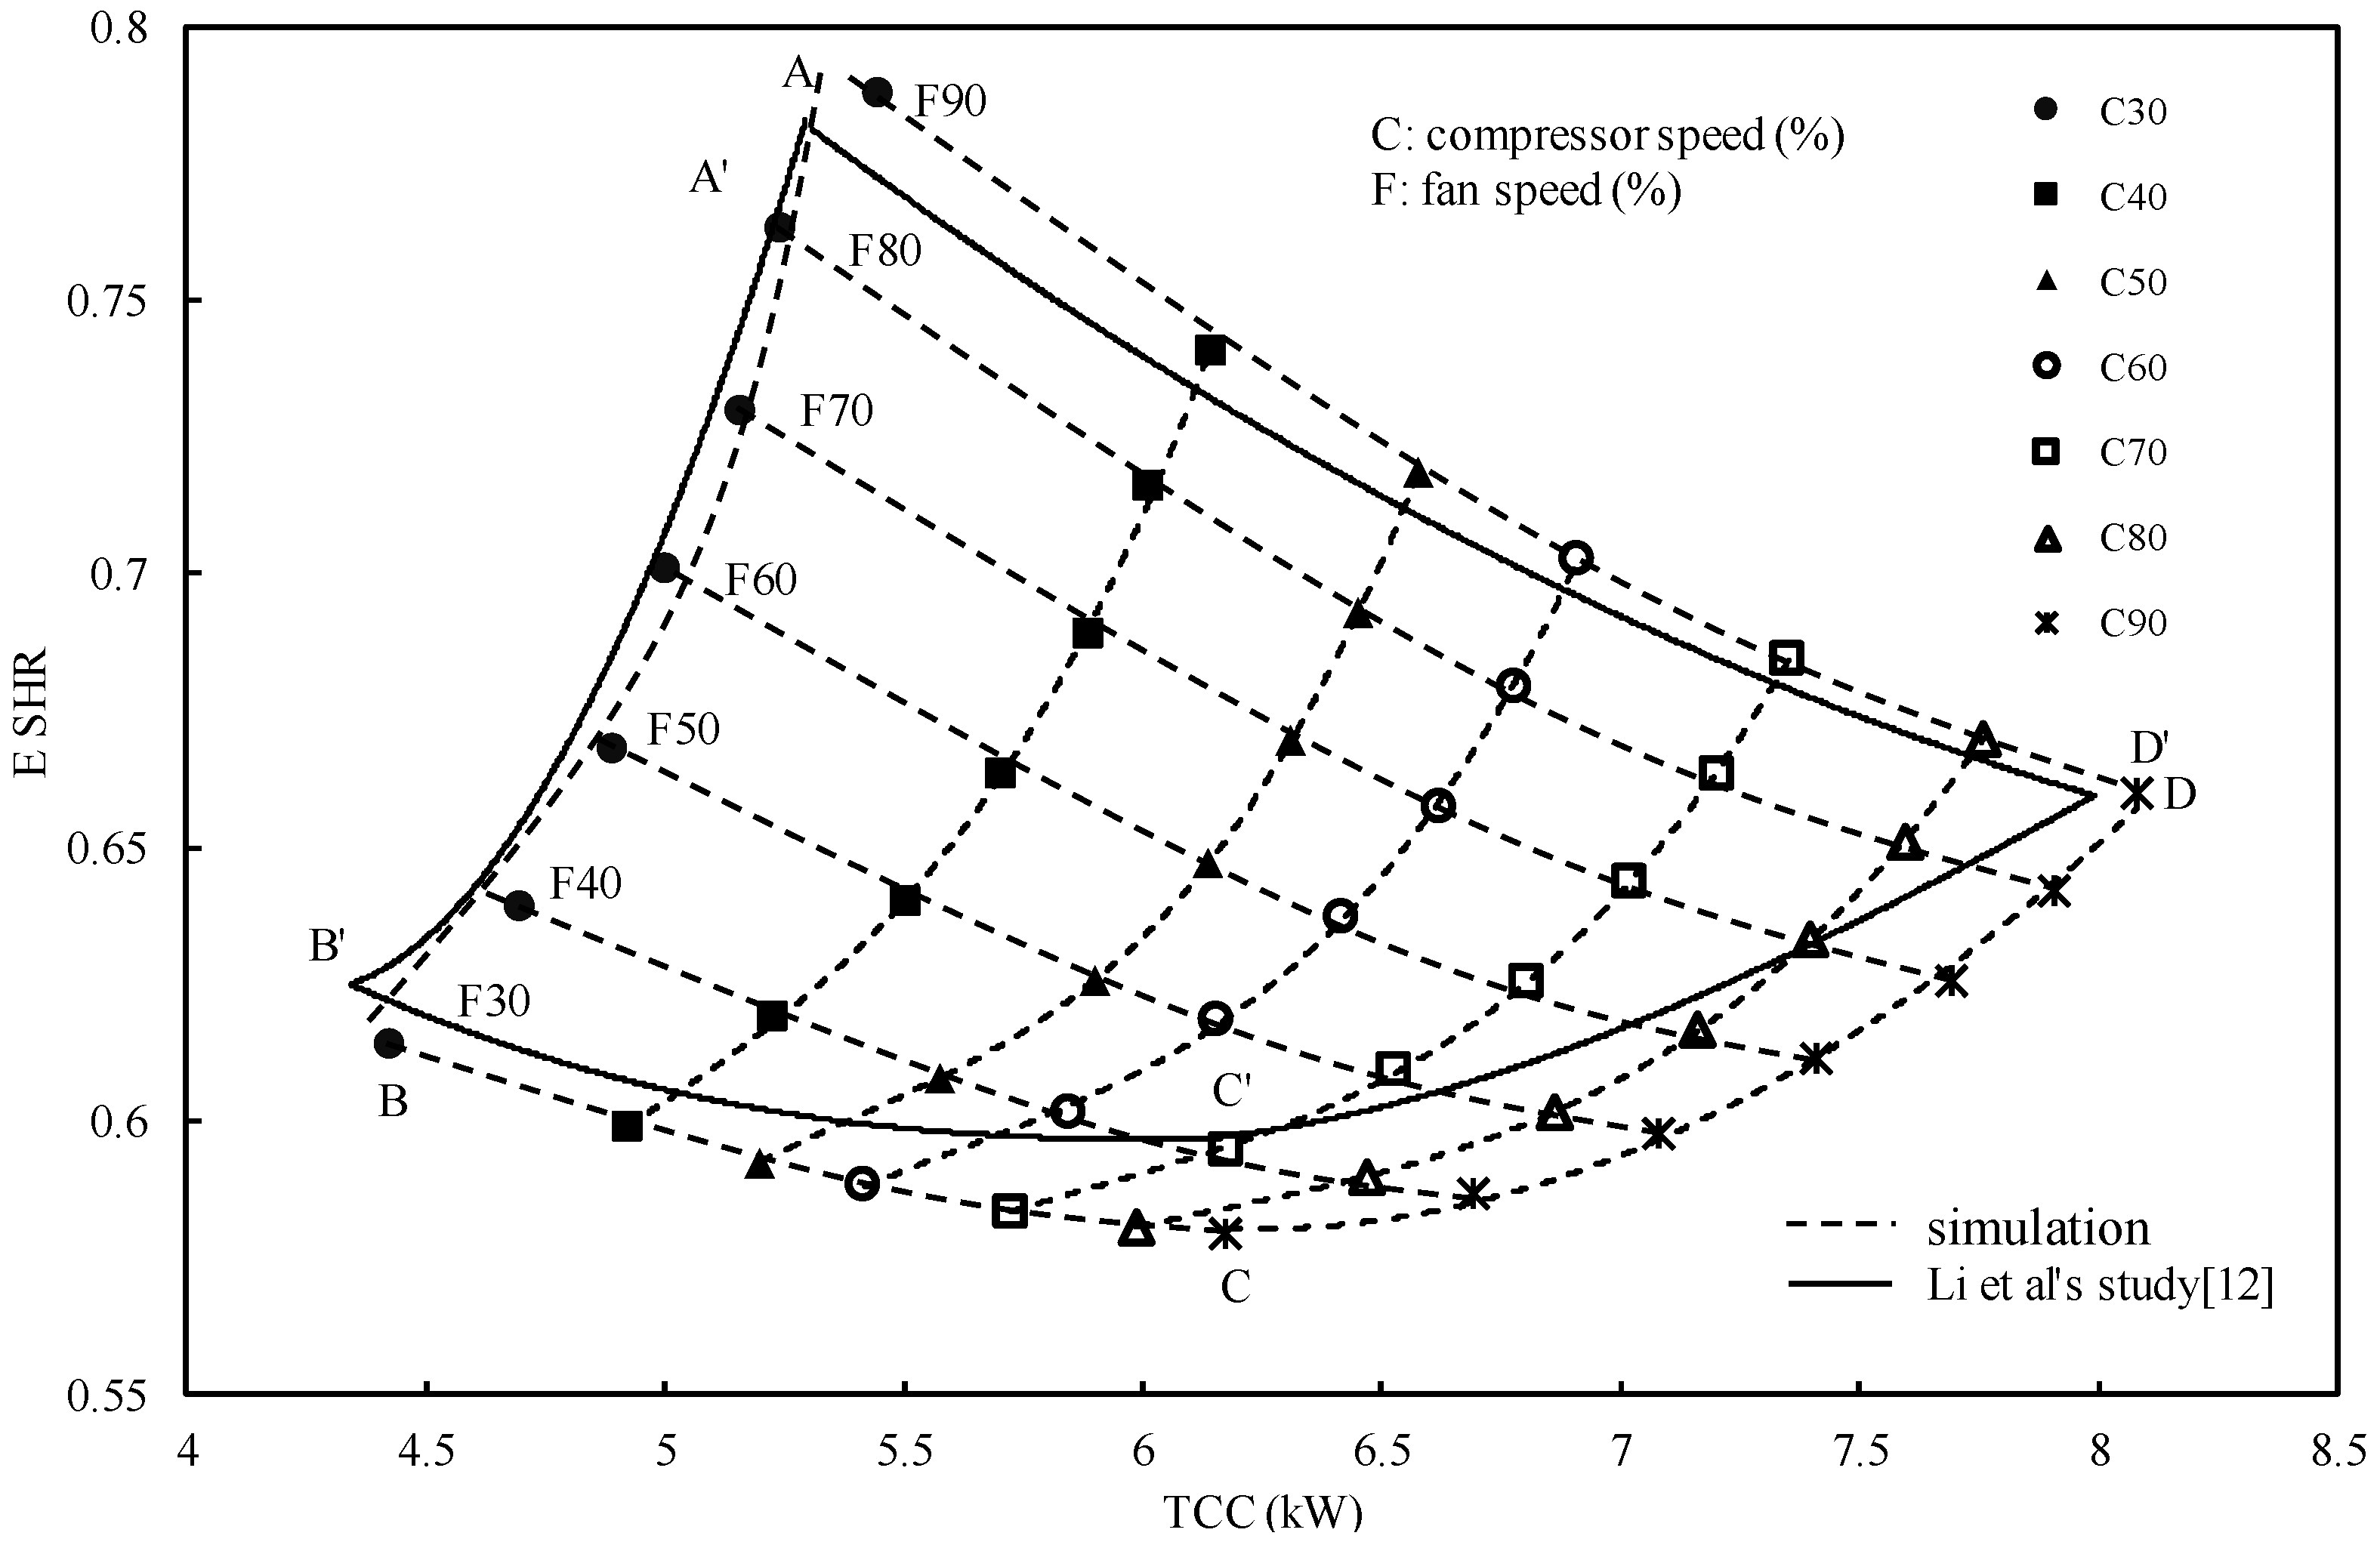
The simulated inherent operating characteristics in terms of TCC–E SHR combinations under various operational conditions are shown in Figure 8. The experimental results from the previous study [12] are also presented in the same diagram. Increasing compressor speed or supply fan speed would cause a rise in the output TCC, and thus more cooling load in the conditioned space could be dealt with at a higher compressor or supply fan speed. On the other hand, a smaller E SHR may result in at a lower supply fan speed or a higher compressor speed, demonstrating a larger latent cooling capacity, and thus a better dehumidification capacity. This was because a higher compressor or a lower supply fan speed would lead to a lower evaporating temperature, and consequently a lower evaporator surface temperature, which would be beneficial for air dehumidification.
The output TCC and output E SHR under different speed combinations were coupled and mutually constrained within the trapezoid ABCD. The simulated TCC-E SHR trapezoid ABCD agreed well with the trapezoid A’B’C’D’ from the previous study [12], except for the points located at the bottom of the trapezoid. This may be due to the fact that, during experimentation, when the DX A/C system was operated at the bottom of the trapezoid with a low supply fan speed and a high compressor speed, it would lead to a relatively low evaporator surface temperature. It may eventually cause the frosting on the evaporator surface, and thus deteriorate its dehumidification capacity. However, it was not accounted for in the developed model. It could be concluded that, if the total cooling load and application SHR are located within the TCC-E SHR trapezoid, it is possible to satisfy the sensible and latent cooling loads required through varying compressor speed and supply fan speed, and thus the indoor air temperature and humidity can be maintained. The simulation results also show that the developed white-box-based dynamic model was able to capture the steady-state operating performance of the DX A/C system under various operational conditions.
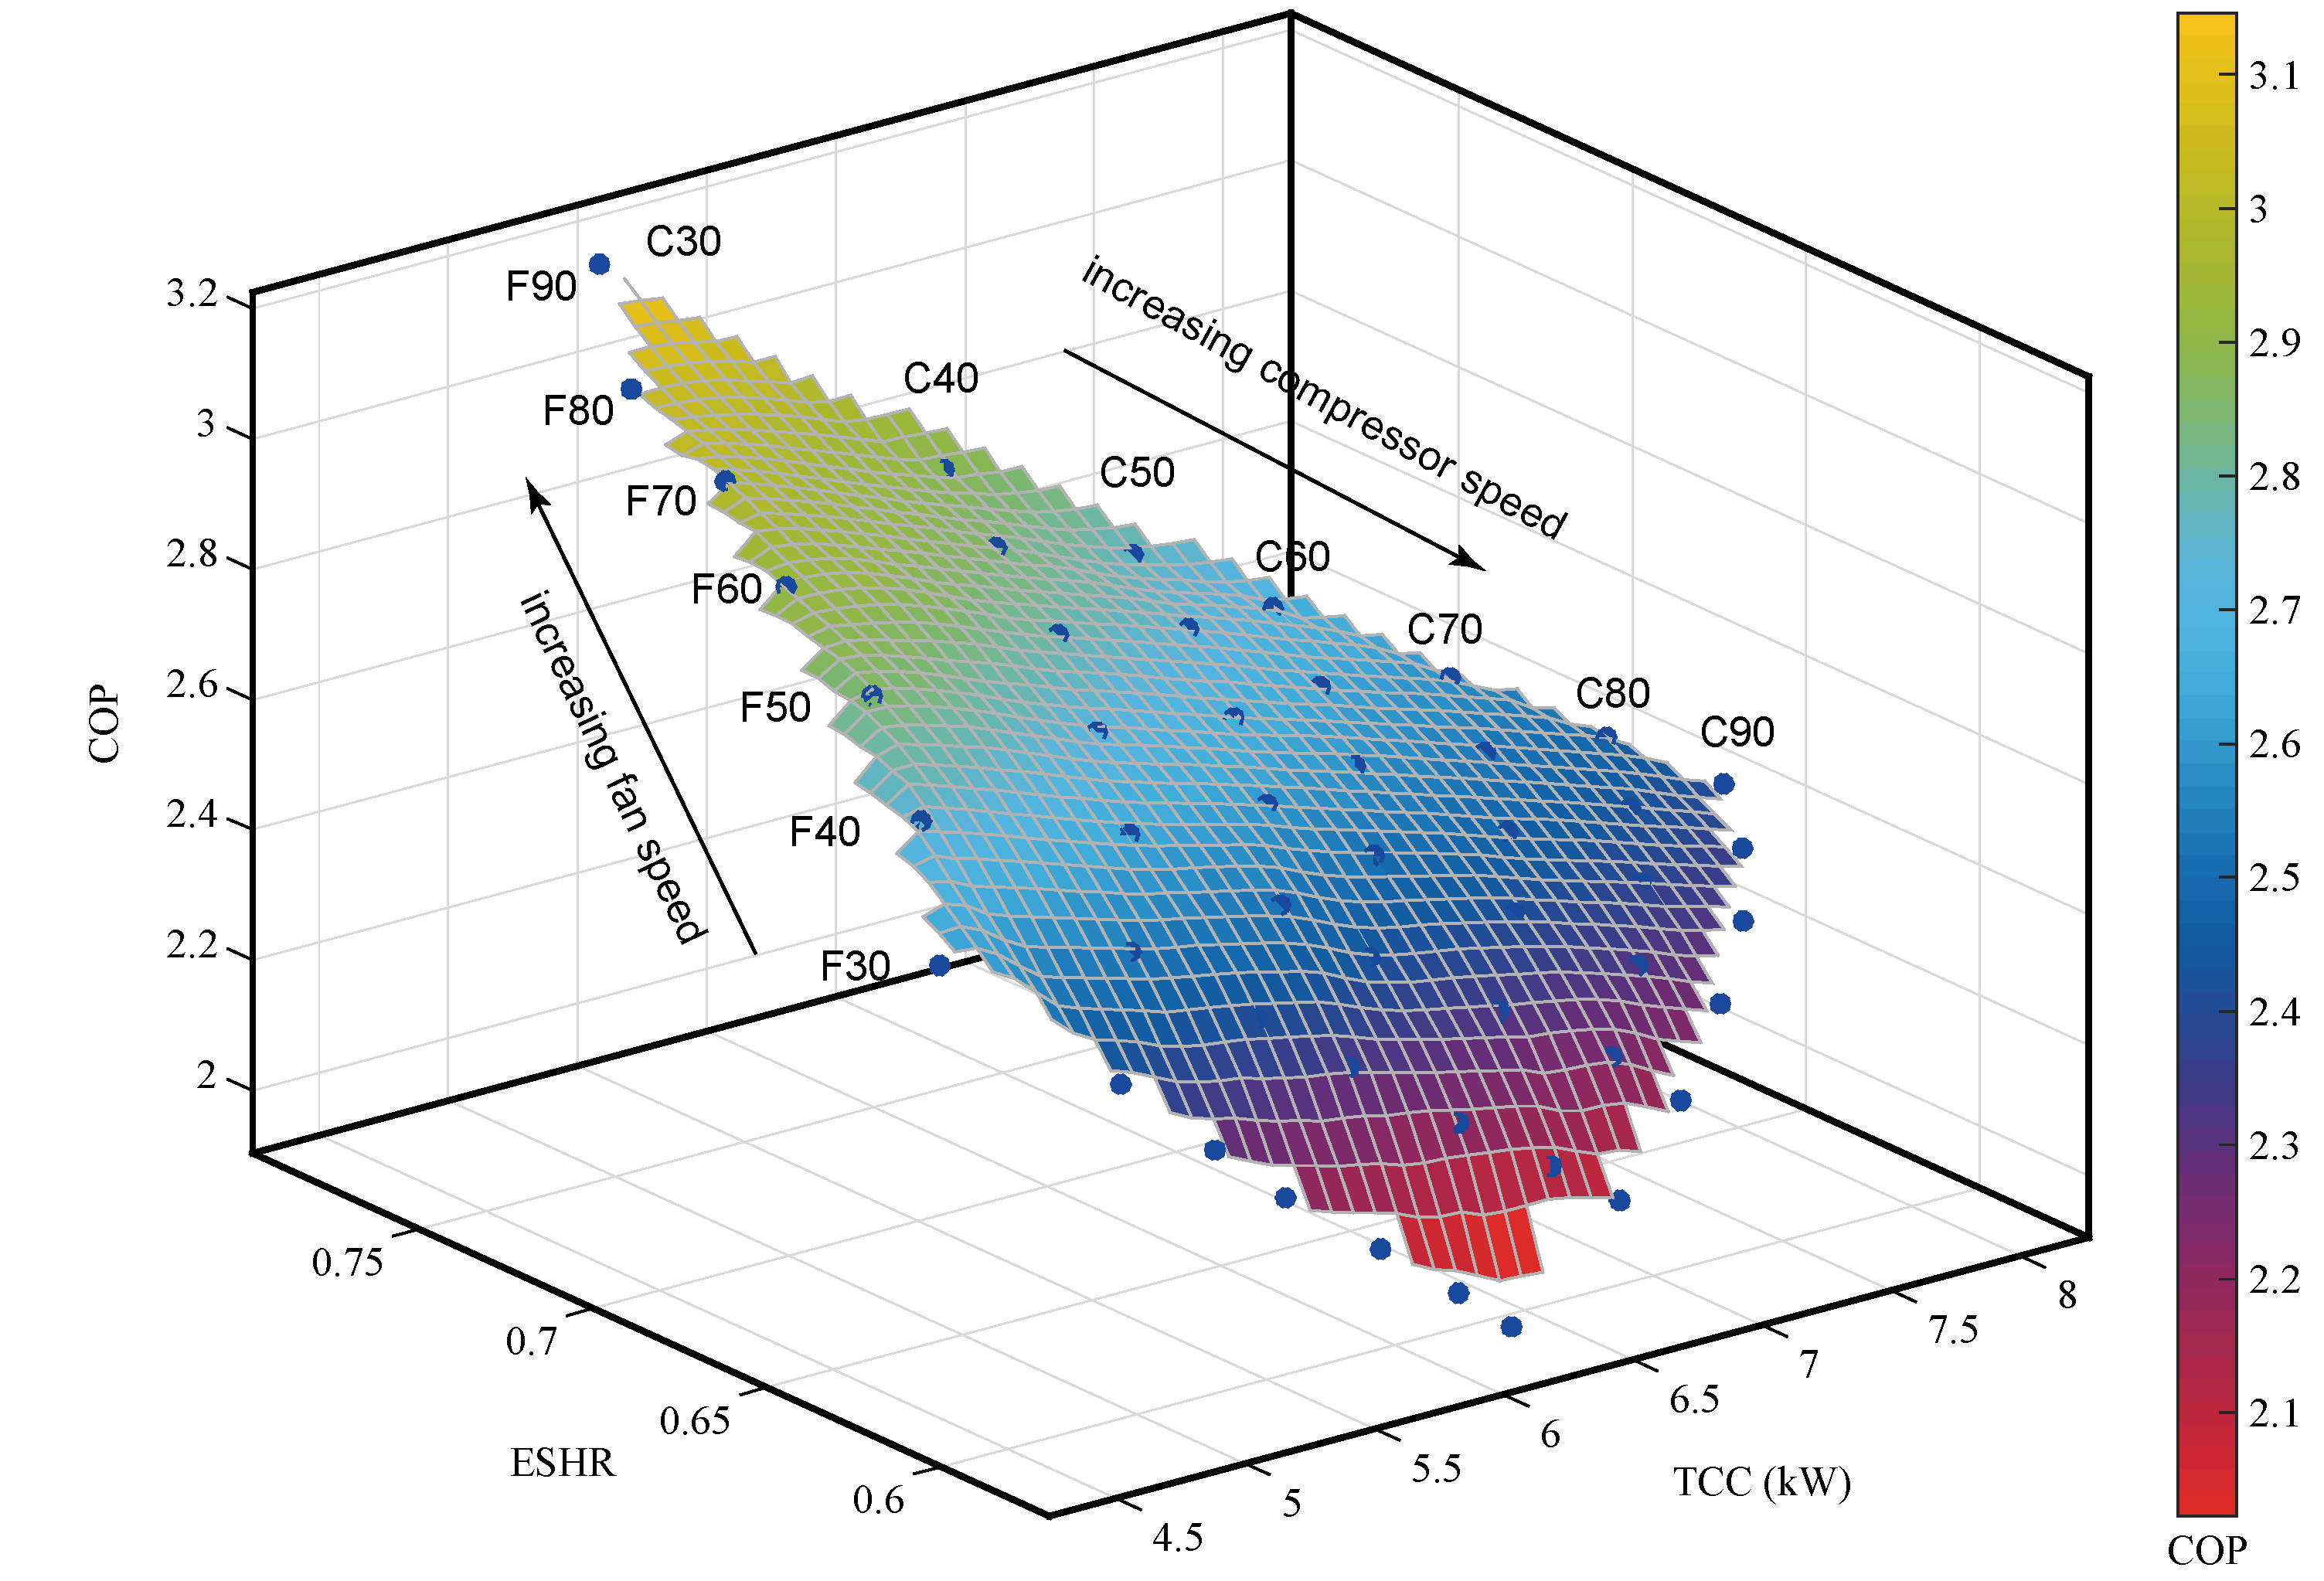
On the other hand, as mentioned in the Introduction, while the relationship between TCC and E SHR under different speed combinations of compressor and supply fan have been extensively explored [10,11,12], operating efficiency of the system expressed in terms of COP is not considered. Therefore, to further examine the operating performance under various operational conditions, the COP of the DX A/C system was also evaluated and presented in the same diagram with TCC and E SHR. The improved inherent correlation among TCC E SHR and COP is schematically shown in Figure 9. A better operating performance expressed in terms of a higher system COP would be obtained by increasing the compressor speed or decreasing the compressor speed. The maximum COP could be achieved at the top of the TCC-E SHR trapezoid with speed combination of C30 and F90, and the lowest COP at the bottom of the TCC-E SHR trapezoid with speed combination of C90 and F30. This was due to the fact that both increasing supply fan speed and decreasing compressor speed would cause a higher evaporating temperature, and thus a higher COP of the system. The highest and lowest values of COP were 3.17 and 2.40, respectively. Considering the fact that lowering the fan speed and increasing compressor speed would be beneficial for dehumidification, the operating performance in terms of COP would deteriorate subject to any disturbances that would cause the increase of the latent cooling load in the conditioned space.

5. Conclusions

In this paper, the development of a white-box-based dynamic model for a DX A/C system is reported and the study results for investigating the steady-state operating performance in terms of the correlation among TCC, E SHR and COP under variable speed operation are presented. For simplification, the white-box-based dynamic model for a DX A/C system was divided into five sub-models. Lumped-parameter approach was adopted when establishing a sub-model. Each sub-model was established by writing mass and energy balance equations. Using the experimental data acquired form a real system, model validation was carried out. The results show that both the transient responses and steady-state operating characteristics predicted agreed well with the experimental ones.
With the help of the validated dynamic model, the system operating performance under variable speed operation was examined. The results show that a higher fan speed or compressor speed gave a larger SCC. Increasing compressor speed would raise the output LCC, but lowering fan speed would increase output LCC. In addition, the correlation between TCC and E SHR under different speed combinations of compressor and supply fan also agree well with the previous study. Furthermore, the improved inherent correlation among TCC, E SHR and COP was also obtained. Simulation results indicate that a higher COP could be achieved when the system was operated at the top of TCC-E SHR trapezoid with a relatively high fan speed and low compressor speed. It could also be concluded that a lower required E SHR would lead to a poor operating performance in terms of a lower COP. The developed model and study results reported could be helpful for energy efficient DX A/C design and controller development.

Author Contributions

Conceptualization, methodology, validation, and investigation, Y.X.; writing—original draft preparation, Y.X.; writing—review and editing, Y.X. and Z.Z.; supervision, X.Z.; and project administration, S.J. All authors have read and agreed to the published version of the manuscript.

Funding

This research was funded by Natural Science Foundation of Zhejiang Province (Project No. LQ19E060007).

Conflicts of Interest

The authors declare no conflict of interest.

Nomenclature

AArea, m2
V ˙ air flow rate, m3/s
Vvolume, m3
TTemperature, K
Ppressure, Pa
Wpower, W
Qheat transfer rate, W
henthalpy, J/kg
Cvflow coefficient
Kvvalve opening per unit of pulse out
Mmass, kg
Cpspecific heat, J/(kg·K)
U0overall heat transfer coefficient, W/(m2·K)
dmoisture content, g/kg
m ˙ r refrigerant mass flow rate, kg/s
lstroke of compressor cylinder, m
rradius of compressor rotor, m
uvpulse output of EEV
Greek Letters
αheat transfer coefficient, W/(m2 ·K)
εrelative eccentricity of rotor
λoverall displacement coefficient
ηindicated coefficient of compressor
ρdensity, kg/m3
Subscripts
aair side
rrefrigerant side
eevaporator
sconditioned space
wtube wall
lliquid
vvapor/valve
tptwo phase
shsuperheating
comcompressor
Abbreviations
A/Cair conditioning
ANNartificial neural network
DXdirect expansion
DSdegree of superheat, K
E SHRequipment sensible heat ratio
EEVelectronic expansion valve
TCCtotal cooling capacity
LCClatent cooling capacity
SCCsensible cooling capacity

References

  1. Monitor, C.M. The Report on China Residential Air Conditioner Market in 2017. Available online: http://www.monitor.com.cn/newsinfo.aspx?nid=3984 (accessed on 11 September 2020).
  2. Yang, K.H.; Lee, M.L. Analysis of an Inverter-Driven Air-Conditioning System and Its Application in a Hot and Humid Area. Int. J. Energy Res. 1991, 15, 357–365. [Google Scholar] [CrossRef]
  3. Qureshi, T.Q.; Tassou, S.A. Variable-speed capacity control in refrigeration systems. Appl. Therm. Eng. 1996, 16, 103–113. [Google Scholar] [CrossRef]
  4. Yan, H.; Xia, Y.; Xu, X.; Deng, S. Inherent operational characteristics aided fuzzy logic controller for a variable speed direct expansion air conditioning system for simultaneous indoor air temperature and humidity control. Energy Build. 2018, 158, 558–568. [Google Scholar] [CrossRef]
  5. Li, Z.; Xu, X.G.; Deng, S.M.; Pan, D.M. A novel neural network aided fuzzy logic controller for a variable speed (VS) direct expansion (DX) air conditioning (A/C) system. Appl. Therm. Eng. 2015, 78, 9–23. [Google Scholar] [CrossRef]
  6. Li, Z.; Xu, X.; Deng, S.; Pan, D. A novel proportional-derivative (PD) law based fuzzy logic principles assisted controller for simultaneously controlling indoor temperature and humidity using a direct expansion (DX) air conditioning (A/C) system. Int. J. Refrig. 2015, 57, 239–256. [Google Scholar] [CrossRef]
  7. Li, N.; Xia, L.; Deng, S.M.; Xu, X.G.; Chan, M.Y. On-line adaptive control of a direct expansion air conditioning system using artificial neural network. Appl. Therm. Eng. 2013, 53, 96–107. [Google Scholar] [CrossRef]
  8. Xia, Y.; Yan, H.; Deng, S.; Chan, M.-Y. A new capacity controller for a direct expansion air conditioning system for operational safety and efficiency. Build. Serv. Eng. Res. Technol. 2018, 39, 21–37. [Google Scholar] [CrossRef] [Green Version]
  9. Al-Azba, M.; Cen, Z.H.; Remond, Y.; Ahzi, S. An Optimal Air-Conditioner On-Off Control Scheme under Extremely Hot Weather Conditions. Energies 2020, 13, 1021. [Google Scholar] [CrossRef] [Green Version]
  10. Li, Z.; Deng, S.M. An experimental study on the inherent operational characteristics of a direct expansion (DX) air conditioning (A/C) unit. Build. Environ. 2007, 42, 1–10. [Google Scholar] [CrossRef]
  11. Xu, X.G.; Xia, L.A.; Chan, M.Y.; Deng, S.M. Inherent correlation between the total output cooling capacity and equipment sensible heat ratio of a direct expansion air conditioning system under variable-speed operation. Appl. Therm. Eng. 2010, 30, 1601–1607. [Google Scholar] [CrossRef]
  12. Li, Z.; Xu, X.; Deng, S.; Pan, D. Further study on the inherent operating characteristics of a variable speed direct expansion air conditioning system. Appl. Therm. Eng. 2014, 66, 206–215. [Google Scholar] [CrossRef]
  13. Chen, W.; Chan, M.-y.; Weng, W.; Yan, H.; Deng, S. An experimental study on the operational characteristics of a direct expansion based enhanced dehumidification air conditioning system. Appl. Energy 2018, 225, 922–933. [Google Scholar] [CrossRef]
  14. Yang, L.; Yan, H.; Deng, S.; Li, W. An experimental investigation on the operational characteristics of a novel direct expansion based air conditioning system with a two-sectioned cooling coil. Int. J. Refrig. 2020, 118, 131–138. [Google Scholar] [CrossRef]
  15. Afram, A.; Janabi-Sharifi, F. Review of modeling methods for HVAC systems. Appl. Therm. Eng. 2014, 67, 507–519. [Google Scholar] [CrossRef]
  16. Beghi, A.; Cecchinato, L. A simulation environment for dry-expansion evaporators with application to the design of autotuning control algorithms for electronic expansion valves. Int. J. Refrig. 2009, 32, 1765–1775. [Google Scholar] [CrossRef]
  17. Rasmussen, B.P.; Alleyne, A.G. Dynamic Modeling and Advanced Control of Air Conditioning and Refrigeration Systems; Air Conditioning and Refrigeration Center, College of Engineering, University of Illinois: Urbana, IL, USA, 2006. [Google Scholar]
  18. Chen, W.; Deng, S.M. Development of a dynamic model for a DX VAV air conditioning system. Energy Convers. Manag. 2006, 47, 2900–2924. [Google Scholar] [CrossRef]
  19. Deng, S.M. A dynamic mathematical model of a direct expansion (DX) water-cooled air-conditioning plant. Build. Environ. 2000, 35, 603–613. [Google Scholar]
  20. Xia, Y.; Ding, Q.; Jiangzhou, S.; Zhang, X.; Deng, S. A simulation study on the operational stability of an EEV-controlled direct expansion air conditioning system under variable speed operation. Int. J. Refrig. 2019, 103, 115–125. [Google Scholar] [CrossRef]
  21. Chen, W.; Chan, M.-y.; Weng, W.; Yan, H.; Deng, S. Development of a steady-state physical-based mathematical model for a direct expansion based enhanced dehumidification air conditioning system. Int. J. Refrig. 2018, 91, 55–68. [Google Scholar] [CrossRef]
  22. Kim, J.-H.; Seong, N.C.; Choi, W. Modeling and Optimizing a Chiller System Using a Machine Learning Algorithm. Energies 2019, 12, 2860. [Google Scholar] [CrossRef] [Green Version]
  23. Esen, H.; Inalli, M. Modelling of a vertical ground coupled heat pump system by using artificial neural networks. Expert Syst. Appl. 2009, 36, 10229–10238. [Google Scholar] [CrossRef]
  24. Hosoz, M.; Ertunc, H.M. Artificial neural network analysis of an automobile air conditioning system. Energy Convers. Manag. 2006, 47, 1574–1587. [Google Scholar] [CrossRef]
  25. Li, N.; Xia, L.; Deng, S.; Xu, X.; Chan, M.-Y. Steady-state operating performance modelling and prediction for a direct expansion air conditioning system using artificial neural network. Build. Serv. Eng. Res. Technol. 2012, 33, 281–292. [Google Scholar] [CrossRef]
  26. Afram, A.; Janabi-Sharifi, F. Gray-box modeling and validation of residential HVAC system for control system design. Appl. Energy 2015, 137, 134–150. [Google Scholar] [CrossRef]
  27. Xu, X.; Huang, Z.; Wang, X.; Zhong, Z.; Zhang, X. A control-oriented hybrid model for a direct expansion air conditioning system. Energy Build. 2017, 155, 76–87. [Google Scholar] [CrossRef]
  28. Chen, W. Modeling and Control of a Direct Expansion (DX) Variable-Air-Volume (VAV) Air Conditioning (A/C) System; The Hong Kong Polytechnic University: Hong Kong, China, 2005. [Google Scholar]
  29. Kandlikar, S.G. A General Correlation for Saturated Two-Phase Flow Boiling Heat Transfer Inside Horizontal and Vertical Tubes. J. Heat Transf. 1990, 112, 219–228. [Google Scholar] [CrossRef] [Green Version]
  30. Zivi, S.M. Estimation of Steady-State Steam Void-Fraction by Means of the Principle of Minimum Entropy Production. J. Heat Transf. 1964, 86, 247. [Google Scholar] [CrossRef]
  31. Wang, C.C.; Lin, Y.T.; Lee, C.J. An airside correlation for plain fin-and-tube heat exchangers in wet conditions. Int. J. Heat Mass Transf. 2000, 43, 1869–1872. [Google Scholar] [CrossRef]
  32. Cleland, A.C. Computer subroutines for rapid evaluation of refrigerant thermodynamic properties. Int. J. Refrig. 1986, 9, 346–351. [Google Scholar] [CrossRef]
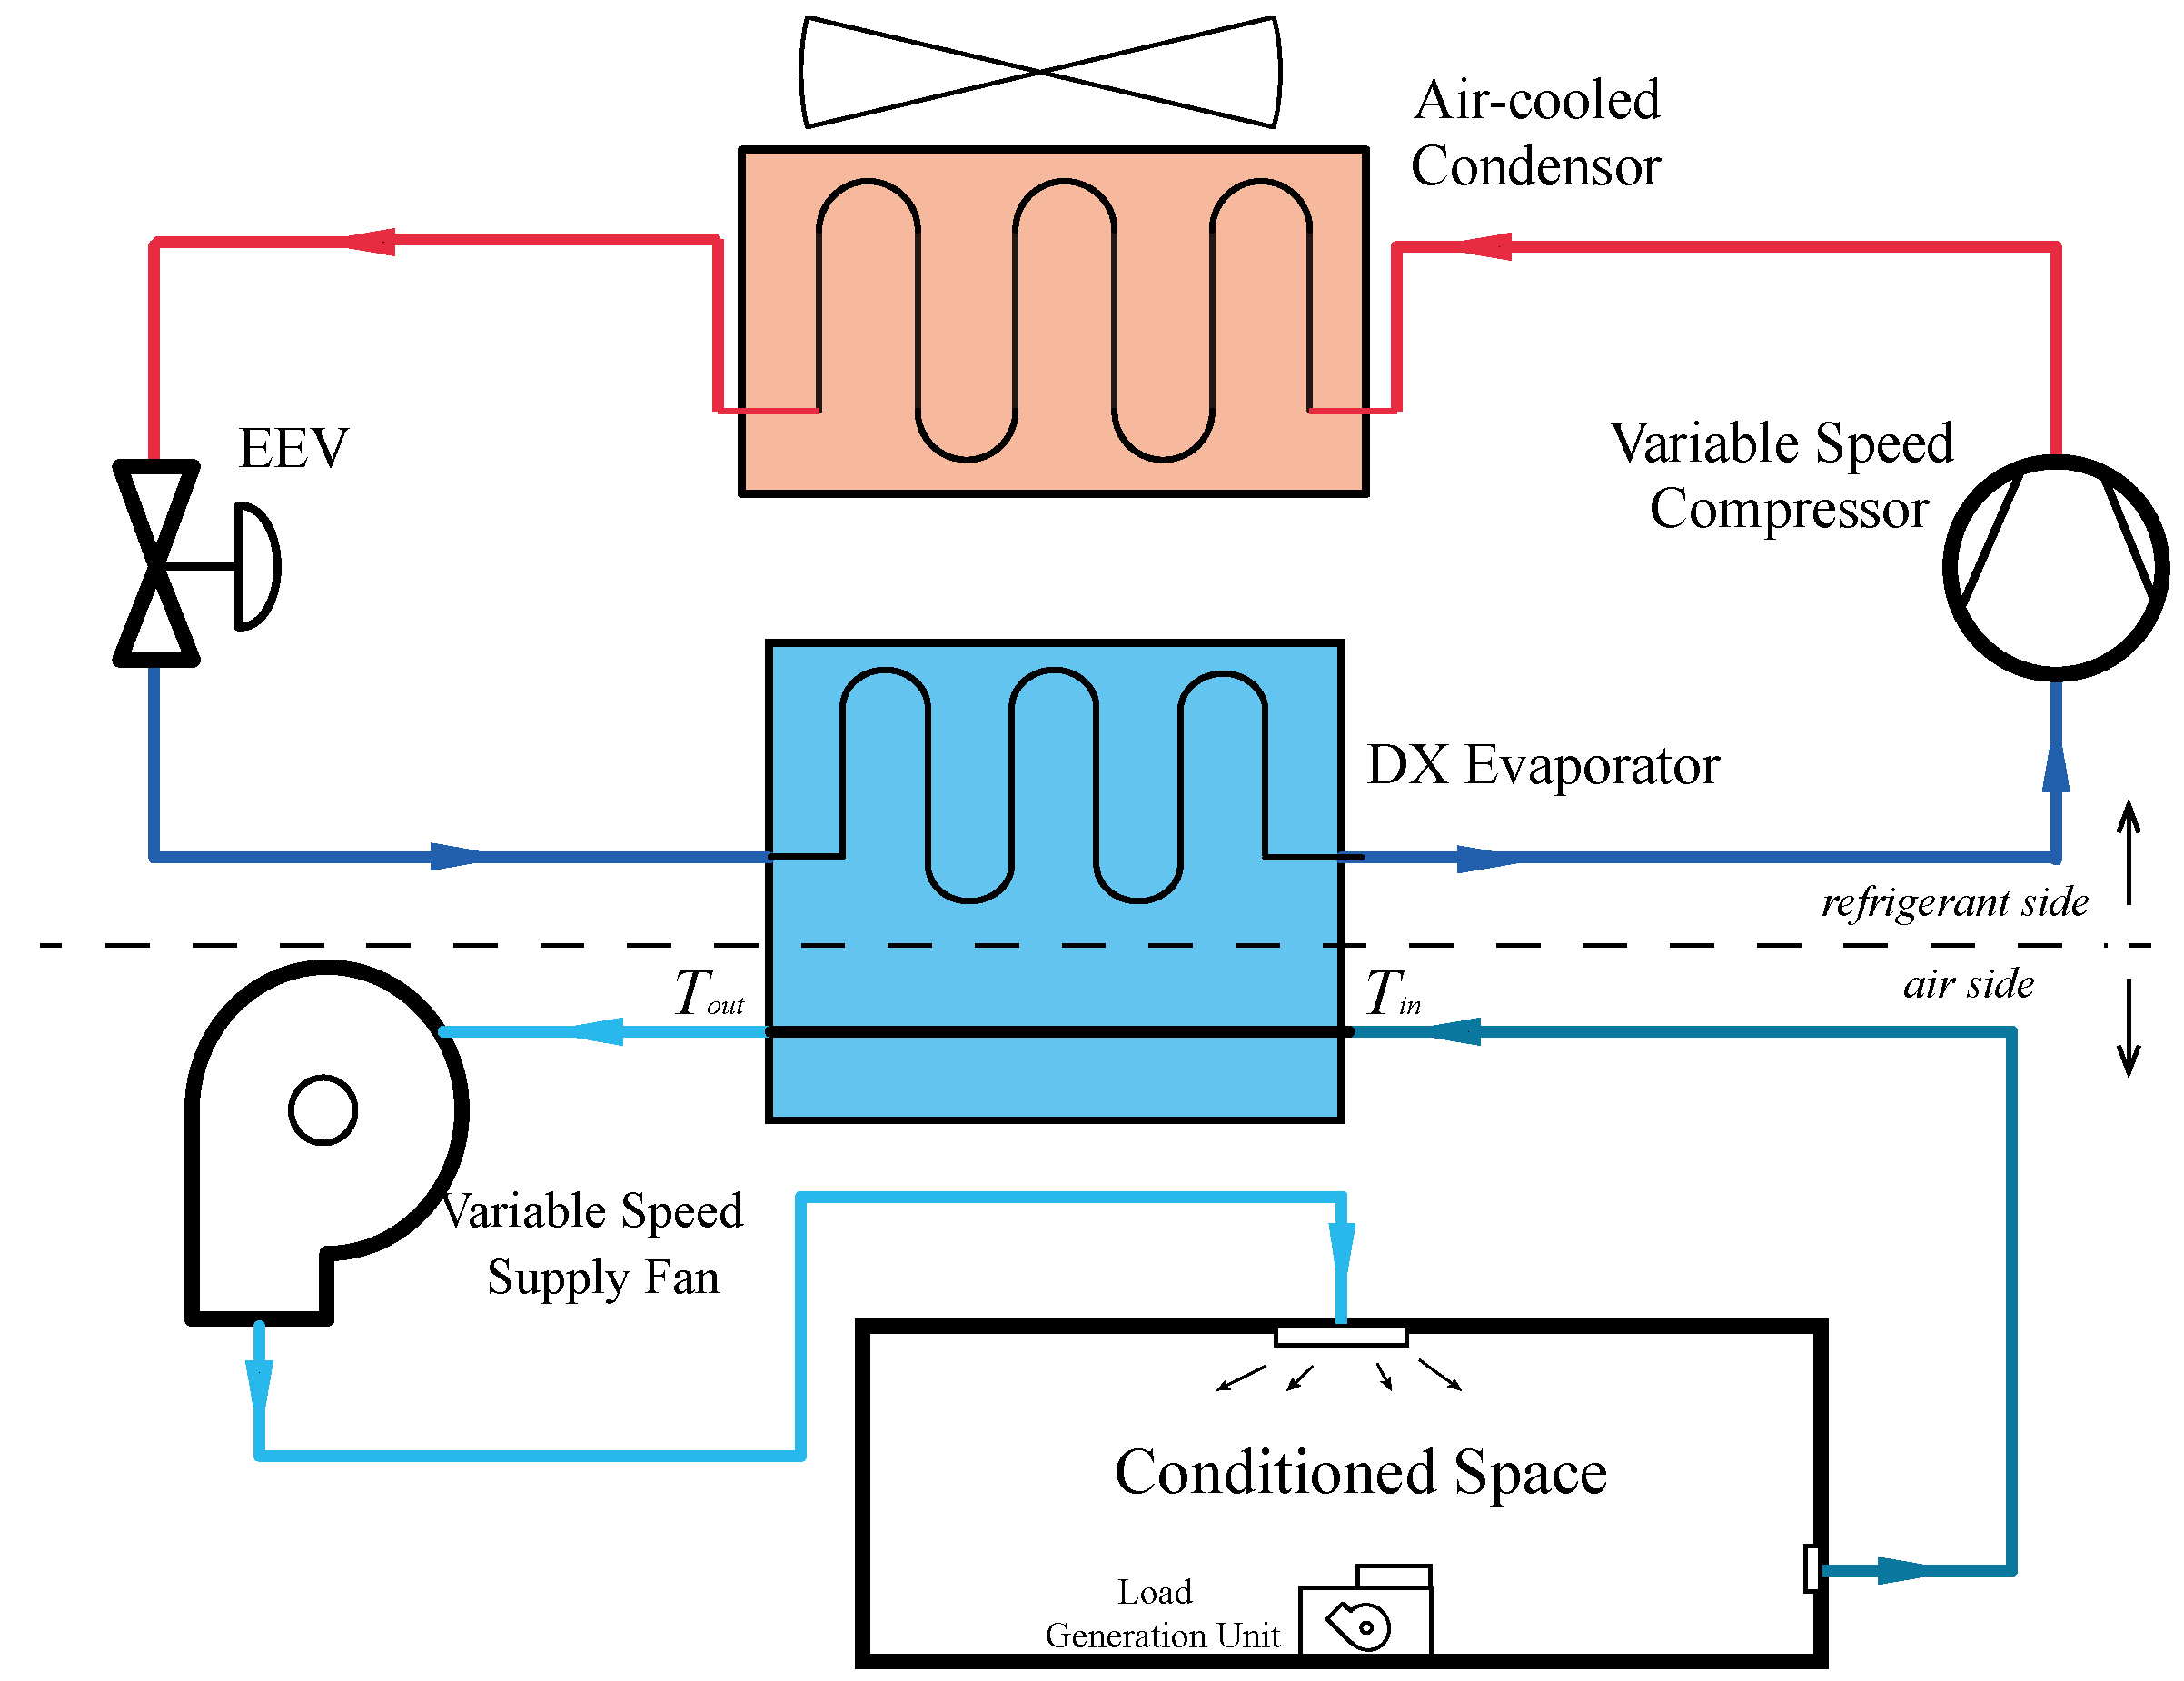
Figure 1. Schematic diagram of the modeled DX A/C system.
Energies 13 04757 g001
Figure 2. The schematic diagram of the two-region evaporator model.
Energies 13 04757 g002
Figure 3. Coupling relationships among the sub-models.
Energies 13 04757 g003
Figure 4. Comparison results for the predicted and measured open loop responses, (a) the predicted and measured air dry-bulb temperature; (b) the predicted and measured air wet-bulb temperature; (c) the predicted and measured refrigerant mass flow rate.
Energies 13 04757 g004
Figure 5. Comparison results for the measured and predicted values of SCC, (a) SCC; (b) Relative error.
Energies 13 04757 g005
Figure 6. Comparison results for the measured and predicted values of LCC, (a) LCC; (b) Relative error.
Energies 13 04757 g006
Figure 7. SCC and LCC under different speed combinations of compressor and supply fan, (a) the variation of SCC; (b) the variation of LCC.
Energies 13 04757 g007
Figure 8. Inherent operating characteristics in terms of TCC and E SHR under variable speed operation.
Energies 13 04757 g008
Figure 9. Improved inherent correlation among TCC E SHR and COP of the DX A/C system.
Energies 13 04757 g009
Table 1. The specifications of each components of the modeled DX A/C system.
ComponentsSpecifications
CompressorAllowable Frequency range: 15~110 Hz
Rated Capacity: 9900 W at 90 Hz
Displacement: 3.04 mL/rev
EEVPulse range: 0~480 Pulse
Rated capacity: 10,500 W
Port diameter: 1.8 mm
EvaporatorLength of the windward area: 420 mm
Height of the windward area: 450 mm
Transverse tube pitch: 25 mm
Longitude tube pitch: 21.65 mm
Fin Pitch: 2 mm
Fin thickness: 0.15 mm
Heat exchange external area: 24.7 m2
CondenserLength of the windward area: 420 mm
Height of the windward area: 450 mm
Transverse tube pitch: 25 mm
Longitude tube pitch: 21.65 mm
Fin Pitch: 2 mm
Fin thickness: 0.15 mm
Heat exchange external area: 38.5 m2
Table 2. The simulation range of compressor and supply fan speeds.
Percent of Max Speed30405060708090
CompressorVSD Freq. (Hz)485766758492101
Speed (rpm)2880342039604500504055206060
Supply fanVSD Freq. (Hz)26313641465156
Speed (rpm)1560186021602460276030603360
Air flow rate (m3/s)0.140.170.200.230.260.290.32