Transitioning All Energy in 74 Metropolitan Areas, Including 30 Megacities, to 100% Clean and Renewable Wind, Water, and Sunlight (WWS)

 ,
,  ,
,
Abstract

1. Introduction
2. Methodology
3. Results and Discussion
3.1. Resulting End-Use Demand and Nameplate Capacities of New Generators
3.2. Energy Costs
3.3. Air Pollution Cost Reductions due to WWS
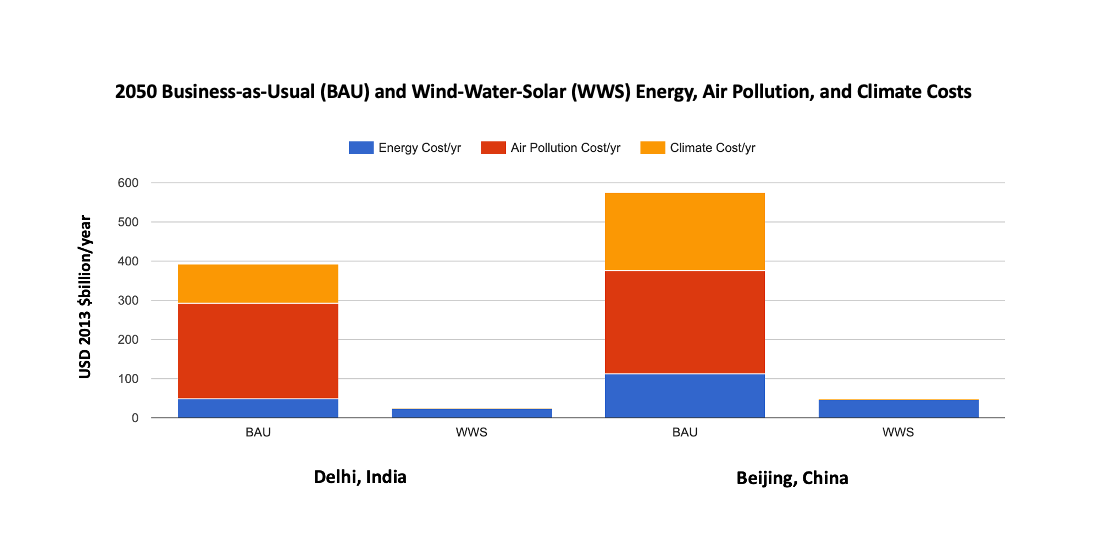
3.4. Global-Warming Damage Costs Eliminated
3.5. Impacts of WWS on Job Creation and Loss
4. Conclusions
Author Contributions
Funding
Acknowledgments
Conflicts of Interest
Abbreviations
| BAU | Business-as-Usual |
| BE | Battery Electric |
| CO2e | Carbon Dioxide Equivalent |
| COPD | Chronic Obstructive Pulmonary Disorder |
| CSP | Concentrated Solar Power |
| EIA | Energy Information Administration |
| GW | Gigawatt |
| HFC | Hydrogen Fuel Cell |
| JEDI | Jobs and Economic Development Impact |
| LCOE | Levelized Cost of Energy |
| LCOEA | LCOE to meet annual average load |
| LCOEC | LCOE to meet continuous load |
| MW | Megawatt |
| NREL | National Renewable Energy Laboratory |
| PV | Photovoltaic |
| SCC | Social Cost of Carbon |
| TW | Terawatt |
| TWh | Terawatt-hour |
| USD | United States Dollars |
| WWS | Wind, Water, and Sunlight (or Solar) |
References
- UN-HABITAT. The State of the World’s Cities Report 2006/2007; United Nations Human Settlements Programme (UN-HABITAT): London, UK, 2006. [Google Scholar]
- Encyclopaedia Britannica. Metropolitan Area. Available online: https://www.britannica.com/topic/metropolitan-area (accessed on 11 August 2020).
- Macrotrends. Metropolitan Area Populations. Available online: https://www.macrotrends.net/cities/largest-cities-by-population (accessed on 30 July 2020).
- Jacobson, M.Z.; Nghiem, S.V.; Sorichetta, A.; Whitney, N. Ring of impact from the mega-urbanization of Beijing between 2000 and 2009. J. Geophys. Res. Atmos. 2015, 120, 5740–5756. [Google Scholar] [CrossRef]
- Jacobson, M.Z.; Nghiem, S.V.; Sorichetta, A. Short-term impacts of the mega-urbanizations of New Delhi and Los Angeles between 2000 and 2009. J. Geophys. Res. Atmos. 2019, 124, 35–56. [Google Scholar] [CrossRef]
- Facchini, A.; Kennedy, C.; Steward, I.; Mele, R. The energy metabolism of megacities. Appl. Energy 2017, 186, 86–95. [Google Scholar] [CrossRef]
- Sierra Club. Check out Where We Are Ready for 100%. Available online: https://www.sierraclub.org/ready-for-100/map?show=committed (accessed on 14 September 2020).
- REN21 (Renewable Energy Policy Network for the 21st Century). Renewables in Cities: 2019 Global Status Report. Available online: https://www.ren21.net/wp-content/uploads/2019/05/REC-2019-GSR_Full_Report_web.pdf (accessed on 5 August 2020).
- Agar, B.; Renner, M. Is 100 percent renewable energy in cities possible? In State of the World; Island Press: Washington, DC, USA, 2016; pp. 161–170. [Google Scholar]
- Calvillo, C.F.; Sanchez-Miralles, A.; Villar, J. Energy management and planning in smart cities. Renew. Sustain. Energy Rev. 2016, 55, 273–287. [Google Scholar] [CrossRef]
- Park, E.; Kwon, S. Towards a sustainable island: Independent optimal renewable power generation systems at Gadeokdo Island in South Korea. Sustain. Cities Soc. 2016, 23, 114–118. [Google Scholar] [CrossRef]
- Bibri, S.E.; Krogstie, J. Smart sustainable cities of the future: An extensive interdisciplinary literature review. Sustain. Cities Soc. 2017, 31, 183–212. [Google Scholar] [CrossRef]
- Newman, P. The rise and rise of renewable cities. Renew. Energy Environ. Sustain. 2017, 2, 10. [Google Scholar] [CrossRef]
- Dahal, K.; Juhola, S.; Niemela, J. The role of renewable energy policies for carbon neutrality in Helsinki Metropolitan area. Sustain. Cities Soc. 2018, 40, 222–232. [Google Scholar] [CrossRef]
- Jacobson, M.Z.; Cameron, M.A.; Hennessy, E.M.; Petkov, I.; Meyer, C.B.; Gambhir, T.K.; Maki, A.T.; Pfleeger, K.; Clonts, H.; McEvoy, A.L.; et al. 100% clean and renewable wind, water, and sunlight (WWS) all-sector energy roadmaps for 53 towns and cities in North America. Sustain. Cities Soc. 2018, 42, 22–37. [Google Scholar] [CrossRef]
- Thellufsen, J.Z.; Lund, H.; Sorknaes, P.; Ostergaard, P.A.; Chang, M.; Drysdale, D.; Nielsen, S.; Djorup, S.R.; Sperling, K. Smart energy cities in a 100% renewable energy context. Renew. Sustain. Energy Rev. 2020, 129, 109922. [Google Scholar] [CrossRef]
- Lund, H.; Mathiesen, B.V. Energy system analysis of 100% renewable energy systems—The case of Denmark in years 2030 and 2050. Energy 2009, 34, 524–531. [Google Scholar] [CrossRef]
- Mason, I.G.; Page, S.C.; Williamson, A.G. A 100% renewable energy generation system for New Zealand utilizing hydro, wind, geothermal, and biomass resources. Energy Policy 2010, 38, 3973–3984. [Google Scholar] [CrossRef]
- Connolly, D.; Lund, H.; Mathiesen, B.V.; Leahy, M. The first step to a 100% renewable energy-system for Ireland. Appl. Energy 2011, 88, 502–507. [Google Scholar] [CrossRef]
- Connolly, D.; Lund, H.; Mathiesen, B.V. Smart energy Europe: The technical and economic impact of one potential 100% renewable energy scenario for the European Union. Renew. Sustain. Energy Rev. 2016, 60, 1634–1653. [Google Scholar] [CrossRef]
- Hart, E.K.; Jacobson, M.Z. A Monte Carlo approach to generator portfolio planning and carbon emissions assessments of systems with large penetrations of variable renewables. Renew. Energy 2011, 36, 2278–2286. [Google Scholar] [CrossRef]
- Hart, E.K.; Jacobson, M.Z. The carbon abatement potential of high penetration intermittent renewables. Energy Environ. Sci. 2012, 5, 6592–6601. [Google Scholar] [CrossRef]
- Mathiesen, B.V.; Lund, H.; Karlsson, K. 100% renewable energy systems, climate mitigation, and economic growth. Appl. Energy 2011, 88, 488–501. [Google Scholar] [CrossRef]
- Mathiesen, B.V.; Lund, H.; Connolly, D.; Wenzel, H.; Ostergaard, P.Z.; Moller, B.; Nielsen, S.; Ridjan, I.; Karnoe, P.; Sperling, K.; et al. Smart energy systems for coherent 100% renewable energy and transport solutions. Appl. Energy 2015, 145, 139–154. [Google Scholar] [CrossRef]
- Elliston, B.; Diesendorf, M.; MacGill, I. Simulations of scenarios with 100% renewable electricity in the Australian national electricity market. Energy Policy 2012, 45, 606–613. [Google Scholar] [CrossRef]
- Elliston, B.; MacGill, I.; Diesendorf, M. Comparing least cost scenarios for 100% renewable electricity with low emission fossil fuel scenarios in the Australian national electricity market. Renew. Energy 2014, 66, 196–204. [Google Scholar] [CrossRef]
- Rasmussen, M.G.; Andresen, G.B.; Greiner, M. Storage and balancing synergies in a fully or highly renewable pan-European power system. Energy Policy 2012, 51, 642–651. [Google Scholar] [CrossRef]
- Budischak, C.; Sewell, D.; Thompson, H.; Mach, L.; Veron, D.E.; Kempton, W. Cost-minimized combinations of wind power, solar power, and electrochemical storage, powering the grid up to 99.9% of the time. J. Power Sources 2013, 225, 60–74. [Google Scholar] [CrossRef]
- Steinke, F.; Wolfrum, P.; Hoffmann, C. Grid vs. storage in a 100% renewable Europe. Renew. Energy 2013, 50, 826–832. [Google Scholar] [CrossRef]
- Becker, S.; Frew, B.A.; Andresen, G.B.; Zeyer, T.; Schramm, S.; Greiner, M.; Jacobson, M.Z. Features of a fully renewable U.S. electricity-system: Optimized mixes of wind and solar PV and transmission grid extensions. Energy 2014, 72, 443–458. [Google Scholar] [CrossRef]
- Jacobson, M.Z.; Delucchi, M.A.; Cameron, M.A.; Frew, B.A. A low-cost solution to the grid reliability problem with 100% penetration of intermittent wind, water, and solar for all purposes. Proc. Natl. Acad. Sci. USA 2015, 112, 15060–15065. [Google Scholar] [CrossRef]
- Jacobson, M.Z.; Delucchi, M.A.; Cameron, M.A.; Mathiesen, B.V. Matching demand with supply at low cost among 139 countries within 20 world regions with 100% intermittent wind, water, and sunlight (WWS) for all purposes. Renew. Energy 2018, 123, 236–248. [Google Scholar] [CrossRef]
- Jacobson, M.Z.; Delucchi, M.A.; Cameron, M.A.; Coughlin, S.J.; Hay, C.A.; Manogaran, I.P.; Shu, Y.; von Krauland, A.K. Impacts of green new deal energy plans on grid stability, costs, jobs, health, and climate in 143 countries. One Earth 2019, 1, 449–463. [Google Scholar] [CrossRef]
- Aghahosseini, A.; Bogdanov, D.; Barbosa, L.S.N.S.; Breyer, C. Analyzing the feasibility of powering the Americas with renewable energy and inter-regional grid interconnections by 2030. Renew. Sustain. Energy Rev. 2019, 105, 187–205. [Google Scholar] [CrossRef]
- Bogdanov, D.; Breyer, C. North-east Asian super grid for 100% renewable energy supply: Optimal mix of energy technologies for electricity, gas, and heat supply options. Energy Convers. Manag. 2016, 112, 176–190. [Google Scholar] [CrossRef]
- Child, M.; Breyer, C. Vision and initial feasibility analysis of a recarbonized Finnish energy system for 2050. Renew. Sustain. Energy Rev. 2016, 66, 517–536. [Google Scholar] [CrossRef]
- Barbosa, L.S.N.S.; Bogdanov, D.; Vainikka, P.; Breyer, C. Hydro, wind, and solar power as a base for a 100% renewable energy supply for South and Central America. PLoS ONE 2017, 12, e0173820. [Google Scholar] [CrossRef] [PubMed]
- Blakers, A.; Lu, B.; Stocks, M. 100% renewable electricity in Australia. Energy 2017, 133, 471–482. [Google Scholar] [CrossRef]
- Gulagi, A.; Choudhary, P.; Bogdanov, D.; Breyer, C. Electricity system based on 100% renewable for India and SAARC. PLoS ONE 2017, 12, e0180611. [Google Scholar] [CrossRef]
- Gulagi, A.; Bogdanov, D.; Fasihi, M.; Breyer, C. Can Australia power the energy-hungry Asia with renewable energy? Sustainability 2017, 9, 233. [Google Scholar] [CrossRef]
- Lu, B.; Blakers, A.; Stocks, M. 90–100% renewable electricity for the south west interconnected system of western Australia. Energy 2017, 122, 663–674. [Google Scholar] [CrossRef]
- Esteban, M.; Portugal-Pereira, J.; Mclellan, B.C.; Bricker, J.; Farzaneh, H.; Djalikova, N.; Ishihara, K.N.; Takagi, H.; Roeber, V. 100% renewable energy system in Japan: Smoothening and ancillary services. Appl. Energy 2018, 224, 698–707. [Google Scholar] [CrossRef]
- Liu, H.; Andresen, G.B.; Greiner, M. Cost-optimal design of a simplified highly renewable Chinese electricity network. Energy 2018, 147, 534–546. [Google Scholar] [CrossRef]
- Sadiqa, A.; Gulagi, A.; Breyer, C. Energy transition roadmap towards 100% renewable energy and role of storage technologies for Pakistan by 2050. Energy 2018, 147, 518–533. [Google Scholar] [CrossRef]
- Zapata, S.; Casteneda, M.; Jiminez, M.; Aristizabel, A.J.; Franco, C.J.; Dyner, I. Long-term effects of 100% renewable generation on the Colombian power market. Sustain. Energy Technol. Assess. 2018, 30, 183–191. [Google Scholar] [CrossRef]
- Bogdanov, D.; Toktarova, A.; Breyer, C. Transition towards 100% renewable power and heat supply for energy intensive economics and severe continental climate conditions: Case for Kazakhstan. Appl. Energy 2019, 253, 113606. [Google Scholar] [CrossRef]
- Kiwan, S.; Al-Gharibeh, E. Jordan toward a 100% renewable electricity system. Renew. Energy 2020, 147, 423–436. [Google Scholar] [CrossRef]
- Chen, A.A.; Stephens, A.J.; Koon Koon, R.; Ashtine, M.; Koon, K.M.K. 100% renewable for a small island: Jamaica as an example. Renew. Sustain. Energy Rev. 2020, 121, 109671. [Google Scholar] [CrossRef]
- IEA (International Energy Agency). World Energy Statistics 2018; OECD Publishing: Paris, France, 2019. [Google Scholar]
- EIA (Energy Information Administration). U.S. International Energy Outlook 2016. DOE/EIA-0484. Available online: http://www.eia.gov/forecasts/ieo/pdf/0484(2016).pdf (accessed on 17 September 2020).
- Wikipedia. List of Countries by Past and Estimated Future Population. Available online: https://en.wikipedia.org/wiki/List_of_countries_by_past_and_estimated_future_population (accessed on 17 September 2020).
- WHO (World Health Organization). Health Statistics and Information Systems. Available online: https://www.who.int/healthinfo/global_burden_disease/estimates/en/ (accessed on 17 September 2020).
- WHO (World Health Organization). Global Health Observatory (GHO) Data. Available online: https://www.who.int/gho/phe/outdoor_air_pollution/en/ (accessed on 17 September 2020).
- European Commission EDGAR: Fossil CO2 Emissions of all Countries. 2019. Available online: https://edgar.jrc.ec.europa.eu/overview.php?v=booklet2018 (accessed on 17 September 2020).
- Jacobson, M.Z.; Delucchi, M.A.; Bazouin, G.; Bauer, Z.A.F.; Heavey, C.C.; Fisher, E.; Morris, S.B.; Piekutowski, D.J.Y.; Vencill, T.A.; Yeskoo, T.W. 100% clean and renewable wind, water, sunlight (WWS) all-sector energy roadmaps for the 50 United States. Energy Environ. Sci. 2015, 8, 2093–2117. [Google Scholar] [CrossRef]
- NREL (U.S. Department of Energy National Renewable Energy Laboratory). JEDI: Jobs & Economic Development Impact Models. Available online: https://www.nrel.gov/analysis/jedi (accessed on 17 September 2020).

| Metropolitan Area | Scenario | 2050 Total End-Use Load (GW) | Percent of End-Use Load due to Residential Buildings | Percent of End-Use Load due to Commercial and Govern-Ment Build-Ings | Percent of End-Use Load due to Indus-Try | Percent of End-Use Load due to Trans-Port | (a) Percent Change in End-Use Load with WWS due to Higher Work: Energy Ratio | (b) Percent Change in End-Use Load with WWS due to Eliminating Energy in Mining, Transporting, Refining | (c) Percent Change in End-Use Load with WWS due to Effic-iency Beyond BAU | Overall Percent Change in End-Use Load with WWS |
|---|---|---|---|---|---|---|---|---|---|---|
| Abidjan, Côte d’Ivoire | BAU | 3.943 | 44.4 | 13.4 | 13.7 | 26.7 | - | - | - | - |
| WWS | 1.292 | 31.7 | 16.3 | 31.5 | 10.4 | −57.4 | −1.7 | −8.2 | −67.2 | |
| Addis Ababa, Ethiopia | BAU | 2.374 | 83.1 | 2.4 | 4.6 | 8.9 | - | - | - | - |
| WWS | 0.535 | 68.4 | 4.8 | 16.5 | 9.4 | −66.8 | −0.2 | −10.4 | −77.5 | |
| Ankara, Turkey | BAU | 12.968 | 21.0 | 13.1 | 32.9 | 29.7 | - | - | - | - |
| WWS | 5.685 | 19.4 | 16.6 | 45.8 | 15.3 | −39.1 | −9.9 | −7.1 | −56.2 | |
| Auckland, New Zealand | BAU | 14.671 | 10.5 | 11.5 | 39.8 | 33.7 | - | - | - | - |
| WWS | 7.964 | 12.6 | 15.2 | 53.7 | 14.9 | −33.5 | −5.2 | −7.0 | −45.7 | |
| Baghdad, Iraq | BAU | 9.445 | 18.4 | 1.2 | 33.9 | 41.5 | - | - | - | - |
| WWS | 3.617 | 25.9 | 2.4 | 35.7 | 25.9 | −40.5 | −14.7 | −6.5 | −61.7 | |
| Bangkok, Thailand | BAU | 64.148 | 7.9 | 7.3 | 39.6 | 41.9 | - | - | - | - |
| WWS | 29.646 | 9.3 | 11.5 | 58.9 | 18.2 | −36.3 | −11.6 | −5.9 | −53.8 | |
| Beijing, China | BAU | 139.65 | 16.6 | 4.0 | 47.5 | 28.0 | - | - | - | - |
| WWS | 63.049 | 15.8 | 5.0 | 64.5 | 10.4 | −32.6 | −16.0 | −6.2 | −54.9 | |
| Berlin, Germany | BAU | 19.812 | 24.3 | 16.0 | 30.5 | 29.2 | - | - | - | - |
| WWS | 8.392 | 19.2 | 19.2 | 43.2 | 18.4 | −41.7 | −8.4 | −7.6 | −57.6 | |
| Bogotá, Colombia | BAU | 25.787 | 14.7 | 4.6 | 34.6 | 38.4 | - | - | - | - |
| WWS | 9.446 | 17.5 | 8.4 | 46.0 | 10.4 | −42.1 | −15.3 | −6.0 | −63.4 | |
| Bologna, Italy | BAU | 3.311 | 24.4 | 13.2 | 24.3 | 36.1 | - | - | - | - |
| WWS | 1.267 | 19.2 | 20.3 | 35.6 | 23.5 | −42.2 | −11.6 | −8.0 | −61.7 | |
| Bucharest, Romania | BAU | 4.226 | 31.9 | 9.1 | 31.7 | 25.0 | - | - | - | - |
| WWS | 1.611 | 26.3 | 12.4 | 43.6 | 16.2 | −44.7 | −9.9 | −7.3 | −61.9 | |
| Buenos Aires, Argentina | BAU | 58.408 | 20.5 | 6.4 | 31.6 | 37.2 | - | - | - | - |
| WWS | 20.471 | 20.5 | 11.4 | 49.2 | 16.6 | −39.1 | −18.5 | −7.3 | −65.0 | |
| Cairo, Egypt | BAU | 43.043 | 20.7 | 7.2 | 26.8 | 41.4 | - | - | - | - |
| WWS | 19.277 | 27.7 | 12.5 | 38.7 | 18.3 | −35.6 | −11.4 | −8.3 | −55.2 | |
| Calgary, Canada | BAU | 24.306 | 13.4 | 11.5 | 46.3 | 25.5 | - | - | - | - |
| WWS | 9.107 | 17.3 | 18.2 | 44.0 | 17.7 | −33.3 | −23.2 | −6.0 | −62.5 | |
| Cape Town, South Africa | BAU | 35.138 | 13.8 | 6.2 | 44.3 | 32.1 | - | - | - | - |
| WWS | 15.899 | 13.5 | 8.0 | 58.0 | 17.7 | −37.2 | −11.9 | −5.7 | −54.8 | |
| Caracas, Venezuela | BAU | 7.015 | 8.7 | 5.2 | 49.4 | 36.6 | - | - | - | - |
| WWS | 2.749 | 12.1 | 8.7 | 56.6 | 22.5 | −37.2 | −19.0 | −4.7 | −60.8 | |
| Casablanca, Morocco | BAU | 4.800 | 18.1 | 8.7 | 18.7 | 47.1 | - | - | - | - |
| WWS | 2.030 | 19.9 | 9.6 | 37.0 | 27.1 | −49.4 | −0.9 | −7.3 | −57.7 | |
| Chicago, USA | BAU | 53.288 | 14.3 | 15.0 | 30.8 | 37.3 | - | - | - | - |
| WWS | 21.736 | 18.1 | 20.0 | 38.0 | 20.6 | −40.1 | −12.2 | −6.9 | −59.2 | |
| Delhi, India | BAU | 57.329 | 21.6 | 4.1 | 39.7 | 27.5 | - | - | - | - |
| WWS | 28.999 | 16.7 | 4.2 | 59.5 | 12.1 | −36.6 | −5.8 | −7.0 | −49.4 | |
| Dhaka, Bangladesh | BAU | 11.045 | 38.4 | 2.1 | 30.4 | 25.2 | - | - | - | - |
| WWS | 4.537 | 26.2 | 3.2 | 59.8 | 8.2 | −40.4 | −9.9 | −8.7 | −58.9 | |
| Dubai, United Arab Emirates | BAU | 60.558 | 6.8 | 5.4 | 41.9 | 43.7 | - | - | - | - |
| WWS | 32.533 | 9.5 | 7.9 | 60.1 | 19.4 | −38.0 | −2.6 | −5.7 | −46.3 | |
| Edmonton, Canada | BAU | 22.313 | 13.4 | 11.5 | 46.3 | 25.5 | - | - | - | - |
| WWS | 8.360 | 17.3 | 18.2 | 44.0 | 17.7 | −33.3 | −23.2 | −6.0 | −62.5 | |
| Guayaquil, Ecuador | BAU | 5.309 | 11.2 | 6.7 | 20.0 | 54.8 | - | - | - | - |
| WWS | 2.015 | 15.1 | 10.1 | 34.7 | 34.5 | −50.7 | −5.0 | −6.3 | −62.0 | |
| Hanoi, Vietnam | BAU | 13.591 | 24.3 | 4.5 | 43.1 | 27.1 | - | - | - | - |
| WWS | 7.501 | 18.5 | 4.8 | 64.3 | 11.7 | −36.6 | −1.0 | −7.2 | −44.8 | |
| Havana, Cuba | BAU | 3.209 | 18.3 | 5.0 | 44.0 | 20.0 | - | - | - | - |
| WWS | 1.794 | 20.7 | 6.8 | 58.4 | 10.4 | −33.1 | −4.1 | −6.9 | −44.1 | |
| Ho Chi Minh City, Vietnam | BAU | 22.333 | 24.3 | 4.5 | 43.1 | 27.1 | - | - | - | - |
| WWS | 12.326 | 18.5 | 4.8 | 64.3 | 11.7 | −36.6 | −1.0 | −7.2 | −44.8 | |
| Houston, USA | BAU | 55.560 | 14.3 | 15.0 | 30.8 | 37.3 | - | - | - | - |
| WWS | 22.663 | 18.1 | 20.0 | 38.0 | 20.6 | −40.1 | −12.2 | −6.9 | −59.2 | |
| Ibiza, Spain | BAU | 0.240 | 15.6 | 12.4 | 29.4 | 40.1 | - | - | - | - |
| WWS | 0.095 | 18.3 | 19.4 | 34.8 | 25.5 | −39.8 | −13.6 | −6.9 | −60.3 | |
| Istanbul, Turkey | BAU | 41.175 | 21.0 | 13.1 | 32.9 | 29.7 | - | - | - | - |
| WWS | 18.052 | 19.4 | 16.6 | 45.8 | 15.3 | −39.1 | −9.9 | −7.1 | −56.2 | |
| Jakarta, Indonesia | BAU | 19.583 | 27.6 | 4.7 | 30.0 | 36.3 | - | - | - | - |
| WWS | 7.988 | 21.0 | 8.2 | 49.0 | 21.0 | −46.7 | −5.7 | −6.8 | −59.2 | |
| Karachi, Pakistan | BAU | 17.755 | 38.1 | 3.5 | 27.1 | 30.0 | - | - | - | - |
| WWS | 7.198 | 25.9 | 4.7 | 52.6 | 14.7 | −45.8 | −5.5 | −8.1 | −59.5 | |
| Kiev, Ukraine | BAU | 11.706 | 35.7 | 10.5 | 32.5 | 18.2 | - | - | - | - |
| WWS | 4.607 | 30.8 | 13.6 | 42.5 | 10.9 | −41.6 | −11.0 | −8.0 | −60.6 | |
| Kinshasa, Congo | BAU | 13.228 | 48.0 | 0.9 | 4.1 | 46.9 | - | - | - | - |
| WWS | 3.259 | 41.9 | 0.7 | 11.8 | 10.4 | −65.8 | −1.6 | −8.0 | −75.4 | |
| Kyoto, Japan | BAU | 5.031 | 16.0 | 20.0 | 35.1 | 27.4 | - | - | - | - |
| WWS | 2.404 | 17.3 | 23.2 | 42.6 | 16.1 | −34.5 | −10.1 | −7.6 | −52.2 | |
| Lagos, Nigeria | BAU | 16.931 | 63.4 | 3.4 | 12.1 | 20.9 | - | - | - | - |
| WWS | 4.168 | 49.7 | 4.7 | 25.2 | 20.2 | −62.7 | −4.3 | −8.4 | −75.4 | |
| Lima, Peru | BAU | 20.073 | 12.8 | 5.1 | 29.7 | 50.7 | - | - | - | - |
| WWS | 7.525 | 13.4 | 9.1 | 49.3 | 26.7 | −42.3 | −13.9 | −6.3 | −62.5 | |
| London, United Kingdom | BAU | 40.834 | 26.9 | 13.0 | 25.1 | 33.6 | - | - | - | - |
| WWS | 15.517 | 24.6 | 19.6 | 31.7 | 23.1 | −44.3 | −9.5 | −8.2 | −62.0 | |
| Los Angeles, USA | BAU | 73.803 | 14.3 | 15.0 | 30.8 | 37.3 | - | - | - | - |
| WWS | 30.104 | 18.1 | 20.0 | 38.0 | 20.6 | −40.1 | −12.2 | −6.9 | −59.2 | |
| Madrid, Spain | BAU | 28.678 | 15.6 | 12.4 | 29.4 | 40.1 | - | - | - | - |
| WWS | 11.397 | 18.3 | 19.4 | 34.8 | 25.5 | −39.8 | −13.6 | −6.9 | −60.3 | |
| Mexico City, Mexico | BAU | 58.154 | 12.6 | 4.9 | 38.6 | 39.2 | - | - | - | - |
| WWS | 24.179 | 14.9 | 6.9 | 50.3 | 22.0 | −38.9 | −13.5 | −6.0 | −58.4 | |
| Montevideo, Uruguay | BAU | 5.788 | 16.1 | 7.5 | 38.3 | 34.1 | - | - | - | - |
| WWS | 2.990 | 17.1 | 10.3 | 55.1 | 15.6 | −37.5 | −4.4 | −6.5 | −48.3 | |
| Montreal, Canada | BAU | 53.411 | 13.4 | 11.5 | 46.3 | 25.5 | - | - | - | - |
| WWS | 20.011 | 17.3 | 18.2 | 44.0 | 17.7 | −33.3 | −23.2 | −6.0 | −62.5 | |
| Moscow, Russia | BAU | 110.78 | 23.8 | 8.1 | 39.3 | 27.5 | - | - | - | - |
| WWS | 35.178 | 25.2 | 12.8 | 45.1 | 15.6 | −41.3 | −21.1 | −5.9 | −68.2 | |
| Mumbai, India | BAU | 29.570 | 21.6 | 4.1 | 39.7 | 27.5 | - | - | - | - |
| WWS | 14.957 | 16.7 | 4.2 | 59.5 | 12.1 | −36.6 | −5.8 | −7.0 | −49.4 | |
| Nairobi, Kenya | BAU | 4.521 | 56.2 | 1.1 | 10.6 | 31.5 | - | - | - | - |
| WWS | 1.291 | 39.9 | 3.0 | 30.3 | 26.4 | −62.0 | −0.8 | −8.7 | −71.5 | |
| New York City, USA | BAU | 111.58 | 14.3 | 15.0 | 30.8 | 37.3 | - | - | - | - |
| WWS | 45.515 | 18.1 | 20.0 | 38.0 | 20.6 | −40.1 | −12.2 | −6.9 | −59.2 | |
| Oslo, Norway | BAU | 13.738 | 17.5 | 13.2 | 45.8 | 22.2 | - | - | - | - |
| WWS | 5.913 | 27.2 | 21.6 | 38.6 | 11.3 | −24.0 | −25.2 | −7.8 | −57.0 | |
| Palma, Spain | BAU | 2.135 | 15.6 | 12.4 | 29.4 | 40.1 | - | - | - | - |
| WWS | 0.849 | 18.3 | 19.4 | 34.8 | 25.5 | −39.8 | −13.6 | −6.9 | −60.3 | |
| Paris, France | BAU | 46.643 | 26.9 | 17.5 | 22.1 | 30.6 | - | - | - | - |
| WWS | 20.831 | 25.3 | 23.3 | 29.7 | 19.8 | −40.6 | −5.9 | −8.9 | −55.3 | |
| Perth, Australia | BAU | 22.596 | 10.5 | 11.8 | 43.2 | 32.5 | - | - | - | - |
| WWS | 9.857 | 12.8 | 19.5 | 48.3 | 18.4 | −34.0 | −16.1 | −6.3 | −56.4 | |
| Philadelphia, USA | BAU | 36.055 | 14.3 | 15.0 | 30.8 | 37.3 | - | - | - | - |
| WWS | 14.707 | 18.1 | 20.0 | 38.0 | 20.6 | −40.1 | −12.2 | −6.9 | −59.2 | |
| Phoenix, USA | BAU | 37.756 | 14.3 | 15.0 | 30.8 | 37.3 | - | - | - | - |
| WWS | 15.401 | 18.1 | 20.0 | 38.0 | 20.6 | −40.1 | −12.2 | −6.9 | −59.2 | |
| Pyongyang, North Korea | BAU | 2.594 | 1.3 | 0.0 | 58.5 | 7.8 | - | - | - | - |
| WWS | 1.529 | 0.4 | 0.0 | 78.5 | 3.2 | −34.8 | −1.8 | −4.6 | −41.1 | |
| Quezon City, Philippines | BAU | 2.522 | 17.0 | 11.8 | 24.6 | 45.4 | - | - | - | - |
| WWS | 1.124 | 17.8 | 15.4 | 41.1 | 24.3 | −44.9 | −3.2 | −7.4 | −55.4 | |
| Rio de Janeiro, Brazil | BAU | 64.811 | 8.6 | 5.1 | 42.7 | 39.2 | - | - | - | - |
| WWS | 30.496 | 10.6 | 8.1 | 59.4 | 18.2 | −37.0 | −10.5 | −5.5 | −52.9 | |
| Rome, Italy | BAU | 18.115 | 24.4 | 13.2 | 24.3 | 36.1 | - | - | - | - |
| WWS | 6.932 | 19.2 | 20.3 | 35.6 | 23.5 | −42.2 | −11.6 | −8.0 | −61.7 | |
| San Jose, USA | BAU | 11.901 | 14.3 | 15.0 | 30.8 | 37.3 | - | - | - | - |
| WWS | 4.854 | 18.1 | 20.0 | 38.0 | 20.6 | −40.1 | −12.2 | −6.9 | −59.2 | |
| San José, Costa Rica | BAU | 2.785 | 12.4 | 10.7 | 19.8 | 54.8 | - | - | - | - |
| WWS | 1.273 | 17.6 | 16.8 | 35.0 | 10.4 | −45.5 | −1.5 | −7.3 | −54.3 | |
| Santiago, Chile | BAU | 30.254 | 14.5 | 10.3 | 37.9 | 36.5 | - | - | - | - |
| WWS | 15.219 | 13.2 | 12.3 | 58.9 | 15.0 | −33.9 | −8.6 | −7.2 | −49.7 | |
| Sao Paulo, Brazil | BAU | 67.703 | 8.6 | 5.1 | 42.7 | 39.2 | - | - | - | - |
| WWS | 31.857 | 10.6 | 8.1 | 59.4 | 18.2 | −37.0 | −10.5 | −5.5 | −52.9 | |
| Seoul, South Korea | BAU | 74.142 | 10.9 | 15.6 | 42.6 | 28.8 | - | - | - | - |
| WWS | 36.326 | 8.6 | 21.5 | 55.0 | 13.0 | −33.0 | −10.7 | −7.3 | −51.0 | |
| Shanghai, China | BAU | 178.82 | 16.6 | 4.0 | 47.5 | 28.0 | - | - | - | - |
| WWS | 80.732 | 15.8 | 5.0 | 64.5 | 10.4 | −32.6 | −16.0 | −6.2 | −54.9 | |
| Shenzhen, China | BAU | 78.877 | 16.6 | 4.0 | 47.5 | 28.0 | - | - | - | - |
| WWS | 35.611 | 15.8 | 5.0 | 64.5 | 10.4 | −32.6 | −16.0 | −6.2 | −54.9 | |
| Sydney, Australia | BAU | 49.742 | 10.5 | 11.8 | 43.2 | 32.5 | - | - | - | - |
| WWS | 21.699 | 12.8 | 19.5 | 48.3 | 18.4 | −34.0 | −16.1 | −6.3 | −56.4 | |
| Tashkent, Uzbekistan | BAU | 4.724 | 40.3 | 8.6 | 25.6 | 10.1 | - | - | - | - |
| WWS | 1.664 | 26.4 | 7.9 | 44.5 | 4.9 | −46.3 | −9.2 | −9.3 | −64.8 | |
| Tehran, Iran | BAU | 52.486 | 22.5 | 4.9 | 37.6 | 30.6 | - | - | - | - |
| WWS | 21.440 | 17.3 | 5.9 | 57.3 | 14.6 | −39.5 | −12.5 | −7.2 | −59.2 | |
| Tokyo, Japan | BAU | 146.60 | 16.0 | 20.0 | 35.1 | 27.4 | - | - | - | - |
| WWS | 70.053 | 17.3 | 23.2 | 42.6 | 16.1 | −34.5 | −10.1 | −7.6 | −52.2 | |
| Toronto, Canada | BAU | 84.975 | 13.4 | 11.5 | 46.3 | 25.5 | - | - | - | - |
| WWS | 31.837 | 17.3 | 18.2 | 44.0 | 17.7 | −33.3 | −23.2 | −6.0 | −62.5 | |
| Ulaanbaatar, Mongolia | BAU | 5.621 | 22.7 | 7.0 | 32.6 | 22.6 | - | - | - | - |
| WWS | 2.200 | 19.5 | 4.5 | 51.4 | 13.7 | −53.6 | −3.5 | −3.7 | −60.9 | |
| Vancouver, Canada | BAU | 34.912 | 13.4 | 11.5 | 46.3 | 25.5 | - | - | - | - |
| WWS | 13.080 | 17.3 | 18.2 | 44.0 | 17.7 | −33.3 | −23.2 | −6.0 | −62.5 | |
| Vienna, Austria | BAU | 16.442 | 21.4 | 9.8 | 30.5 | 36.9 | - | - | - | - |
| WWS | 7.029 | 18.8 | 13.1 | 44.7 | 22.3 | −38.4 | −12.1 | −6.8 | −57.3 | |
| Yangon, Myanmar | BAU | 4.099 | 49.9 | 2.8 | 15.8 | 16.9 | - | - | - | - |
| WWS | 1.282 | 33.2 | 4.0 | 33.7 | 10.4 | −54.6 | −5.4 | −8.7 | −68.7 | |
| Yixing, China | BAU | 2.599 | 16.6 | 4.0 | 47.5 | 28.0 | - | - | - | - |
| WWS | 1.173 | 15.8 | 5.0 | 64.5 | 10.4 | −32.6 | −16.0 | −6.2 | −54.9 | |
| Zurich, Switzerland | BAU | 8.296 | 27.1 | 18.0 | 18.0 | 35.6 | - | - | - | - |
| WWS | 3.948 | 25.4 | 20.8 | 27.4 | 25.5 | −40.6 | −3.3 | −8.6 | −52.4 | |
| All metropolitan areas | BAU | 2542.4 | 17.2 | 9.5 | 37.7 | 32.4 | - | - | - | - |
| WWS | 1089.9 | 17.1 | 13.1 | 50.0 | 16.5 | −37.5 | −12.9 | −6.7 | −57.1 |
| Energy Technology | (a) Percent of 2050 All-Purpose Annual Average Demand Met by Plant or Device | (b) Nameplate Capacity, Existing Plus New Plants or Devices Needed to Meet 2050 Annual Average Demand (GW) | (c) Nameplate Capacity of Generators Existing as of 2018 (GW) | (d) Percent of 2050 Needed Nameplate Capacity Already Installed 2018 | (e) Total Average Capital Cost of New Generators Needed by 2050 (2013 USD Billion) |
|---|---|---|---|---|---|
| Onshore wind | 29.14 | 1056 | 70.4 | 6.66 | 1234 |
| Offshore wind | 14.71 | 444 | 2.3 | 0.53 | 811 |
| Wave device | 0.50 | 28.3 | 0.022 | 0.08 | 114 |
| Geothermal electricity | 0.75 | 10.1 | 2.1 | 20.7 | 31 |
| Hydropower plant f | 7.91 | 192.7 | 192.7 | 100 | 0 |
| Tidal turbine | 0.12 | 5.9 | 0.12 | 2.01 | 21 |
| Res. roof PV | 10.81 | 606 | 13.9 | 2.29 | 1730 |
| Com./gov. roof PV g | 13.56 | 817 | 13.9 | 1.70 | 1627 |
| Utility PV plant g | 18.92 | 1011 | 41.5 | 4.11 | 1382 |
| Utility CSP plant g | 3.58 | 70 | 0.90 | 1.28 | 300 |
| Total | 100 | 4241 | 338 | 7.97 | 7250 |
| Metropolitan Area | Onshore Wind | Offshore Wind | Wave | Geo-Thermal | Hydro-Electric | Tidal | Res. PV | Com./Gov. PV | Utility PV | CSP |
|---|---|---|---|---|---|---|---|---|---|---|
| Abidjan, Côte d’Ivoire | 35.38 | 10.99 | 0.93 | 0.00 | 6.67 | 0.05 | 9.42 | 20.94 | 10.99 | 4.62 |
| Addis Ababa, Ethiopia | 35.94 | 0.00 | 0.00 | 7.11 | 8.83 | 0.00 | 7.91 | 17.57 | 18.45 | 4.20 |
| Ankara, Turkey | 35.48 | 2.08 | 0.00 | 1.33 | 15.65 | 0.02 | 7.81 | 17.35 | 16.13 | 4.15 |
| Auckland, New Zealand | 32.42 | 10.38 | 0.77 | 9.32 | 13.83 | 0.25 | 8.90 | 9.97 | 10.38 | 3.79 |
| Baghdad, Iraq | 40.83 | 0.91 | 0.00 | 0.00 | 4.49 | 0.00 | 8.98 | 19.96 | 20.04 | 4.78 |
| Bangkok, Thailand | 3.75 | 18.81 | 0.00 | 0.08 | 1.31 | 0.01 | 22.28 | 15.65 | 33.18 | 4.93 |
| Beijing, China | 34.84 | 14.29 | 0.05 | 0.07 | 6.30 | 0.02 | 12.25 | 13.22 | 14.29 | 4.68 |
| Berlin, Germany | 41.05 | 20.42 | 0.10 | 0.02 | 1.35 | 0.01 | 8.18 | 8.46 | 20.42 | 0.00 |
| Bogotá, Colombia | 34.42 | 8.83 | 0.81 | 0.00 | 18.30 | 0.38 | 7.57 | 16.83 | 8.83 | 4.03 |
| Bologna, Italy | 37.31 | 13.97 | 0.35 | 0.98 | 7.79 | 0.02 | 11.97 | 9.10 | 13.97 | 4.54 |
| Bucharest, Romania | 37.45 | 12.03 | 0.00 | 0.44 | 16.32 | 0.01 | 10.31 | 11.42 | 12.03 | 0.00 |
| Buenos Aires, Argentina | 38.77 | 9.95 | 0.00 | 1.40 | 7.90 | 0.02 | 8.53 | 18.95 | 9.95 | 4.53 |
| Cairo, Egypt | 42.10 | 10.80 | 0.00 | 0.00 | 1.52 | 0.01 | 9.26 | 20.58 | 10.80 | 4.92 |
| Calgary, Canada | 32.74 | 8.87 | 0.73 | 2.63 | 23.60 | 0.29 | 7.60 | 14.67 | 8.87 | 0.00 |
| Cape Town, South Africa | 42.19 | 13.70 | 1.00 | 0.00 | 0.30 | 0.01 | 11.74 | 12.43 | 13.70 | 4.93 |
| Caracas, Venezuela | 35.91 | 9.22 | 0.18 | 0.00 | 15.80 | 0.02 | 7.90 | 17.56 | 9.22 | 4.20 |
| Casablanca, Morocco | 41.01 | 10.53 | 0.97 | 0.00 | 3.06 | 0.03 | 9.02 | 20.05 | 10.53 | 4.80 |
| Chicago, USA | 31.44 | 16.42 | 0.96 | 0.57 | 3.90 | 0.01 | 10.95 | 14.60 | 16.42 | 4.73 |
| Delhi, India | 36.92 | 6.23 | 0.06 | 0.02 | 2.12 | 0.02 | 12.03 | 15.86 | 21.85 | 4.89 |
| Dhaka, Bangladesh | 7.08 | 7.12 | 0.62 | 0.00 | 0.32 | 0.10 | 23.18 | 9.68 | 46.96 | 4.95 |
| Dubai, United Arab Emirates | 5.90 | 12.26 | 0.00 | 0.00 | 0.00 | 0.01 | 7.05 | 3.95 | 65.83 | 5.00 |
| Edmonton, Canada | 32.74 | 8.87 | 0.73 | 2.63 | 23.60 | 0.29 | 7.60 | 14.67 | 8.87 | 0.00 |
| Guayaquil, Ecuador | 33.38 | 3.09 | 0.79 | 0.33 | 20.23 | 0.56 | 7.34 | 16.32 | 14.05 | 3.90 |
| Hanoi, Vietnam | 0.72 | 25.19 | 0.57 | 0.00 | 8.07 | 0.01 | 21.59 | 14.08 | 25.19 | 4.57 |
| Havana, Cuba | 42.12 | 10.81 | 1.00 | 0.00 | 0.35 | 0.13 | 9.27 | 20.59 | 10.81 | 4.93 |
| Ho Chi Minh City, Vietnam | 0.72 | 25.19 | 0.57 | 0.00 | 8.07 | 0.01 | 21.59 | 14.08 | 25.19 | 4.57 |
| Houston, USA | 31.44 | 16.42 | 0.96 | 0.57 | 3.90 | 0.01 | 10.95 | 14.60 | 16.42 | 4.73 |
| Ibiza, Spain | 37.36 | 11.92 | 0.88 | 0.06 | 11.34 | 0.33 | 10.21 | 11.61 | 11.92 | 4.37 |
| Istanbul, Turkey | 35.48 | 2.08 | 0.00 | 1.33 | 15.65 | 0.02 | 7.81 | 17.35 | 16.13 | 4.15 |
| Jakarta, Indonesia | 15.79 | 15.28 | 0.94 | 4.45 | 1.34 | 0.03 | 13.10 | 29.11 | 15.28 | 4.66 |
| Karachi, Pakistan | 23.99 | 10.55 | 0.24 | 0.00 | 3.65 | 0.00 | 15.23 | 16.55 | 24.98 | 4.81 |
| Kiev, Ukraine | 42.41 | 15.21 | 0.00 | 0.00 | 5.73 | 0.02 | 13.04 | 8.39 | 15.21 | 0.00 |
| Kinshasa, Congo | 41.43 | 10.63 | 0.93 | 0.00 | 6.91 | 0.09 | 9.11 | 20.25 | 10.63 | 0.00 |
| Kyoto, Japan | 10.24 | 31.55 | 0.93 | 0.69 | 5.84 | 0.28 | 11.78 | 7.14 | 31.55 | 0.00 |
| Lagos, Nigeria | 13.63 | 0.00 | 0.30 | 0.00 | 1.29 | 0.01 | 14.37 | 31.94 | 33.54 | 4.92 |
| Lima, Peru | 33.56 | 0.02 | 0.79 | 6.62 | 14.04 | 0.05 | 7.38 | 16.41 | 17.21 | 3.93 |
| London, United Kingdom | 20.29 | 32.66 | 0.96 | 0.00 | 0.93 | 2.81 | 5.41 | 4.27 | 32.66 | 0.00 |
| Los Angeles, USA | 31.44 | 16.42 | 0.96 | 0.57 | 3.90 | 0.01 | 10.95 | 14.60 | 16.42 | 4.73 |
| Madrid, Spain | 37.36 | 11.92 | 0.88 | 0.06 | 11.34 | 0.33 | 10.21 | 11.61 | 11.92 | 4.37 |
| Mexico City, Mexico | 39.44 | 10.12 | 0.93 | 2.96 | 3.84 | 0.02 | 8.68 | 19.28 | 10.12 | 4.61 |
| Montevideo, Uruguay | 36.55 | 9.38 | 0.86 | 0.00 | 13.57 | 0.07 | 8.04 | 17.87 | 9.38 | 4.27 |
| Montreal, Canada | 32.74 | 8.87 | 0.73 | 2.63 | 23.60 | 0.29 | 7.60 | 14.67 | 8.87 | 0.00 |
| Moscow, Russia | 40.25 | 13.06 | 0.50 | 0.17 | 8.96 | 0.03 | 11.19 | 11.88 | 13.06 | 0.90 |
| Mumbai, India | 36.92 | 6.23 | 0.06 | 0.02 | 2.12 | 0.02 | 12.03 | 15.86 | 21.85 | 4.89 |
| Nairobi, Kenya | 35.46 | 9.10 | 0.84 | 12.92 | 3.27 | 0.03 | 7.80 | 17.34 | 9.10 | 4.15 |
| New York City, USA | 31.44 | 16.42 | 0.96 | 0.57 | 3.90 | 0.01 | 10.95 | 14.60 | 16.42 | 4.73 |
| Oslo, Norway | 13.71 | 5.56 | 0.31 | 0.00 | 68.83 | 0.39 | 4.77 | 0.87 | 5.56 | 0.00 |
| Palma, Spain | 37.36 | 11.92 | 0.88 | 0.06 | 11.34 | 0.33 | 10.21 | 11.61 | 11.92 | 4.37 |
| Paris, France | 40.28 | 13.15 | 0.92 | 0.03 | 7.51 | 0.20 | 11.27 | 11.65 | 13.15 | 1.83 |
| Perth, Australia | 26.95 | 15.09 | 0.96 | 0.36 | 3.99 | 0.12 | 9.43 | 15.72 | 22.64 | 4.73 |
| Philadelphia, USA | 31.44 | 16.42 | 0.96 | 0.57 | 3.90 | 0.01 | 10.95 | 14.60 | 16.42 | 4.73 |
| Phoenix, USA | 31.44 | 16.42 | 0.96 | 0.57 | 3.90 | 0.01 | 10.95 | 14.60 | 16.42 | 4.73 |
| Pyongyang, North Korea | 36.13 | 13.74 | 0.00 | 0.00 | 17.55 | 1.73 | 11.78 | 4.91 | 13.74 | 0.43 |
| Quezon City, Philippines | 7.68 | 15.13 | 0.60 | 11.24 | 3.95 | 0.27 | 12.97 | 28.82 | 15.13 | 4.20 |
| Rio de Janeiro, Brazil | 35.53 | 9.12 | 0.84 | 0.00 | 16.04 | 0.02 | 7.82 | 17.37 | 9.12 | 4.16 |
| Rome, Italy | 37.31 | 13.97 | 0.35 | 0.98 | 7.79 | 0.02 | 11.97 | 9.10 | 13.97 | 4.54 |
| San Jose, USA | 31.44 | 16.42 | 0.96 | 0.57 | 3.90 | 0.01 | 10.95 | 14.60 | 16.42 | 4.73 |
| San José, Costa Rica | 21.46 | 5.51 | 0.51 | 24.74 | 24.43 | 0.13 | 4.72 | 10.49 | 5.51 | 2.51 |
| Santiago, Chile | 36.71 | 10.06 | 0.87 | 3.80 | 9.41 | 0.06 | 8.62 | 16.13 | 10.06 | 4.29 |
| São Paulo, Brazil | 35.53 | 9.12 | 0.84 | 0.00 | 16.04 | 0.02 | 7.82 | 17.37 | 9.12 | 4.16 |
| Seoul, South Korea | 4.44 | 37.18 | 0.00 | 0.00 | 1.98 | 0.15 | 8.90 | 5.27 | 37.18 | 4.89 |
| Shanghai, China | 34.84 | 14.29 | 0.05 | 0.07 | 6.30 | 0.02 | 12.25 | 13.22 | 14.29 | 4.68 |
| Shenzhen, China | 34.84 | 14.29 | 0.05 | 0.07 | 6.30 | 0.02 | 12.25 | 13.22 | 14.29 | 4.68 |
| Sydney, Australia | 26.95 | 15.09 | 0.96 | 0.36 | 3.99 | 0.12 | 9.43 | 15.72 | 22.64 | 4.73 |
| Tashkent, Uzbekistan | 40.94 | 0.00 | 0.00 | 0.00 | 4.23 | 0.00 | 9.01 | 20.02 | 21.02 | 4.79 |
| Tehran, Iran | 28.92 | 12.56 | 0.00 | 0.00 | 2.68 | 0.00 | 14.67 | 14.63 | 21.67 | 4.87 |
| Tokyo, Japan | 10.24 | 31.55 | 0.93 | 0.69 | 5.84 | 0.28 | 11.78 | 7.14 | 31.55 | 0.00 |
| Toronto, Canada | 32.74 | 8.87 | 0.73 | 2.63 | 23.60 | 0.29 | 7.60 | 14.67 | 8.87 | 0.00 |
| Ulaanbaatar, Mongolia | 44.87 | 0.00 | 0.00 | 0.00 | 0.28 | 0.00 | 9.87 | 21.94 | 23.03 | 0.00 |
| Vancouver, Canada | 32.74 | 8.87 | 0.73 | 2.63 | 23.60 | 0.29 | 7.60 | 14.67 | 8.87 | 0.00 |
| Vienna, Austria | 36.18 | 0.00 | 0.00 | 0.00 | 19.59 | 0.00 | 10.55 | 9.05 | 24.62 | 0.00 |
| Yangon, Myanmar | 37.67 | 9.67 | 0.89 | 0.00 | 10.65 | 0.33 | 8.29 | 18.42 | 9.67 | 4.41 |
| Yixing, China | 34.84 | 14.29 | 0.05 | 0.07 | 6.30 | 0.02 | 12.25 | 13.22 | 14.29 | 4.68 |
| Zurich, Switzerland | 26.91 | 0.00 | 0.00 | 0.00 | 39.31 | 0.00 | 6.56 | 11.90 | 15.32 | 0.00 |
| All metropolitan areas | 29.14 | 14.71 | 0.50 | 0.75 | 7.91 | 0.12 | 10.81 | 13.56 | 18.92 | 3.58 |
| Metropolitan Area | Onshore Wind | Offshore Wind | Wave | Geother-Mal | Hydro-Electric | Tidal | Res. PV | Com./Gov. PV | Utility PV | CSP |
|---|---|---|---|---|---|---|---|---|---|---|
| Abidjan, Côte d’Ivoire | 3154 | 552 | 100 | 0 | 200 | 3 | 688 | 1501 | 785 | 129 |
| Addis Ababa, Ethiopia | 560 | 0 | 0 | 51 | 114 | 0 | 259 | 564 | 584 | 49 |
| Ankara, Turkey | 6043 | 356 | 0 | 102 | 2169 | 6 | 2443 | 5993 | 4890 | 497 |
| Auckland, New Zealand | 6637 | 1985 | 187 | 907 | 2424 | 91 | 4018 | 5005 | 4647 | 656 |
| Baghdad, Iraq | 4946 | 233 | 0 | 0 | 447 | 1 | 1859 | 4403 | 4113 | 378 |
| Bangkok, Thailand | 5330 | 17,497 | 0 | 29 | 846 | 10 | 33,196 | 22,976 | 48,431 | 2772 |
| Beijing, China | 55,741 | 24,851 | 231 | 51 | 8630 | 55 | 39,950 | 46,294 | 45,198 | 5840 |
| Berlin, Germany | 8598 | 4094 | 61 | 2 | 241 | 2 | 3980 | 4963 | 9320 | 0 |
| Bogotá, Colombia | 22,296 | 3239 | 576 | 0 | 3782 | 161 | 4350 | 9555 | 5004 | 807 |
| Bologna, Italy | 1384 | 505 | 35 | 15 | 218 | 1 | 818 | 696 | 857 | 119 |
| Bucharest, Romania | 1656 | 518 | 0 | 9 | 584 | 1 | 938 | 1209 | 1036 | 0 |
| Buenos Aires, Argentina | 21,191 | 5057 | 0 | 362 | 3678 | 20 | 7841 | 18,946 | 9204 | 1596 |
| Cairo, Egypt | 21,201 | 5899 | 0 | 0 | 655 | 8 | 8160 | 18,692 | 9419 | 1661 |
| Calgary, Canada | 7870 | 1992 | 243 | 300 | 4856 | 120 | 3523 | 8430 | 4121 | 0 |
| Cape Town, South Africa | 17,053 | 5173 | 511 | 0 | 104 | 6 | 9424 | 10,360 | 10,894 | 1516 |
| Caracas, Venezuela | 8319 | 1064 | 47 | 0 | 1168 | 3 | 1331 | 2912 | 1524 | 271 |
| Casablanca, Morocco | 2262 | 542 | 77 | 0 | 145 | 3 | 943 | 2176 | 1091 | 192 |
| Chicago, USA | 24,296 | 10,131 | 764 | 151 | 1852 | 8 | 10,620 | 15,771 | 15,859 | 1229 |
| Delhi, India | 28,426 | 5060 | 131 | 9 | 1396 | 22 | 20,606 | 27,426 | 32,113 | 2749 |
| Dhaka, Bangladesh | 872 | 1919 | 232 | 0 | 34 | 22 | 6645 | 2822 | 13,282 | 543 |
| Dubai, United Arab Emirates | 4895 | 9232 | 0 | 0 | 0 | 7 | 10,123 | 5790 | 93,326 | 2749 |
| Edmonton, Canada | 7225 | 1829 | 223 | 276 | 4458 | 110 | 3234 | 7739 | 3783 | 0 |
| Guayaquil, Ecuador | 4715 | 356 | 55 | 8 | 912 | 52 | 680 | 1505 | 1295 | 138 |
| Hanoi, Vietnam | 178 | 5886 | 344 | 0 | 1371 | 4 | 7992 | 5166 | 9152 | 638 |
| Havana, Cuba | 2308 | 607 | 51 | 0 | 14 | 10 | 780 | 1748 | 897 | 159 |
| Ho Chi Minh City, Vietnam | 293 | 9672 | 566 | 0 | 2252 | 6 | 13,132 | 8488 | 15,038 | 1049 |
| Houston, USA | 25,332 | 10,563 | 796 | 157 | 1931 | 8 | 11,073 | 16,443 | 16,535 | 1281 |
| Ibiza, Spain | 105 | 28 | 3 | 0 | 25 | 1 | 54 | 66 | 61 | 9 |
| Istanbul, Turkey | 19,190 | 1131 | 0 | 324 | 6888 | 18 | 7758 | 19,030 | 15,527 | 1579 |
| Jakarta, Indonesia | 8967 | 4645 | 310 | 447 | 243 | 12 | 5550 | 12,253 | 6423 | 756 |
| Karachi, Pakistan | 5030 | 2067 | 156 | 0 | 655 | 2 | 6905 | 7873 | 9905 | 763 |
| Kiev, Ukraine | 5066 | 1697 | 0 | 0 | 585 | 4 | 3411 | 2590 | 3634 | 0 |
| Kinshasa, Congo | 11,970 | 2507 | 307 | 0 | 638 | 17 | 1939 | 4295 | 2253 | 0 |
| Kyoto, Japan | 735 | 1907 | 172 | 20 | 301 | 30 | 1474 | 956 | 3607 | 0 |
| Lagos, Nigeria | 2405 | 0 | 104 | 0 | 126 | 1 | 3663 | 7983 | 8352 | 466 |
| Lima, Peru | 17,372 | 9 | 232 | 607 | 2318 | 15 | 2625 | 5723 | 5980 | 534 |
| London, United Kingdom | 8274 | 12,445 | 517 | 0 | 326 | 1992 | 5027 | 4929 | 29,209 | 0 |
| Los Angeles, USA | 33,649 | 14,031 | 1058 | 209 | 2565 | 11 | 14,709 | 21,843 | 21,965 | 1702 |
| Madrid, Spain | 12,510 | 3386 | 377 | 9 | 2952 | 174 | 6442 | 7899 | 7276 | 1016 |
| Mexico City, Mexico | 39,253 | 8745 | 1937 | 954 | 2233 | 18 | 10,535 | 23,810 | 12,128 | 2144 |
| Montevideo, Uruguay | 3627 | 663 | 200 | 0 | 879 | 9 | 1099 | 2589 | 1268 | 224 |
| Montreal, Canada | 17,294 | 4378 | 534 | 660 | 10,671 | 264 | 7741 | 18,525 | 9055 | 0 |
| Moscow, Russia | 37,306 | 11,307 | 743 | 75 | 7105 | 53 | 22,615 | 29,740 | 24,293 | 699 |
| Mumbai, India | 14,662 | 2610 | 67 | 5 | 720 | 11 | 10,628 | 14,146 | 16,564 | 1418 |
| Nairobi, Kenya | 1762 | 410 | 93 | 222 | 101 | 2 | 561 | 1244 | 653 | 109 |
| New York City, USA | 50,875 | 21,214 | 1599 | 316 | 3879 | 17 | 22,239 | 33,024 | 33,209 | 2573 |
| Oslo, Norway | 2073 | 786 | 72 | 0 | 8904 | 102 | 1804 | 436 | 1954 | 0 |
| Palma, Spain | 931 | 252 | 28 | 1 | 220 | 13 | 480 | 588 | 542 | 76 |
| Paris, France | 21,520 | 6565 | 759 | 6 | 3436 | 185 | 13,475 | 16,103 | 14,424 | 836 |
| Perth, Australia | 8456 | 3537 | 307 | 42 | 848 | 53 | 4902 | 8396 | 10,946 | 857 |
| Philadelphia, USA | 16,439 | 6855 | 517 | 102 | 1253 | 5 | 7186 | 10,671 | 10,731 | 831 |
| Phoenix, USA | 17,214 | 7178 | 541 | 107 | 1312 | 6 | 7525 | 11,174 | 11,237 | 870 |
| Pyongyang, North Korea | 1720 | 671 | 0 | 0 | 658 | 132 | 1072 | 498 | 1209 | 15 |
| Quezon City, Philippines | 350 | 598 | 54 | 159 | 101 | 14 | 733 | 1604 | 837 | 91 |
| Rio de Janeiro, Brazil | 75,546 | 8425 | 2015 | 0 | 10,953 | 22 | 12,152 | 26,687 | 13,907 | 2473 |
| Rome, Italy | 7576 | 2763 | 191 | 83 | 1194 | 6 | 4474 | 3806 | 4688 | 650 |
| San Jose, USA | 5426 | 2263 | 171 | 34 | 414 | 2 | 2372 | 3522 | 3542 | 274 |
| San José, Costa Rica | 1555 | 393 | 51 | 383 | 681 | 8 | 288 | 628 | 329 | 57 |
| Santiago, Chile | 14,396 | 3685 | 403 | 708 | 3159 | 43 | 6301 | 12,691 | 6551 | 1074 |
| São Paulo, Brazil | 78,916 | 8801 | 2105 | 0 | 11,442 | 23 | 12,694 | 27,878 | 14,528 | 2583 |
| Seoul, South Korea | 5046 | 42,634 | 0 | 0 | 1519 | 234 | 16,670 | 10,671 | 68,852 | 3508 |
| Shanghai, China | 71,374 | 31,820 | 296 | 66 | 11,050 | 71 | 51,154 | 59,277 | 57,875 | 7478 |
| Shenzhen, China | 31,483 | 14,036 | 131 | 29 | 4874 | 31 | 22,564 | 26,147 | 25,528 | 3299 |
| Sydney, Australia | 18,614 | 7785 | 676 | 93 | 1866 | 116 | 10,790 | 18,482 | 24,095 | 1886 |
| Tashkent, Uzbekistan | 1731 | 0 | 0 | 0 | 153 | 0 | 747 | 1863 | 1653 | 152 |
| Tehran, Iran | 16,314 | 6619 | 0 | 1 | 1296 | 4 | 16,493 | 17,421 | 21,211 | 1939 |
| Tokyo, Japan | 21,421 | 55,561 | 4999 | 575 | 8765 | 866 | 42,957 | 27,860 | 105,114 | 0 |
| Toronto, Canada | 27,514 | 6965 | 850 | 1050 | 16,977 | 420 | 12,316 | 29,473 | 14,406 | 0 |
| Ulaanbaatar, Mongolia | 2792 | 0 | 0 | 0 | 15 | 0 | 1243 | 3212 | 2584 | 0 |
| Vancouver, Canada | 11,304 | 2861 | 349 | 432 | 6975 | 173 | 5060 | 12,109 | 5919 | 0 |
| Vienna, Austria | 7380 | 0 | 0 | 0 | 2985 | 0 | 4074 | 4111 | 9225 | 0 |
| Yangon, Myanmar | 2269 | 407 | 106 | 0 | 355 | 23 | 628 | 1395 | 720 | 128 |
| Yixing, China | 1037 | 462 | 4 | 1 | 161 | 1 | 743 | 862 | 841 | 109 |
| Zurich, Switzerland | 3212 | 0 | 0 | 0 | 3421 | 0 | 1460 | 3091 | 3312 | 0 |
| All metropolitan areas | 1056,442 | 443,915 | 28,260 | 10,149 | 192,677 | 5945 | 605,936 | 816,748 | 1010,516 | 70,192 |
| Metropolitan Area | Onshore Wind | Offshore Wind | Wave | Geo-Thermal | Hydro-Electric | Tidal | Res. PV | Com./Gov. PV | Utility PV | CSP |
|---|---|---|---|---|---|---|---|---|---|---|
| Abidjan, Côte d’Ivoire | 0.145 | 0.257 | 0.121 | -- | 0.432 | 0.212 | 0.177 | 0.180 | 0.181 | 0.462 |
| Addis Ababa, Ethiopia | 0.343 | -- | -- | 0.743 | 0.413 | -- | 0.163 | 0.167 | 0.169 | 0.455 |
| Ankara, Turkey | 0.334 | 0.332 | -- | 0.739 | 0.410 | 0.202 | 0.182 | 0.165 | 0.188 | 0.475 |
| Auckland, New Zealand | 0.389 | 0.416 | 0.326 | 0.818 | 0.454 | 0.224 | 0.176 | 0.159 | 0.178 | 0.461 |
| Baghdad, Iraq | 0.299 | 0.142 | -- | -- | 0.363 | 0.179 | 0.175 | 0.164 | 0.176 | 0.457 |
| Bangkok, Thailand | 0.208 | 0.319 | -- | 0.826 | 0.459 | 0.226 | 0.199 | 0.202 | 0.203 | 0.527 |
| Beijing, China | 0.394 | 0.363 | 0.129 | 0.829 | 0.460 | 0.227 | 0.193 | 0.180 | 0.199 | 0.505 |
| Berlin, Germany | 0.401 | 0.419 | 0.131 | 0.845 | 0.469 | 0.231 | 0.172 | 0.143 | 0.184 | -- |
| Bogotá, Colombia | 0.146 | 0.258 | 0.133 | -- | 0.457 | 0.225 | 0.164 | 0.166 | 0.167 | 0.471 |
| Bologna, Italy | 0.341 | 0.350 | 0.126 | 0.814 | 0.452 | 0.223 | 0.186 | 0.166 | 0.207 | 0.485 |
| Bucharest, Romania | 0.364 | 0.374 | -- | 0.811 | 0.450 | 0.222 | 0.177 | 0.152 | 0.187 | 0.463 |
| Buenos Aires, Argentina | 0.374 | 0.403 | -- | 0.792 | 0.440 | 0.216 | 0.223 | 0.205 | 0.221 | 0.582 |
| Cairo, Egypt | 0.383 | 0.353 | -- | -- | 0.447 | 0.220 | 0.219 | 0.212 | 0.221 | 0.572 |
| Calgary, Canada | 0.379 | 0.405 | 0.275 | 0.797 | 0.443 | 0.218 | 0.197 | 0.158 | 0.196 | -- |
| Cape Town, South Africa | 0.393 | 0.421 | 0.310 | -- | 0.460 | 0.226 | 0.198 | 0.191 | 0.200 | 0.518 |
| Caracas, Venezuela | 0.119 | 0.238 | 0.104 | -- | 0.372 | 0.183 | 0.163 | 0.166 | 0.166 | 0.426 |
| Casablanca, Morocco | 0.368 | 0.394 | 0.256 | -- | 0.430 | 0.212 | 0.194 | 0.187 | 0.196 | 0.507 |
| Chicago, USA | 0.281 | 0.352 | 0.272 | 0.825 | 0.458 | 0.225 | 0.224 | 0.201 | 0.225 | 0.837 |
| Delhi, India | 0.377 | 0.357 | 0.123 | 0.793 | 0.440 | 0.217 | 0.169 | 0.168 | 0.197 | 0.516 |
| Dhaka, Bangladesh | 0.368 | 0.168 | 0.120 | -- | 0.430 | 0.212 | 0.158 | 0.156 | 0.160 | 0.413 |
| Dubai, United Arab Emirates | 0.392 | 0.432 | -- | -- | -- | 0.232 | 0.227 | 0.222 | 0.229 | 0.592 |
| Edmonton, Canada | 0.379 | 0.405 | 0.275 | 0.797 | 0.443 | 0.218 | 0.197 | 0.158 | 0.196 | -- |
| Guayaquil, Ecuador | 0.143 | 0.175 | 0.289 | 0.805 | 0.447 | 0.220 | 0.217 | 0.218 | 0.219 | 0.568 |
| Hanoi, Vietnam | 0.305 | 0.321 | 0.123 | -- | 0.442 | 0.217 | 0.203 | 0.204 | 0.206 | 0.537 |
| Havana, Cuba | 0.327 | 0.320 | 0.351 | -- | 0.437 | 0.215 | 0.213 | 0.211 | 0.216 | 0.557 |
| Ho Chi Minh City, Vietnam | 0.305 | 0.321 | 0.123 | -- | 0.442 | 0.217 | 0.203 | 0.204 | 0.206 | 0.537 |
| Houston, USA | 0.281 | 0.352 | 0.272 | 0.825 | 0.458 | 0.225 | 0.224 | 0.201 | 0.225 | 0.837 |
| Ibiza, Spain | 0.340 | 0.401 | 0.267 | 0.788 | 0.438 | 0.216 | 0.181 | 0.168 | 0.187 | 0.490 |
| Istanbul, Turkey | 0.334 | 0.332 | -- | 0.739 | 0.410 | 0.202 | 0.182 | 0.165 | 0.188 | 0.475 |
| Jakarta, Indonesia | 0.141 | 0.263 | 0.243 | 0.794 | 0.441 | 0.217 | 0.189 | 0.190 | 0.190 | 0.493 |
| Karachi, Pakistan | 0.343 | 0.367 | 0.112 | -- | 0.401 | 0.197 | 0.159 | 0.151 | 0.182 | 0.453 |
| Kiev, Ukraine | 0.386 | 0.413 | -- | -- | 0.451 | 0.222 | 0.176 | 0.149 | 0.193 | -- |
| Kinshasa, Congo | 0.113 | 0.138 | 0.099 | -- | 0.354 | 0.174 | 0.153 | 0.154 | 0.154 | -- |
| Kyoto, Japan | 0.335 | 0.398 | 0.131 | 0.841 | 0.467 | 0.230 | 0.192 | 0.180 | 0.210 | -- |
| Lagos, Nigeria | 0.236 | -- | 0.118 | -- | 0.424 | 0.209 | 0.164 | 0.167 | 0.167 | 0.440 |
| Lima, Peru | 0.145 | 0.178 | 0.258 | 0.820 | 0.456 | 0.224 | 0.212 | 0.216 | 0.217 | 0.553 |
| London, United Kingdom | 0.380 | 0.407 | 0.289 | -- | 0.445 | 0.219 | 0.167 | 0.134 | 0.174 | -- |
| Los Angeles, USA | 0.281 | 0.352 | 0.272 | 0.825 | 0.458 | 0.225 | 0.224 | 0.201 | 0.225 | 0.837 |
| Madrid, Spain | 0.340 | 0.401 | 0.267 | 0.788 | 0.438 | 0.216 | 0.181 | 0.168 | 0.187 | 0.490 |
| Mexico City, Mexico | 0.243 | 0.280 | 0.116 | 0.749 | 0.416 | 0.205 | 0.199 | 0.196 | 0.202 | 0.520 |
| Montevideo, Uruguay | 0.301 | 0.423 | 0.129 | -- | 0.462 | 0.227 | 0.219 | 0.206 | 0.221 | 0.572 |
| Montreal, Canada | 0.379 | 0.405 | 0.275 | 0.797 | 0.443 | 0.218 | 0.197 | 0.158 | 0.196 | -- |
| Moscow, Russia | 0.380 | 0.406 | 0.237 | 0.798 | 0.443 | 0.218 | 0.174 | 0.141 | 0.189 | 0.455 |
| Mumbai, India | 0.377 | 0.357 | 0.123 | 0.793 | 0.440 | 0.217 | 0.169 | 0.168 | 0.197 | 0.516 |
| Nairobi, Kenya | 0.260 | 0.287 | 0.117 | 0.752 | 0.417 | 0.205 | 0.179 | 0.180 | 0.180 | 0.489 |
| New York City, USA | 0.281 | 0.352 | 0.272 | 0.825 | 0.458 | 0.225 | 0.224 | 0.201 | 0.225 | 0.837 |
| Oslo, Norway | 0.391 | 0.419 | 0.254 | -- | 0.457 | 0.225 | 0.156 | 0.117 | 0.168 | -- |
| Palma, Spain | 0.340 | 0.401 | 0.267 | 0.788 | 0.438 | 0.216 | 0.181 | 0.168 | 0.187 | 0.490 |
| Paris, France | 0.390 | 0.417 | 0.253 | 0.820 | 0.456 | 0.224 | 0.174 | 0.151 | 0.190 | 0.455 |
| Perth, Australia | 0.314 | 0.421 | 0.307 | 0.836 | 0.464 | 0.229 | 0.190 | 0.185 | 0.204 | 0.544 |
| Philadelphia, USA | 0.281 | 0.352 | 0.272 | 0.825 | 0.458 | 0.225 | 0.224 | 0.201 | 0.225 | 0.837 |
| Phoenix, USA | 0.281 | 0.352 | 0.272 | 0.825 | 0.458 | 0.225 | 0.224 | 0.201 | 0.225 | 0.837 |
| Pyongyang, North Korea | 0.321 | 0.313 | -- | -- | 0.408 | 0.201 | 0.168 | 0.151 | 0.174 | 0.439 |
| Quezon City, Philippines | 0.247 | 0.284 | 0.123 | 0.794 | 0.441 | 0.217 | 0.199 | 0.202 | 0.203 | 0.520 |
| Rio de Janeiro, Brazil | 0.143 | 0.330 | 0.127 | -- | 0.447 | 0.220 | 0.196 | 0.198 | 0.200 | 0.512 |
| Rome, Italy | 0.341 | 0.350 | 0.126 | 0.814 | 0.452 | 0.223 | 0.186 | 0.166 | 0.207 | 0.485 |
| San Jose, USA | 0.281 | 0.352 | 0.272 | 0.825 | 0.458 | 0.225 | 0.224 | 0.201 | 0.225 | 0.837 |
| San José, Costa Rica | 0.176 | 0.178 | 0.128 | 0.822 | 0.456 | 0.225 | 0.209 | 0.212 | 0.213 | 0.559 |
| Santiago, Chile | 0.388 | 0.415 | 0.327 | 0.816 | 0.453 | 0.223 | 0.208 | 0.193 | 0.234 | 0.608 |
| São Paulo, Brazil | 0.143 | 0.330 | 0.127 | -- | 0.447 | 0.220 | 0.196 | 0.198 | 0.200 | 0.512 |
| Seoul, South Korea | 0.320 | 0.317 | -- | -- | 0.472 | 0.233 | 0.194 | 0.179 | 0.196 | 0.507 |
| Shanghai, China | 0.394 | 0.363 | 0.129 | 0.829 | 0.460 | 0.227 | 0.193 | 0.180 | 0.199 | 0.505 |
| Shenzhen, China | 0.394 | 0.363 | 0.129 | 0.829 | 0.460 | 0.227 | 0.193 | 0.180 | 0.199 | 0.505 |
| Sydney, Australia | 0.314 | 0.421 | 0.307 | 0.836 | 0.464 | 0.229 | 0.190 | 0.185 | 0.204 | 0.544 |
| Tashkent, Uzbekistan | 0.394 | -- | -- | -- | 0.460 | -- | 0.201 | 0.179 | 0.212 | 0.524 |
| Tehran, Iran | 0.380 | 0.407 | -- | 0.800 | 0.444 | 0.219 | 0.191 | 0.180 | 0.219 | 0.538 |
| Tokyo, Japan | 0.335 | 0.398 | 0.131 | 0.841 | 0.467 | 0.230 | 0.192 | 0.180 | 0.210 | -- |
| Toronto, Canada | 0.379 | 0.405 | 0.275 | 0.797 | 0.443 | 0.218 | 0.197 | 0.158 | 0.196 | -- |
| Ulaanbaatar, Mongolia | 0.354 | -- | -- | -- | 0.413 | -- | 0.175 | 0.150 | 0.196 | -- |
| Vancouver, Canada | 0.379 | 0.405 | 0.275 | 0.797 | 0.443 | 0.218 | 0.197 | 0.158 | 0.196 | -- |
| Vienna, Austria | 0.345 | -- | -- | 0.831 | 0.461 | -- | 0.182 | 0.155 | 0.188 | -- |
| Yangon, Myanmar | 0.213 | 0.304 | 0.108 | -- | 0.385 | 0.189 | 0.169 | 0.169 | 0.172 | 0.442 |
| Yixing, China | 0.394 | 0.363 | 0.129 | 0.829 | 0.460 | 0.227 | 0.193 | 0.180 | 0.199 | 0.505 |
| Zurich, Switzerland | 0.331 | -- | -- | -- | 0.454 | -- | 0.178 | 0.152 | 0.183 | -- |
| All metropolitan areas | 0.301 | 0.361 | 0.195 | 0.801 | 0.447 | 0.221 | 0.194 | 0.181 | 0.204 | 0.556 |
| Metropolitan Area | Residential Rooftop PV | Commercial/Government Rooftop PV | ||||||
|---|---|---|---|---|---|---|---|---|
| (a) Rooftop Area Suitable for PV in 2050 (km2) | (b) Potential Nameplate Capacity of Suitable Area in 2050 (MWdc-peak) | (c) Proposed Nameplate Capacity in 2050 (MWdc-peak) | (d) Percent of Potential Capacity to Be Installed | (e) Rooftop Area Suitable for PV in 2050 (km2) | (f) Potential Nameplate Capacity of Suitable Area in 2050 (MWdc-peak) | (g) Proposed Nameplate Capacity in 2050 (MWdc-peak) | (h) Percent of Potential Capacity to Be Installed | |
| Abidjan, Côte d’Ivoire | 122.2 | 29,237 | 688 | 2.4 | 25.5 | 6089 | 1501 | 24.6 |
| Addis Ababa, Ethiopia | 114.9 | 27,472 | 259 | 0.9 | 8.1 | 1944 | 564 | 29.0 |
| Ankara, Turkey | 71 | 17,034 | 2443 | 14.3 | 49 | 11,727 | 5993 | 51.1 |
| Auckland, New Zealand | 37 | 8810 | 4018 | 45.6 | 28 | 6677 | 5005 | 75.0 |
| Baghdad, Iraq | 115 | 27,587 | 1859 | 6.7 | 64 | 15,401 | 4403 | 28.6 |
| Bangkok, Thailand | 322 | 77,112 | 33,196 | 43.0 | 117 | 27,961 | 22,976 | 82.2 |
| Beijing, China | 418 | 99,918 | 39,950 | 40.0 | 254 | 60,792 | 46,294 | 76.2 |
| Berlin, Germany | 25 | 5948 | 3980 | 66.9 | 27 | 6493 | 4963 | 76.4 |
| Bogotá, Colombia | 310 | 74,135 | 4350 | 5.9 | 116 | 27,789 | 9555 | 34.4 |
| Bologna, Italy | 11 | 2581 | 818 | 31.7 | 4 | 933 | 696 | 74.5 |
| Bucharest, Romania | 16 | 3797 | 938 | 24.7 | 8 | 1866 | 1209 | 64.8 |
| Buenos Aires, Argentina | 216 | 51,651 | 7841 | 15.2 | 150 | 35,877 | 18,946 | 52.8 |
| Cairo, Egypt | 452 | 108,138 | 8160 | 7.5 | 159 | 38,122 | 18,692 | 49.0 |
| Calgary, Canada | 23 | 5551 | 3523 | 63.5 | 44 | 10,611 | 8430 | 79.5 |
| Cape Town, South Africa | 102 | 24,333 | 9424 | 38.7 | 52 | 12,493 | 10,360 | 82.9 |
| Caracas, Venezuela | 50 | 12,060 | 1331 | 11.0 | 20 | 4684 | 2912 | 62.2 |
| Casablanca, Morocco | 49 | 11,769 | 943 | 8.0 | 21 | 5112 | 2176 | 42.6 |
| Chicago, USA | 191 | 45,703 | 10,620 | 23.2 | 131 | 31,427 | 15,771 | 50.2 |
| Delhi, India | 600 | 143,481 | 20,606 | 14.4 | 159 | 37,999 | 27,426 | 72.2 |
| Dhaka, Bangladesh | 199 | 47,703 | 6645 | 13.9 | 29 | 6849 | 2822 | 41.2 |
| Dubai, United Arab Emirates | 64 | 15,270 | 10,123 | 66.3 | 32 | 7577 | 5790 | 76.4 |
| Edmonton, Canada | 21 | 5096 | 3234 | 63.5 | 41 | 9741 | 7739 | 79.5 |
| Guayaquil, Ecuador | 90 | 21,542 | 680 | 3.2 | 29 | 6921 | 1505 | 21.8 |
| Hanoi, Vietnam | 111 | 26,434 | 7992 | 30.2 | 27 | 6423 | 5166 | 80.4 |
| Havana, Cuba | 31 | 7519 | 780 | 10.4 | 15 | 3563 | 1748 | 49.1 |
| Ho Chi Minh City, Vietnam | 182 | 43,437 | 13,132 | 30.2 | 44 | 10,554 | 8488 | 80.4 |
| Houston, USA | 199 | 47,652 | 11,073 | 23.2 | 137 | 32,767 | 16,443 | 50.2 |
| Ibiza, Spain | 1 | 194 | 54 | 27.8 | 0 | 88 | 66 | 75.1 |
| Istanbul, Turkey | 226 | 54,086 | 7758 | 14.3 | 156 | 37,237 | 19,030 | 51.1 |
| Jakarta, Indonesia | 272 | 65,096 | 5550 | 8.5 | 86 | 20,591 | 12,253 | 59.5 |
| Karachi, Pakistan | 233 | 55,741 | 6905 | 12.4 | 62 | 14,743 | 7873 | 53.4 |
| Kiev, Ukraine | 24 | 5693 | 3411 | 59.9 | 20 | 4902 | 2590 | 52.8 |
| Kinshasa, Congo | 553 | 132,157 | 1939 | 1.5 | 179 | 42,849 | 4295 | 10.0 |
| Kyoto, Japan | 10 | 2313 | 1474 | 63.7 | 5 | 1298 | 956 | 73.7 |
| Lagos, Nigeria | 307 | 73,410 | 3663 | 5.0 | 81 | 19,446 | 7983 | 41.1 |
| Lima, Peru | 296 | 70,773 | 2625 | 3.7 | 117 | 27,934 | 5723 | 20.5 |
| London, United Kingdom | 34 | 8098 | 5027 | 62.1 | 58 | 13,796 | 4929 | 35.7 |
| Los Angeles, USA | 265 | 63,298 | 14,709 | 23.2 | 182 | 43,526 | 21,843 | 50.2 |
| Madrid, Spain | 97 | 23,175 | 6442 | 27.8 | 44 | 10,523 | 7899 | 75.1 |
| Mexico City, Mexico | 357 | 85,472 | 10,535 | 12.3 | 179 | 42,804 | 23,810 | 55.6 |
| Montevideo, Uruguay | 22 | 5235 | 1099 | 21.0 | 13 | 3184 | 2589 | 81.3 |
| Montreal, Canada | 51 | 12,198 | 7741 | 63.5 | 97 | 23,317 | 18,525 | 79.5 |
| Moscow, Russia | 133 | 31,916 | 22,615 | 70.9 | 246 | 58,848 | 29,740 | 50.5 |
| Mumbai, India | 309 | 74,006 | 10,628 | 14.4 | 82 | 19,599 | 14,146 | 72.2 |
| Nairobi, Kenya | 151 | 36,178 | 561 | 1.6 | 24 | 5684 | 1244 | 21.9 |
| New York City, USA | 400 | 95,702 | 22,239 | 23.2 | 275 | 65,809 | 33,024 | 50.2 |
| Oslo, Norway | 12 | 2962 | 1804 | 60.9 | 23 | 5446 | 436 | 8.0 |
| Palma, Spain | 7 | 1725 | 480 | 27.8 | 3 | 783 | 588 | 75.1 |
| Paris, France | 100 | 24,032 | 13,475 | 56.1 | 88 | 21,080 | 16,103 | 76.4 |
| Perth, Australia | 96 | 22,843 | 4902 | 21.5 | 57 | 13,713 | 8396 | 61.2 |
| Philadelphia, USA | 129 | 30,923 | 7186 | 23.2 | 89 | 21,264 | 10,671 | 50.2 |
| Phoenix, USA | 135 | 32,382 | 7525 | 23.2 | 93 | 22,267 | 11,174 | 50.2 |
| Pyongyang, North Korea | 19 | 4586 | 1072 | 23.4 | 6 | 1352 | 498 | 36.8 |
| Quezon City, Philippines | 59 | 14,152 | 733 | 5.2 | 15 | 3536 | 1604 | 45.3 |
| Rio de Janeiro, Brazil | 403 | 96,388 | 12,152 | 12.6 | 178 | 42,464 | 26,687 | 62.8 |
| Rome, Italy | 59 | 14,121 | 4474 | 31.7 | 21 | 5105 | 3806 | 74.5 |
| San Jose, USA | 43 | 10,207 | 2372 | 23.2 | 29 | 7019 | 3522 | 50.2 |
| San José, Costa Rica | 21 | 5126 | 288 | 5.6 | 9 | 2126 | 628 | 29.6 |
| Santiago, Chile | 104 | 24,978 | 6301 | 25.2 | 69 | 16,400 | 12,691 | 77.4 |
| São Paulo, Brazil | 421 | 100,688 | 12,694 | 12.6 | 185 | 44,358 | 27,878 | 62.8 |
| Seoul, South Korea | 107 | 25,614 | 16,670 | 65.1 | 59 | 14,142 | 10,671 | 75.5 |
| Shanghai, China | 535 | 127,942 | 51,154 | 40.0 | 325 | 77,841 | 59,277 | 76.2 |
| Shenzhen, China | 236 | 56,435 | 22,564 | 40.0 | 144 | 34,336 | 26,147 | 76.2 |
| Sydney, Australia | 210 | 50,285 | 10,790 | 21.5 | 126 | 30,187 | 18,482 | 61.2 |
| Tashkent, Uzbekistan | 29 | 6881 | 747 | 10.9 | 15 | 3473 | 1863 | 53.7 |
| Tehran, Iran | 146 | 34,944 | 16,493 | 47.2 | 88 | 20,975 | 17,421 | 83.1 |
| Tokyo, Japan | 282 | 67,389 | 42,957 | 63.7 | 158 | 37,817 | 27,860 | 73.7 |
| Toronto, Canada | 81 | 19,406 | 12,316 | 63.5 | 155 | 37,096 | 29,473 | 79.5 |
| Ulaanbaatar, Mongolia | 33 | 7894 | 1243 | 15.7 | 31 | 7355 | 3212 | 43.7 |
| Vancouver, Canada | 33 | 7973 | 5060 | 63.5 | 64 | 15,241 | 12,109 | 79.5 |
| Vienna, Austria | 27 | 6559 | 4074 | 62.1 | 22 | 5314 | 4111 | 77.4 |
| Yangon, Myanmar | 114 | 27,224 | 628 | 2.3 | 25 | 6096 | 1395 | 22.9 |
| Yixing, China | 8 | 1860 | 743 | 40.0 | 5 | 1131 | 862 | 76.2 |
| Zurich, Switzerland | 20 | 4696 | 1460 | 31.1 | 17 | 3987 | 3091 | 77.5 |
| All metropolitan areas | 11,355 | 2715,925 | 605,936 | 22.3 | 5797 | 1386,473 | 816,748 | - |
| Metropolitan Area | (a) 2050 Capital Cost of New WWS Electricity Generators Needed to Meet Annual Average Load ($bil) | (b) 2015 LCOE of BAU for Meeting Continuous Load (¢/kWh-All-Energy) | (c) 2050 LCOE of BAU Energy for Meeting Continuous Load (¢/kWh-All-Energy) | (d) 2050 LCOE of WWS for Meeting Annual avg. Load (¢/kWh-All-Energy) | (e) 2050 LCOE of WWS for Meeting Continuous Load (¢/kWh-All-Energy) | (f) 2050 Mean Private Energy Cost Savings due to Switch-ing All Energy to WWS ($/person/yr) | (g) 2050 Mean Air Pollution Damage Cost Savings to Metro Area due to Switching all Energy to WWS ($/per-son/yr) | (h) 2050 Mean Climate Cost Savings to World due to Switch-ing All Energy to WWS ($/per-son/yr) | (i) 2050 Mean Energy + Health + Climate Cost Savings due to Switching to WWS ($/per-son/yr) |
|---|---|---|---|---|---|---|---|---|---|
| Abidjan, Côte d’Ivoire | 12.1 | 8.61 | 11.05 | 5.84 | 6.62 | 364 | 2339 | 400 | 3102 |
| Addis Ababa, Ethiopia | 3.8 | 7.89 | 6.91 | 7.39 | 8.17 | 127 | 780 | 64 | 971 |
| Ankara, Turkey | 35.2 | 9.40 | 9.94 | 7.40 | 8.77 | 862 | 2033 | 2814 | 5708 |
| Auckland, New Zealand | 45.7 | 9.83 | 9.20 | 7.93 | 7.77 | 2716 | 892 | 5906 | 9513 |
| Baghdad, Iraq | 28.5 | 8.65 | 11.51 | 7.85 | 9.22 | 658 | 1440 | 3881 | 5980 |
| Bangkok, Thailand | 262.1 | 9.53 | 11.41 | 7.44 | 10.80 | 2150 | 3720 | 4886 | 10,756 |
| Beijing, China | 400.7 | 10.24 | 9.27 | 7.96 | 8.36 | 1868 | 7273 | 5562 | 14,704 |
| Berlin, Germany | 44.7 | 11.85 | 10.85 | 7.95 | 8.70 | 3213 | 2789 | 7363 | 13,365 |
| Bogotá, Colombia | 79.4 | 8.24 | 8.10 | 5.30 | 7.67 | 659 | 1157 | 1238 | 3054 |
| Bologna, Italy | 7.6 | 10.51 | 11.06 | 7.53 | 8.28 | 2445 | 2749 | 3889 | 9083 |
| Bucharest, Romania | 9.4 | 10.35 | 9.69 | 7.52 | 8.27 | 1520 | 7023 | 3473 | 12,015 |
| Buenos Aires, Argentina | 118.2 | 8.62 | 10.31 | 8.66 | 11.04 | 1720 | 1643 | 3644 | 7007 |
| Cairo, Egypt | 119.1 | 8.71 | 11.49 | 8.66 | 9.44 | 863 | 2424 | 2225 | 5512 |
| Calgary, Canada | 48.0 | 8.87 | 8.24 | 7.79 | 7.04 | 4824 | 918 | 11,880 | 17,622 |
| Cape Town, South Africa | 102.2 | 10.78 | 9.69 | 8.49 | 9.27 | 2254 | 2148 | 11,228 | 15,630 |
| Caracas, Venezuela | 25.7 | 7.79 | 8.37 | 5.89 | 8.26 | 1033 | 1104 | 3365 | 5503 |
| Casablanca, Morocco | 13.2 | 10.41 | 10.40 | 8.53 | 9.30 | 584 | 1073 | 1738 | 3395 |
| Chicago, USA | 138.3 | 10.28 | 10.43 | 7.81 | 9.33 | 3164 | 1757 | 7255 | 12,176 |
| Delhi, India | 216.0 | 10.51 | 9.68 | 7.61 | 10.07 | 444 | 4727 | 1906 | 7076 |
| Dhaka, Bangladesh | 52.0 | 8.79 | 11.80 | 5.91 | 9.28 | 211 | 1865 | 412 | 2487 |
| Dubai, United Arab Emirates | 209.1 | 8.77 | 11.89 | 7.03 | 8.40 | 8470 | 1274 | 14,956 | 24,699 |
| Edmonton, Canada | 44.1 | 8.87 | 8.24 | 7.79 | 7.04 | 4824 | 918 | 11,880 | 17,622 |
| Guayaquil, Ecuador | 14.5 | 8.14 | 9.13 | 6.03 | 8.40 | 633 | 680 | 1739 | 3052 |
| Hanoi, Vietnam | 62.0 | 8.78 | 9.20 | 8.04 | 11.41 | 379 | 1682 | 2396 | 4457 |
| Havana, Cuba | 12.0 | 9.18 | 11.98 | 8.26 | 12.01 | 726 | 3660 | 3171 | 7558 |
| Ho Chi Minh City, Vietnam | 101.9 | 8.78 | 9.20 | 8.04 | 11.41 | 379 | 1682 | 2396 | 4457 |
| Houston, USA | 144.2 | 10.28 | 10.43 | 7.81 | 9.33 | 3164 | 1757 | 7255 | 12,176 |
| Ibiza, Spain | 0.5 | 11.24 | 10.84 | 7.76 | 8.52 | 2056 | 1514 | 3550 | 7121 |
| Istanbul, Turkey | 111.7 | 9.40 | 9.94 | 7.40 | 8.77 | 862 | 2033 | 2814 | 5708 |
| Jakarta, Indonesia | 75.9 | 10.10 | 10.40 | 6.99 | 10.35 | 741 | 2966 | 1989 | 5697 |
| Karachi, Pakistan | 63.9 | 8.45 | 10.07 | 7.68 | 8.96 | 393 | 2452 | 826 | 3671 |
| Kiev, Ukraine | 29.4 | 10.55 | 9.55 | 8.15 | 8.90 | 1727 | 4885 | 4737 | 11,349 |
| Kinshasa, Congo | 38.5 | 7.95 | 8.95 | 5.43 | 6.20 | 327 | 1814 | 681 | 2823 |
| Kyoto, Japan | 15.2 | 9.90 | 10.78 | 7.81 | 9.76 | 1862 | 2183 | 6437 | 10,482 |
| Lagos, Nigeria | 44.2 | 8.48 | 10.88 | 6.34 | 7.12 | 549 | 4385 | 280 | 5213 |
| Lima, Peru | 54.7 | 8.29 | 9.23 | 6.11 | 8.49 | 668 | 1863 | 1406 | 3938 |
| London, United Kingdom | 99.0 | 11.33 | 11.16 | 7.98 | 8.73 | 2256 | 1927 | 3524 | 7707 |
| Los Angeles, USA | 191.6 | 10.28 | 10.43 | 7.81 | 9.33 | 3164 | 1757 | 7255 | 12,176 |
| Madrid, Spain | 65.3 | 11.24 | 10.84 | 7.76 | 8.52 | 2056 | 1514 | 3550 | 7121 |
| Mexico City, Mexico | 179.6 | 9.30 | 11.10 | 7.31 | 9.52 | 1336 | 1482 | 3391 | 6209 |
| Montevideo, Uruguay | 16.5 | 9.95 | 9.11 | 7.55 | 9.93 | 1012 | 1342 | 1842 | 4195 |
| Montreal, Canada | 105.5 | 8.87 | 8.24 | 7.79 | 7.04 | 4824 | 918 | 11,880 | 17,622 |
| Moscow, Russia | 234.7 | 9.16 | 10.21 | 7.95 | 7.73 | 4568 | 4682 | 10,321 | 19,571 |
| Mumbai, India | 111.4 | 10.51 | 9.68 | 7.61 | 10.07 | 444 | 4727 | 1906 | 7076 |
| Nairobi, Kenya | 9.4 | 11.75 | 10.65 | 7.38 | 8.15 | 380 | 591 | 312 | 1283 |
| New York City, USA | 289.6 | 10.28 | 10.43 | 7.81 | 9.33 | 3164 | 1757 | 7255 | 12,176 |
| Oslo, Norway | 13.0 | 7.44 | 6.61 | 6.58 | 7.33 | 2867 | 1386 | 6251 | 10,504 |
| Palma, Spain | 4.9 | 11.24 | 10.84 | 7.76 | 8.52 | 2056 | 1514 | 3550 | 7121 |
| Paris, France | 132.0 | 10.71 | 9.39 | 7.97 | 8.72 | 1737 | 1475 | 3206 | 6418 |
| Perth, Australia | 66.7 | 10.50 | 10.34 | 7.47 | 9.04 | 4144 | 1066 | 11,569 | 16,779 |
| Philadelphia, USA | 93.6 | 10.28 | 10.43 | 7.81 | 9.33 | 3164 | 1757 | 7255 | 12,176 |
| Phoenix, USA | 98.0 | 10.28 | 10.43 | 7.81 | 9.33 | 3164 | 1757 | 7255 | 12,176 |
| Pyongyang, North Korea | 9.8 | 8.06 | 7.39 | 7.47 | 7.87 | 176 | 2710 | 1706 | 4592 |
| Quezon City, Philippines | 9.1 | 10.56 | 10.59 | 7.95 | 9.35 | 297 | 3515 | 971 | 4784 |
| Rio de Janeiro, Brazil | 235.9 | 8.86 | 8.53 | 6.01 | 8.38 | 915 | 1209 | 1841 | 3965 |
| Rome, Italy | 41.5 | 10.51 | 11.06 | 7.53 | 8.28 | 2445 | 2749 | 3889 | 9083 |
| San Jose, USA | 30.9 | 10.28 | 10.43 | 7.81 | 9.33 | 3164 | 1757 | 7255 | 12,176 |
| San José, Costa Rica | 6.8 | 9.44 | 8.24 | 6.81 | 9.01 | 516 | 979 | 1246 | 2741 |
| Santiago, Chile | 84.8 | 9.87 | 9.53 | 8.50 | 10.87 | 1279 | 1781 | 4607 | 7668 |
| São Paulo, Brazil | 246.4 | 8.86 | 8.53 | 6.01 | 8.38 | 915 | 1209 | 1841 | 3965 |
| Seoul, South Korea | 265.2 | 10.31 | 10.14 | 6.82 | 11.87 | 2766 | 2154 | 11,314 | 16,234 |
| Shanghai, China | 513.1 | 10.24 | 9.27 | 7.96 | 8.36 | 1868 | 7273 | 5562 | 14,704 |
| Shenzhen, China | 226.3 | 10.24 | 9.27 | 7.96 | 8.36 | 1868 | 7273 | 5562 | 14,704 |
| Sydney, Australia | 146.7 | 10.50 | 10.34 | 7.47 | 9.04 | 4144 | 1066 | 11,569 | 16,779 |
| Tashkent, Uzbekistan | 11.1 | 8.52 | 10.65 | 7.58 | 8.85 | 1005 | 1739 | 2099 | 4844 |
| Tehran, Iran | 154.6 | 8.72 | 11.57 | 8.23 | 9.60 | 2921 | 1530 | 7360 | 11,811 |
| Tokyo, Japan | 443.3 | 9.90 | 10.78 | 7.81 | 9.76 | 1862 | 2183 | 6437 | 10,482 |
| Toronto, Canada | 167.8 | 8.87 | 8.24 | 7.79 | 7.04 | 4824 | 918 | 11,880 | 17,622 |
| Ulaanbaatar, Mongolia | 17.1 | 10.77 | 9.86 | 7.58 | 7.98 | 1161 | 3768 | 7224 | 12,152 |
| Vancouver, Canada | 69.0 | 8.87 | 8.24 | 7.79 | 7.04 | 4824 | 918 | 11,880 | 17,622 |
| Vienna, Austria | 40.5 | 9.24 | 8.67 | 6.53 | 7.28 | 3178 | 2422 | 6353 | 11,953 |
| Yangon, Myanmar | 10.3 | 7.90 | 8.60 | 6.93 | 10.29 | 241 | 2496 | 490 | 3228 |
| Yixing, China | 7.5 | 10.24 | 9.27 | 7.96 | 8.36 | 1868 | 7273 | 5562 | 14,704 |
| Zurich, Switzerland | 18.2 | 8.91 | 7.79 | 6.33 | 7.08 | 1786 | 1703 | 3602 | 7090 |
| All metropolitan areas | 7250 | 9.72 | 9.90 | 7.60 | 9.00 | 1508 | 2467 | 4270 | 8245 |
| Metropolitan Area | (a) 2050 BAU Energy Cost ($bil/yr) | (b) 2050 BAU Air Pollution Cost ($bil/yr) | (c) 2050 BAU Climate cost ($bil/yr) | (d) 2050 BAU Total Social Cost (a + b + c) ($bil/yr) | (e) 2050 WWS Energy and Total Social Cost ($bil/yr) | (f) Percent Change in Energy Cost due to WWS (e − a)/a | (g) Percent Change in Total Social Cost due to WWS (e − d)/d |
|---|---|---|---|---|---|---|---|
| Abidjan, Côte d’Ivoire | 3.8 | 19.7 | 3.4 | 26.9 | 0.7 | −80.4 | −97.2 |
| Addis Ababa, Ethiopia | 1.4 | 6.5 | 0.5 | 8.5 | 0.4 | −73.4 | −95.5 |
| Ankara, Turkey | 11.3 | 16.3 | 22.6 | 50.2 | 4.4 | −61.3 | −91.3 |
| Auckland, New Zealand | 11.8 | 2.1 | 13.9 | 27.8 | 5.4 | −54.1 | −80.5 |
| Baghdad, Iraq | 9.5 | 14.4 | 38.9 | 62.9 | 2.9 | −69.3 | −95.4 |
| Bangkok, Thailand | 64.1 | 62.4 | 82.0 | 208.6 | 28.1 | −56.3 | −86.6 |
| Beijing, China | 113.4 | 261.7 | 200.1 | 575.2 | 46.2 | −59.3 | −92.0 |
| Berlin, Germany | 18.8 | 10.8 | 28.5 | 58.1 | 6.4 | −66.0 | −89.0 |
| Bogotá, Colombia | 18.3 | 21.0 | 22.5 | 61.7 | 6.3 | −65.3 | −89.7 |
| Bologna, Italy | 3.2 | 2.6 | 3.6 | 9.4 | 0.9 | −71.3 | −90.2 |
| Bucharest, Romania | 3.6 | 11.2 | 5.5 | 20.3 | 1.2 | −67.5 | −94.3 |
| Buenos Aires, Argentina | 52.8 | 31.5 | 69.9 | 154.1 | 19.8 | −62.5 | −87.2 |
| Cairo, Egypt | 43.3 | 77.0 | 70.7 | 191.0 | 15.9 | −63.2 | −91.7 |
| Calgary, Canada | 17.5 | 2.3 | 29.4 | 49.2 | 5.6 | −68.0 | −88.6 |
| Cape Town, South Africa | 29.8 | 16.1 | 84.3 | 130.3 | 12.9 | −56.7 | −90.1 |
| Caracas, Venezuela | 5.1 | 3.4 | 10.3 | 18.8 | 2.0 | −61.3 | −89.4 |
| Casablanca, Morocco | 4.4 | 5.0 | 8.1 | 17.4 | 1.7 | −62.2 | −90.5 |
| Chicago, USA | 48.7 | 17.2 | 70.9 | 136.8 | 17.8 | −63.5 | −87.0 |
| Delhi, India | 48.6 | 245.1 | 98.8 | 392.6 | 25.6 | −47.4 | −93.5 |
| Dhaka, Bangladesh | 11.4 | 68.5 | 15.1 | 95.0 | 3.7 | −67.7 | −96.1 |
| Dubai, United Arab Emirates | 63.1 | 5.9 | 69.1 | 138.1 | 23.9 | −62.0 | −82.7 |
| Edmonton, Canada | 16.1 | 2.1 | 27.0 | 45.1 | 5.2 | −68.0 | −88.6 |
| Guayaquil, Ecuador | 4.2 | 3.0 | 7.6 | 14.8 | 1.5 | −65.1 | −90.0 |
| Hanoi, Vietnam | 11.0 | 15.4 | 21.9 | 48.2 | 7.5 | −31.6 | −84.5 |
| Havana, Cuba | 3.4 | 7.5 | 6.5 | 17.3 | 1.9 | −44.0 | −89.1 |
| Ho Chi Minh City, Vietnam | 18.0 | 25.3 | 36.0 | 79.2 | 12.3 | −31.6 | −84.5 |
| Houston, USA | 50.8 | 17.9 | 74.0 | 142.6 | 18.5 | −63.5 | −87.0 |
| Ibiza, Spain | 0.2 | 0.1 | 0.3 | 0.6 | 0.1 | −68.8 | −88.4 |
| Istanbul, Turkey | 35.8 | 51.8 | 71.7 | 159.4 | 13.9 | −61.3 | −91.3 |
| Jakarta, Indonesia | 17.8 | 42.4 | 28.4 | 88.7 | 7.2 | −59.4 | −91.8 |
| Karachi, Pakistan | 15.7 | 62.5 | 21.1 | 99.2 | 5.6 | −63.9 | −94.3 |
| Kiev, Ukraine | 9.8 | 17.5 | 17.0 | 44.4 | 3.6 | −63.3 | −91.9 |
| Kinshasa, Congo | 10.4 | 47.7 | 17.9 | 75.9 | 1.8 | −82.9 | −97.7 |
| Kyoto, Japan | 4.8 | 3.2 | 9.3 | 17.2 | 2.1 | −56.8 | −88.1 |
| Lagos, Nigeria | 16.1 | 108.2 | 6.9 | 131.3 | 2.6 | −83.9 | −98.0 |
| Lima, Peru | 16.2 | 29.6 | 22.4 | 68.2 | 5.6 | −65.5 | −91.8 |
| London, United Kingdom | 39.9 | 24.0 | 43.8 | 107.7 | 11.9 | −70.3 | −89.0 |
| Los Angeles, USA | 67.4 | 23.8 | 98.2 | 189.5 | 24.6 | −63.5 | −87.0 |
| Madrid, Spain | 27.2 | 13.8 | 32.3 | 73.4 | 8.5 | −68.8 | −88.4 |
| Mexico City, Mexico | 56.6 | 40.4 | 92.4 | 189.3 | 20.2 | −64.4 | −89.3 |
| Montevideo, Uruguay | 4.6 | 2.7 | 3.7 | 11.0 | 2.6 | −43.7 | −76.3 |
| Montreal, Canada | 38.5 | 5.0 | 64.5 | 108.1 | 12.3 | −68.0 | −88.6 |
| Moscow, Russia | 99.1 | 77.2 | 170.1 | 346.4 | 23.8 | −76.0 | −93.1 |
| Mumbai, India | 25.1 | 126.4 | 51.0 | 202.5 | 13.2 | −47.4 | −93.5 |
| Nairobi, Kenya | 4.2 | 5.1 | 2.7 | 12.0 | 0.9 | −78.1 | −92.3 |
| New York City, USA | 102.0 | 36.0 | 148.5 | 286.5 | 37.2 | −63.5 | −87.0 |
| Oslo, Norway | 8.0 | 2.0 | 9.1 | 19.1 | 3.8 | −52.3 | −80.1 |
| Palma, Spain | 2.0 | 1.0 | 2.4 | 5.5 | 0.6 | −68.8 | −88.4 |
| Paris, France | 38.4 | 19.1 | 41.5 | 98.9 | 15.9 | −58.5 | −83.9 |
| Perth, Australia | 20.5 | 3.3 | 35.4 | 59.1 | 7.8 | −61.9 | −86.8 |
| Philadelphia, USA | 32.9 | 11.6 | 48.0 | 92.6 | 12.0 | −63.5 | −87.0 |
| Phoenix, USA | 34.5 | 12.2 | 50.3 | 96.9 | 12.6 | −63.5 | −87.0 |
| Pyongyang, North Korea | 1.7 | 9.6 | 6.1 | 17.3 | 1.1 | −37.3 | −93.9 |
| Quezon City, Philippines | 2.3 | 16.8 | 4.6 | 23.8 | 0.9 | −60.7 | −96.1 |
| Rio de Janeiro, Brazil | 48.4 | 34.4 | 52.5 | 135.3 | 22.4 | −53.8 | −83.5 |
| Rome, Italy | 17.5 | 14.1 | 19.9 | 51.5 | 5.0 | −71.3 | −90.2 |
| San Jose, USA | 10.9 | 3.8 | 15.8 | 30.6 | 4.0 | −63.5 | −87.0 |
| San José, Costa Rica | 2.0 | 1.9 | 2.4 | 6.3 | 1.0 | −50.0 | −84.2 |
| Santiago, Chile | 25.3 | 15.0 | 38.8 | 79.1 | 14.5 | −42.6 | −81.7 |
| São Paulo, Brazil | 50.6 | 36.0 | 54.8 | 141.4 | 23.4 | −53.8 | −83.5 |
| Seoul, South Korea | 65.9 | 21.9 | 114.9 | 202.6 | 37.8 | −42.6 | −81.4 |
| Shanghai, China | 145.2 | 335.1 | 256.2 | 736.5 | 59.1 | −59.3 | −92.0 |
| Shenzhen, China | 64.1 | 147.8 | 113.0 | 324.9 | 26.1 | −59.3 | −92.0 |
| Sydney, Australia | 45.1 | 7.2 | 77.8 | 130.1 | 17.2 | −61.9 | −86.8 |
| Tashkent, Uzbekistan | 4.4 | 5.4 | 6.5 | 16.3 | 1.3 | −70.7 | −92.1 |
| Tehran, Iran | 53.2 | 18.4 | 88.6 | 160.2 | 18.0 | −66.1 | −88.7 |
| Tokyo, Japan | 138.5 | 92.1 | 271.6 | 502.2 | 59.9 | −56.8 | −88.1 |
| Toronto, Canada | 61.3 | 7.9 | 102.7 | 171.9 | 19.6 | −68.0 | −88.6 |
| Ulaanbaatar, Mongolia | 4.9 | 10.8 | 20.6 | 36.3 | 1.5 | −68.3 | −95.8 |
| Vancouver, Canada | 25.2 | 3.3 | 42.2 | 70.6 | 8.1 | −68.0 | −88.6 |
| Vienna, Austria | 12.5 | 6.1 | 16.0 | 34.6 | 4.5 | −64.1 | −87.0 |
| Yangon, Myanmar | 3.1 | 20.0 | 3.9 | 27.0 | 1.2 | −62.5 | −95.7 |
| Yixing, China | 2.1 | 4.9 | 3.7 | 10.7 | 0.9 | −59.3 | −92.0 |
| Zurich, Switzerland | 5.7 | 3.1 | 6.5 | 15.2 | 2.4 | −56.8 | −83.9 |
| All metropolitan areas | 2205 | 2554 | 3529 | 8288 | 859 | −61.1 | −89.6 |
| Metropolitan Area | (a) 2050 Population | (b) 2050 High Avoided Premature Mortalities/yr | (c) 2050 Mean Avoided Premature Mortalities/yr | (d) 2050 Low Avoided Premature Mortalities/yr | (e) 2050 Mean Avoided Air Pollution Cost ¢/kWh-BAU-All-Energy | (f) 2017 Percent of Global CO2 Emissions | (g) 2050 Mean Avoided Climate Change Cost ¢/kWh-BAU-All-Energy |
|---|---|---|---|---|---|---|---|
| Abidjan, Côte d’Ivoire | 8431,503 | 8922 | 7658 | 6441 | 57.1 | 0.008 | 9.8 |
| Addis Ababa, Ethiopia | 8325,962 | 5266 | 4556 | 3914 | 31.3 | 0.001 | 2.5 |
| Ankara, Turkey | 8030,105 | 2716 | 2265 | 1893 | 14.4 | 0.095 | 19.9 |
| Auckland, New Zealand | 2356,994 | 299 | 201 | 125 | 1.6 | 0.047 | 10.8 |
| Baghdad, Iraq | 10,024,201 | 2740 | 2227 | 1878 | 17.5 | 0.099 | 47.0 |
| Bangkok, Thailand | 16,781,431 | 11,183 | 8582 | 6243 | 11.1 | 0.188 | 14.6 |
| Beijing, China | 35,979,014 | 37,973 | 30,092 | 22,261 | 21.4 | 0.837 | 16.4 |
| Berlin, Germany | 3867,994 | 1394 | 1031 | 756 | 6.2 | 0.120 | 16.4 |
| Bogotá, Colombia | 18,135,932 | 4965 | 3775 | 2882 | 9.3 | 0.067 | 9.9 |
| Bologna, Italy | 935,435 | 371 | 275 | 201 | 8.9 | 0.015 | 12.5 |
| Bucharest, Romania | 1592,918 | 1969 | 1154 | 738 | 30.2 | 0.020 | 14.9 |
| Buenos Aires, Argentina | 19,168,044 | 6001 | 4353 | 3165 | 6.2 | 0.210 | 13.7 |
| Cairo, Egypt | 31,755,779 | 19,057 | 14,588 | 12,205 | 20.4 | 0.166 | 18.7 |
| Calgary, Canada | 2472,004 | 329 | 226 | 145 | 1.1 | 0.103 | 13.8 |
| Cape Town, South Africa | 7508,657 | 3416 | 2757 | 2227 | 5.2 | 0.198 | 27.4 |
| Caracas, Venezuela | 3053,642 | 713 | 550 | 436 | 5.5 | 0.031 | 16.7 |
| Casablanca, Morocco | 4651,724 | 1491 | 1145 | 907 | 11.9 | 0.019 | 19.2 |
| Chicago, USA | 9776,493 | 2016 | 1450 | 985 | 3.7 | 0.330 | 15.2 |
| Delhi, India | 51,860,328 | 52,855 | 45,226 | 37,213 | 48.8 | 0.214 | 19.7 |
| Dhaka, Bangladesh | 36,712,296 | 26,925 | 23,665 | 20,641 | 70.8 | 0.035 | 15.6 |
| Dubai, United Arab Emirates | 4620,000 | 581 | 467 | 389 | 1.1 | 0.176 | 13.0 |
| Edmonton, Canada | 2269,284 | 302 | 208 | 133 | 1.1 | 0.095 | 13.8 |
| Guayaquil, Ecuador | 4363,855 | 873 | 594 | 414 | 6.4 | 0.023 | 16.3 |
| Hanoi, Vietnam | 9136,630 | 4409 | 3628 | 2953 | 12.9 | 0.050 | 18.4 |
| Havana, Cuba | 2038,221 | 2147 | 1079 | 583 | 26.5 | 0.019 | 23.0 |
| Ho Chi Minh City, Vietnam | 15,013,384 | 7244 | 5961 | 4853 | 12.9 | 0.082 | 18.4 |
| Houston, USA | 10,193,400 | 2102 | 1512 | 1027 | 3.7 | 0.344 | 15.2 |
| Ibiza, Spain | 76,253 | 18 | 12 | 8 | 5.5 | 0.001 | 12.9 |
| Istanbul, Turkey | 25,497,667 | 8624 | 7193 | 6011 | 14.4 | 0.303 | 19.9 |
| Jakarta, Indonesia | 14,300,698 | 8854 | 7105 | 5479 | 24.7 | 0.065 | 16.6 |
| Karachi, Pakistan | 25,485,193 | 21,161 | 18,001 | 15,078 | 40.2 | 0.048 | 13.5 |
| Kiev, Ukraine | 3592,437 | 3721 | 2871 | 2144 | 17.1 | 0.061 | 16.6 |
| Kinshasa, Congo | 26,264,119 | 14,345 | 12,399 | 10,458 | 41.1 | 0.042 | 15.4 |
| Kyoto, Japan | 1448,307 | 519 | 367 | 257 | 7.2 | 0.050 | 21.2 |
| Lagos, Nigeria | 24,681,419 | 29,672 | 25,618 | 21,464 | 73.0 | 0.016 | 4.7 |
| Lima, Peru | 15,903,093 | 6995 | 5652 | 4496 | 16.9 | 0.067 | 12.7 |
| London, United Kingdom | 12,432,159 | 3368 | 2415 | 1746 | 6.7 | 0.185 | 12.2 |
| Los Angeles, USA | 13,540,336 | 2792 | 2008 | 1364 | 3.7 | 0.457 | 15.2 |
| Madrid, Spain | 9107,722 | 2117 | 1490 | 1011 | 5.5 | 0.136 | 12.9 |
| Mexico City, Mexico | 27,241,895 | 6798 | 5525 | 4502 | 7.9 | 0.261 | 18.1 |
| Montevideo, Uruguay | 1997,046 | 562 | 386 | 267 | 5.3 | 0.011 | 7.3 |
| Montreal, Canada | 5432,087 | 724 | 498 | 319 | 1.1 | 0.227 | 13.8 |
| Moscow, Russia | 16,482,525 | 10,832 | 8314 | 6395 | 8.0 | 0.743 | 17.5 |
| Mumbai, India | 26,749,083 | 27,262 | 23,327 | 19,194 | 48.8 | 0.111 | 19.7 |
| Nairobi, Kenya | 8671,968 | 2512 | 2180 | 1821 | 12.9 | 0.006 | 6.8 |
| New York City, USA | 20,472,016 | 4222 | 3037 | 2063 | 3.7 | 0.690 | 15.2 |
| Oslo, Norway | 1452,425 | 245 | 166 | 101 | 1.7 | 0.038 | 7.5 |
| Palma, Spain | 678,064 | 158 | 111 | 75 | 5.5 | 0.010 | 12.9 |
| Paris, France | 12,933,803 | 2669 | 1952 | 1432 | 4.7 | 0.175 | 10.1 |
| Perth, Australia | 3055,748 | 471 | 320 | 217 | 1.6 | 0.118 | 17.9 |
| Philadelphia, USA | 6614,938 | 1364 | 981 | 667 | 3.7 | 0.223 | 15.2 |
| Phoenix, USA | 6926,976 | 1428 | 1027 | 698 | 3.7 | 0.234 | 15.2 |
| Pyongyang, North Korea | 3547,976 | 5722 | 4960 | 4080 | 42.3 | 0.014 | 26.6 |
| Quezon City, Philippines | 4776,173 | 4224 | 3519 | 2726 | 76.0 | 0.011 | 21.0 |
| Rio de Janeiro, Brazil | 28,484,171 | 7457 | 5418 | 4030 | 6.1 | 0.150 | 9.2 |
| Rome, Italy | 5118,666 | 2033 | 1505 | 1098 | 8.9 | 0.084 | 12.5 |
| San Jose, USA | 2183,404 | 450 | 324 | 220 | 3.7 | 0.074 | 15.2 |
| San José, Costa Rica | 1946,835 | 424 | 323 | 241 | 7.8 | 0.007 | 9.9 |
| Santiago, Chile | 8421,901 | 2493 | 1789 | 1281 | 5.7 | 0.109 | 14.6 |
| São Paulo, Brazil | 29,755,050 | 7789 | 5659 | 4210 | 6.1 | 0.157 | 9.2 |
| Seoul, South Korea | 10,151,877 | 3099 | 2104 | 1575 | 3.4 | 0.440 | 17.7 |
| Shanghai, China | 46,069,710 | 48,623 | 38,532 | 28,505 | 21.4 | 1.072 | 16.4 |
| Shenzhen, China | 20,321,319 | 21,448 | 16,996 | 12,573 | 21.4 | 0.473 | 16.4 |
| Sydney, Australia | 6726,779 | 1036 | 705 | 477 | 1.6 | 0.260 | 17.9 |
| Tashkent, Uzbekistan | 3101,384 | 1362 | 1025 | 785 | 13.0 | 0.023 | 15.7 |
| Tehran, Iran | 12,037,089 | 3149 | 2583 | 2128 | 4.0 | 0.225 | 19.3 |
| Tokyo, Japan | 42,200,304 | 15,112 | 10,699 | 7493 | 7.2 | 1.450 | 21.2 |
| Toronto, Canada | 8642,211 | 1152 | 792 | 508 | 1.1 | 0.362 | 13.8 |
| Ulaanbaatar, Mongolia | 2858,569 | 2025 | 1713 | 1422 | 21.9 | 0.047 | 41.9 |
| Vancouver, Canada | 3550,633 | 473 | 325 | 209 | 1.1 | 0.149 | 13.8 |
| Vienna, Austria | 2517,227 | 788 | 584 | 406 | 4.2 | 0.067 | 11.1 |
| Yangon, Myanmar | 7995,350 | 6554 | 5704 | 4911 | 55.6 | 0.009 | 10.9 |
| Yixing, China | 669,586 | 707 | 560 | 414 | 21.4 | 0.016 | 16.4 |
| Zurich, Switzerland | 1800,243 | 377 | 269 | 187 | 4.2 | 0.027 | 8.9 |
| All metropolitan areas | 892,969,664 | 506,188 | 408,270 | 322,358 | 11.5 | 13.10 | 15.8 |
| Metropolitan Area | (a) New Long-Term, Full-Time Construction Jobs | (b) New Plus Existing Long-Term, Full-Time Operation Jobs | (c) Job Losses in Fossil-Fuel, Biofuel, and Nuclear Energy Industries | (d) Net Jobs: Long-Term, Full-Time Net Construction Plus Operation Jobs Created Minus Jobs Lost | (e) Annual Earnings from New Construction Jobs ($bil/yr) | (f) Annual Earnings from New and Existing Operation Jobs ($bil/yr) | (g) Net Annual Earnings from New Construction Plus New + Existing Operation Jobs Minus Jobs Lost ($bil/yr) |
|---|---|---|---|---|---|---|---|
| Abidjan, Côte d’Ivoire | 5667 | 5406 | 23,194 | −12,120 | 0.16 | 0.15 | −0.34 |
| Addis Ababa, Ethiopia | 2032 | 1867 | 12,037 | −8138 | 0.04 | 0.04 | −0.17 |
| Ankara, Turkey | 12,890 | 11,907 | 9105 | 15,692 | 0.81 | 0.75 | 0.99 |
| Auckland, New Zealand | 12,745 | 11,994 | 18,143 | 6596 | 1.29 | 1.22 | 0.67 |
| Baghdad, Iraq | 10,770 | 10,024 | 64,321 | −43,527 | 0.61 | 0.56 | −2.45 |
| Bangkok, Thailand | 107,220 | 103,817 | 88,152 | 122,884 | 6.80 | 6.59 | 7.80 |
| Beijing, China | 93,761 | 88,751 | 76,805 | 105,707 | 7.36 | 6.97 | 8.30 |
| Berlin, Germany | 14,075 | 15,472 | 15,546 | 14,001 | 1.43 | 1.58 | 1.43 |
| Bogotá, Colombia | 34,861 | 34,583 | 60,636 | 8809 | 1.69 | 1.68 | 0.43 |
| Bologna, Italy | 2261 | 2259 | 2305 | 2215 | 0.20 | 0.20 | 0.19 |
| Bucharest, Romania | 3221 | 2942 | 5284 | 880 | 0.29 | 0.27 | 0.08 |
| Buenos Aires, Argentina | 43,273 | 37,863 | 66,617 | 14,519 | 2.73 | 2.39 | 0.92 |
| Cairo, Egypt | 38,847 | 33,944 | 61,859 | 10,933 | 1.80 | 1.57 | 0.51 |
| Calgary, Canada | 11,524 | 9996 | 35,471 | −13,952 | 1.10 | 0.96 | −1.33 |
| Cape Town, South Africa | 31,562 | 30,370 | 44,887 | 17,044 | 1.61 | 1.54 | 0.87 |
| Caracas, Venezuela | 10,434 | 10,575 | 21,180 | −171 | 0.56 | 0.56 | −0.01 |
| Casablanca, Morocco | 5198 | 4476 | 4626 | 5048 | 0.21 | 0.18 | 0.20 |
| Chicago, USA | 33,883 | 34,334 | 50,976 | 17,240 | 4.23 | 4.29 | 2.15 |
| Delhi, India | 77,221 | 71,597 | 77,477 | 71,341 | 3.66 | 3.40 | 3.39 |
| Dhaka, Bangladesh | 31,350 | 33,780 | 25,900 | 39,230 | 0.95 | 1.02 | 1.18 |
| Dubai, United Arab Emirates | 61,021 | 92,554 | 108,104 | 45,471 | 8.54 | 12.95 | 6.36 |
| Edmonton, Canada | 10,579 | 9176 | 32,563 | −12,808 | 1.01 | 0.88 | −1.22 |
| Guayaquil, Ecuador | 7006 | 7478 | 14,522 | −38 | 0.31 | 0.33 | 0.00 |
| Hanoi, Vietnam | 28,313 | 27,118 | 21,471 | 33,959 | 1.10 | 1.05 | 1.32 |
| Havana, Cuba | 5604 | 5010 | 4312 | 6302 | 0.34 | 0.30 | 0.38 |
| Ho Chi Minh City, Vietnam | 46,524 | 44,560 | 35,281 | 55,802 | 1.81 | 1.73 | 2.17 |
| Houston, USA | 35,328 | 35,798 | 53,150 | 17,976 | 4.41 | 4.47 | 2.25 |
| Ibiza, Spain | 171 | 166 | 173 | 164 | 0.01 | 0.01 | 0.01 |
| Istanbul, Turkey | 40,930 | 37,809 | 28,912 | 49,826 | 2.57 | 2.37 | 3.13 |
| Jakarta, Indonesia | 31,022 | 26,190 | 39,045 | 18,167 | 1.61 | 1.36 | 0.94 |
| Karachi, Pakistan | 26,236 | 23,733 | 34,928 | 15,040 | 0.89 | 0.80 | 0.51 |
| Kiev, Ukraine | 10,189 | 9654 | 11,422 | 8420 | 0.54 | 0.51 | 0.45 |
| Kinshasa, Congo | 19,461 | 19,012 | 148,562 | −110,089 | 0.71 | 0.69 | −3.99 |
| Kyoto, Japan | 5139 | 6198 | 3428 | 7908 | 0.40 | 0.48 | 0.61 |
| Lagos, Nigeria | 17,452 | 14,954 | 62,911 | −30,504 | 0.68 | 0.58 | −1.18 |
| Lima, Peru | 24,967 | 26,056 | 33,187 | 17,836 | 1.15 | 1.20 | 0.82 |
| London, United Kingdom | 27,727 | 39,456 | 40,426 | 26,758 | 2.61 | 3.71 | 2.52 |
| Los Angeles, USA | 46,928 | 47,552 | 70,602 | 23,878 | 5.86 | 5.94 | 2.98 |
| Madrid, Spain | 20,423 | 19,826 | 20,720 | 19,529 | 1.74 | 1.69 | 1.67 |
| Mexico City, Mexico | 58,735 | 55,270 | 83,592 | 30,413 | 3.75 | 3.52 | 1.94 |
| Montevideo, Uruguay | 7975 | 7301 | 9523 | 5754 | 0.48 | 0.44 | 0.35 |
| Montreal, Canada | 25,323 | 21,965 | 77,947 | −30,658 | 2.42 | 2.10 | −2.93 |
| Moscow, Russia | 56,542 | 50,701 | 160,801 | −53,559 | 4.84 | 4.34 | −4.59 |
| Mumbai, India | 39,830 | 36,929 | 39,962 | 36,797 | 1.89 | 1.75 | 1.75 |
| Nairobi, Kenya | 4331 | 3879 | 19,307 | −11,097 | 0.12 | 0.10 | −0.30 |
| New York City, USA | 70,952 | 71,895 | 106,745 | 36,102 | 8.86 | 8.98 | 4.51 |
| Oslo, Norway | 5015 | 6447 | 53,418 | −41,956 | 0.65 | 0.84 | −5.44 |
| Palma, Spain | 1521 | 1476 | 1543 | 1454 | 0.13 | 0.13 | 0.12 |
| Paris, France | 37,431 | 34,347 | 36,061 | 35,717 | 3.45 | 3.16 | 3.29 |
| Perth, Australia | 20,720 | 21,250 | 36,028 | 5942 | 2.03 | 2.08 | 0.58 |
| Philadelphia, USA | 22,926 | 23,231 | 34,491 | 11,665 | 2.86 | 2.90 | 1.46 |
| Phoenix, USA | 24,007 | 24,327 | 36,118 | 12,215 | 3.00 | 3.04 | 1.53 |
| Pyongyang, North Korea | 4658 | 4929 | 5269 | 4318 | 0.11 | 0.12 | 0.11 |
| Quezon City, Philippines | 3566 | 2826 | 3585 | 2807 | 0.15 | 0.12 | 0.12 |
| Rio de Janeiro, Brazil | 81,891 | 83,962 | 96,059 | 69,794 | 4.51 | 4.62 | 3.84 |
| Rome, Italy | 12,374 | 12,364 | 12,615 | 12,123 | 1.07 | 1.07 | 1.05 |
| San Jose, USA | 7567 | 7668 | 11,385 | 3850 | 0.95 | 0.96 | 0.48 |
| San José, Costa Rica | 3216 | 3228 | 3434 | 3009 | 0.16 | 0.17 | 0.15 |
| Santiago, Chile | 31,203 | 27,387 | 37,569 | 21,021 | 2.34 | 2.05 | 1.58 |
| São Paulo, Brazil | 85,545 | 87,708 | 100,345 | 72,908 | 4.71 | 4.83 | 4.02 |
| Seoul, South Korea | 105,988 | 147,897 | 44,311 | 209,574 | 10.69 | 14.91 | 21.13 |
| Shanghai, China | 120,058 | 113,642 | 98,346 | 135,354 | 9.43 | 8.93 | 10.63 |
| Shenzhen, China | 52,957 | 50,127 | 43,380 | 59,704 | 4.16 | 3.94 | 4.69 |
| Sydney, Australia | 45,612 | 46,778 | 79,310 | 13,080 | 4.46 | 4.57 | 1.28 |
| Tashkent, Uzbekistan | 4586 | 4108 | 8600 | 94 | 0.21 | 0.19 | 0.00 |
| Tehran, Iran | 49,370 | 45,385 | 88,671 | 6084 | 3.06 | 2.82 | 0.38 |
| Tokyo, Japan | 149,729 | 180,583 | 99,883 | 230,429 | 11.61 | 14.00 | 17.87 |
| Toronto, Canada | 40,287 | 34,946 | 124,009 | −48,776 | 3.85 | 3.34 | −4.66 |
| Ulaanbaatar, Mongolia | 7334 | 6110 | 18,290 | −4846 | 0.40 | 0.33 | −0.26 |
| Vancouver, Canada | 16,552 | 14,357 | 50,949 | −20,040 | 1.58 | 1.37 | −1.92 |
| Vienna, Austria | 14,407 | 15,068 | 15,073 | 14,403 | 1.46 | 1.53 | 1.46 |
| Yangon, Myanmar | 5723 | 5348 | 14,750 | −3680 | 0.19 | 0.18 | −0.13 |
| Yixing, China | 1745 | 1652 | 1429 | 1967 | 0.14 | 0.13 | 0.15 |
| Zurich, Switzerland | 6857 | 6702 | 6359 | 7200 | 0.80 | 0.79 | 0.84 |
| All metropolitan areas | 2274,348 | 2310,046 | 3187,398 | 1396,996 | 174 | 184 | 110 |
© 2020 by the authors. Licensee MDPI, Basel, Switzerland. This article is an open access article distributed under the terms and conditions of the Creative Commons Attribution (CC BY) license (http://creativecommons.org/licenses/by/4.0/).
Share and Cite
Jacobson, M.Z.; von Krauland, A.-K.; Burton, Z.F.M.; Coughlin, S.J.; Jaeggli, C.; Nelli, D.; Nelson, A.J.H.; Shu, Y.; Smith, M.; Tan, C.; et al. Transitioning All Energy in 74 Metropolitan Areas, Including 30 Megacities, to 100% Clean and Renewable Wind, Water, and Sunlight (WWS). Energies 2020, 13, 4934. https://doi.org/10.3390/en13184934
Jacobson MZ, von Krauland A-K, Burton ZFM, Coughlin SJ, Jaeggli C, Nelli D, Nelson AJH, Shu Y, Smith M, Tan C, et al. Transitioning All Energy in 74 Metropolitan Areas, Including 30 Megacities, to 100% Clean and Renewable Wind, Water, and Sunlight (WWS). Energies. 2020; 13(18):4934. https://doi.org/10.3390/en13184934
Chicago/Turabian StyleJacobson, Mark Z., Anna-Katharina von Krauland, Zachary F.M. Burton, Stephen J. Coughlin, Caitlin Jaeggli, Daniel Nelli, Alexander J. H. Nelson, Yanbo Shu, Miles Smith, Chor Tan, and et al. 2020. "Transitioning All Energy in 74 Metropolitan Areas, Including 30 Megacities, to 100% Clean and Renewable Wind, Water, and Sunlight (WWS)" Energies 13, no. 18: 4934. https://doi.org/10.3390/en13184934
APA StyleJacobson, M. Z., von Krauland, A.-K., Burton, Z. F. M., Coughlin, S. J., Jaeggli, C., Nelli, D., Nelson, A. J. H., Shu, Y., Smith, M., Tan, C., Wood, C. D., & Wood, K. D. (2020). Transitioning All Energy in 74 Metropolitan Areas, Including 30 Megacities, to 100% Clean and Renewable Wind, Water, and Sunlight (WWS). Energies, 13(18), 4934. https://doi.org/10.3390/en13184934