Article

Exploring Wind and Solar PV Generation Complementarity to Meet Electricity Demand

LNEG—National Laboratory of Energy and Geology, 1649-038 Lisbon, Portugal
*
Author to whom correspondence should be addressed.
Energies 2020, 13(16), 4132; https://doi.org/10.3390/en13164132
Submission received: 1 July 2020 / Revised: 29 July 2020 / Accepted: 6 August 2020 / Published: 10 August 2020
(This article belongs to the Special Issue Accelerating Renewable Energy Transition Post Major World Events)

Abstract

:
Understanding the spatiotemporal complementarity of wind and solar power generation and their combined capability to meet the demand of electricity is a crucial step towards increasing their share in power systems without neglecting neither the security of supply nor the overall cost efficiency of the power system operation. This work proposes a methodology to exploit the complementarity of the wind and solar primary resources and electricity demand in planning the expansion of electric power systems. Scenarios that exploit the strategic combined deployment of wind and solar power against scenarios based only on the development of an individual renewable power source are compared and analysed. For each scenario of the power system development, the characterization of the additional power capacity, typical daily profile, extreme values, and energy deficit are assessed. The method is applied to a Portuguese case study and results show that coupled scenarios based on the strategic combined development of wind and solar generation provide a more sustainable way to increase the share of variable renewables into the power system (up to 68% for an annual energy exceedance of 10% for the renewable generation) when compared to scenarios based on an individual renewable power source. Combined development also enables to reduce the overall variability and extreme values of a power system net load.

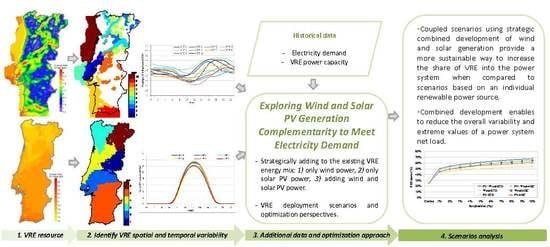
Graphical Abstract

1. Introduction

Renewable energy sources (RES) continue to grow and gain increased relevance in modern electric power. The main driver of this growth was based on subsidies, typically, and feed-in tariffs that aim to reduce the air pollution through the replacement of fossil energy sources by clean and safe RES [1,2,3]. Within the different types of RES, wind and solar photovoltaic (PV) are the most promising technologies to jointly produce a large share of renewable electricity needed to reach the EU’s 2030 ambitious targets [4,5]. Indeed, most of the power system scenarios to achieve 100% RES in European countries strongly rely on these two power sources that differ from conventional energy sources, due to the stochastic nature of their primary resource and the non (or poorly) dispatchability of the generated power, being normally referred to as variable renewable energies (VRE).
The stochastic behavior of VRE introduces new challenges to a transmission system operator (TSO) that can exacerbate the power system’s flexibility requirements to deal with their variability, especially in periods with severe power ramp events [6,7]. The added flexibility required to maintain a stable operation will increase the overall operational costs of the power system and may reduce the environmental benefits of VREs. Therefore, to decarbonize the electric power systems in a sustainable manner, new capacity deployment planning strategies addressing the variability and uncertainty associated with the large-scale integration of VRE are needed [8,9,10]. One of these strategies can be attained by performing a holistic renewable energy resource assessment and characterizing the variability and complementarity between wind and solar PV power generation [11,12,13].
Several studies have focused on investigating the exploitation of wind and solar PV power production complementarity to cope with VREs variability and reduce the flexibility requirements [12,14,15,16]. Using different approaches, most of the studies reveal the existence of complementarity in different locations and time scales, from hourly to annual, associated with the diurnal cycle of solar radiation as well as some seasonality [17,18]. The evaluation of wind and solar correlations in Sweden was presented in [19]. The authors showed negative correlation values between these two power sources at hourly and annual scales. The work developed in [20] identifies a strong temporal negative correlation between irradiance and wind speed, i.e., as the irradiance values tend to increase the wind speed values reduce and vice versa. The authors concluded that the total VRE daily variability in Britain can be reduced by installing the solar PV capacity, with the 70%-solar and 30%-wind scenario being the one presenting lower seasonal variability. The wind and solar PV power production variability for several EU countries was examined in [8], using data from 15 observed sites. With the exception of the North Sea islands and the near offshore wind parks, the authors identified a negative correlation between wind and PV generation, supported by their characteristic diurnal pattern of pressure gradients. Using a reanalysis database, in [21] the authors identified the potential synergy between wind power and solar PV in West Africa for achieving a balanced power output using limited storage capacity. The contribution VRE to increase energy security in the Latin America region through resource complementarity was addressed in [22]. The authors show that the potential of wind and solar complementarity in this region is high and the Brazilian northeast has the strongest complementarity potential, since it presents high wind speed values during nighttime, being then, complementary with the solar resource.
The wind and solar PV complementarity have also been verified on the Iberian Peninsula using different datasets and approaches [23,24]. For this region, results highlight the joint operation of wind and PV power to mitigate the present wind power variability, since a strong complementarity between wind and PV was found, especially during the summer months. In [25], a considerable complementarity between the wind and solar power production in Portugal was also identified, i.e., when the solar PV output is maximum, wind generation tends to exhibit the minimum values (daytime), and vice versa. The authors addressed future VRE deployment scenarios, and their results suggest no correlation between demand and a solar/wind combination during a 24-h period. These conclusions may be partly explained by the approximations taken in the work, namely the use of (i) wind surface data that does not take into account some vertical phenomena (e.g., vertical stratification) and (ii) the non-exploitation of wind power regions with a generation profile more suitable to meet the national electricity demand.
Despite the benefits of complementarity, its potential is still not explored in most energy system models used for policymaking towards future low carbon power systems. On the one hand, the complementarity outcomes of different works are difficult to extrapolate and are very case dependent. On the other hand, the models present several simplifications regarding the generation spatiotemporal data [26] as well as the optimization perspective which is normally only economic. The spatiotemporal simplifications comprise low (i) temporal resolution (e.g., an average year is split in a low number of typical time-slices) and (ii) spatial resolution (e.g., the national aggregated generation is represented using only a time-series). These over-simplified approaches intend to reduce the computational complexity keeping the simulation computationally tractable, although they neglect all the VRE resource potential available (e.g., different production patterns) within a region (or a control zone) and phenomena, such as the statistical power smoothing potential, which are crucial for the power system operation [9,27]. For countries/regions having a very complex orography and a large shoreline capable of influencing the spatial distribution of renewable generation primary resources, the previous simplifications prevent the selection of the most adequate solutions regarding the power source as well as the spatial location of the additional power capacity.
To overcome the previous limitations identified, this work contributes with a methodology to establish wind and solar expansion power capacity scenarios, by considering their spatiotemporal complementarity, i.e., the synergy to attain the national/regional electricity demand. Thus, instead of only understanding the statistical relationship (complementarity) between these energy sources, this methodology permits to optimize the wind and solar PV power capacity ratio within a TSO control region (in this case a whole country) by considering the electricity demand needs and different optimization perspectives that enable to strategically identify the most adequate regions and install each power source. Using high resolution data and Portugal as a case study, the following deployment scenarios are considered and compared, strategically adding to the existing VRE energy mix: (1) only wind power, (2) only solar PV power, (3) adding wind and solar PV power. For each scenario, a characterization of the additional power capacity, typical daily profiles, extreme values, and the VRE energy surplus/deficit are assessed. The introduction of the VRE complementarity [28] and demand criteria in new VRE deployment constitutes a crucial step towards the planning of a secure and reliable nearly 100% renewable power system by reducing the flexibility needs to deal with the variability and uncertainty related to these technologies, and additional potential benefits are expected for the power system and the final consumers. This work does not replace the necessity of additional technologies capable of providing the power system’s flexibility needs to deal with VRE variability, namely, the use of energy storage technology, which will always be necessary, and whose optimized dimensioning is outside the scope of this paper. Nevertheless, this work contributes significantly to the minimization of storage capacity and, as such, to the reduction of system costs, as this type of solution still has a high investment cost [1,29].
The methodology presented in this work represents a new planning paradigm, since until now, the only criteria to deploy the VRE capacity has been to find locations without any environmental/technical constraints that maximize the generation, which understandably allows higher revenues for the power producers although it can raise some concerns regarding the power systems’ flexibility.

2. Holistic Renewable and Complementarity Assessment Methodology

A schematic flowchart with the main steps of the methodology developed is depicted in Figure 1.
It should be noted that the proposed methodology only addresses the temporal and spatial integration aspects of wind and solar PV within a region of control (of the power system) and the benefits of the complementarity assessment. It does not cover other relevant aspects such as economic costs, land availability, social acceptance, storage technologies, and so forth that should be also analyzed in future works [30]. Below, a detailed explanation of the methodology is provided that is able to be transferred and applied in other regions/power systems.

2.1. Identification of Power Generation Patterns

The identification of power generation patterns based on high-resolution data allows synthesizing the information of each point of the grid by extracting the main pattern features in the region under analysis. With this approach, it is possible to filter the local effects of the individual grid points and group grid points with a similar power production behavior providing a better understanding of generation features [31,32]. Moreover, instead of detecting specific grid points that could be unfeasible due to constraints (e.g., protected zones), using this approach, the most suitable regions for the installation of future VRE capacity and plants are identified. Thus, the identification of power production patterns that distinguish regional circulations is a key step to explore the wind and solar PV power production complementarity. This step can be obtained through a clustering analysis.
Cluster analysis is a classic technique employed to divide data among a set of clusters according to the similarity among observations in such a way that cluster elements are always more similar (in some sense) to each other than to those of other groups, with higher dissimilitude between the clusters [33,34]. With this step, it is possible to detect statistical patterns of data that can often be associated with different physical processes. Although cluster analysis does not always reveal the results of a specific physical process, if there are prevailing behaviors in a group of elements, they will be reflected in one of the clusters. Therefore, in this work, the power production patterns were identified using the K-medoids clustering technique [34], Equation (1), applied to the power production input matrix ( X n ), Equation (2).
D = argmin ( k = 1 K n = 1 K ( X n C k 2 ) )
X n = [ W 1 , 1 W 1 , 2 W 1 , i W 2 , 1 W 2 , 2 W 2 , i W n , 1 W n , 2 W n , i ]
In the previous equations, D is the distance between the observations and the medoid of each cluster, C k is the cluster medoid of the K-th cluster, n represents the records available, while i represents the spatial points available. The clustering algorithm is applied separately for wind and solar PV production spatial fields. Despite the subjectivity on the exact definition of the cluster centers, this methodology enables a consistent classification for most of the data. The K-medoids technique is a non-hierarchical clustering algorithm to group the data in K clusters, where K is beforehand defined. The optimal value of K is determined using the Calinski–Harabasz (CH) criterion [35]. This criterion allows detecting the appropriate number of clusters by calculating the Euclidean distance between the clusters and comparing the internal sum of squared errors of each cluster. Hereafter, the production patterns obtained using this technique are designated as wind production patterns (WPP) and solar PV production patterns (SPP).

2.2. Optimization Greedy Algorithm

Currently, due to the increasing environmental, energy security, and policy goals, the deployment of renewable capacity is constrained by different objectives functions. In multi-objective problems, there is no solution that simultaneously optimizes all the being necessary to decide a priori the relative importance (the weight) of each objective to create a suitable (prescribed) optimal objective function [36]. Thus, despite the importance, for example, of the storage systems and interconnections to accommodate energy surpluses/deficits, this work focus only in the synergy between wind and solar generation to attain the electricity demand. In this sense, a greedy algorithm to identify the future VRE deployment pathways was implemented [37]. This algorithm is especially useful for optimization problems with linear objective functions, due to its simplicity when compared with other heuristic search algorithms that present a higher computational effort and require the definition of path cost functions.
The greedy algorithm chooses the “most attractive” alternative in every iteration [37]. Broadly speaking, using the current net load power capacity (computed on the basis of the demand and the current VRE generation) as a baseline, at each iteration, 10 MW are added to the previous net load time series by selecting the WPP or SPP that minimizes a predetermined criterion. The algorithm stops when a determined annual VRE energy generation exceeds the annual electricity consumption— Surplus Max . Different VRE energy exceedance (i.e., surplus) values were tested—from 1% to 10%. The maximum value criterion—10%—is related to the maximum VRE energy curtailment observed during an entire year [38]. An additional restriction for the installation of new parks in each region was imposed by considering only a maximum of 10% ( Max area ) of the area available for additional wind and solar power capacity deployment ( WPP area and SPP area ) , i.e., after the identification of the spatial points associated to each cluster, only 10% of the area available can be used. For the wind turbine used in this work, a wind park with 10 MW and an interturbine distance of three rotor wind turbine diameter requires an area of 1.0 km2 ( WindPark area ), while the area needed (based on data from Portugal) was a typical fixed solar PV park with 10 MW that corresponds to 0.3 km2 ( SolarPark area ) .
Two different objective functions are dedicated to identifying the pathways regarding the integration of these technologies into power systems. These functions are the minimization of: (i) the net load (NL) annual variability by computing the annual standard deviation (Equation (3)) and (ii) one-hour net load step-change standard deviation (Equation (4)). The selection of these objective functions is related to the operational impact of VRE variability into the power system, namely, the required operational capacity that TSO has to adjust, using the production of dispatchable power plants (running or start-up/shut-down), storage, and interconnections, for maintaining the power system balance [8,39].
min STD ( Z )
STD ( Z ) = t = 1 T ( Z ( t )   Z ¯ ) 2 T 1 t
The proposed model has two instances according to the definition of Z ( t ) that can either be (5) or (6):
Z ( t ) = NL ( t ) t
Z ( t ) = NL ( t ) NL ( t 1 ) t
and are subject to restrictions related to the annual VRE energy generation surplus regarding the annual electricity consumption (7) and the area available for additional wind (8) and solar (9) power capacity deployment within each region:
100 ( t VRE surplus ( t ) Demand ( t ) ) Surplus max .
w it N WPP ( it , w ) WindPark area w Max area WPP area ( w )
s it N SPP ( it , s ) SolarPark area s Max area SPP area ( s )
with:
NL ( t ) = Demand ( t ) VRE ( t ) t
VRE ( t ) = WP ( t ) + SP ( t ) + w it N WPP ( it , w ) WPP ( t , w ) + s it N SPP ( it , s ) SPP ( t , s )   t , it , w , s
VRE surplus ( t ) = { VRE ( t ) Demand ( t ) ,   if   VRE ( t ) > Demand ( t ) 0 ,   if   VRE ( t ) Demand ( t ) t
Z , NL , VRE , VRE surplus ,   N W ,   N S
where the index domains for time is t [ t 1 , t 2 , , t 8760 ] , for the number of installations units it [ it 1 , it 2 , , it 1000 ] , and for the different wind w [ w 1 , w 2 , , w 10 ] and solar s [ s 1 , s 2 , , s 10 ] regions, respectively.
In Equations (7) to (13), N WPP and N SPP represent the number of wind and solar power parks identified through the optimization algorithm for each WPP and SPP, VRE surplus denotes the power generation surplus. Demand represents the hourly electricity consumption while WP and SP denote the existing wind and solar PV hourly generation.

3. Case Study and Data

3.1. Characteristics of the Portuguese Power System and Weather Conditions

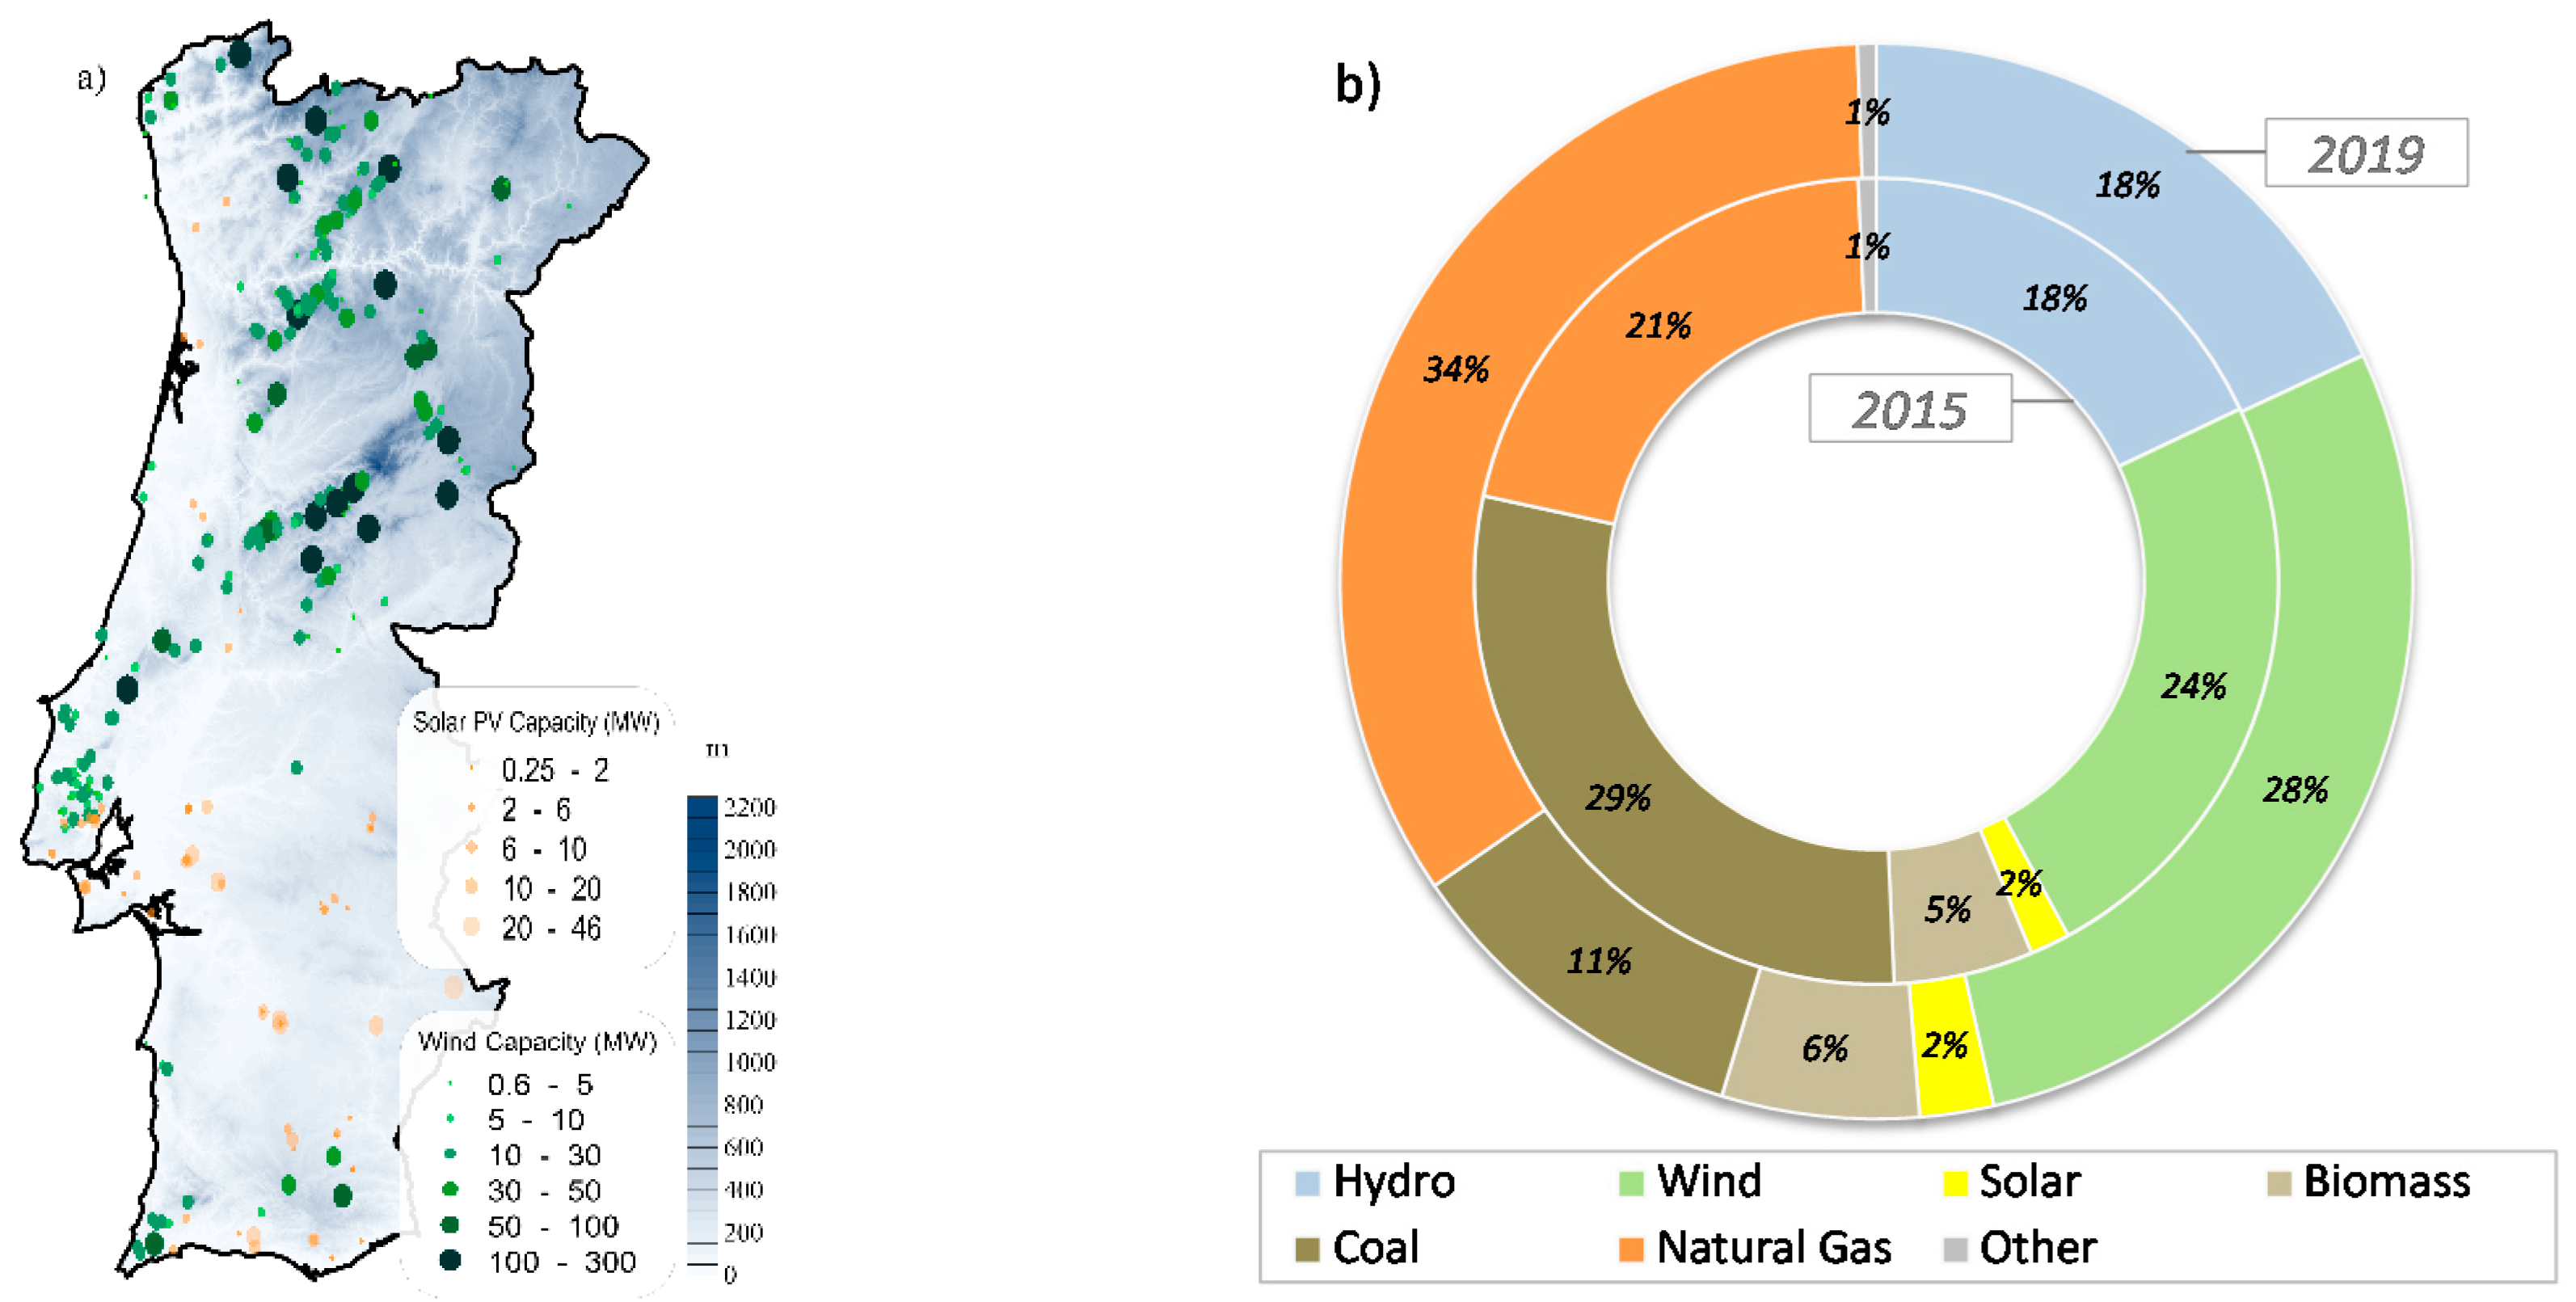
In Figure 2a, the geographical wind and solar installed power capacity are depicted for 2015 (reference year in this work, as in the Portuguese national energy and climate plan for 2030). At the end of 2015, the wind power capacity was 5034 MW. At the end of 2019, the wind power installed capacity only increased 391 MW to 5429 MW. Contrasting with the solar PV power capacity, most of the wind power sites are located in the mountain regions of the center/north of Portugal, with some exceptions on the west and southwest coast. This concentration is explained by the wind resource available, and as described in [40], it can introduce additional challenges to TSOs. Indeed, the authors relate the occurrence of strong wind power ramp events, unleashed by certain weather conditions that usually extend over several hundreds of kilometers (e.g., cold fronts), with these locations. Moreover, as depicted in Figure 3, due to local effects such as the mountain/valley breezes, on average, the highest wind power generation levels occur during nighttime, showing no correlation with the electricity demand. Thus, and taking into account the wind energy sector maturity in Portugal, a strategical wind power deployment is needed to (i) complement the current wind power production promoting the statistical power smoothing effect and (ii) meet the electricity demand.
The solar PV power capacity is still low in Portugal (731 MW at the end of 2019). At the end of 2015 (reference year), the total capacity was 454 MW. Most of this capacity is located in the south region of the country, Figure 2a. Nevertheless, with the rapid growth of the solar PV industry and the substantial drop in the price of solar panels, it is foreseen that solar PV generation will play a crucial role in the Portuguese power system in the near future. This expectative, strongly supported by recent governmental policies, is associated with: (i) a very high resource potential, due to the geographical position and climate conditions of Portugal, (ii) the opportunity to decentralize electricity production enabling to reduce transmission losses, and (iii) the daily profile of the solar resource patterns that are correlated with the electricity demand (Figure 3).
In the last years, the annual share of electricity generation from renewable energy sources has ranged from nearly 40% to 60%, Figure 2b. The wind power generation contributed with 24% in 2015 and 28 % in 2019. These values are even more significant, as the electricity demand also increased from 49.0 TWh in 2015 to 50.3 TWh [41]. The contribution share from solar PV power is still residual −2%. From Figure 2b it is possible to verify that the dependence on fossil fuels to balance the demand is essentially supplied by coal and natural gas. The reduced hydro contribution is associated with extremely dry years. Indeed, the role of this technology in the Portuguese power system has been characterized by a strong variability in consecutive years (severe dry year followed by strong raining year). As in many countries, hydropower reservoirs (with and without pumped technology) in Portugal are also responsible for counterbalancing the electricity demand and the VREs variability. However, due to the increased environmental restrictions, in the coming years, a significant deployment capacity of this type of technology in Portugal is not foreseen. Thus, these limitations associated, coupled with the foreseen decommissions of the old coal-based power plants, highlight the need for a careful assessment of the deployment of the new VRE power capacity.
In Figure 3 is also depicted the demand and the net load profile (the consumption minus the wind and solar production). The net load corresponds to the load that needs to be suppressed by the remaining power generation fleet. On average, the highest demand consumption values are observed between 7–9 p.m., due to domestic users. To some extent, the current net load profile allows already to observe the complementarity between wind and solar PV generation, which contributes to a daily average value of nearly 1800 MW. Nevertheless, this complementarity is incapable of following the electricity demand. The annual VRE energy surplus percentage value regarding the electricity demand (i.e., the instantaneous sum of the wind and solar generation above the consumption) during the year 2015 was only 9.2e−04.
As identified for other phenomena (e.g., precipitation [42]), due to the geographical location, along with its topographical features and weather conditions, different regional wind and solar power production patterns can be observed in Portugal [43]. The atmospheric circulation in Portugal is strongly influenced by the seasonal migration of the mid-latitude high pressure system [44]. In winter, when the subtropical high pressure is usually centered at lower latitudes, warm and cold fronts and other baroclinic synoptic perturbations moving eastward from the Atlantic Ocean are observed. In late spring to early autumn, the western perturbations are blocked by this subtropical system that expands to higher latitudes (typically centered in the Azores). Under these conditions, this synoptic circulation is weak and diffused over Portugal, which promotes small scale (e.g., valley/mountain and sea/land breezes) and regional locally-forced atmospheric features as a thermal low pressure system inland in the middle of the Iberian Peninsula [45]. During this period, when a sharp contrast between high temperatures over land and inferior temperatures over the sea is observed, strong parallel winds and changes in the cloudiness (and radiation) [43] are triggered. These seasonal winds, also known as Nortada, are observed mainly in western coastal regions [46]. The inner center/south and southern regions show a complex topography, with several mountains. Thus, the displacements and changes in the intensity of the subtropical high pressure, along with their interaction with the complex orography, generate a range of differentiated regional wind and solar climates [43].

3.2. Data

For the purpose of this study, one-hour resolution data (electricity demand, wind, and solar PV power production time series) for the year 2015 were used. As supported by [9,47], an hourly resolution permits modelling the energy system flexibility requirements with a sufficient level of detail. The year 2015 was used as a reference period for the Portuguese national energy and climate plans and, according to the Portuguese system operator, was considered a typical year, regarding wind power production.
The national aggregated demand and production data were gathered from the national TSO website [41]. In this study, the electricity demand was considered inelastic and its potential increase in the next years with electricity consumption was not considered.
The wind speed data were derived from a numerical weather prediction (NWP) model, with a high spatial resolution (5 km × 5 km). NWP allows performing regional and/or national wind speed characterization without resorting to an extensive and costly network of anemometric stations. These models have the ability to describe, in an accurate way, the behavior and evolution of air masses and to treat explicitly the inherent phenomena of turbulence and atmospheric stratification [48]. In this work, the fifth-generation mesoscale model (also known as MM5) model [48] was used, and it was fed with the NCEP Climate Forecast System Version 2 (NCEP-CFSv2) reanalysis [49], with a horizontal grid spacing of 0.5° × 0.5°. On the basis of sensitivity tests of mesoscale model initial and boundary data and parameterizations and using meteorological stations the model was calibrated for the region under analysis. The model was configured for recording data every hour during 2015 in three domains. The calibration steps follow a similar approach to the one described in [50]. The last domain has a spatial resolution of 5 km, encompassing the onshore and offshore regions of Portugal. Regarding the offshore data, only the spatial points within the bathymetries 0 to 300 m were considered. For each point, wind speed data at 80 m above ground level were obtained and converted to wind power using a power curve of the most typical wind turbine in Portugal—Enercon E82, with 2.0 MW nominal capacity. According to the power curve used, the operational wind speeds range from 2 m/s (cut-in) to 25 m/s (cut-out), reaching the nominal power at 13 m/s. To avoid the installation of wind turbines in locations without economic viability, the spatial points that show a yearly wind speed below 5.5 m/s were excluded.
The hourly solar power data used in this work were gathered from the Photovoltaic Geographical Information System (PVGIS) web-based tool, which was developed at the Renewables & Energy Efficiency Unit. The solar PV power production is based on solar radiation data from the Satellite Application Facility on Climate Monitoring (CMSAF) [51,52]. This database is being extensively validated over Europe, showing a high level of accuracy and being a suitable tool for solar radiation and photovoltaic uses at any place over the globe [53,54]. In the present work, the data were extracted for the same geographical points considered in the wind resource step that considers a crystalline silicon panel and the following configuration: 10 MW of installed peak PV power, system overall losses equal to 10%, and the optimal azimuth and inclination angles for each point when considering the influence of shadows from the terrain.

4. Identification and Characterization of the Spatial Power Patterns

4.1. Wind Power

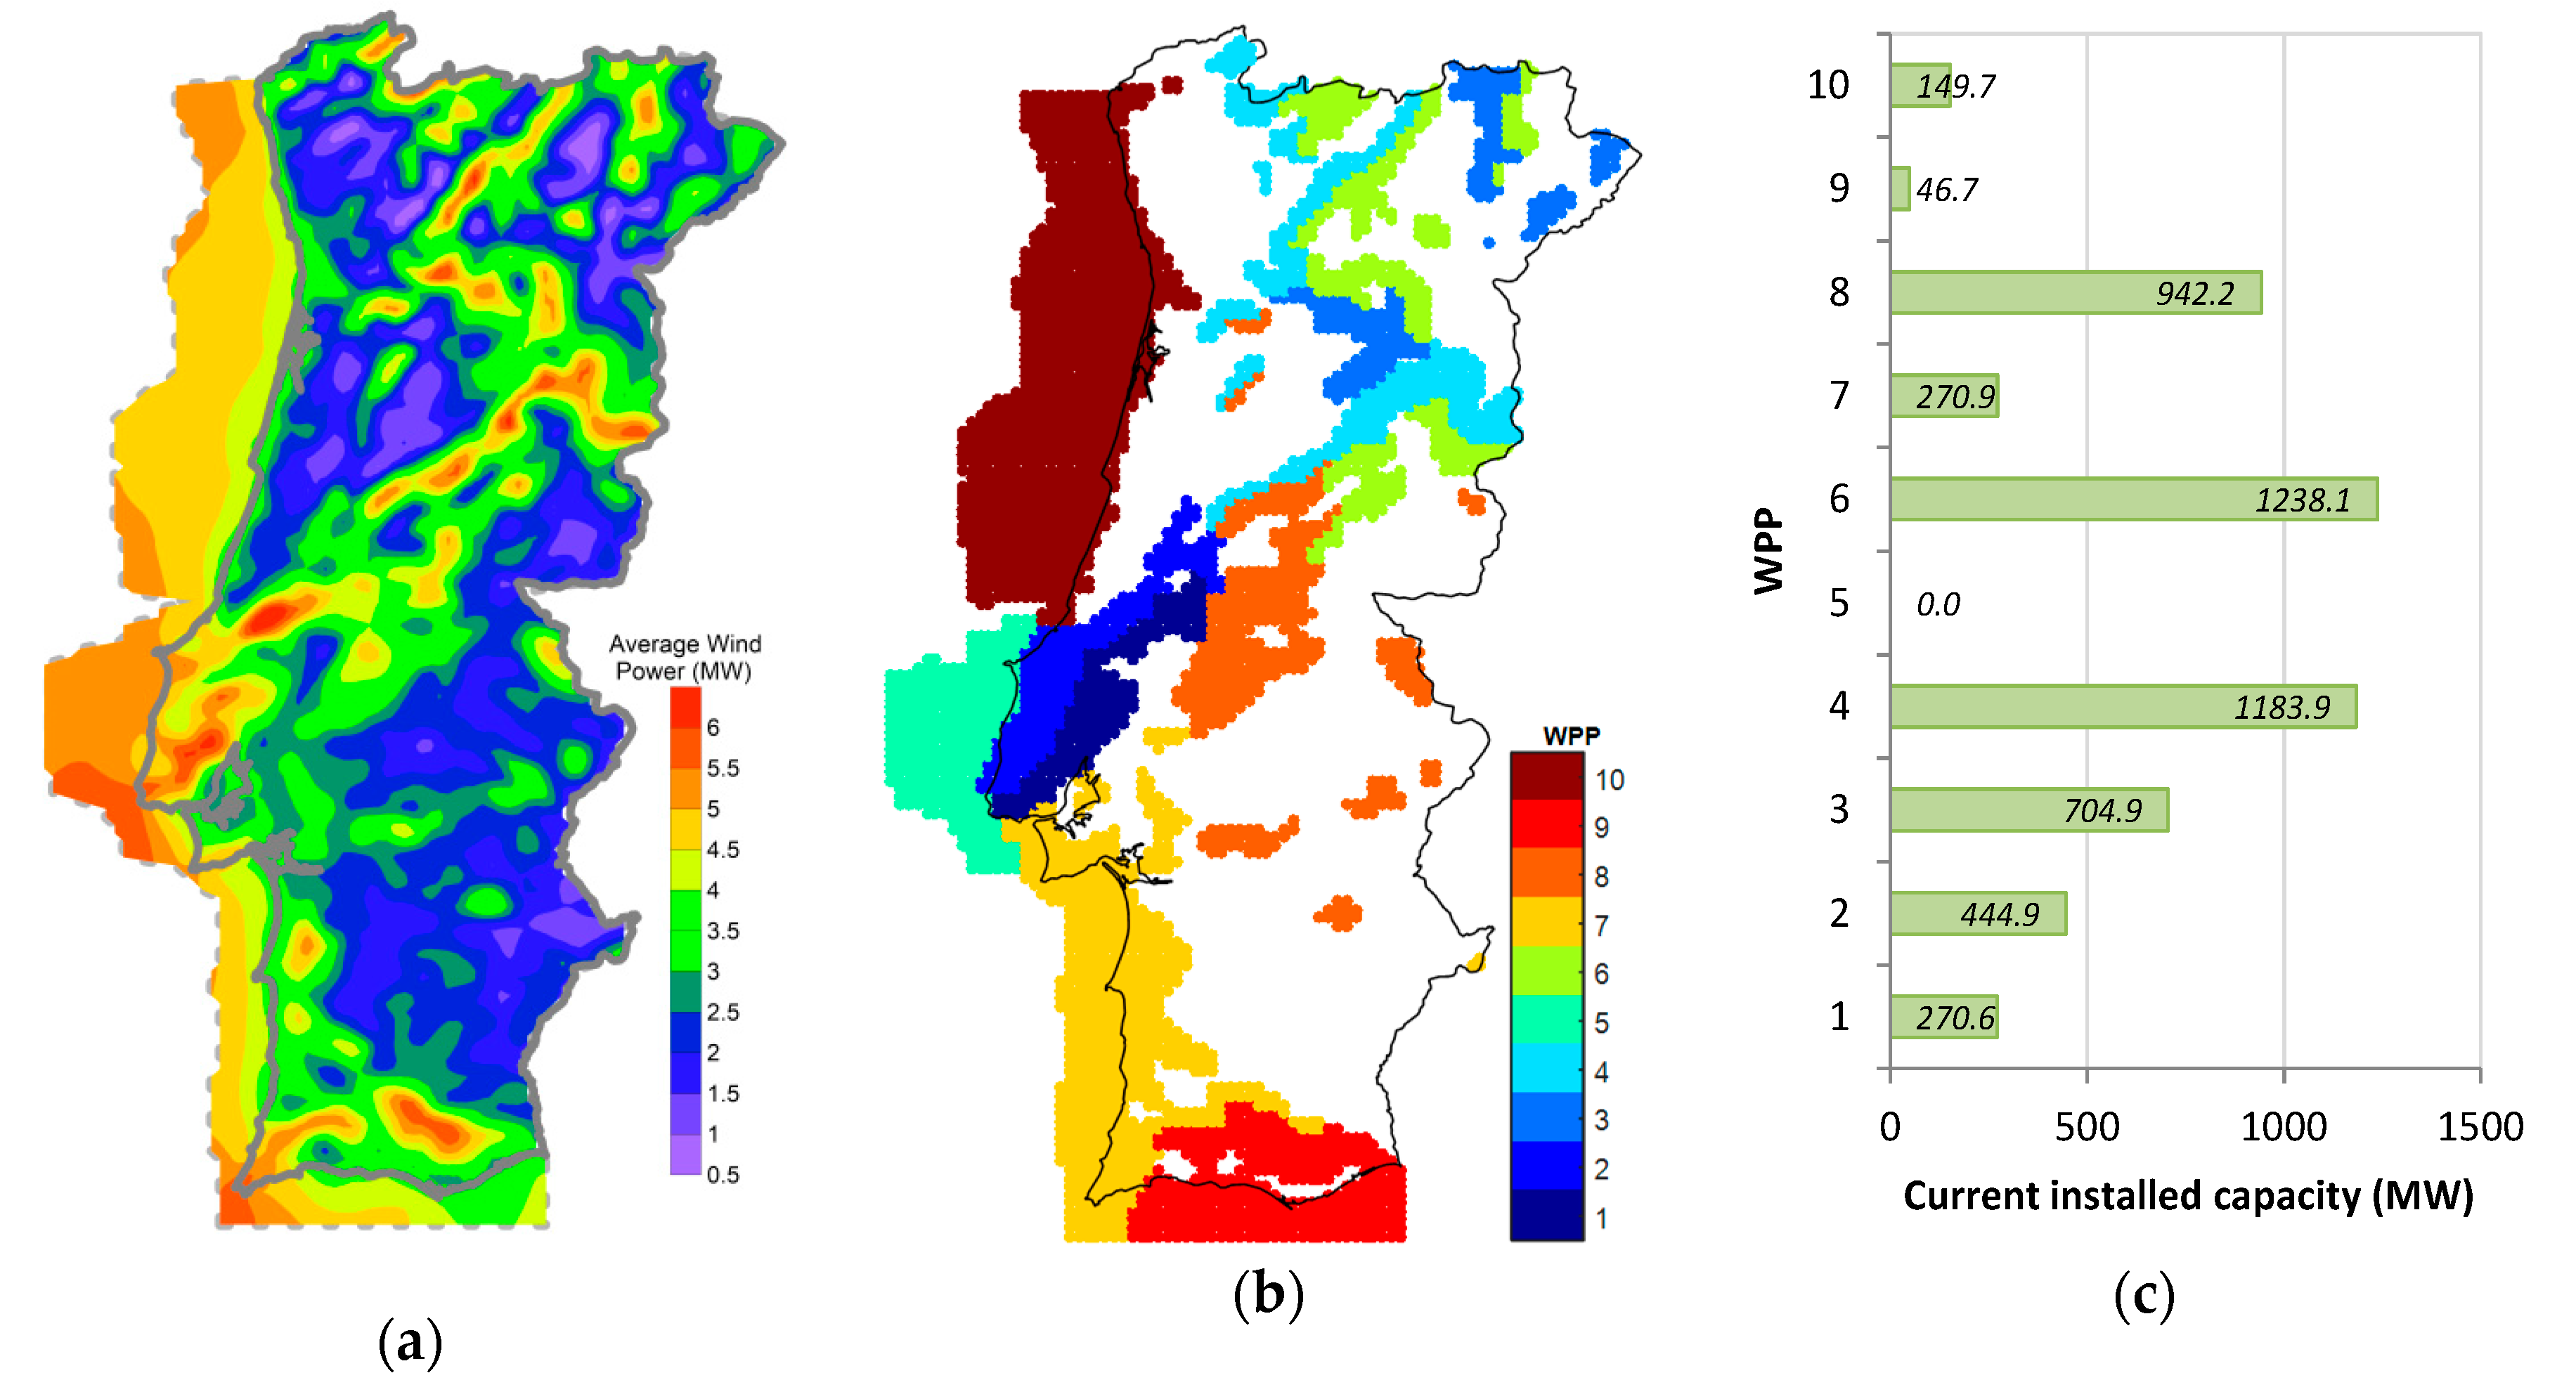
In Figure 4a, the average power capacity profiles considering a wind park with 10 MW for each spatial point is shown. Based on the CH criterion, a suitable number of WPP is ten. Figure 4b depicts the spatial distribution of each WPP, while Figure 4c exhibits the current nominal power capacity located within each WPP. In Figure 5, the average daily and monthly wind power patterns are depicted to provide further insights regarding the features of each WPP. These profiles are computed using all points associated with each cluster.
The results from Figure 4 and Figure 5 highlight the impact of the different local features into the wind power production profiles. In the coastal zones, the pressure gradients produced by the temperature contrast between land/sea regions combined with their exposure to severe meteorological events, explain the WPPs #1, #2, #5, #7, and #10 daily and annual profiles. In these regions, the temperature contrast between the ocean and the land increases in the summer allowing to observe higher wind power production values during these months when compared to winter months, Figure 5b. In the winter, due to their location on the western coast, where most of the windstorms reach Portugal [55], significant wind power productions can also be observed. A decrease in the level of production is expected during the spring and autumn. Some small differences can be found in the amplitude of the daily profile and peak hour of these WPPs. Thus, WPPs #2, #7, and #10 have their peak production in the middle of the afternoon, and the reaming patterns tend to reach the maximum in the late afternoon. These dissimilarities can be associated with local thermal effects as discussed previously.
Figure 4c evidences that more than 3 GW of the current wind power capacity is located in only four onshore regions—WPPs #3, #4, #6, and #8, which are spatially concentrated in the center/north of Portugal. All these WPPs show a similar daily pattern associated with the atmospheric thermal stratification [56,57]. On average, the highest wind power values are observed during the night-time and a reduction in their intensity is expected during the day, leading to a “U” shape daily profile, Figure 5a. In the case of WPP #8, the minimum value is reached at nearly noon, while in the remaining WPPs, the minimum is obtained in the first hours of the morning. WPP #9 also exhibits a similar daily profile, although the hourly gradients tend to show a smooth behavior contrary to previous WPPs. The daily amplitude of the power production is very reduced for WPP #4 compared to the remaining WPPs. This result can be partially explained by the widely spatial distribution of this WPP that can mitigate severe variations. The analysis of the monthly profile highlights the similarities of these WPPs, showing a clear annual cycle, Figure 5b. The high wind season is during the winter months.

4.2. Solar PV Power

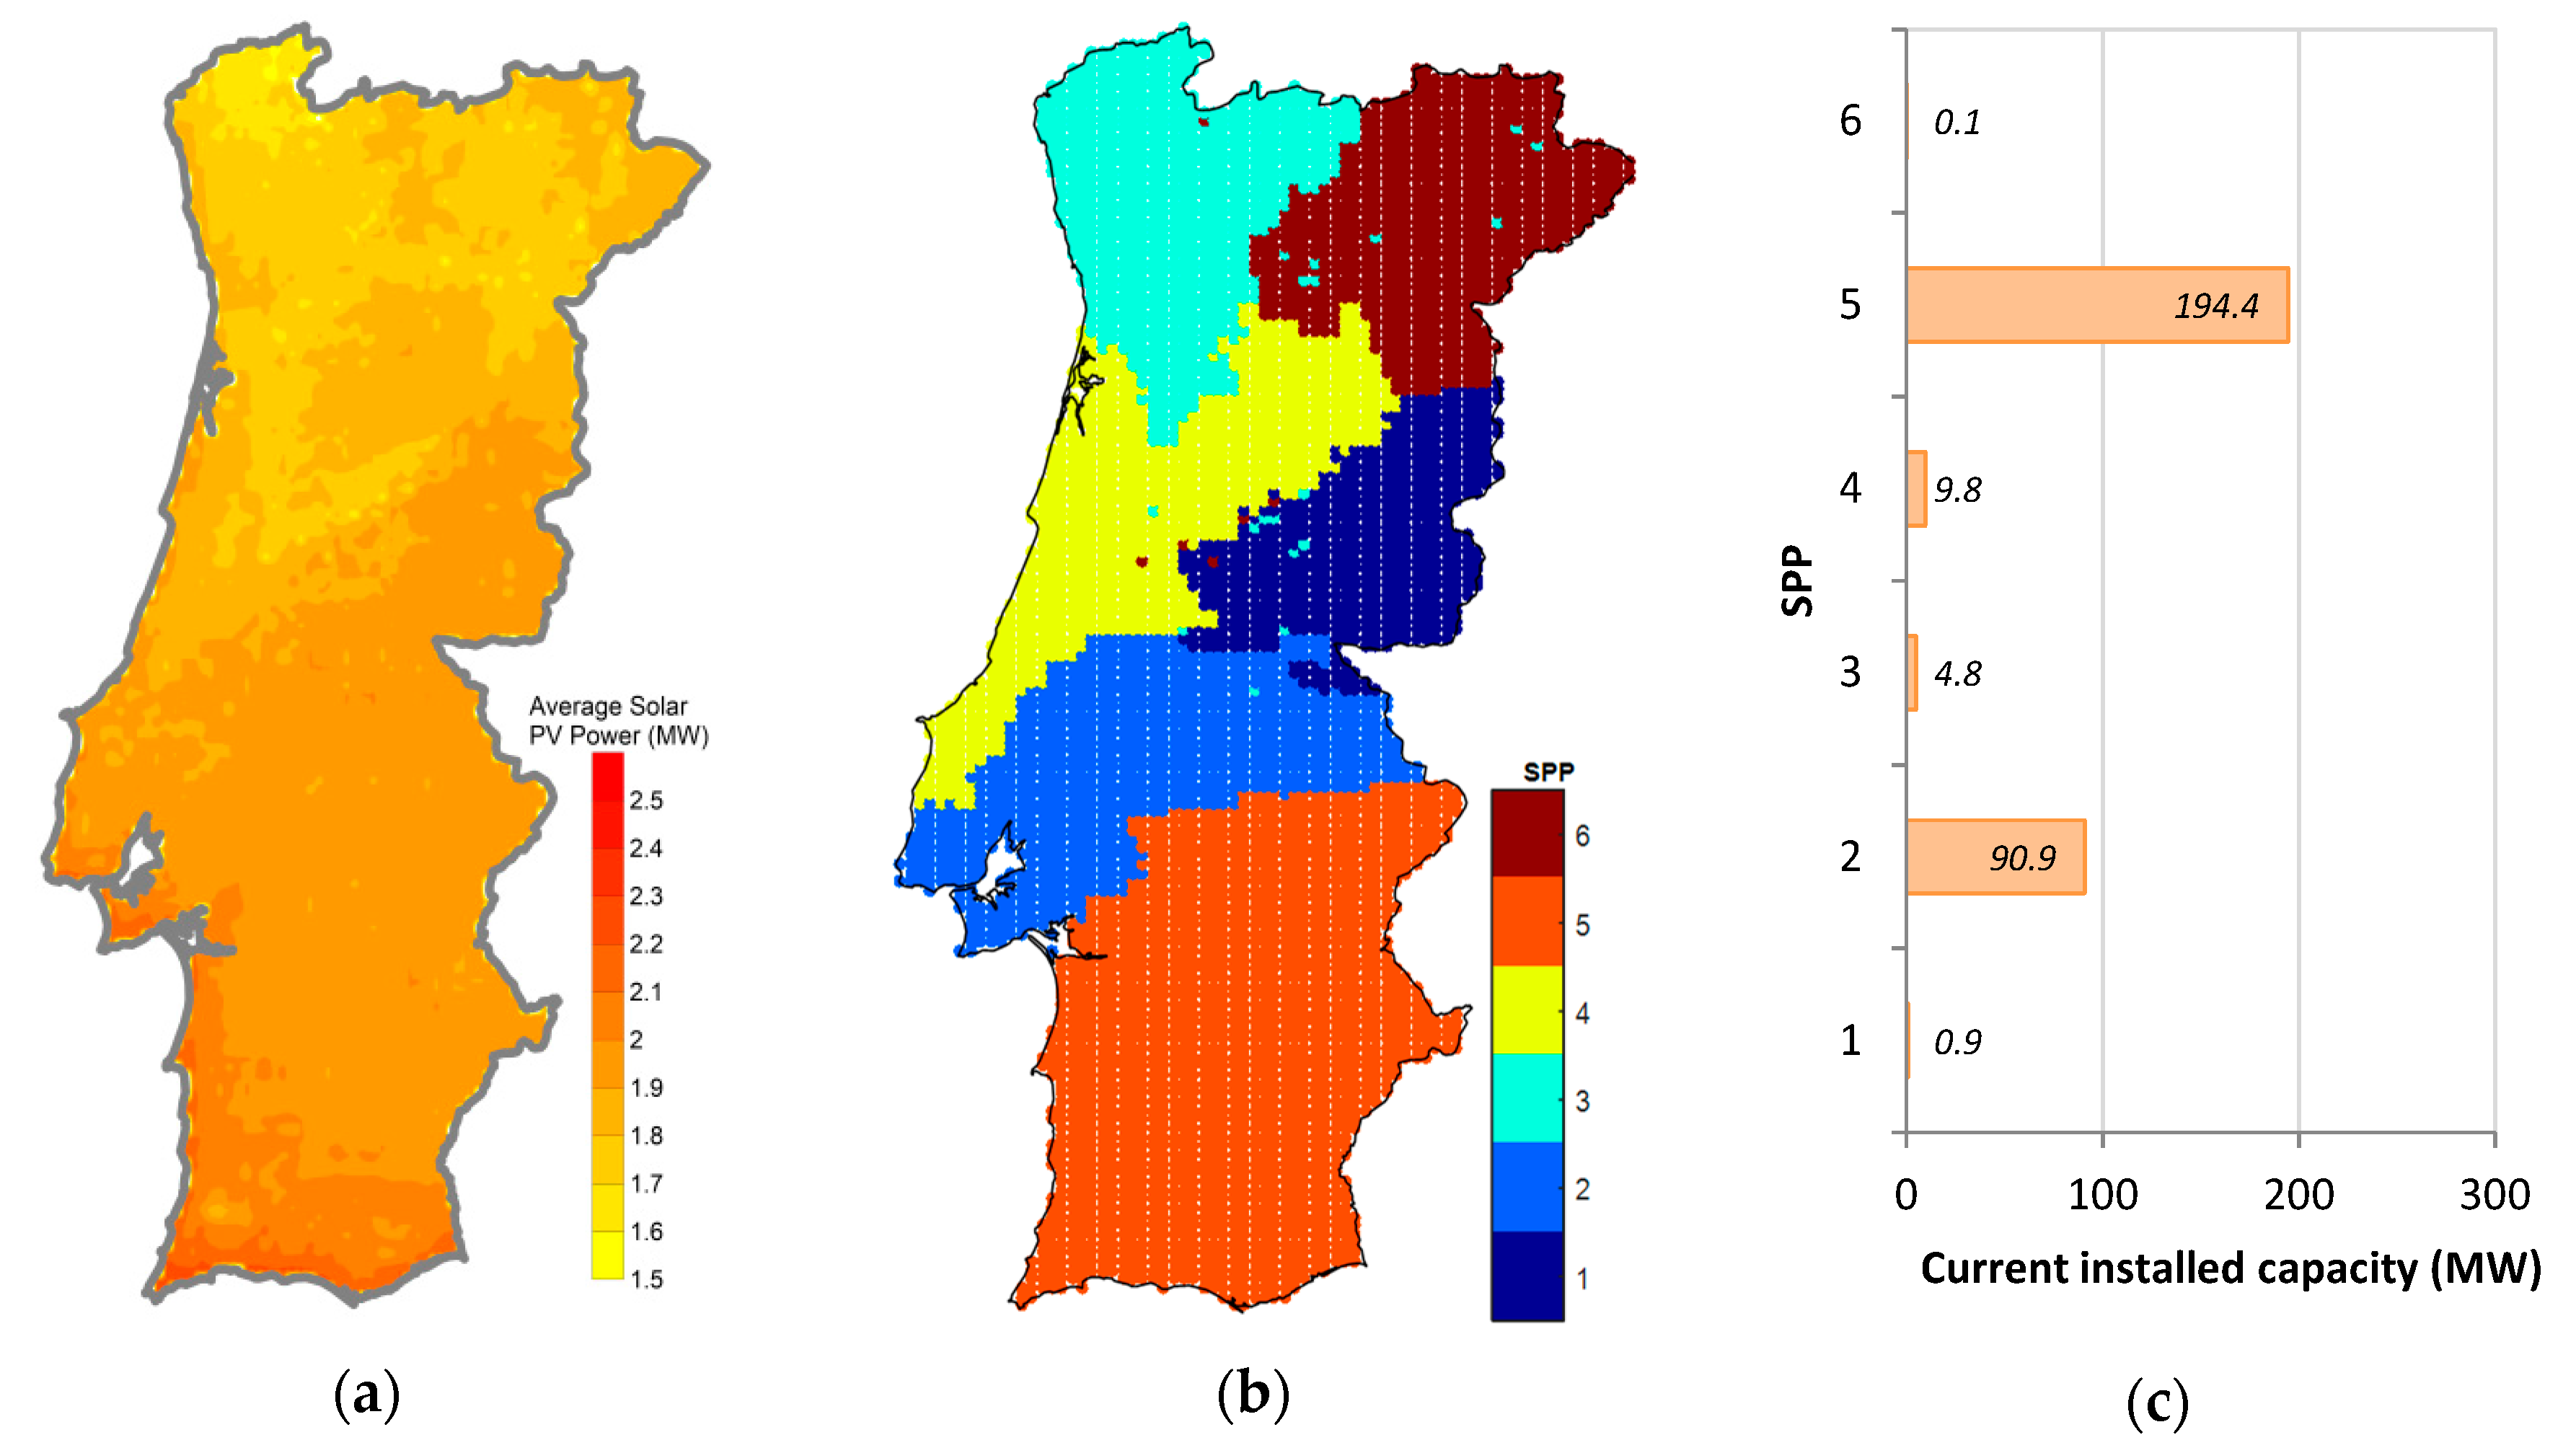
In Figure 6a, the average power capacity considering a solar PV park with 10 MW for each spatial point is shown. Based on the CH criterion, a suitable number of SPP is six. Figure 6b depicts the spatial distribution of each SPP, while Figure 6c exhibits the current nominal power capacity located within each SPP. In Figure 7, the average daily and monthly solar PV power patterns are depicted to provide further insights regarding the features of each SPP.
The cluster analysis enabled the identification of six statistical different spatial patterns in solar PV production, Figure 6. These patterns are strongly related to interactions amid the atmospheric conditions and the orography. As in the wind power production, solar power generation shows a seasonal behavior, with high positive gradients from sunrise on, reaching a plateau with negligible gradients around noon (11–14 h) and high negative gradients until sunset, Figure 7a. Figure 7b highlights the seasonal contrast of weather conditions between the southern and northern regions. During the March to October months, no substantial differences are found in power production. In contrast, in the winter months, depending on the region, the dissimilarity in power production can reach 0.5 MW. This behavior leads to significant differences in the average solar PV power daily profile and in the current capacity installed. From an annual energy power production point of view, and as shown in Figure 6a, the south/center regions of Portugal present more favorable conditions regarding the exploitation of this technology compared with the north region. By comparing the WPP (Figure 5) and the SPP (Figure 7) profiles, a high temporal complementarity degree can be observed, namely, between WPPs #3, #4, #6, and #8 and all SPP profiles. In these cases, the wind production profiles show the lowest production period during the day, when solar production is higher, and vice versa.

5. Scenarios Identification and Renewables Deployment Results

5.1. Scenarios and Optimization Perspectives

The VRE deployment scenarios and optimization perspectives analyzed in this work are presented in Table 1.
The WindSTD and WindHSC are based on the wind power deployment, taking into consideration the wind resource complementarity with the presently installed wind power plants. In the PVSTD and PVHSC scenario, a similar approach is taken by considering only the PV technology and the SPP identified. In the remain scenarios, a joint analysis of both technologies’ generation to attain the demand is performed by taking advantage of the complementarity between the wind and solar generation. For each scenario, the two objective functions are applied.

5.2. Additional VRE Deployment Capacity and Daily Profiles

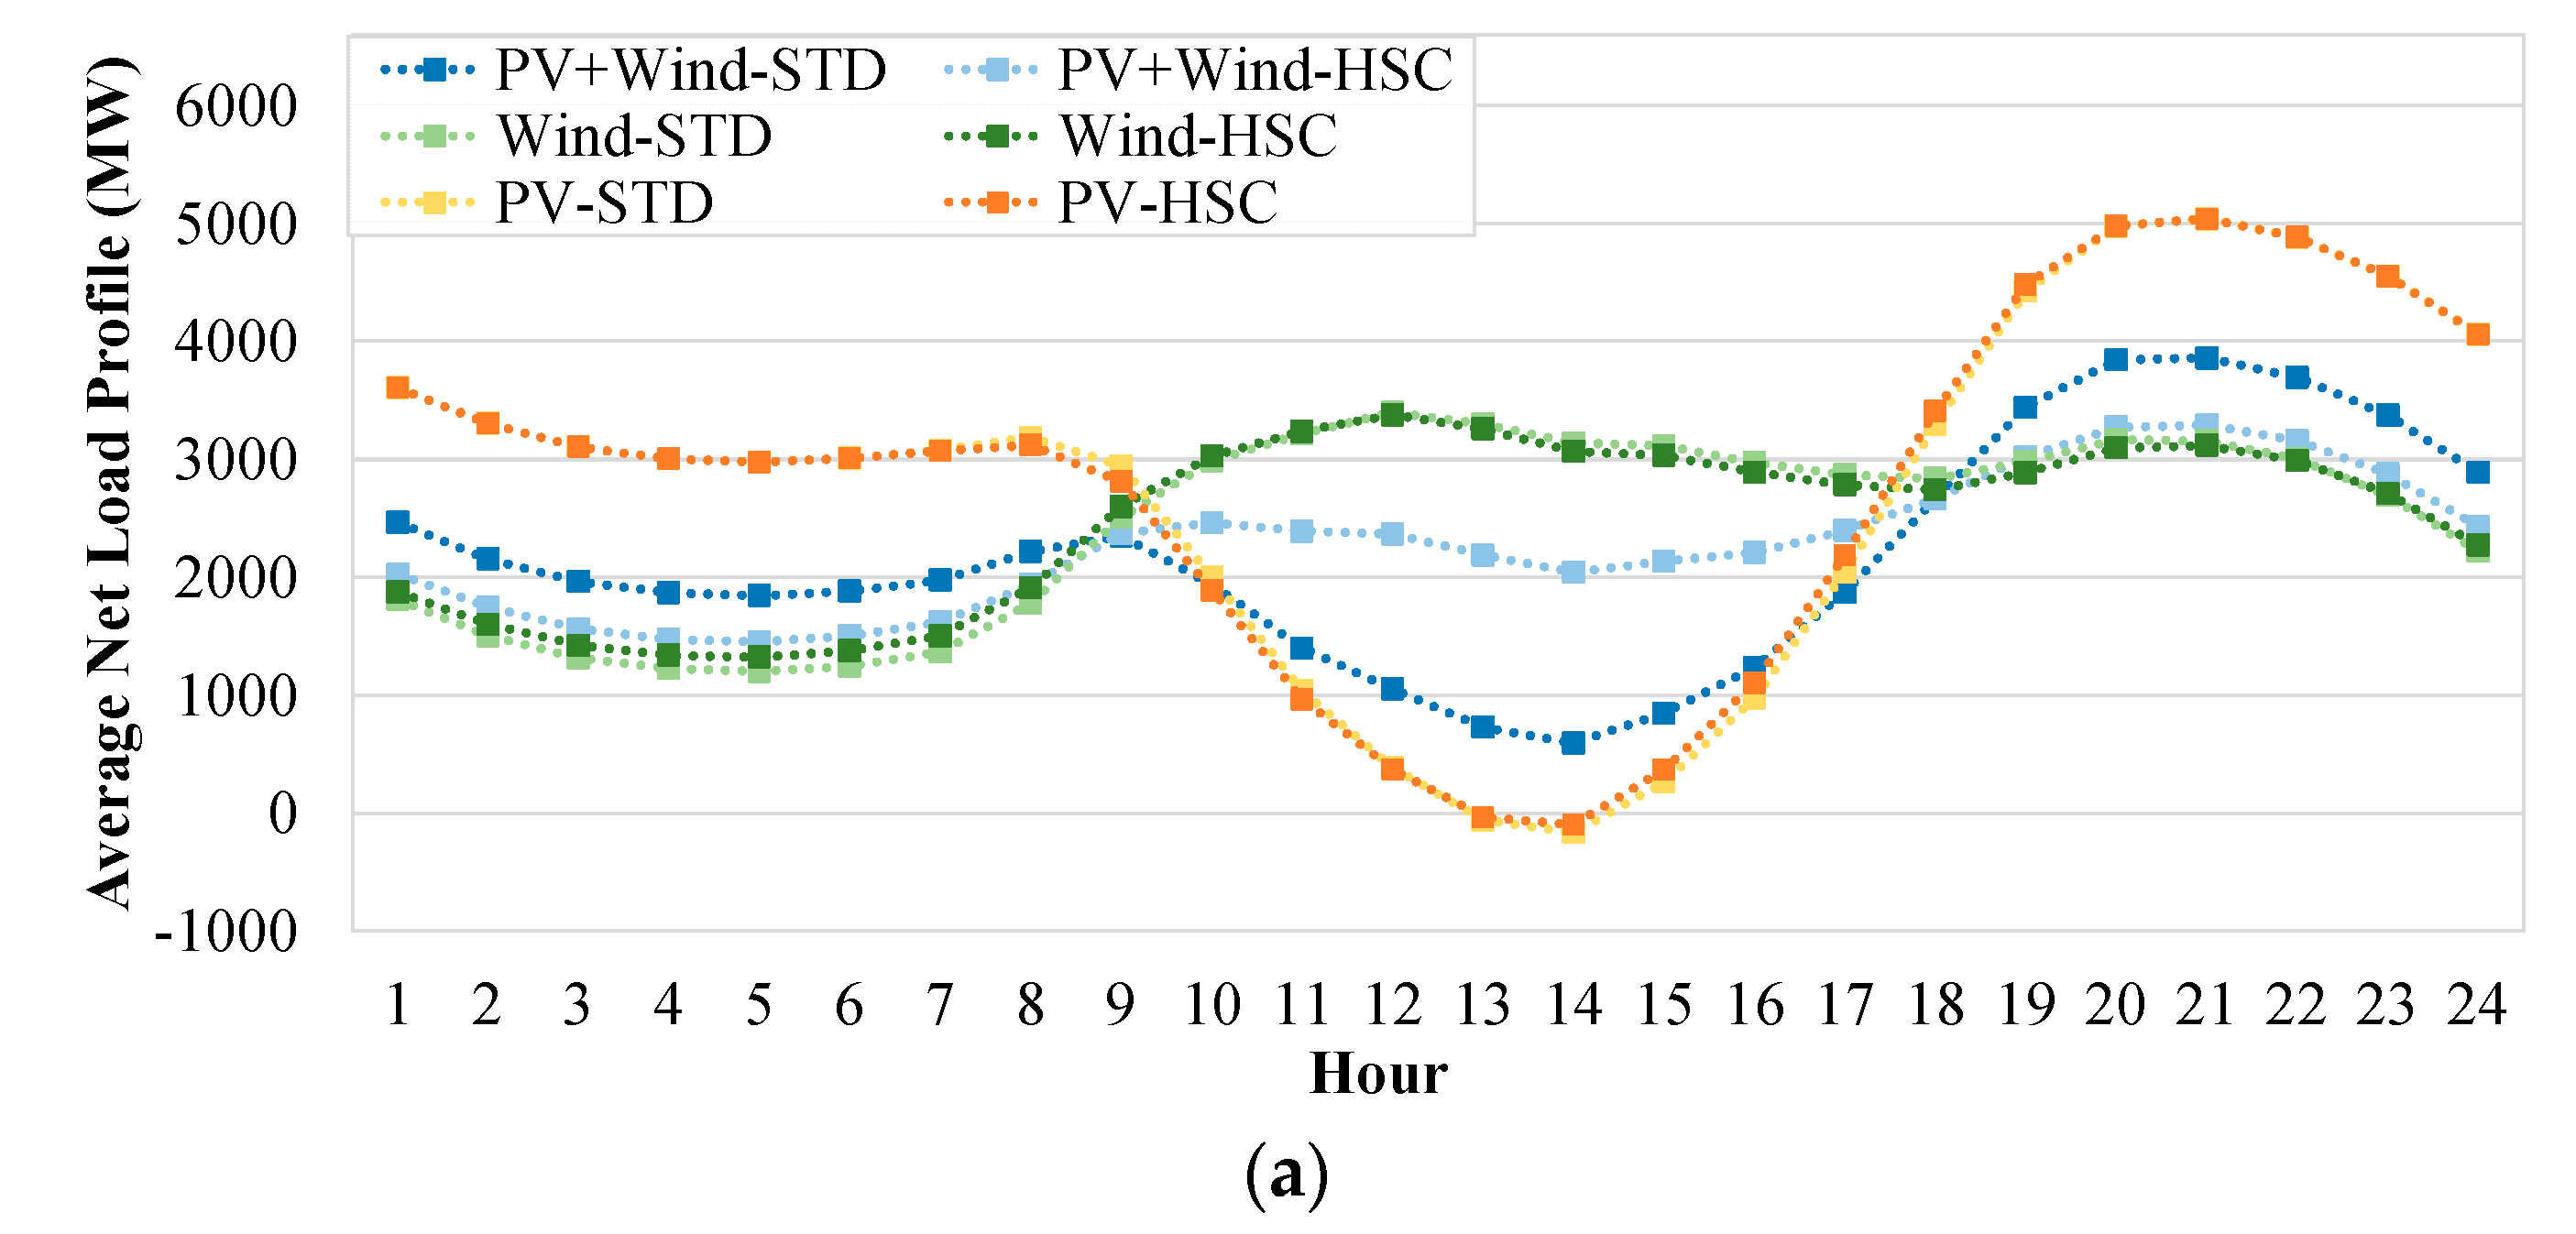
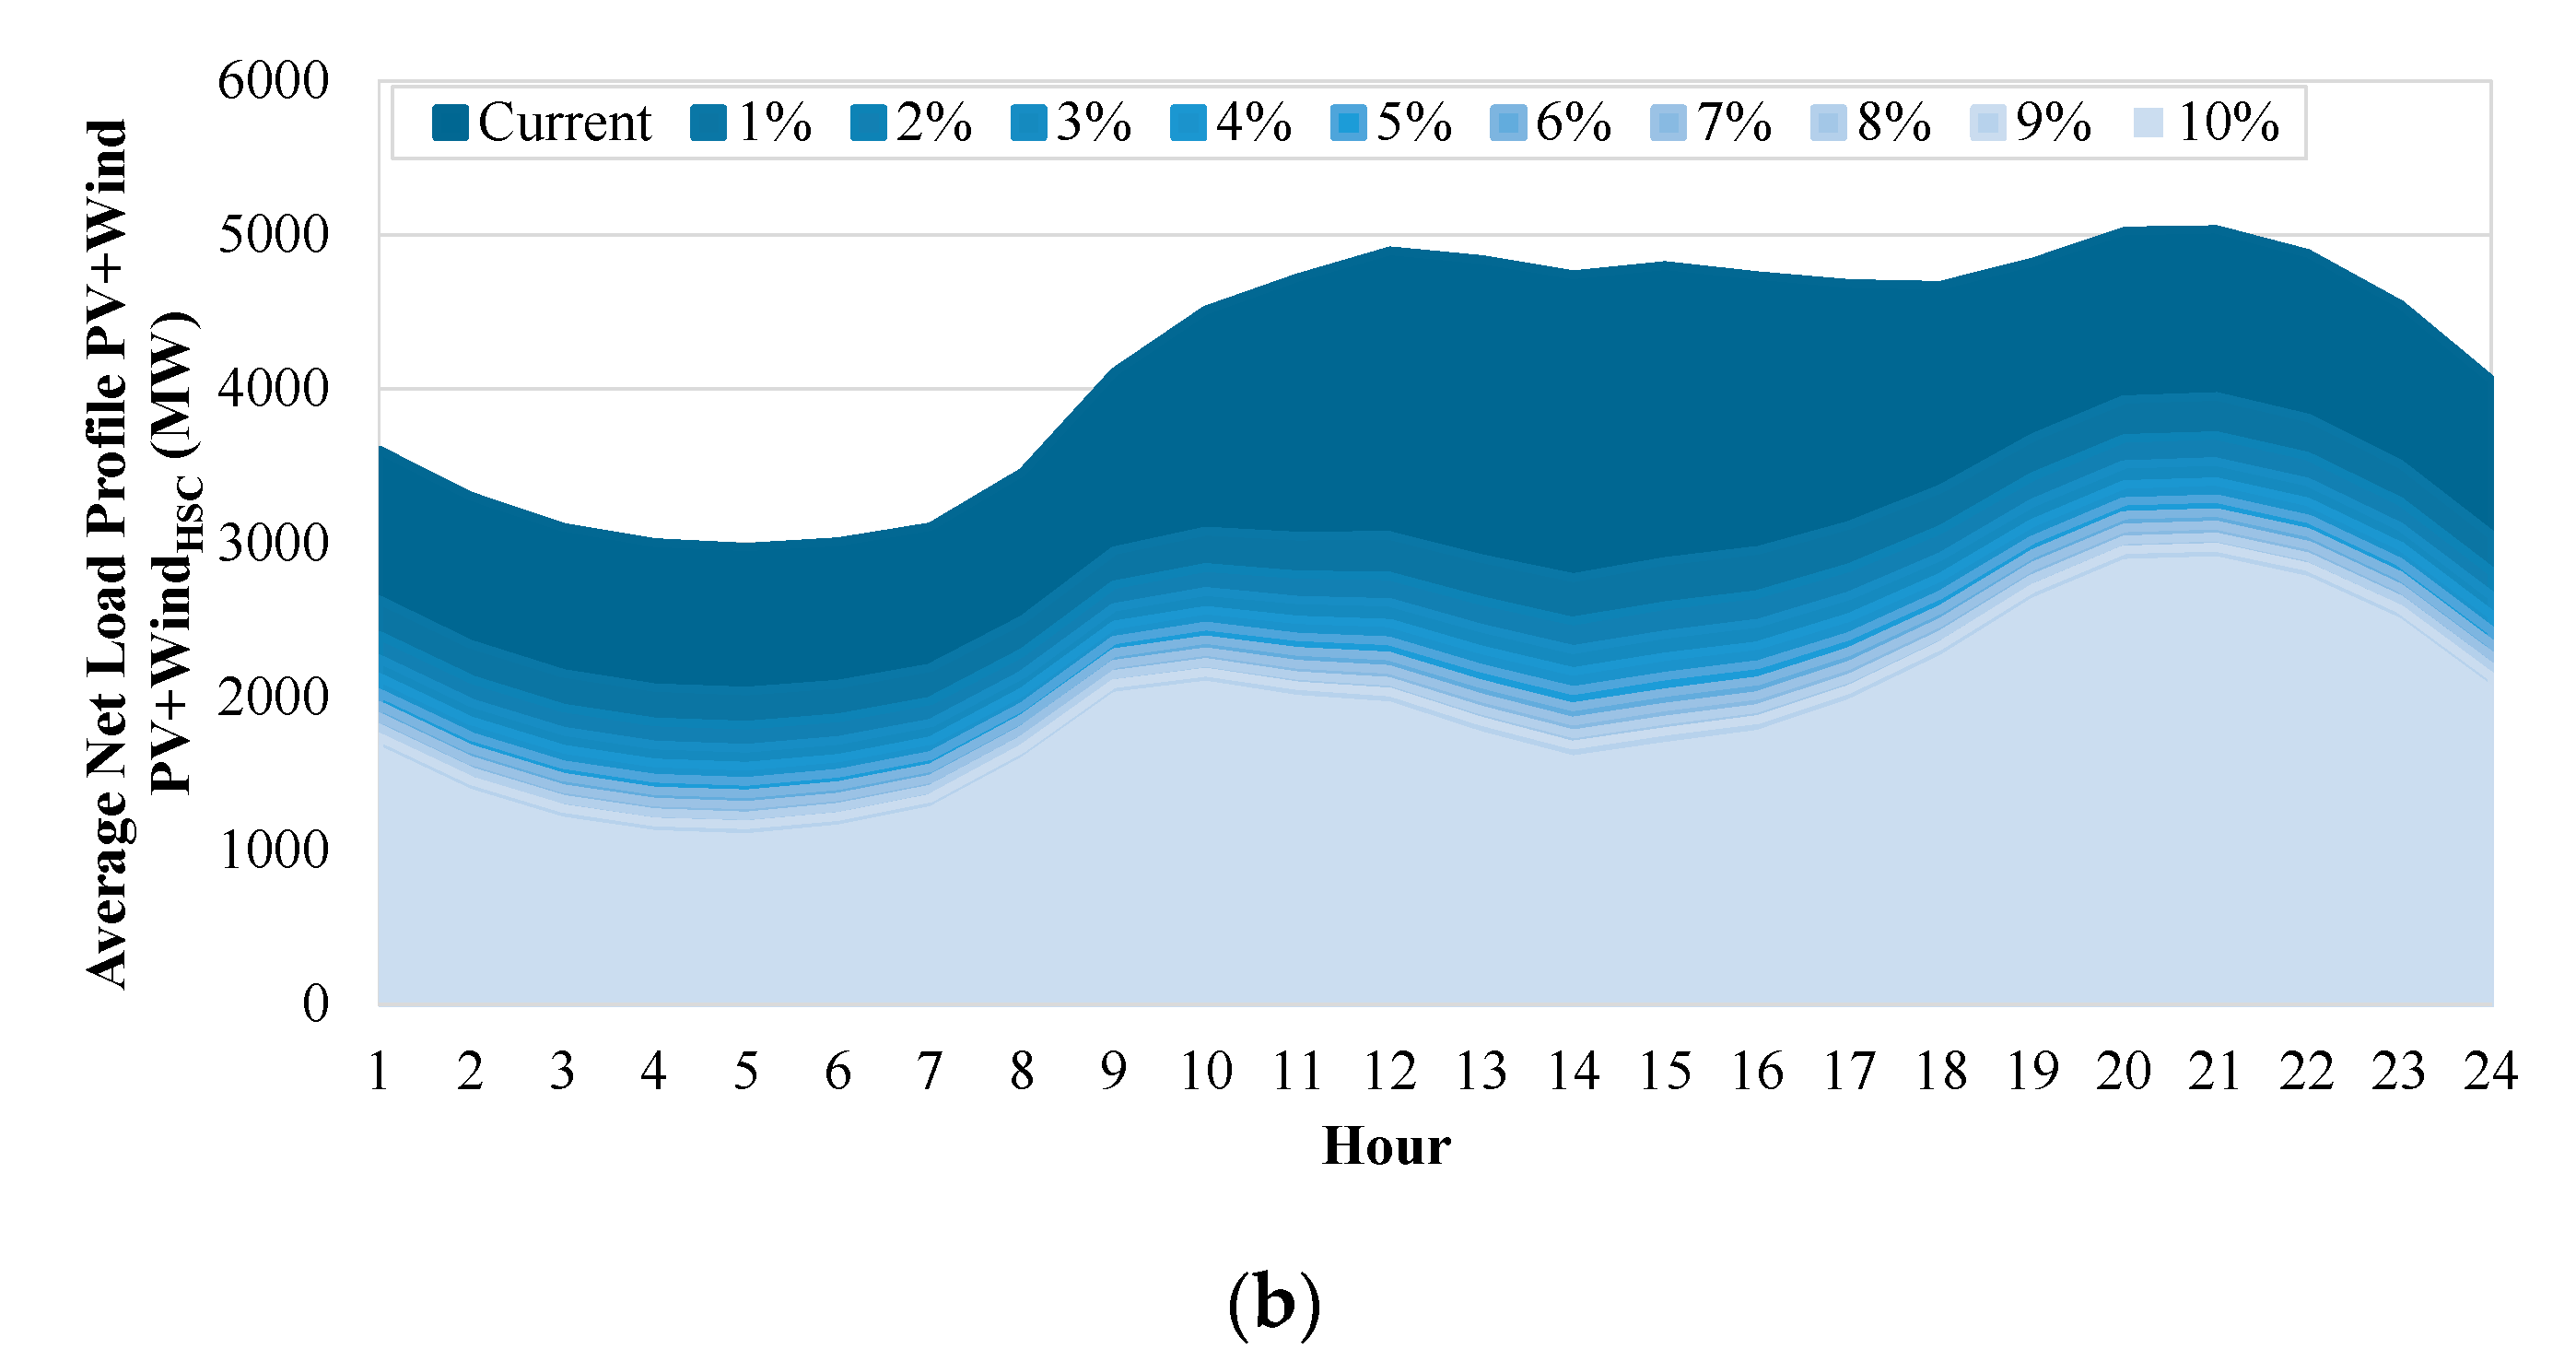
Through the greedy algorithm and the power production time series associated with each WPP or SPP, it was possible to identify the additional power capacity needed to comply with an annual VRE energy exceedance of 5%, Figure 8. In Figure 9, the average net load profiles associated with each scenario are depicted.
Scenarios that use the NL standard deviation as the function objective (STD scenarios) permit to install a higher power capacity when compared with the HSC scenarios. Although, strong one-hour step changes are expected, especially in the PV and PV + Wind STD scenarios, Figure 9a. According to Figure 9a, a strong reinforcement of PV power capacity can induce, on average, a net load below zero at 1 and 2 p.m. Moreover, the highest amplitudes between the minimum and maximum of the net load are also expected for the PV scenarios. Thus, with a strong reinforcement of the PV capacity, the so-called “duck curve” is also observed [58]. This effect can raise several concerns regarding the power systems flexibility, namely the capability of the conventional power plants to accommodate the ramp rate range needed to fully exploit solar energy without (i) increasing the overall costs of the system and (ii) reducing the environmental benefits of VRE [58,59]. The regions with a higher solar PV potential are the ones with a high additional capacity—SPP #2 and #5, Figure 8. While in the STD scenario, the capacity is installed mainly in SPP #5, in the HSC scenario, the required power capacity is split by SPPs #2 and #5. This result can be partially explained by the need to reduce severe hourly power step-changes imposed by the objective function. Thus, the algorithm selects these two regions to promote the statistical power smoothing effect. Moreover, the northern region of Portugal is more susceptible to severe meteorological events, which impact the solar irradiation, unleashing severe hourly power step-changes.
In the case of the Wind scenarios, and taking into account the current wind power capacity, Figure 4c, a strong deployment in regions 9 and 10 is needed to accomplish the criteria established (minimization of wind power variability and the one-hour step change). In this case, a strategic decentralization of the wind power deployment capacity can enable meeting the demand without a strong net load variability. This solution involves wind power deployment in coastal/offshore zones, which can bring further benefits, once those power plants will always be near the larger consumption centers, contrary to the current situation. In WPP10, one of the regions with the highest wind power capacity in all scenarios, the first floating Portuguese offshore floating park with a 27 MW nominal capacity (already in the planning phase) is foreseen. The continuing decline in costs of the offshore technologies can be conducive to further investments in this technology [60]. WPP 5, which is one of the regions with a high wind power potential, presents a low additional capacity value. Thus, a strategic wind power deployment strategy can pass to exploit locations with wind power profiles that allow following the demand patterns, even if this represents less annual energy production. Additional wind power capacity is also required in regions with high installed capacity, e.g., WPP6. In these cases, the additional capacity needed can be also achieved through repowering procedures. For wind scenarios, the minimum NL values are expected during the first hours of the day and the maximum values are expected between 10 a.m. and 1 p.m., where it was not possible to identify an adequate region to meet the electricity demand. This drawback can be easily overcome by exploring the power production complementarity between this technology and solar PV.
In the PV + Wind scenarios, a strong complementarity between the VRE generation is observed. The solar PV plants can overcome the limitations observed in the wind power generation during the period between 10 a.m. and 1 p.m. The results of PV + WindSTD scenarios are similar to PV scenario results concerning the total power capacity, notwithstanding in the first one (i) a shift in the intensity of the net load is introduced by the wind power capacity during the night time and (ii) in average, the net load values are always higher than 0 MW, since less solar PV power capacity is installed. In the case of PV + WindHSC scenario, the complementarity enables to obtain a flat net load profile during the day. The daily amplitude is nearly 1500 MW with reduced hourly step-changes enabling to decrease the power system flexibility requirements needs. In this case, the highest net load values are expected by the end of the day (7 to 10 p.m.). Comparing both PV + Wind scenarios, the use of HSC objective functions requires less installed capacity.
Further details of the PV + WindHSC scenario are depicted in Figure 9b. According to this figure, it is possible to increase the VRE power capacity in a sustainable way without introducing strong net load variations. Compared with the present net load profile, the highest differences are observed during the day time, due to the solar PV generation. On the other hand, the peak between 7 to 10 p.m. is still observed. Notably, this peak hour, even for large scale integration of VRE, is only reduced in the Wind scenarios.
The reduced NL values achieved means that is possible to replace conventional generation by renewable generation, bringing environmental benefits, due to a reduction in the CO2 emissions [61]. Impacts are also expected in the electricity markets on the basis of the marginal cost of each technology (the cost necessary to produce a megawatt) in the formation of its hourly price. Since VRE technologies have very low marginal costs (of the order of 0 €/MWh), compared to conventional technologies, there is a tendency for a decrease in the values verified in the wholesale markets—the order of merit effect [61,62]. For certain levels of VRE penetration, this effect is positive for consumers, due to a reduction in electricity market prices. On the other side, this effect leads to a reduction in producers profitability (“self-cannibalization effect”) [62]. This situation may lessen the incentive to invest in new capacity deployment, preventing to achieve high shares of VRE generation [3]. Thus, adequate policy schemes are needed to promote the nearly 100 % renewable power system without increasing the bill costs paid by consumers [1,3,9].

5.3. Net Load Duration Curve and Extreme Values

Figure 10 shows the load duration curve for each scenario, considering 5% and 10% annual energy exceedance values, respectively.
From Figure 10, it is possible to observe that the PV + Wind scenarios are the most appropriate to reduce and smooth the net load values. By taking advantage of the generation complementarity, these scenarios show the lowest net load: (i) amplitude between the maximum and minimum values observed and (ii) percentage of time with negatives values, i.e., less surplus generation during the period under analysis is observed. On the other hand, the PV scenario shows (i) the lowest capability to reduce the net load and (ii) the highest net load amplitude values. These results, associated with the intrinsic features of PV generation, i.e., no production during the night time and peak production during the middle of the day, are more pronounced as the solar PV share into the power system increases.
The Wind scenarios present a slightly better performance to reduce NL values when compared with the PV scenarios. Nevertheless, similar extreme negative values are also observed. This result can be partly explained by the weather conditions, where the power smoothing effect associated with the aggregation of wind parks, even when widely dispersed, is not enough to mitigate some extreme meteorological events, such cold fronts [40]. This situation usually occurs when the entire country is immersed under weather conditions with a coherent structure, which usually extends over several hundreds of kilometers (e.g., cold fronts). Therefore, both scenarios based on a single VRE show the lowest performance, meaning that the natural complementarity of the wind and solar PV is essential to mitigate extreme values. Therefore, the complementarity enables to reduce the power system flexibility requirements associated with a large-scale integration of VRE.
The percentage of time with positive net load values is very similar among the different scenarios, 88% for the 5% annual energy exceedance, while for the 10% scenario, this time is reduced to 83%. In the solar scenarios, this value is reduced to 96% of the time. Remarkably, for 98% of the time of the year, the existing pumped hydro storage (PHS) capacity in Portugal could already absorb the surplus generated in the Wind and PV + Wind scenarios with a 10% energy surplus.
In Table 2, further insights regarding the seasonal NL extreme values are presented. According to Table 2, for the PV scenarios, the maximum values are equal to the present day NL and are observed at 8 p.m. This scenario emphasizes that even with a large penetration of solar PV technology, due to its intrinsic behavior, the required capacity from other technologies to satisfy the demand needed is above 8 GW in the winter and in the summer is nearly 6 GW. These high values, that need to be compensated using other technologies, raise special concerns during the summer, due to the expected reduction of the available resource for hydropower plants and the foreseen decommissioning of the Portuguese conventional coal power plants.
The Wind and PV + Wind scenarios show that is possible to reduce the current seasonal 98th NL percentile value. Considering a Surplus Max . equal to 5%, the minimum values of this statistical parameter are typically observed in the PV + WINDHSC scenario. However, for a Surplus Max . equal to 10%, the WindSTD scenario is the one that shows the best performance. Thus, a strategic synergy between wind and solar PV generation enables to reduce the power system dependence from other technologies. Notwithstanding, meaningful NL values are observed. Consequently, for a large-scale integration of renewable power system, the results suggest that a long-term holistic approach considering (i) batteries and hydro pumping, (ii) demand-side response, (iii) interconnection capacity and (iv) sector coupling is crucial to dully allocate the energy surplus/deficit from VRE [9,12].
Alongside the power production, the hourly gradients of power production are of particular concern during the electric power operation [8]. They represent a key challenge for balancing the energy system by adjusting the production of dispatchable power plants (running or start-up/shut-down) and storage. In Figure 11, the duration curve of the net load hourly step change is shown to assess the variability obtained in each scenario.
On the basis of Figure 11, the highest hourly step-changes are associated with PV scenarios, with the most severe ramp-down reaching −2650 MW and −2834 MW for 5% and 10% surplus values, respectively. Regarding hourly ramp-up, the maximum values are 3290 MW and 3545 MW. Due to the daily variability of solar PV generation, the scenarios based on this technology show the highest extreme values of this parameter. In the remain scenarios, a high percentage of time with hourly net load step change near 0 MW is observed. Notably, the PV + WindHSC scenario shows a behavior very similar to the current duration curve. Thus, the results suggest that is possible to increase the VRE capacity without exacerbating the current flexibility to deal with the variability associated with these renewable sources.

5.4. VRE Share Values in the Final Consumption

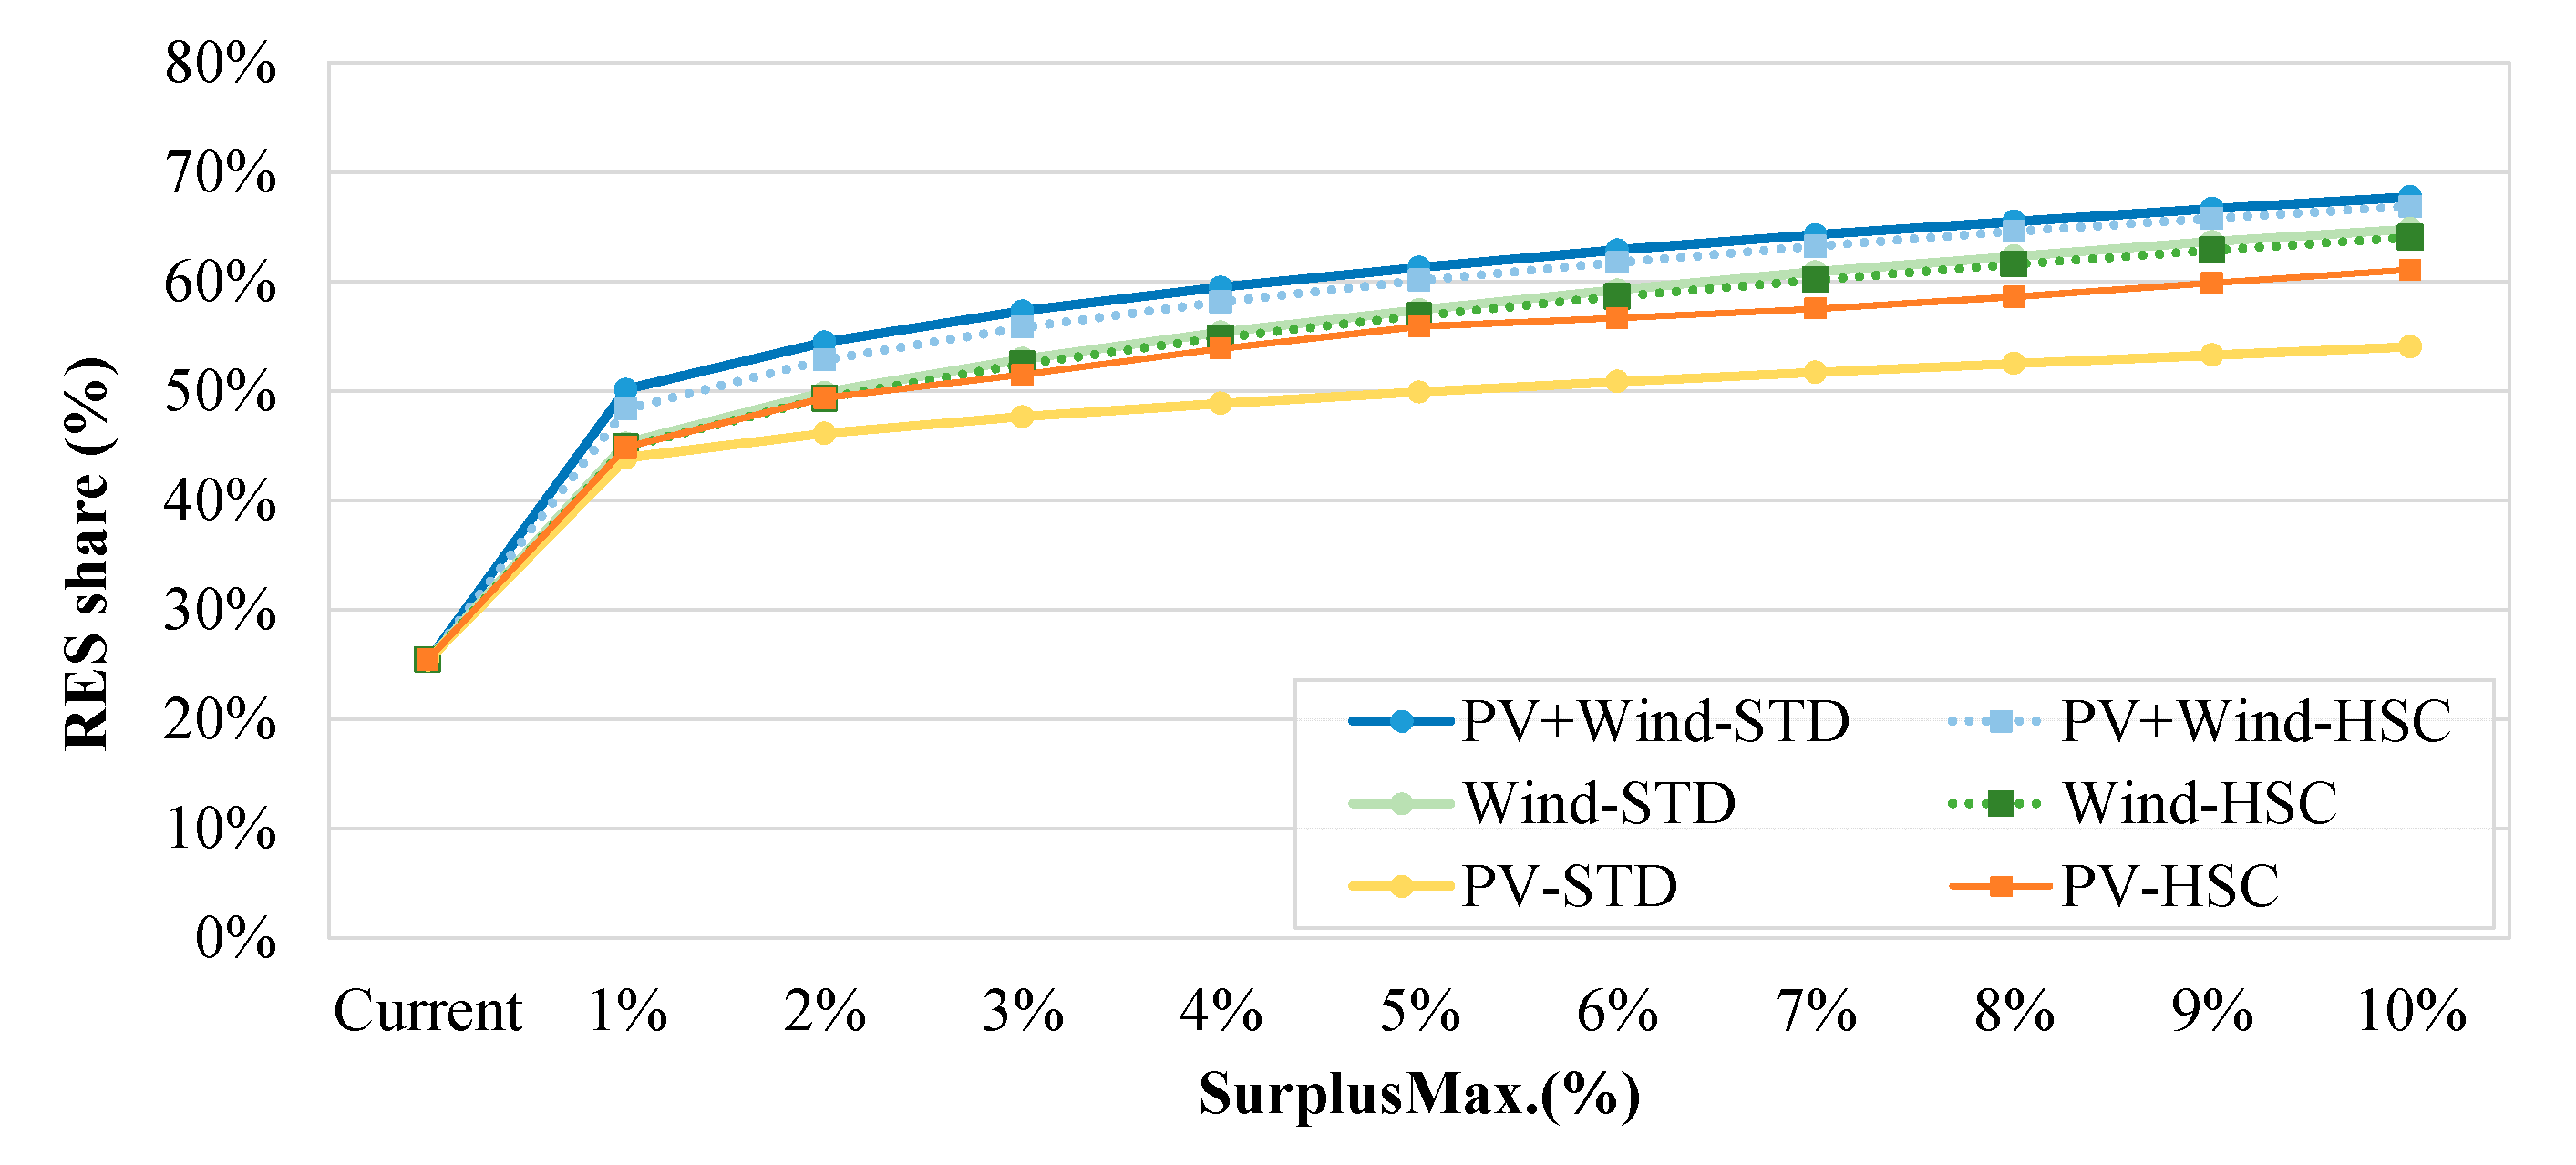
In Figure 12, the VRE share in the final consumption is depicted considering different a Surplus Max . values.
As expected, due to the wind and PV generation synergy, the PV + Wind scenarios enable to obtain the highest VRE penetration values for the same annual energy exceedance value. The highest value (scenario PV + WindSTD) enables to obtain a VRE contribution of 68%, while in the PV + WindHSC scenario, the contribution is 67%. Taking into account this slight difference found and the previous results achieved (e.g., typical power profile and hourly step-change), results suggest that the PV + WindHSC scenario can provide a more sustainable way to increase the VRE penetration.
In the PV scenarios, only a maximum of 56% share of VRE is estimated for a Surplus Max . equal to 10%—HSC scenario. Notably, the Wind scenarios show that a strategic deployment can enable to achieve a VRE share of 65%. After the 3% annual energy surplus threshold, the results highlight that the wind power generation complementarity across the different spatial locations allows to achieve a higher penetration share compared to the PV scenarios. Therefore, it is possible to observe a 1% difference between the Wind and PV scenarios for a 3% energy exceedance, while for the 10% energy exceedance, this difference increases to 4%, considering the best result of each scenario.

6. Final Remarks

In this study, a methodology to assess the complementarity of wind and solar power production and their contribution to meet the national demand was developed and applied using Portugal as a case study.
Through the clustering analysis of high-resolution data, the spatiotemporal variability of the wind and solar PV power production in Portugal was identified. Ten regions with different wind power profile features were detected, while for solar PV, six regions were identified. On the basis of these profiles and a greedy algorithm, different deployment scenarios are considered by strategically adding to the current energy mix: (1) only wind power, (2) only solar PV power, (3) adding wind and solar PV power. PV scenarios show the highest values regarding the net load hourly step change and the lowest capability to reduce the net load values throughout the year. Scenarios based on wind power technology show a higher VRE penetration share in the annual consumption when compared with strong PV solar reinforcement scenarios. However, the highest penetration share was attained by exploring the wind and solar PV generation complementarity. In the PV + WindHSC scenario, a sustainable way to increase the VRE penetration until 68%, considering and annual energy surplus regarding the consumption equal to 10%, was identifying and considering a wind power capacity reinforcement of 4240 MW (through new wind parks but also considering repowering procedures) and 2200 MW of solar PV. These numbers, together with the current share of dispatchable hydropower production (nearly 20%), show that it is possible to obtain a sustainable pathway toward decarbonization of the Portuguese electric power system, without exacerbating the power system’s flexibility requirements to deal with VRE variability. The methodology developed can be generalized and directly transferred to other regions/power systems.
The proposed methodology only addresses the temporal and spatial integration aspects of VRE variability, and the benefits of the complementarity assessment form a power system point-of-view. Thus, some limitations of the analysis should be highlighted. First, it does not cover other relevant aspects such as economic costs, land availability, social acceptance, environmental benefits, use of storage technologies, and the electricity market. Second, the electricity demand was considered inelastic. These aspects will be analyzed in future works. Notwithstanding these limitations, the result of this work clearly highlights the added value of using wind and solar PV complementarity and electricity criteria as a planning strategy for new VRE capacity deployment aiming to reduce the power flexibility needs, namely, the use of expensive energy storage systems.
Although a long period is needed to obtain results with high statistical significance, the results suggest that high net load values are still expected, even under conditions of large-scale integration of VRE. Thus, in this energy transition phase, a long-term holistic approach with a cost analysis (e.g., strategic use of storage, hydro pumping, sector coupling, and hydrogen generation) is required to sustainably (i) deal with the expected energy surplus/deficit from VRE and (ii) create public policies to fairly promote the deployment of wind and solar PV towards the mitigation of climate change.

Author Contributions

A.C. performed the literature review, collected, and processed all the data, developed the mathematical model, implemented the model, and wrote the manuscript. A.E. discussed the work to be developed, supported the model developed and the identification of the most relevant results to be shown, and also reviewed the manuscript. All authors have read and agreed to the published version of the manuscript.

Funding

This work was partly supported by the FCT (Fundação para a Ciência e Tecnologia) through OptiGRID project (PTDC/EEI-EEE/31711/2017).

Acknowledgments

The authors gratefully acknowledge João Silva and Joaquim Duque for the discussions, proofreading the typescript and review the optimization approach used in this work.

Conflicts of Interest

The authors declare no conflict of interest.

Glossary

C k Cluster medoid of the K-th clusterPV + WindHSCScenario using only wind and solar PV technologies and the HSC objective function
CHCalinski-HarabaszRESRenewable energy sources
CMSAFSatellite Application Facility on Climate MonitoringsNumber of solar PV regions identified using the cluster approach
DDistance between the observations and the medoid of each cluster S o l a r P a r k a r e a Area need to install a 10 MW solar PV park
HSCScenarios using the hourly NL step change standard deviation minimization S P Existing national aggregated solar PV hourly generation
iSpatial points of the 5 × 5 km resolution available S P P a r e a   ( s ) Area available for additional solar PV power capacity deployment for the s-th region
itNumber of installations unitsSPPSolar PV production patterns
KNumber of clustersSTDScenarios using the minimize NL annual variability objective function
M a x a r e a Percentage of maximum area available in each region. S u r p l u s M a x . Percentage allowed VRE energy generation regarding the annual electricity consumption
MM5Fifth-generation mesoscale modeltIndex domain for time
nNumber of records availableTSOTransmission system operator
NCEP-CFSv2NCEP Climate Forecast System Version 2 reanalysis datasetVREVariable renewable energies
NLNet load V R E s u r p l u s V R E s u r p l u s Surplus of VRE energy generation regarding the annual electricity consumption
NWPNumerical weather predictionwNumber of wind power regions identified using the cluster approach
N W P P ( i t , w ) Number of the it-th installations for the w-th region W i n d P a r k a r e a Area need to install a 10 MW wind park
N S P P ( i t , s ) Number of the it-th installations for the s-th regionWindSTDScenario using only wind technology and the STD objective function
PHSPumped hydro storageWindHSCScenario using only wind technology and the HSC objective function
PVPhotovoltaic W P Existing national aggregated wind hourly generation
PVGISPhotovoltaic geographical information systemWPPWind production patterns
PVSTDScenario using only solar PV technology and the STD objective function W P P a r e a ( w ) Area available for additional wind power capacity deployment for the w-th region
PVHSCScenario using only solar PV technology and the HSC objective function X n Power production input matrix for clustering analysis
PV + WindSTDScenario using only wind and solar PV technologies the STD objective function

References

  1. Cucchiella, F.; D’Adamo, I.; Gastaldi, M. A profitability assessment of small-scale photovoltaic systems in an electricity market without subsidies. Energy Convers. Manag. 2016, 129, 62–74. [Google Scholar] [CrossRef]
  2. Abolhosseini, S.; Heshmati, A. The main support mechanisms to finance renewable energy development. Renew. Sustain. Energy Rev. 2014, 40, 876–885. [Google Scholar] [CrossRef] [Green Version]
  3. Niesten, E.; Jolink, A.; Chappin, M. Investments in the Dutch onshore wind energy industry: A review of investor profiles and the impact of renewable energy subsidies. Renew. Sustain. Energy Rev. 2018, 81, 2519–2525. [Google Scholar] [CrossRef] [Green Version]
  4. Arantegui, R.L.; Jäger-Waldau, A. Photovoltaics and wind status in the European Union after the Paris Agreement. Renew. Sustain. Energy Rev. 2018, 81, 2460–2471. [Google Scholar] [CrossRef]
  5. Shivakumar, A.; Dobbins, A.; Fahl, U.; Singh, A. Drivers of renewable energy deployment in the EU: An analysis of past trends and projections. Energy Strategy Rev. 2019, 26, 100402. [Google Scholar] [CrossRef]
  6. Kiviluoma, J.; Holttinen, H.; Weir, D.; Scharff, R.; Soder, L.; Menemenlis, N.; Cutululis, N.A.; Lopez, I.D.; Lannoye, E.; Estanqueiro, A.; et al. Variability in large-scale wind power generation. Wind Energy 2016, 19, 1649–1665. [Google Scholar] [CrossRef] [Green Version]
  7. Deetjen, T.A.; Rhodes, J.D.; Webber, M.E. The impacts of wind and solar on grid flexibility requirements in the Electric Reliability Council of Texas. Energy 2017, 123, 637–654. [Google Scholar] [CrossRef] [Green Version]
  8. Buttler, A.; Dinkel, F.; Franz, S.; Spliethoff, H. Variability of wind and solar power—An assessment of the current situation in the European Union based on the year 2014. Energy 2016, 106, 147–161. [Google Scholar] [CrossRef]
  9. Hansen, K.; Breyer, C.; Lund, H. Status and perspectives on 100% renewable energy systems. Energy 2019, 175, 471–480. [Google Scholar] [CrossRef]
  10. Gorjian, S.; Zadeh, B.N.; Eltrop, L.; Shamshiri, R.R.; Amanlou, Y. Solar photovoltaic power generation in Iran: Development, policies, and barriers. Renew. Sustain. Energy Rev. 2019, 106, 110–123. [Google Scholar] [CrossRef]
  11. Graabak, I.; Korpås, M. Variability Characteristics of European Wind and Solar Power Resources—A Review. Energies 2016, 9, 449. [Google Scholar] [CrossRef] [Green Version]
  12. Engeland, K.; Borga, M.; Creutin, J.-D.; François, B.; Ramos, M.-H.; Vidal, J.-P. Space-time variability of climate variables and intermittent renewable electricity production—A review. Renew. Sustain. Energy Rev. 2017, 79, 600–617. [Google Scholar] [CrossRef]
  13. Han, S.; Zhang, L.; Liu, Y.; Zhang, H.; Yan, J.; Li, L.; Lei, X.; Wang, X. Quantitative evaluation method for the complementarity of wind–solar–hydro power and optimization of wind–solar ratio. Appl. Energy 2019, 236, 973–984. [Google Scholar] [CrossRef]
  14. Zhang, H.; Cao, Y.; Zhang, Y.; Terzija, V. Quantitative synergy assessment of regional wind-solar energy resources based on MERRA reanalysis data. Appl. Energy 2018, 216, 172–182. [Google Scholar] [CrossRef]
  15. Ren, G.; Wan, J.; Liu, J.; Yu, D. Spatial and temporal assessments of complementarity for renewable energy resources in China. Energy 2019, 177, 262–275. [Google Scholar] [CrossRef]
  16. Yan, J.; Qu, T.; Han, S.; Liu, Y.; Lei, X.; Wang, H. Reviews on characteristic of renewables: Evaluating the variability and complementarity. Int. Trans. Electr. Energy Syst. 2020, 30, e12281. [Google Scholar] [CrossRef]
  17. Gallardo, R.P.; Ríos, A.M.; Ramírez, J.S. Analysis of the solar and wind energetic complementarity in Mexico. J. Clean. Prod. 2020, 268, 122323. [Google Scholar] [CrossRef]
  18. Jurasz, J.; Canales, F.A.; Kies, A.; Guezgouz, M.; Beluco, A. A review on the complementarity of renewable energy sources: Concept, metrics, application and future research directions. Sol. Energy 2020, 195, 703–724. [Google Scholar] [CrossRef]
  19. Prasad, A.A.; Taylor, R.A.; Kay, M. Assessment of solar and wind resource synergy in Australia. Appl. Energy 2017, 190, 354–367. [Google Scholar] [CrossRef]
  20. Bett, P.E.; Thornton, H.E. The climatological relationships between wind and solar energy supply in Britain. Renew. Energy 2016, 87, 96–110. [Google Scholar] [CrossRef] [Green Version]
  21. Sterl, S.; Liersch, S.; Koch, H.; van Lipzig, N.P.M.; Thiery, W. A new approach for assessing synergies of solar and wind power: Implications for West Africa. Environ. Res. Lett. 2018, 13, 1–11. [Google Scholar] [CrossRef]
  22. Viviescas, C.; Lima, L.; Diuana, F.A.; Vasquez, E.; Ludovique, C.; Silva, G.N.; Huback, V.; Magalar, L.; Szklo, A.; Lucena, A.F.P.; et al. Contribution of variable renewable energy to increase energy security in Latin America: Complementarity and climate change impacts on wind and solar resources. Renew. Sustain. Energy Rev. 2019, 113, 109232. [Google Scholar] [CrossRef]
  23. Jerez, S.; Trigo, R.M.; Sarsa, A.; Lorente-Plazas, R.; Pozo-Vázquez, D.; Montávez, J.P. Spatio-temporal complementarity between solar and wind power in the Iberian Peninsula. Energy Procedia 2013, 40, 48–57. [Google Scholar] [CrossRef] [Green Version]
  24. Castro, R.; Crispim, J. Variability and correlation of renewable energy sources in the Portuguese electrical system. Energy Sustain. Dev. 2018, 42, 64–76. [Google Scholar] [CrossRef]
  25. Torres, P.J.F.; Ekonomou, L.; Karampelas, P. The correlation between renewable generation and electricity demand: A case study of Portugal. In Electricity Distribution. Energy Systems; Karampelas, P., Ekonomou, L., Eds.; Springer: Berlin/Heidelberg, Germany, 2016; pp. 119–151. ISBN 978-3-662-49434-9. [Google Scholar]
  26. Simoes, S.; Zeyringer, M.; Mayr, D.; Huld, T.; Nijs, W.; Schmidt, J. Impact of different levels of geographical disaggregation of wind and PV electricity generation in large energy system models: A case study for Austria. Renew. Energy 2017, 105, 183–198. [Google Scholar] [CrossRef]
  27. Peter, J. How does climate change affect electricity system planning and optimal allocation of variable renewable energy? Appl. Energy 2019, 252, 113397. [Google Scholar] [CrossRef]
  28. Jurasz, J.; Dąbek, P.B.; Kaźmierczak, B.; Kies, A.; Wdowikowski, M. Large scale complementary solar and wind energy sources coupled with pumped-storage hydroelectricity for Lower Silesia (Poland). Energy 2018, 161, 183–192. [Google Scholar] [CrossRef]
  29. Blanco, H.; Faaij, A. A review at the role of storage in energy systems with a focus on Power to Gas and long-term storage. Renew. Sustain. Energy Rev. 2018, 81, 1049–1086. [Google Scholar] [CrossRef]
  30. Tafarte, P.; Eichhorn, M.; Thrän, D. Capacity expansion pathways for a wind and solar based power supply and the impact of advanced technology—A case study for Germany. Energies 2019, 12, 23. [Google Scholar] [CrossRef] [Green Version]
  31. Lorente-Plazas, R.; Montávez, J.P.; Jimenez, P.A.; Jerez, S.; Gómez-Navarro, J.J.; García-Valero, J.A.; Jimenez-Guerrero, P. Characterization of surface winds over the Iberian Peninsula. Int. J. Climatol. 2015, 35, 1007–1026. [Google Scholar] [CrossRef]
  32. Gutiérrez, C.; Gaertner, M.Á.; Perpiñán, O.; Gallardo, C.; Sánchez, E. A multi-step scheme for spatial analysis of solar and photovoltaic production variability and complementarity. Sol. Energy 2017, 158, 100–116. [Google Scholar] [CrossRef]
  33. Huth, R.; Beck, C.; Philipp, A.; Demuzere, M.; Ustrnul, Z.; Cahynová, M.; Kyselý, J.; Tveito, O.E. Classifications of atmospheric circulation patterns: Recent advances and applications. Ann. N. Y. Acad. Sci. 2008, 1146, 105–152. [Google Scholar] [CrossRef] [PubMed]
  34. Park, H.-S.; Jun, C.-H. A simple and fast algorithm for K-medoids clustering. Expert Syst. Appl. 2009, 36, 3336–3341. [Google Scholar] [CrossRef]
  35. Calinski, T.; Harabasz, J. A dendrite method for cluster analysis. Commun. Stat. 1974, 3, 27. [Google Scholar]
  36. Da Luz, T.; Moura, P. Power generation expansion planning with complementarity between renewable sources and regions for 100% renewable energy systems. Int. Trans. Electr. Energy Syst. 2019, 29, 19. [Google Scholar]
  37. Vince, A. A framework for the greedy algorithm. Discret. Appl. Math. 2002, 121, 247–260. [Google Scholar] [CrossRef] [Green Version]
  38. Bird, L.; Lew, D.; Milligan, M.; Carlini, E.M.; Estanqueiro, A.; Flynn, D.; Gomez-Lazaro, E.; Holttinen, H.; Menemenlis, N.; Orths, A.; et al. Wind and solar energy curtailment: A review of international experience. Renew. Sustain. Energy Rev. 2016, 65, 577–586. [Google Scholar] [CrossRef] [Green Version]
  39. Boutsika, T.; Santoso, S. Quantifying Short-Term Wind Power Variability Using the Conditional Range Metric. IEEE Trans. Sustain. Energy 2012, 3, 369–378. [Google Scholar] [CrossRef]
  40. Couto, A.; Costa, P.; Rodrigues, L.; Lopes, V.V.; Estanqueiro, A. Impact of Weather Regimes on the Wind Power Ramp Forecast in Portugal. IEEE Trans. Sustain. Energy 2015, 6, 934–942. [Google Scholar] [CrossRef]
  41. REN. National Electric Grid Operator. Available online: http://www.centrodeinformacao.ren.pt/PT/Paginas/CIHomePage.aspx (accessed on 15 November 2019).
  42. Santos, J.; Corte-real, J.; Leite, S. Atmospheric large-scale dynamics during the 2004/2005 winter drought in Portugal. Int. J. Climatol. 2007, 586, 571–586. [Google Scholar] [CrossRef]
  43. Rodríguez-Benítez, F.J.; Arbizu-Barrena, C.; Santos-Alamillos, F.J.; Tovar-Pescador, J.; Pozo-Vázquez, D. Analysis of the intra-day solar resource variability in the Iberian Peninsula. Sol. Energy 2018, 171, 374–387. [Google Scholar] [CrossRef]
  44. Ulbrich, U.; Christoph, M.; Pinto, J.G.; Corte-Real, J. Dependence of winter precipitation over Portugal on NAO and baroclinic wave activity. Int. J. Climatol. 1999, 390, 379–390. [Google Scholar] [CrossRef]
  45. Hoinka, K.P.; de Castro, M. The Iberian Peninsula thermal low. Q. J. R. Meteorol. Soc. 2003, 129, 1491–1511. [Google Scholar] [CrossRef] [Green Version]
  46. Soares, P.M.M.; Cardoso, R.M.; Semedo, Á.; Chinita, M.J. Dynamic Meteorology and Oceanography Climatology of the Iberia coastal low-level wind jet: Weather research forecasting model high-resolution results. Tellus A Dyn. Meteorol. Oceanogr. 2014, 66, 22377. [Google Scholar] [CrossRef] [Green Version]
  47. Huber, M.; Dimkova, D.; Hamacher, T. Integration of wind and solar power in Europe: Assessment of flexibility requirements. Energy 2014, 69, 236–246. [Google Scholar] [CrossRef] [Green Version]
  48. Grell, G.; Dudhia, J.; Stauffer, D.R. A Description of the Fifth-Generation Penn State/NCAR Mesoscale Model (MM5); National Center for Atmospheric Research: Boulder, CO, USA, 1995; p. 121. [Google Scholar]
  49. Saha, S.; Moorthi, S.; Wu, X.; Wang, J.; Nadiga, S.; Tripp, P.; Behringer, D.; Hou, Y.-T.; Chuang, H.; Iredell, M.; et al. NCEP Climate Forecast System Version 2 (CFSv2) 6-Hourly Products. Available online: https://rda.ucar.edu/datasets/ds094.0/ (accessed on 22 January 2019).
  50. Couto, A.; Silva, J.; Costa, P.; Santos, D.; Simões, T.; Estanqueiro, A. Towards a high-resolution offshore wind Atlas—The Portuguese case. J. Phys. Conf. Ser. 2019, 1356, 14. [Google Scholar] [CrossRef]
  51. Huld, T.; Mu, R. A new solar radiation database for estimating PV performance in Europe and Africa. Sol. Energy 2012, 86, 1803–1815. [Google Scholar] [CrossRef]
  52. Mueller, R.W.; Matsoukas, C.; Gratzki, A.; Behr, H.D.; Hollmann, R. The CM-SAF operational scheme for the satellite based retrieval of solar surface irradiance—A LUT based eigenvector hybrid approach. Remote Sens. Environ. 2009, 113, 1012–1024. [Google Scholar] [CrossRef]
  53. Urraca, R.; Gracia-Amillo, A.M.; Koubli, E.; Huld, T.; Trentmann, J.; Riihelä, A.; Lindfors, A.V.; Palmer, D.; Gottschalg, R.; Antonanzas-Torres, F. Extensive validation of CM SAF surface radiation products over Europe. Remote Sens. Environ. 2017, 199, 171–186. [Google Scholar] [CrossRef] [Green Version]
  54. Psiloglou, B.E.; Kambezidis, H.D.; Kaskaoutis, D.G.; Karagiannis, D.; Polo, J.M. Comparison between MRM simulations, CAMS and PVGIS databases with measured solar radiation components at the Methoni station, Greece. Renew. Energy 2020, 146, 1372–1391. [Google Scholar] [CrossRef]
  55. Lacerda, M.; Couto, A.; Estanqueiro, A. Wind power ramps driven by windstorms and cyclones. Energies 2017, 10, 1475. [Google Scholar] [CrossRef] [Green Version]
  56. Brummer, B.; Lange, I.; Konow, H. Atmospheric boundary layer measurements at the 280 m high Hamburg weather mast 1995–2011: Mean annual and diurnal cycles. Meteorol. Z. 2012, 21, 319–335. [Google Scholar] [CrossRef]
  57. Emeis, S. Current issues in wind energy meteorology. Meteorol. Appl. 2014, 21, 803–819. [Google Scholar] [CrossRef]
  58. Obi, M.; Bass, R. Trends and challenges of grid-connected photovoltaic systems—A review. Renew. Sustain. Energy Rev. 2016, 58, 1082–1094. [Google Scholar] [CrossRef]
  59. Hou, Q.; Zhang, N.; Du, E.; Miao, M.; Peng, F.; Kang, C. Probabilistic duck curve in high PV penetration power system: Concept, modeling, and empirical analysis in China. Appl. Energy 2019, 242, 205–215. [Google Scholar] [CrossRef]
  60. International Renewable Energy Agency. Renewable Power Generation Costs in 2018; Springer: Berlin/Heidelberg, Germany, 2019. [Google Scholar]
  61. Abrell, J.; Kosch, M.; Rausch, S. Carbon abatement with renewables: Evaluating wind and solar subsidies in Germany and Spain. J. Public Econ. 2019, 169, 172–202. [Google Scholar] [CrossRef]
  62. Odeh, R.P.; Watts, D. Impacts of wind and solar spatial diversification on its market value: A case study of the Chilean electricity market. Renew. Sustain. Energy Rev. 2019, 111, 442–461. [Google Scholar] [CrossRef]
Figure 1. Schematic flowchart of the methodology applied in this work.
Energies 13 04132 g001
Figure 2. Portuguese power system characterization at the end of 2015: (a) spatial distribution of the wind and solar photovoltaic (PV) power capacity, and (b) energy contribution from the different sources during 2015 (reference year) and 2019.
Energies 13 04132 g002
Figure 3. National aggregated daily average power production (green—wind; orange—solar PV), demand (black), and net load (gray) during 2015.
Energies 13 04132 g003
Figure 4. (a) Average wind power production, (b) spatial distribution of the wind power profiles (WPPs) (only spatial points with an average wind speed above 5.5 m/s are presented and used, and (c) current wind power capacity in each WPP.
Energies 13 04132 g004
Figure 5. Average (a) daily and (b) monthly wind power profiles for all ten WPPs identified with the clustering approach.
Energies 13 04132 g005
Figure 6. (a) Average solar PV power]; (b) spatial distribution of each solar power profiles (SPP) and (c) the current solar PV power capacity in each SPP.
Energies 13 04132 g006
Figure 7. Average (a) daily and (b) monthly solar PV power profiles for all SPPs identified with the clustering approach.
Energies 13 04132 g007
Figure 8. (a) Additional power capacity in each region, and (b) identification of the wind/solar PV power capacity in each scenario and optimization perspective.
Energies 13 04132 g008
Figure 9. Daily profile for (a) all scenarios using a Surplus Max . equal to 5%, and (b) the net load observed in the PV + WindHSC scenario for different Surplus Max . values.
Energies 13 04132 g009aEnergies 13 04132 g009b
Figure 10. Net load duration curve using a Surplus Max . equal to (a) 5% and (b) 10%.
Energies 13 04132 g010
Figure 11. Duration curve of the net load hourly step change using a a Surplus Max . equal to (a) 5% and (b) 10%.
Energies 13 04132 g011
Figure 12. Variable renewable energy (VRE)-wind and solar PV-share for the different scenarios using different Surplus Max . values.
Energies 13 04132 g012
Table 1. Scenarios and optimization perspectives analyzed.
ScenariosObjective Function–Optimization PerspectiveTechnology (ies) Used
STDWindSTDMinimize net load annual variability by adding:Wind
PVSTDSolar PV
PV + WindSTDSolar PV + Wind
HSCWindHSCMinimize one-hour net load step change standard deviation by adding:Wind
PVHSCSolar PV
PV + WindHSCSolar PV + Wind
Table 2. Seasonal 98th net load percentile for each scenario in megawatts (bold numbers represent the minimum value for Surplus Max . equal to 5%, while the underline highlights the minimum value for Surplus Max . equal to 10%).
SeasonCurrentPV + WindWindPV
STDHSCSTDHSCSTDHSC
5%10%5%10%5%10%5%10%5%10%5%10%
Winter8.077.747.587.497.377.427.237.517.388.078.078.078.07
Spring6.776.376.256.256.176.256.116.256.176.776.776.776.77
Summer5.975.165.014.954.825.795.715.755.675.975.975.975.97
Autumn6.676.436.396.256.176.266.176.296.216.676.676.676.67