1. Introduction
Electricity is central to energy transition. The reasons for this are obvious: electricity is the easiest and cheapest sector to decarbonize and it enables the production of synthetic zero-carbon fuels that can substitute the fossil materials used in combustion today. This argument has been developed in the industry [
1,
2] and in scientific literature [
3,
4]. A stronger version of the statement is the claim that full decarbonization can only be reached using a 100% renewable electricity system even without nuclear or carbon sequestration [
5]. Alternatively, electricity may be considered as just one in a set of important clusters of sub-policies [
6]. The transition would then combine sub-policies taken from different clusters; this is the result commonly found in “ambitious” scenarios. However, this combination should also offer stability against uncertainty. The 100% renewable policy should be robust, at least locally, with respect to changes in the accompanying sub-policies. These are challenging goals, especially when considering results published in other parts of the literature. As an example, Resources for the Future’s Global Energy Outlook [
7] reviews 14 recent scenarios produced by important organizations, among which 10 of the 14 are based on continuations or developments of current policies. These 10 do not achieve the energy transition in 2050 even when allowing for nuclear and carbon sequestration. Only four of these scenarios, referred to as “ambitious”, show a promise for reaching global decarbonization, but with nuclear and carbon sequestration.
This paper discusses an analysis of a 100% renewable policy for energy decarbonization. In contrast to most studies, this scenario was not selected from a discrete set of assumptions; it was derived from a local analysis of a continuous set of policies that balance storable and non-storable renewable energy. The approach enabled a comparative assessment of the retained policy with respect to more extreme (less diversified) policies and an analysis of the robustness of this assessment to major assumptions on some other possible policies (clusters). The problem treated in the paper is limited but relevant, as it is directly inspired by current French low-carbon strategy [
8]. The analysis method is a modified scenario approach that can be extended to more complex issues that would involve several clusters of policies [
6].
Opinions diverge on the technical and economic feasibility of the 100% renewable objective. Due to cost and availability of crops surfaces, the recourse using biomass is limited, which implies that intermittent solar and wind constitutes the bulk of the system. Heard et al. [
9] questioned the technical feasibility of this objective on the basis of extensive literature. Brown et al. [
10] contested this argument, also referring to extensive literature. The authors claimed that previously raised objections [
9] have already been overcome and that the 100% objective is known to be technically feasible and economically viable. This discussion goes beyond the scope of this paper, but some of its conclusions directly apply to the discussion herein. Specifically, a study of 100% renewable penetration requires simulations of the system to be conducted with a temporal granularity not coarser than one hour. Zappa et al. [
11] returned to that discussion, treating with a very detailed model. They concluded that the 100% objective is technically feasible but at the cost of significant additional investment and large contributions from biomass and biogas. The problem is that the latter condition is generally considered difficult to satisfy. The question is then to find a substitute for the insufficient biomass.
The above is related to short-term operations. The 100% renewable penetration raises other questions, both institutional and financial, that have seldom been addressed in the literature but may be important. Blazquez et al. [
12] explained that 100% renewable penetration questions the current organization of the competitive electricity system. The claim is easy to understand and hard to contest: the current power design and its bidding system are based on the merit order, which ranks plants according to fuel cost. The notion loses significance in a renewable system where the intermittent plants have no fuel cost; thus, there is a coordination problem that the current market design may find difficult to solve. Polzin et al. [
13] considered an investment issue; the authors argued that the many expenses due to the transition can easily be accommodated by the financial system but that risk may be the problem. Specifically, financing a 100% renewable system with a mix of equity and investment-grade corporate bonds may be difficult in the current highly leveraged market (and more so in a market that will have to redeem the debt incurred because of the Covid-19 pandemic). The penetration of renewables has mainly developed with public help and this may still be necessary in the future to accommodate risk. These questions appear when simulating the 100% renewable market.
Scenario analysis is the most commonly used tool for exploring the energy transition. The method involves the construction of a set of possible futures from which plausible (descriptive) or optimal (normative) technological paths are derived to achieving a target such as the 2015 Paris Agreement (see, for instance, Newell et al. [
7], who discussed both types of scenarios). As shown in the brief literature survey that follows this introduction, the process rarely leads to precise policy recommendations; scenario results are documented using various quantitative methods, but the application of this information to policy remains vaguely formulated. This paper turns the standard approach upside down: it begins with a single (mainly electricity) policy, from which it studies variations to enrich the analysis. A variational scenario is one that differs on a policy objective (here, the penetration of biomass and green gas) from the reference scenario. All reference and variational scenarios achieve the same decarbonization and renewable objectives—they only differ by the penetration of electricity and green gas. The objective was to explore the impact of this variation on the rest of the system. Apart from standard costing and pricing analysis (through dual variables), this also implied examining how the introduction of green gas can help to deal with the intermittency of other renewable energy forms (as treated in Zappa et al. [
11]). In summary, it is hoped that this structured local analysis would more directly produce information usable for understanding, valuing, and, if possible, improving initial policy. Risk is present regardless of how the transition problem is posed; it is handled here by testing the robustness of the considerations obtained by the analysis to changes in some cost or efficiency data. The following summarizes the implementation of this philosophy in this paper.
The analysis starts with a massive electricity (ME) policy, defined by its penetration in the energy system and a decarbonization target. The policy relies on significant penetration of intermittent renewable resources and some biomass development deemed compatible with domestic resources; it is directly inspired by an official policy. Policies concentrating on a given technology track have advantages in terms of economies of scale, communication clarity, and, hence, acceptability. As discussed in the controversy on the feasibility of the 100% renewable transition, they may also produce unexpected difficulties because of the implied tightness of the energy system. ME is then analyzed by considering variations that increase the contribution of biomass and green gas within given restrictions on their availability. Renewable and decarbonization objectives remain identical but intermittency is reduced. This may produce economic advantages: power systems are known to encounter peak management problems for which capacities with low use must be built. A massive penetration of the less-controllable solar and wind resources exacerbates these problems even if they can be alleviated by storage and demand-side actions. The penetration of green gas is a natural method to add storability. As a by-product, it stabilizes the operation of the equipment and hence reduces the volatility of cash flows, which in turn facilitates investment. Last, risk is overwhelming and investment costs for the energy transition are reported to be high. Diversification of assets is well-known to mitigate risk and the substitution of some electricity by green gas is a diversification of the risk bearing on these costly assets.
In short, exploring the consequences of policy variations may add insight that is usually absent from sole comparisons of technical paths derived from the standard approach. The variational scenario analysis thus does not intend to substitute the usual scenario method, which informs policies on a broad range of technological paths; its objective is to enrich the analysis of retained technological paths by looking at variations thereof. While this paper focuses on the centrality of electricity in its cluster of measures, the underpinning methodology is quite general and applies to a mix of clusters. A section at the end of the paper elaborates on how more complex investigations can be conducted using the same approach.
The paper is organized as follows: a comparison of the proposed approach to a more usual analysis of energy transition is presented in the literature review in
Section 2. Scenario analysis relies on an evaluation model;
Section 3 summarizes the main features of the model used in this study. The analysis of the centrality of electricity is described in
Section 4. Starting from an ME strategy, two alternative policies are introduced: low electricity (LE) and mixed energy carriers (MECs), which result from partially substituting electricity with green gas and biomass. General results are provided that suggest that a moderate penetration of green gas and biomass presents several advantages with respect to massive (ME) or low (LE) electrification. This changes the view of the central role of electricity toward a mixed electricity and green gas strategy. This policy is further analyzed by first exploring its implications in terms of the decarbonization of the power sector in
Section 5 before considering the decarbonization of energy fuels through synthetic gas or hydrogen. The findings suggest the advantages of MEC compared to ME and LE.
Section 5 shows that these advantages are robust with respect to the uncertainty of some crucial parameters of the model.
Section 6 briefly explains how the analysis can be extended to more complex policy problems. The conclusions are presented at the end of the paper.
2. Literature Survey and Contribution
The literature on scenario analysis and its application to energy and energy transition is extensive. Recent global analysis of Resources for the Future [
7] and its systematic comparison of several important scenarios were mentioned in the introduction. The following brief review is limited to a few recent papers that are directly relevant to provide context to this work. A first set of papers, taken from a 2020 issue of the
Economics of Energy & Environmental Policy journal, reflects the current state of the field and refers to numerous existing surveys on scenario analysis. Recent advances in the now-long tradition of scenario construction and use in the European Union (EU) are also briefly summarized.
Ansari et al. [
14] summarized the different concepts underpinning scenarios and their use. They also analyzed some major energy transition outlooks issued by different organizations, to which they added their own scenario produced with their model. Most of the discussion involved descriptive scenarios (only three normative scenarios were analyzed), where the authors illuminated the wide differences between their results. They also emphasized the importance of story lines for motivating the scenarios and helping to explain the diversity of results. In addition to this important, but still rather general advice, the authors adhered to the standard approach of comparing the results of different outlooks without inferring any particular policy conclusions from this comparison. Paltsev [
15] explored the value of scenarios for decision making by elaborating on the type of results and their forecasting quality. The scenario results were compared as a method for gaining insight. Paltsev [
16] analyzed the use of scenarios in-depth for exploring possible paths to decarbonization by first recalling the IPPC systematic use of scenarios produced by important organizations and Members of the Integrated Assessment Model Consortium (IAMC). The stated objective of scenario comparison is to analyze similarities and reasons for diversity between the scenarios. Paltsev’s paper first treats several descriptive scenarios and finds relatively good consistency among them in the sense that they all suggest that decarbonization goals will not be reached by current policies. The author then turns to prescriptive scenarios that explicitly target decarbonization. He notes that several technological paths exist that contribute toward the objective and concludes that the outlooks do not reveal a general agreement on the path to follow. The paper does not provide any recommendation based on that diversity but gives some insights on the linear programming (LP) modeling, which will be referred to in
Section 6. Mohn [
17] conducted an in-depth analysis of the three scenarios produced by the IEA’s World Energy Outlook, exploring a possible bias against the development of renewables in these scenarios but not commenting on the insight that can be derived from the scenarios for decision purposes.
These papers do not elaborate much on modeling technology. In contrast, Oei et al. [
18] focused on the use of an LP model (GENeSYS-MOD) for constructing 100% renewable scenarios. They emphasized the role of the power sector and noted the need to work with sufficiently refined temporal and spatial granularity to handle high penetration of renewables properly. Notwithstanding a diversified experience with the model, the authors do not arrive at a recommendation on this granularity issue. They do not discuss the use of different scenarios. Crespo del Granado et al. [
19] also focused on the need to rely on a good description of the power sector in the context of the energy transition. In contrast to a study that used a single LP model [
18], they treated the question through a set of interacting sectoral models. The authors argued that this allows to capture the full complexity of the problems but did not elaborate on the mathematical structure of those interactions or on the economic properties of the global results. The authors treated four different scenarios that could best be classified as descriptive as they considered different institutional arrangements. It is hard to see how such diversified scenarios could provide a guide to investors and the authors did not attempt to do so.
The European Union (EU) has a long tradition of energy scenarios modeling, which was initiated in the aftermath of the energy crisis of the 1970s, later expanded to climate issues, and is now applied to energy transition. The PRIMES model [
20], which was progressively developed over more than 30 years, plays a central role in these studies. PRIMES is a partial equilibrium model; it interacts with some satellite models but is a monolithic model that can include policy targets. Recent illustrations of the construction of a scenario by the use of these models have been published [
21,
22]. Capros et al. [
23] expanded upon this experience and provided the basis for an analysis of energy transition, which is particularly interesting in terms of scenario construction. As in other organizations, European Commission’s communication [
24], which extend beyond Capros et al. [
23], started from a basic scenario that was essentially the extension of the “EU Reference Scenario 2016” [
22] and embedded the already-decided policies. This first scenario served as counterfactual to other scenarios, constructed as follows: a set of “category 1” scenarios was constructed, where each one added a specific technological path to the reference scenario and examined how this combination contributed to a given decarbonization target set at 80% greenhouse gas (GHG) reduction in 2050. A “category 2” scenario (known as COMBO) combined these technological pathways and added them to the basic scenario to examine the progress in decarbonization that could be achieved. Finally, two “category 3” scenarios considered disruptions compared to COMBO: additional actions to achieve negative emissions and to change consumer choice. The work was based on abundant technological documentation. PRIMES relies on a rather coarse description of the load curve with 48 and 216 load segments per year in the reduced or extended model versions, respectively [
20]. The policy analysis consisted of a comparison of the results of the different scenarios without recommendations on what to extract from their diversity for decision making.
The contribution of this paper can be stated in reference to the literature survey and the discussion in the introduction. As explained in the introduction, the analysis proceeds with scenarios that represent policies and variations on policies (variational scenario analysis). This was performed inside a single linear programming (LP) model that embeds all the necessary technological data of the problem and adds policies in the form of constraints that reflect targets or combinations thereof. Varying the targets allows for an easy exploration of a given domain of policies. One can then search for improved mixed policies and test their stability (smooth reaction to changes of targets) through dual variables of these targets. The approach is applied to the robustification of a given massive electricity policy through the penetration of biomass and green gas, which, following Zappa et al. [
11], plays a crucial role in determining the feasibility of the 100% renewable policy. As explained in the core of the text, this reveals the key role played by hydrogen produced from renewable energies when biomass and green gas availability are limited. This requires the analysis to be conducted with an hourly granularity to be credible in terms of technical feasibility [
9,
10]. Hourly granularity avoids simplifications commonly found in representations of the power system that distort price signals (implicit value of constraints or dual variables in LP parlance) sent to investment.
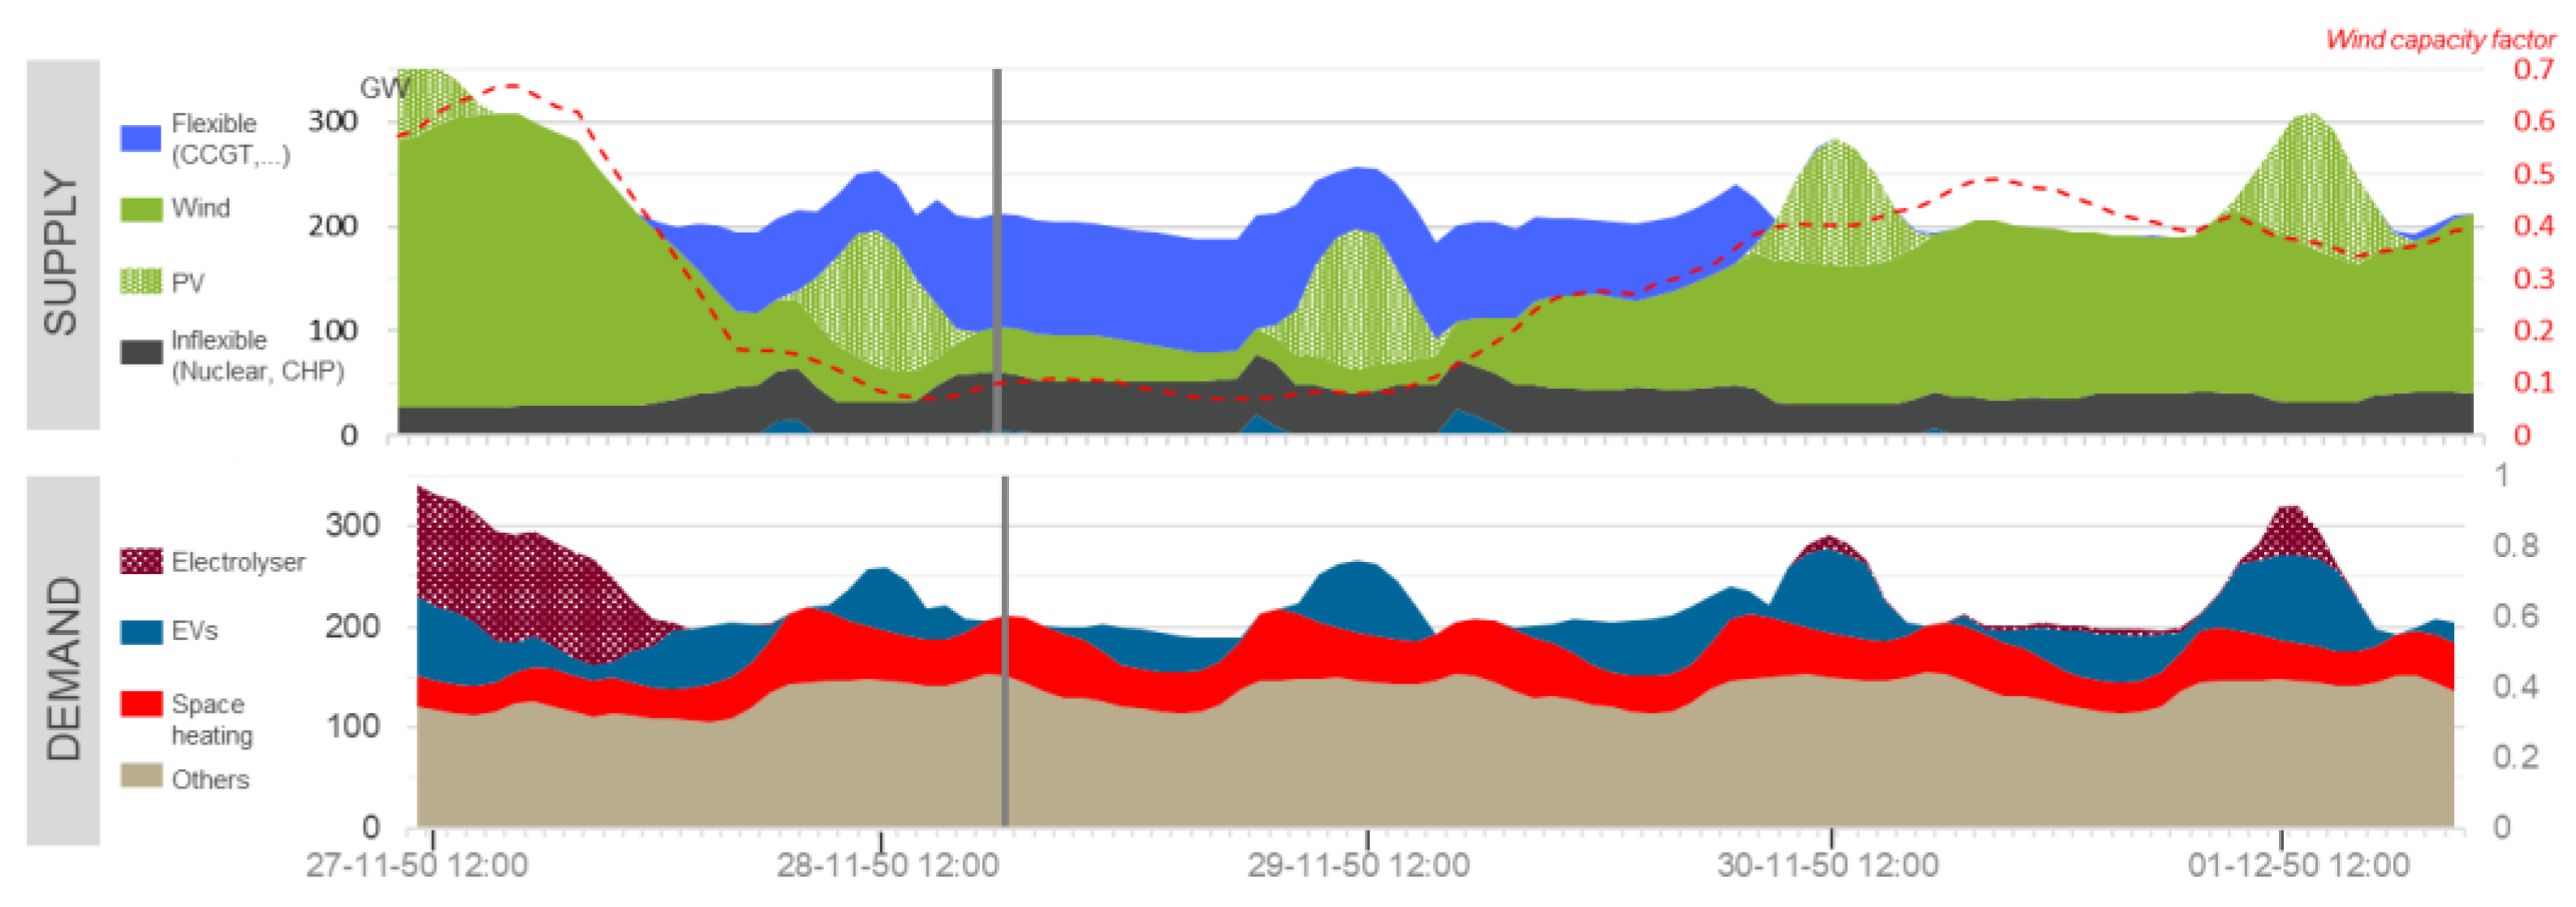
In practical terms, an hourly granularity increases the size of the model, making it more time consuming to solve. This problem can be overcome by limiting its scope to the electricity sector and the direct connections to decarbonization through the replacement of fossil fuels by methane or hydrogen supply. Avoiding distortions of price signals is of the essence for accurately capturing the interactions between electricity, hydrogen, and methane through storage and their pricing consequences during long periods of intermittency of renewable plants. Globally, this type of analysis contributes to filling the gap between the production of a discrete set of technical paths associated with possible futures in the usual scenario studies and detailed policy analysis.
4. Scenario Construction and Global Results
4.1. Two Contrasted Scenarios
France’s Low Carbon National Strategy [
8] and the global scenario of the EnergyWatch Group [
31] provided the first sources of inspiration for constructing contrasted target policies. Those scenarios reflect an extensive use of electricity, which largely relies on domestic resources of wind, solar, and biomass. Drawing on this idea, one constructs a massive electricity development (ME) policy scenario for Central–Western Europe (CW–E) that aims at an end use electrification level of 57% (compared to 24% in 2018). Taking inspiration from national policies is reasonable in an EU organization where energy strategies are decided at the national level. To simplify the discussion, it is assumed that the same policy is implemented in the eight countries; the approach is easily verified to be extendable to the case where different national objectives are applied in each country. Treating this case would, however, require more extensive discussion than a single paper could provide.
ME immediately suggests an alternative policy where the electrification target is reduced by half and compensated by an equivalent (in terms of the capability to satisfy useful energy demand) use of decarbonized fuels. This policy is referred to as lesser electrification (LE). ME and LE are boundary policies [
14]; these scenarios are not truly extreme but still strongly differentiated. It is costly, at least on the basis of the results of the model, to increase decarbonization by reinforcing electricity in ME. Similarly, the recourse to green gas reaches its assumed (reasonable) import limits in LE. The embedded conservation effort and technical progress are (plausible) enabling assumptions; they cannot be lowered without jeopardizing the feasibility of the decarbonization goal. These soft limiting assumptions translate into high dual variables, which are standard signs of scarcity and hence justifies them being taken as a boundary. Each ME or LE policy produces a portfolio of assets. As explained in the introduction, portfolios of policies appear attractive in the hope that they efficiently stabilize the portfolio of assets, which is a key requirement given the current uncertainties.
4.2. An Intermediate Scenario
The principle of the variational scenarios is to explore the neighborhood of the reference ME policy. This is achieved by moving on the path from ME to LE by relaxing the limits on the use of green gas and the targets on electrification, and correspondingly reducing the penetration of electricity. ME only relies on domestic resources of green gas whereas the path from ME to LE allows for imports. The approach in principle enables an analysis of a continuum of portfolios of policies for which different tradeoffs can be observed, therefore providing some insight on the flexibility of the system (operations should vary smoothly with the policy parameters). The discussion of the paper is limited to the middle scenario on this path and the analysis conducted on these three cases.
The third policy scenario, multiple energy carriers (MEC), was constructed to create the middle policy portfolio. The electrification rate of MEC was selected to lie between the two electrification targets of ME and LE. Similarly, the availability of biomass is intermediate to those of ME and LE. The decarbonization and conservation objectives remained unchanged. An intuitive interpretation of MEC is that it constructs a portfolio of policies as one would construct a portfolio of sectoral funds.
Decarbonization, in this model, is driven by CO
2 curves constructed by a short iterative process to satisfy a linear pattern of decarbonization through the horizon with full decarbonization in 2050. This indirect procedure is preferred to the one that directly imposes a sequence of decarbonization profiles as it avoids perturbations of dual variables due to overlapping constraints, some of them reflecting EU policies. Because the evolution of the system is constrained by the electrification and green gas policy, the CO
2 curves are expected to be different. This is the case close to the horizon given the need to arrive at full decarbonization (
Table 3). This arises when natural gas is displaced from the system, which is in the last period of the horizon (an outcome of the intertemporal optimization) and is eliminated using different technologies in the ME, MEC, and LE scenarios. Domestic bio and synthetic methane in ME implies a CO
2 price of 354 €
2018/t. Import of synthetic methane until saturation of infrastructure and local synthetic methane makes the CO
2 price, at 399 €
2018/t in LE higher than in ME because of less favorable integration of electrolyzers in the power sector. MEC can import synthetic gas at 227 €
2018/t through unsaturated infrastructures. Fixing the decarbonization objective through a 2050 CO
2 price ensures a total conversion to renewable in that year, making this a normative scenario analysis.
Policy supports also help with decarbonization, including subsidies for variable renewables until 2030 to drive out coal and subsidies for biogas to build up the industry. Help is also provided for financing energy efficiency and large retrofitting of buildings. Some assumptions on conservation and efficiency are ambitious, which require testing the robustness of the obtained results. The model considers all emissions resulting from combustion except aviation, but leaves those originating in production processes for future work. Overall, the coverage amounts to 81% of total greenhouse gases emissions. In summary, electrification rate and green gas penetration define the scenario domain. The analysis extends over the 2020–2050 horizon with the energy transition supposed to be achieved in 2050.
4.3. Global Results
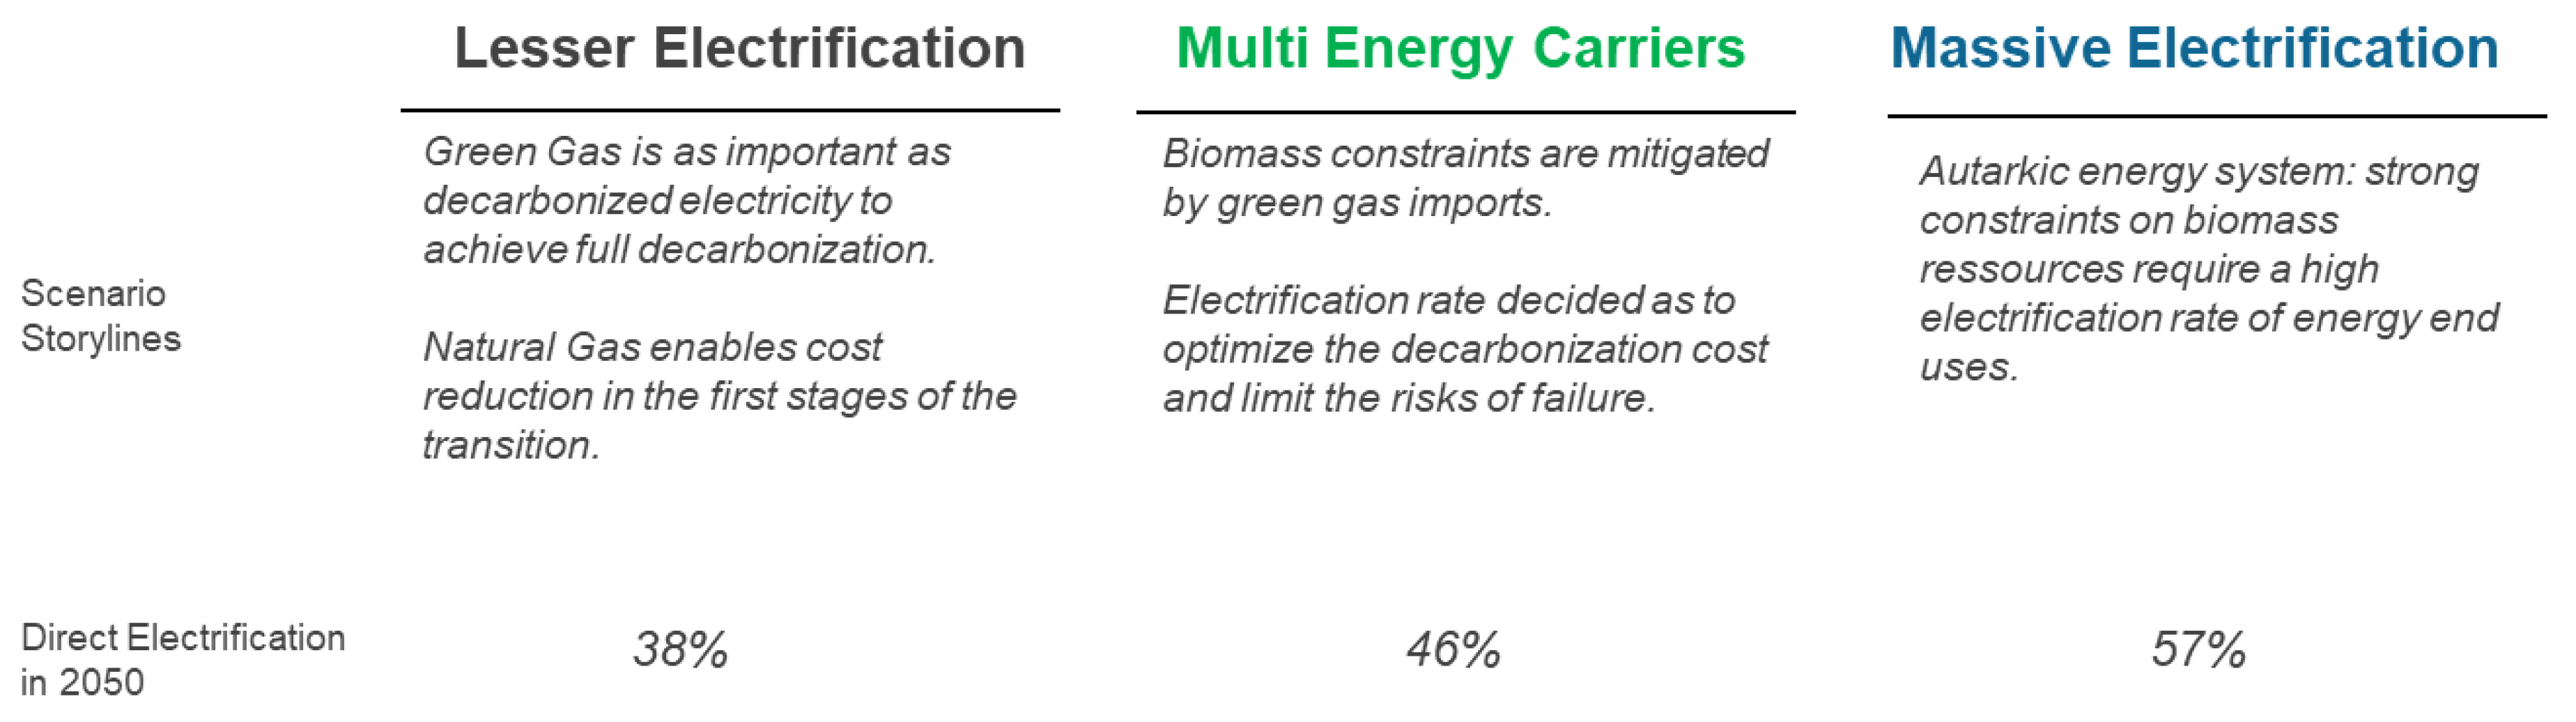
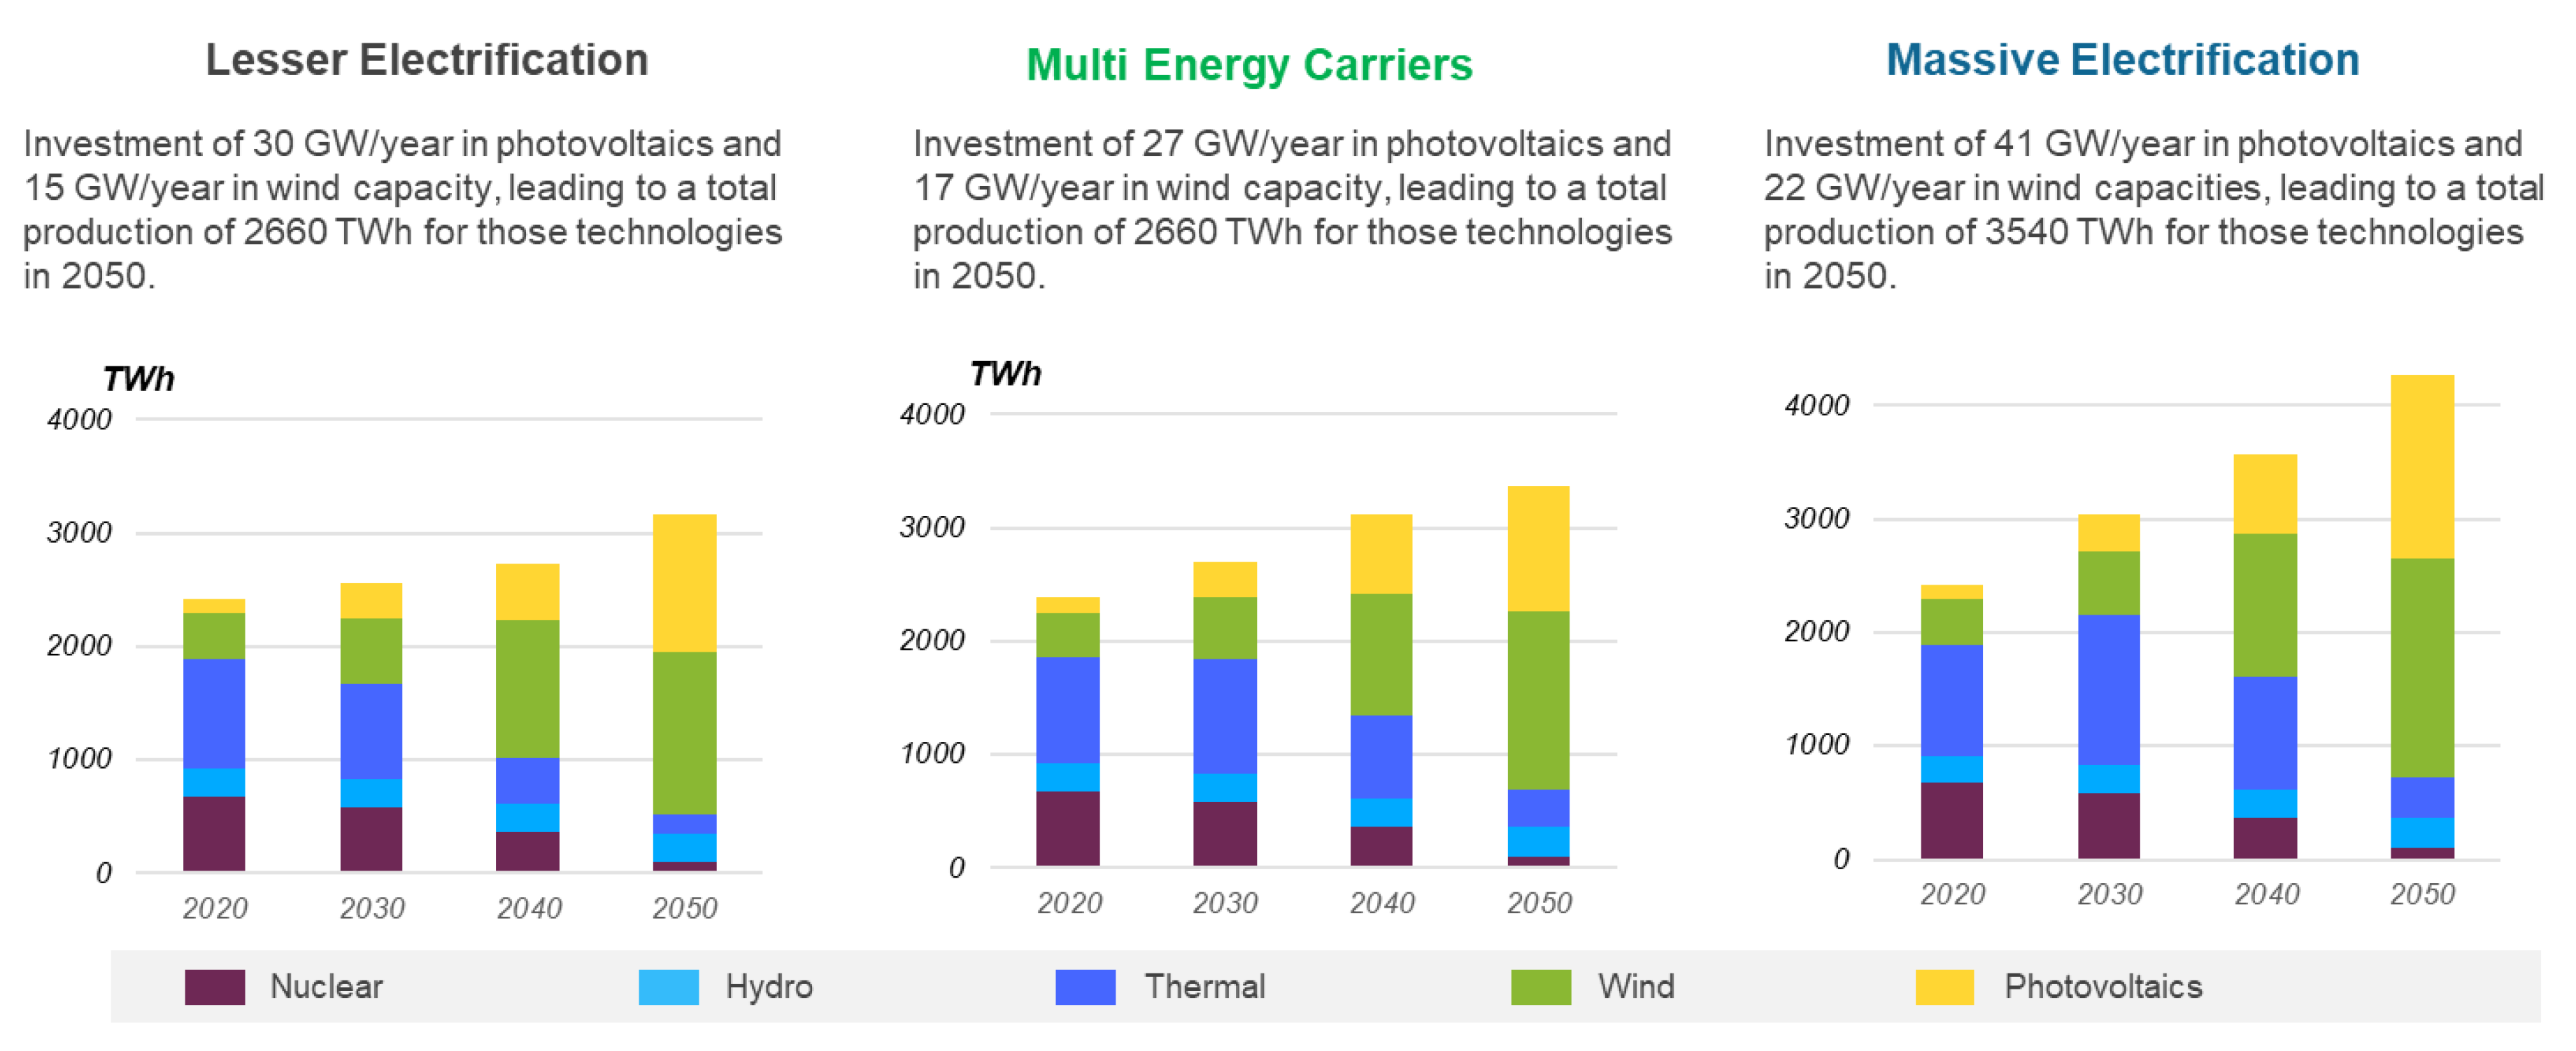
Figure 1 summarizes the main characteristics of the three scenarios, including a short storyline, the possibility of importing green gas, and the electrification rate. The direct electrification figures reflect the story lines of the scenarios and were derived on the basis of the bottom-up demand model. The ME value reflects that anything that does not require synthetic gas (57% of the demand) switches to electricity. MEC allows for a supply of green gas to be optimized, as stated in the story line, which decreases direct electrification to 46%. LE assigns an equal share of green gas and renewable electricity that saturates the import capacity, and prices the balance at the cost of the synthetic gas at 38%. Although this equivalence between the story line and the electrification rates holds in principle, implementing it numerically requires some trial and error due to the structure of the bottom-up demand model and the staircase form of the implied demand function. Each block of this model switches between fuels on the basis of their competition in total cost. More specifically, for each end use (transport, residential and tertiary, and industrial sectors), the demand trajectory is derived with its different shares of each energy vector to reflect the scenario’s storylines regarding electrification and the compatibility with the relative competitiveness of each energy to supply its derived end uses. Some divergences remain in the residential and tertiary sector for heating needs and in the transport sector for light-duty trucks.
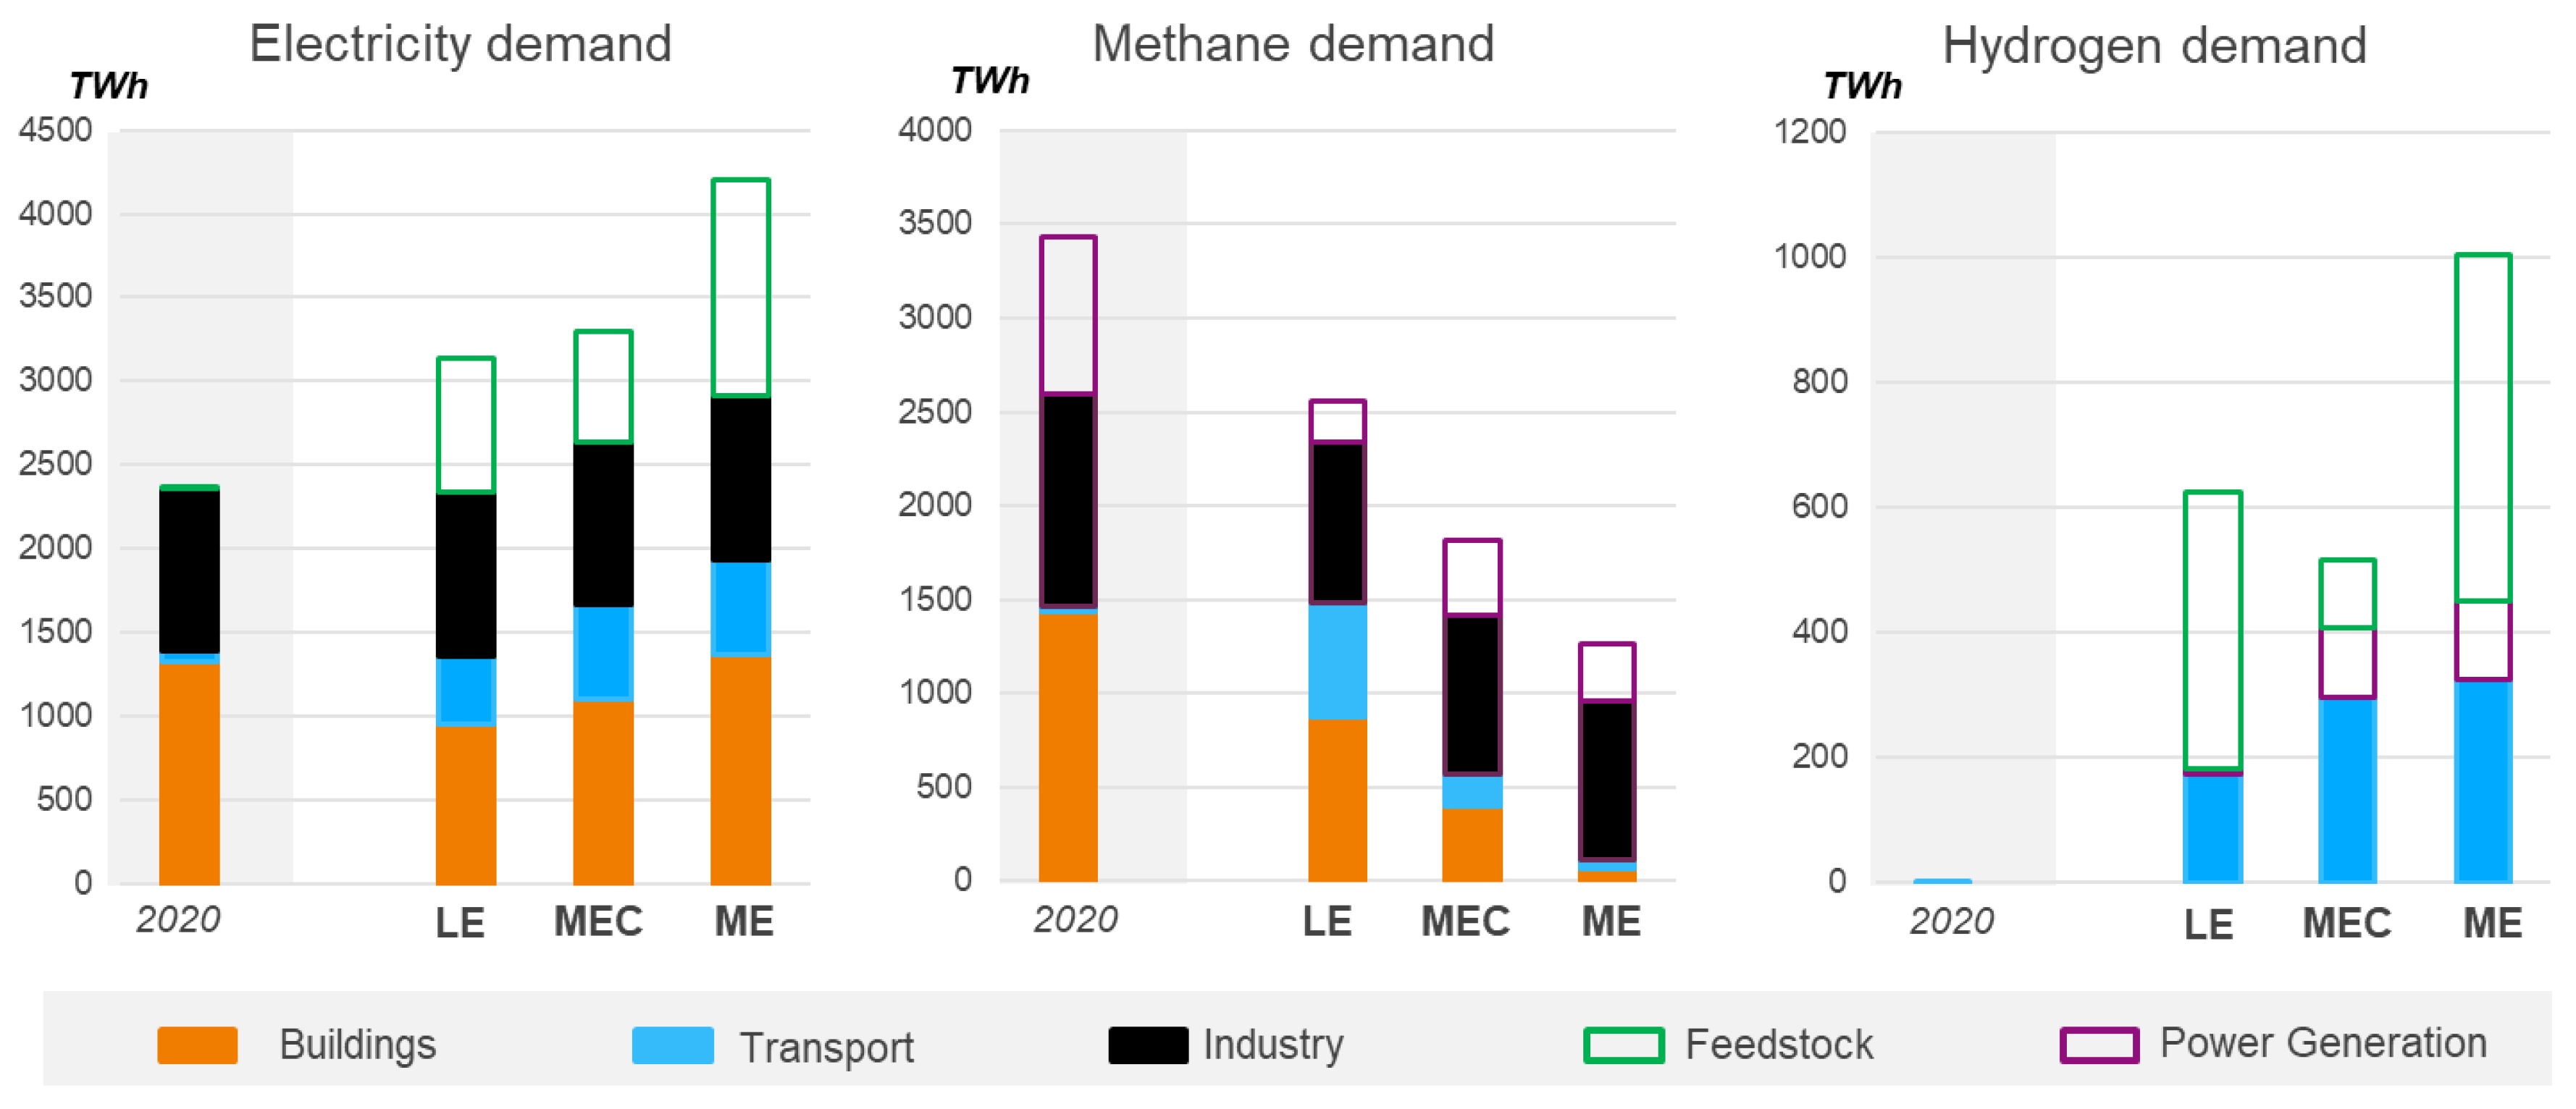
Figure 2 depicts the obtained sectoral composition of electricity, methane, and hydrogen demand in 2050 for each scenario; the main differences in market shares of final energy are found in the building and transport sectors. The decarbonization pathway for industry is similar across scenario. It is mainly based on electrification of the demand (37% with market share gains in low temperature processes). There is a transition of solid or liquid uses toward their biomass equivalent (32%), and gas shares in medium and high temperature processes are unchanged (31% of industry demand).
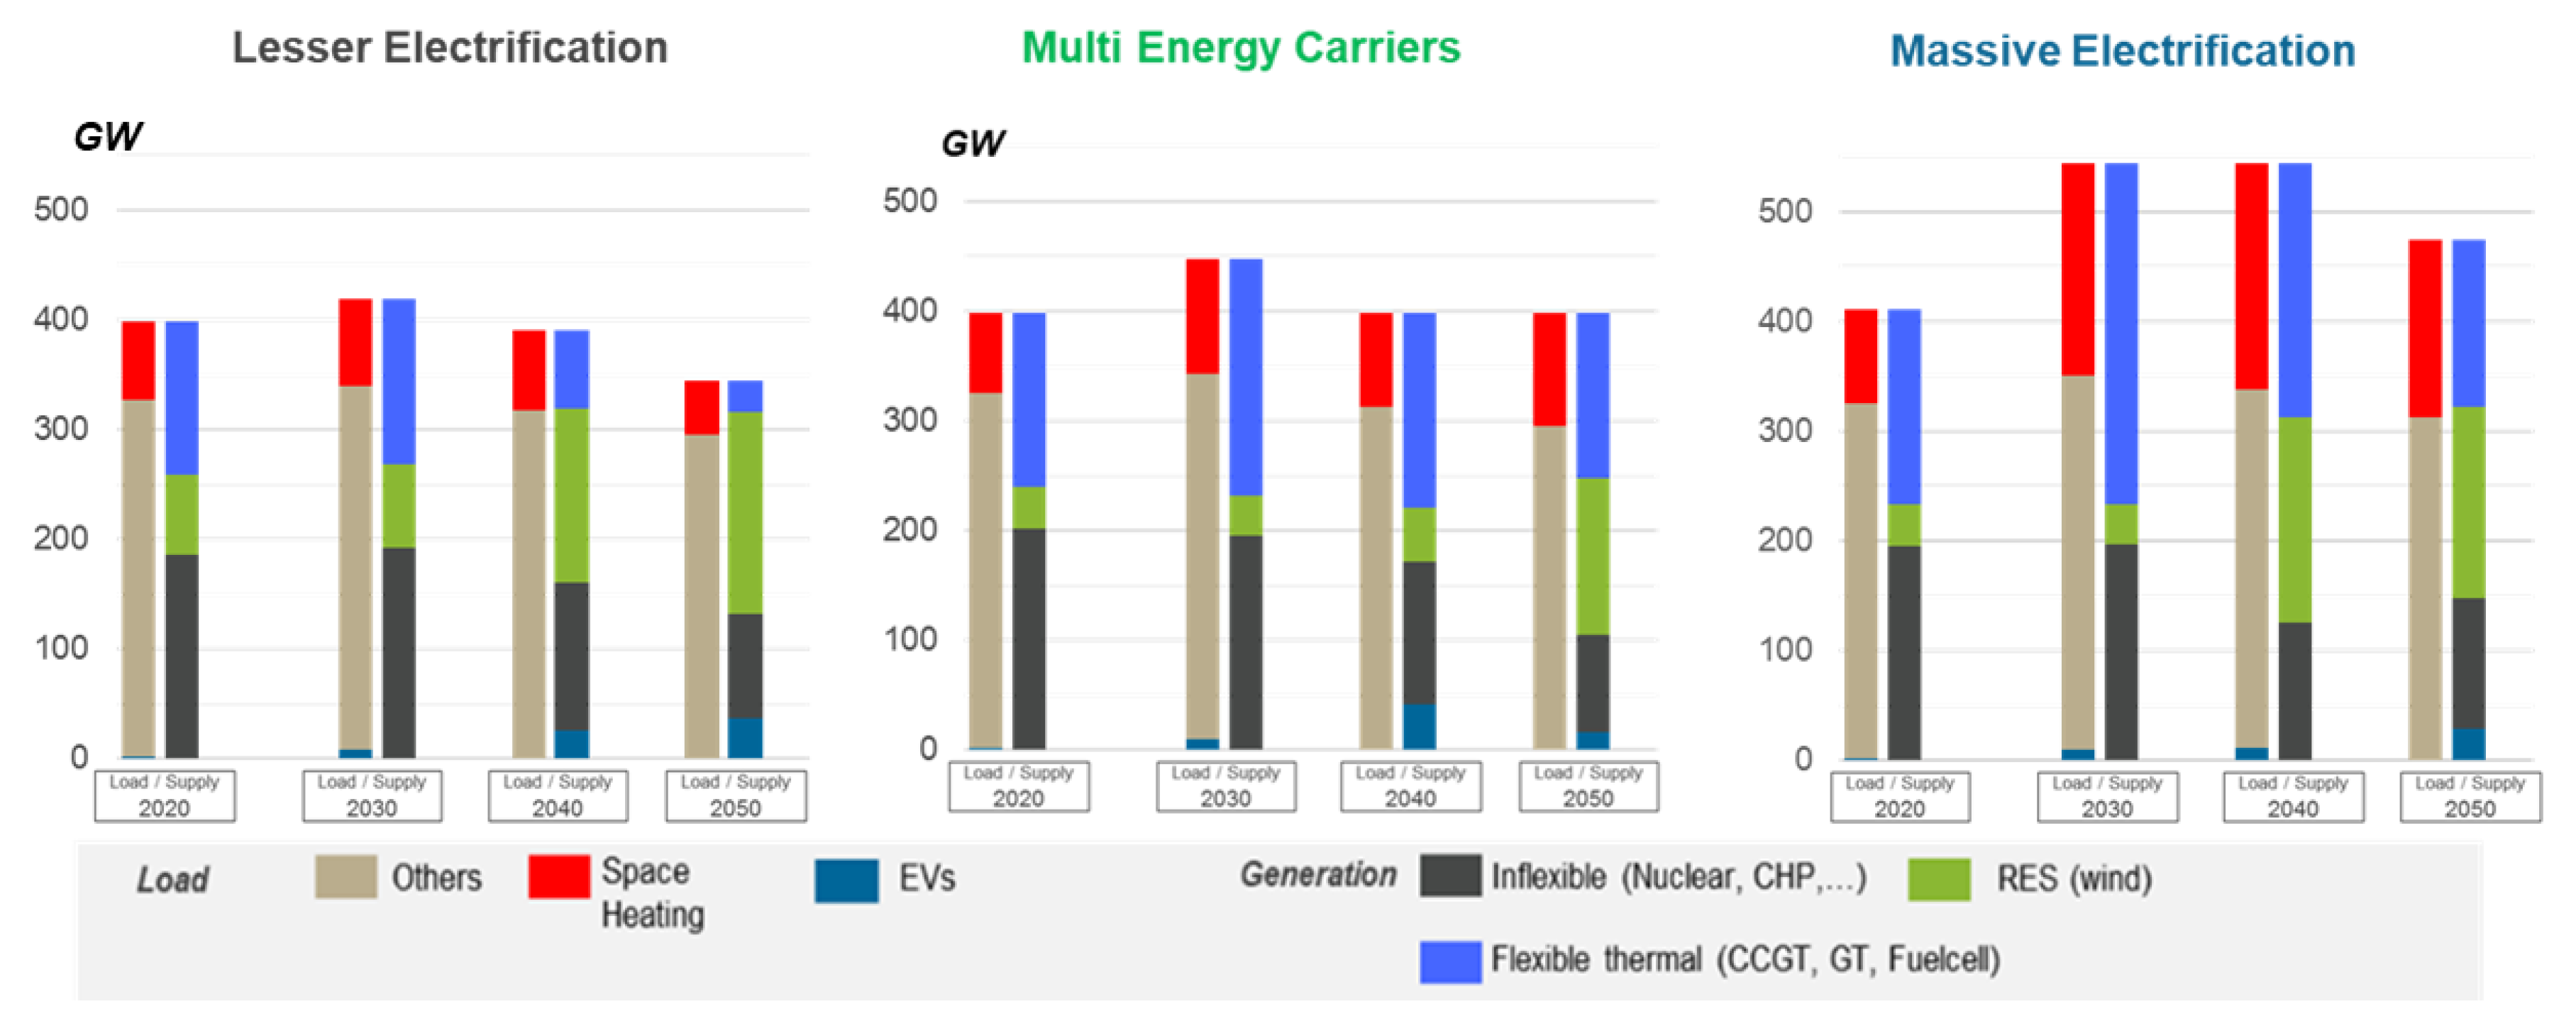
In LE, electricity mainly increases its market share by substituting fuel oil in space heating; only 70% of passenger mobility is electrified, while methane increases its market share in transport. In 2050, the demand of electricity for the production of synthetic fuels increases sharply to cope with the limits on green gas imports. In ME, space heating is almost fully electrified, and methane is almost only used in the industry and power sectors. Final demand in the MEC scenario lies in between those two contrasted scenarios. Regarding secondary uses, the ME scenario requires an important production of hydrogen in 2050, which is used as feedstock for synthetic methane. This scenario only relies on domestic resources to achieve its decarbonization, and biomass resources are insufficient to fulfill non-electric demands. This is related to what occurs in the LE scenario, but hydrogen production is required in this scenario because imports of green gas are reaching their maximum potential in 2050.
The penetration of electricity observed in ME remains in the range of Eurelectric scenarios [
1], albeit obtained with different hypotheses of decarbonization and energy efficiency. Similarly, French low-carbon strategy [
8] and the global scenario of the Energy Watch Group [
31] are close to ME, even if obtained with different assumptions of energy efficiency in transport, industry, and buildings. There was no attempt to replicate these external results as scenarios studies use different data and model assumptions. Still, checking that figures remain in the same range is important for the plausibility of the analysis. A portfolio of policies such as MEC diversifies the portfolio of physical assets compared to a single policy. This mitigates the risk but may result in possible losses of economies of scale. This effect was not studied here.
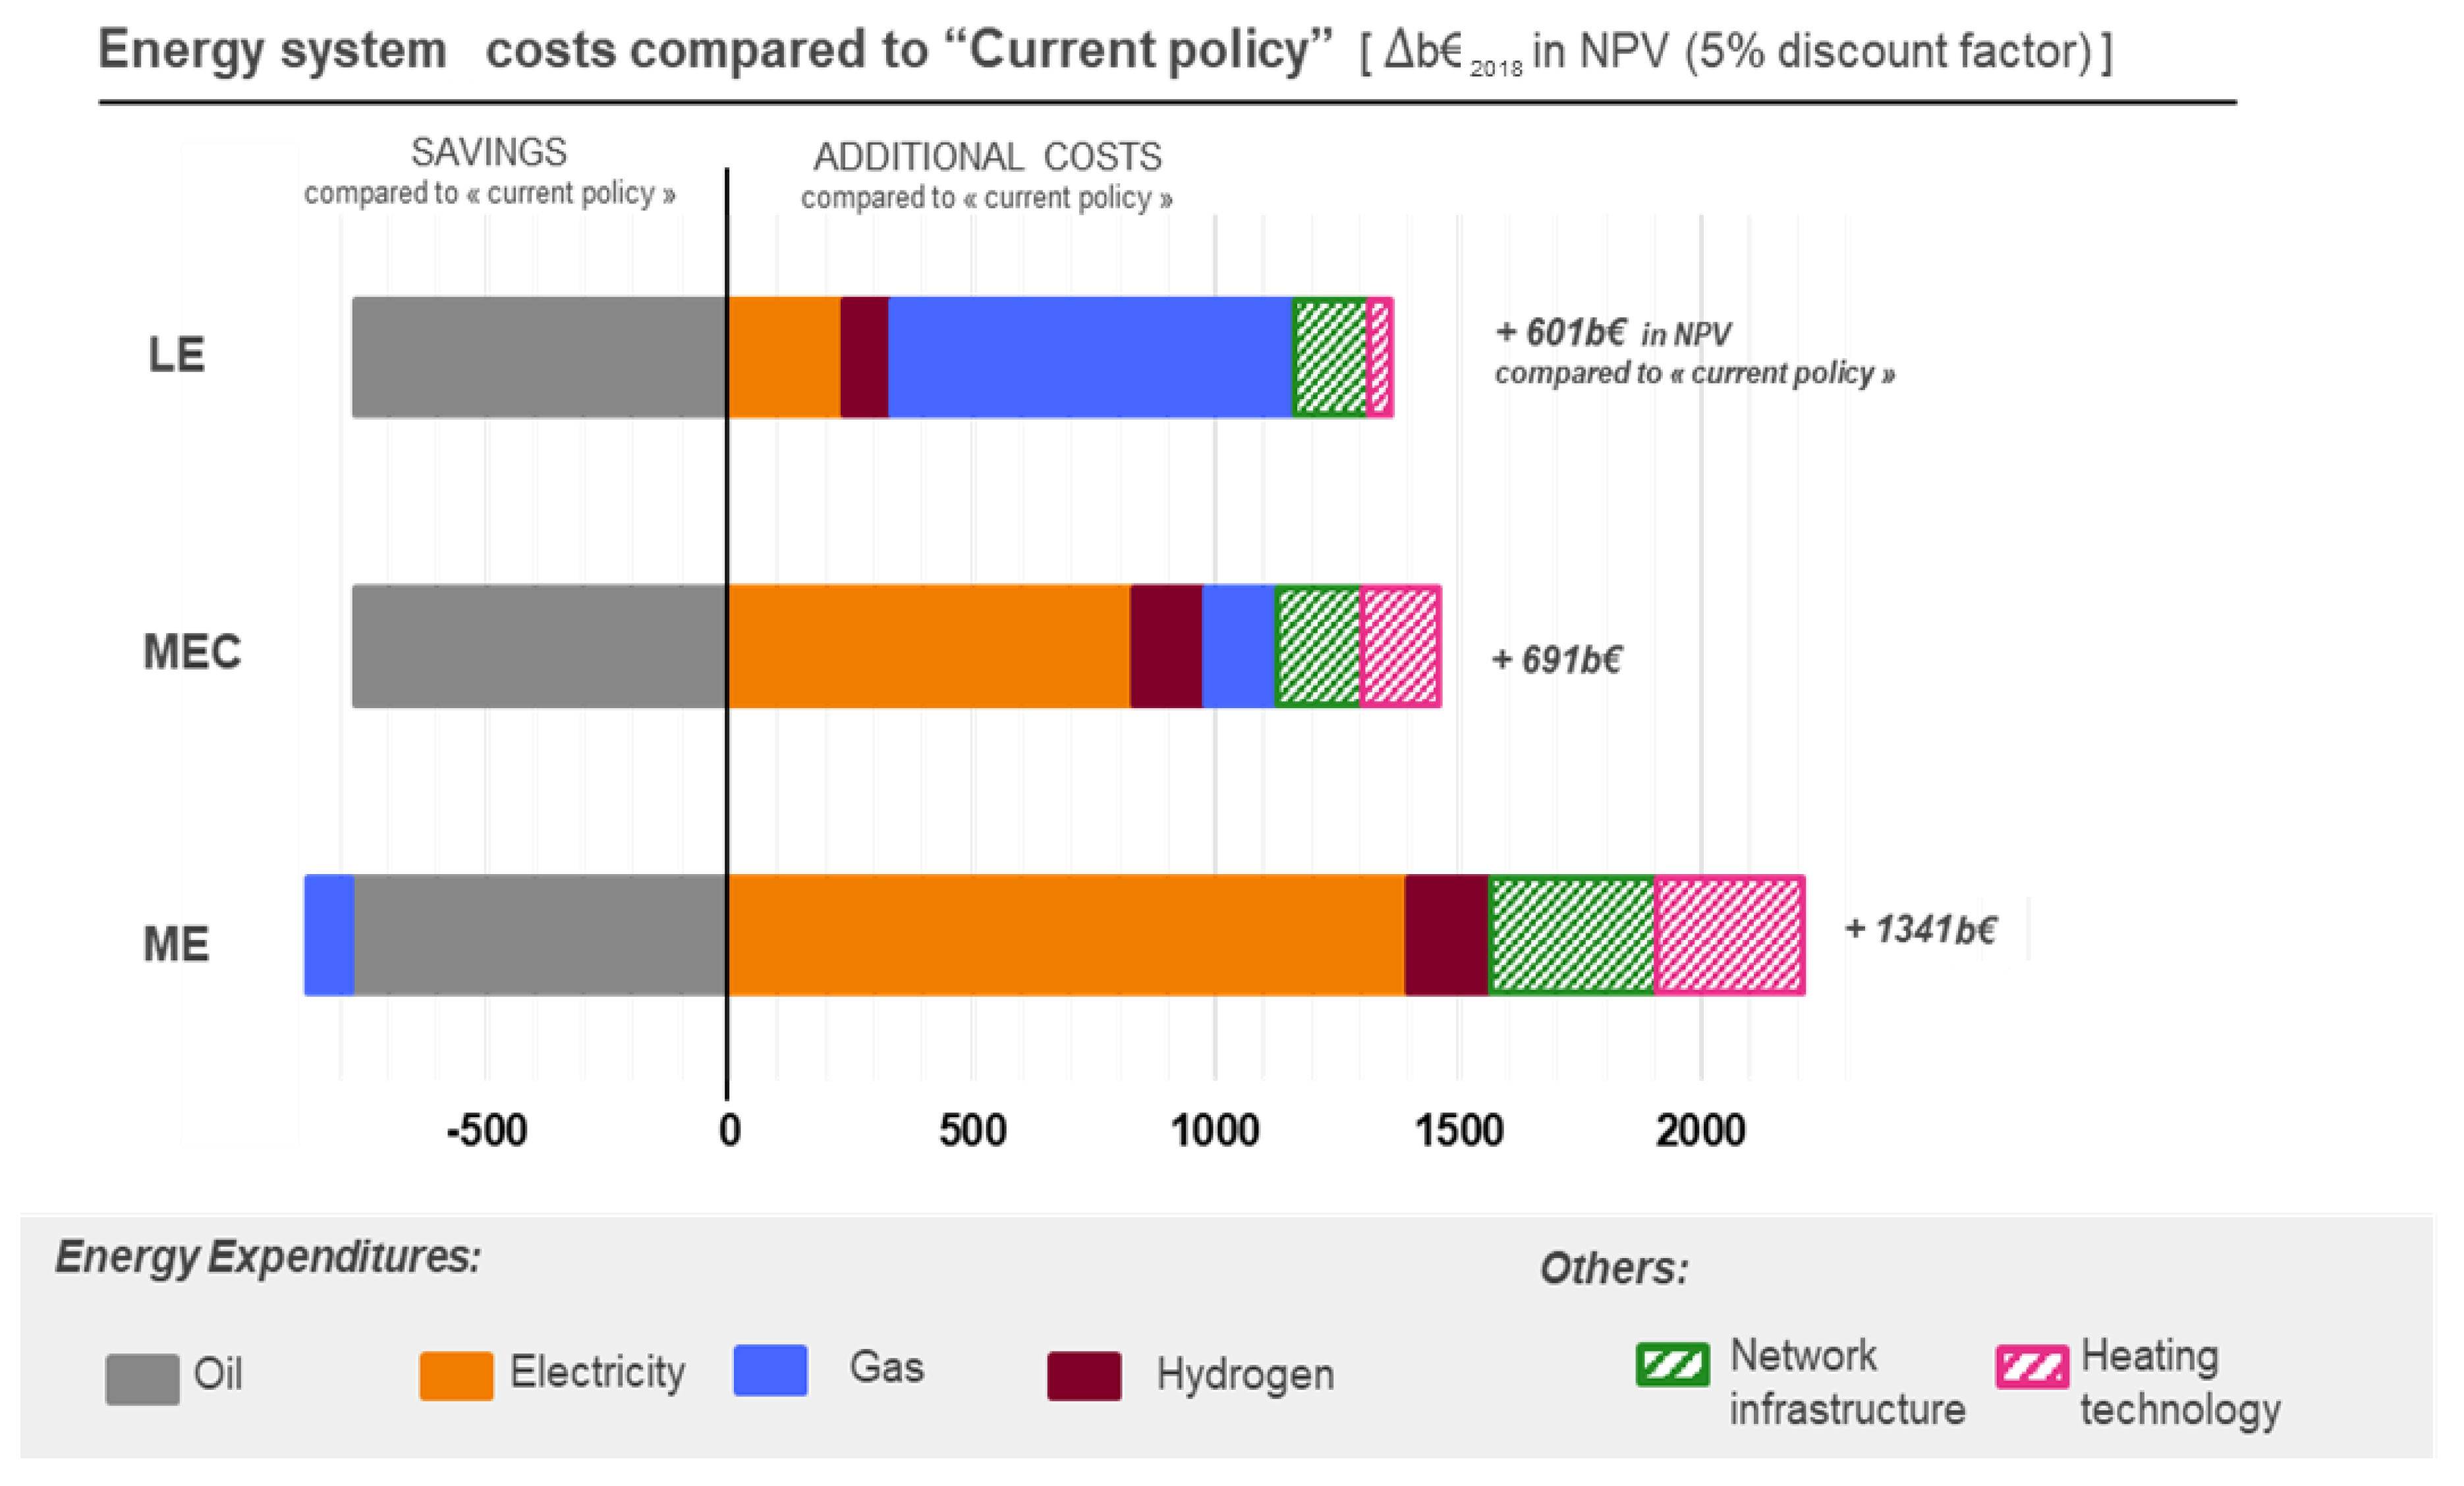
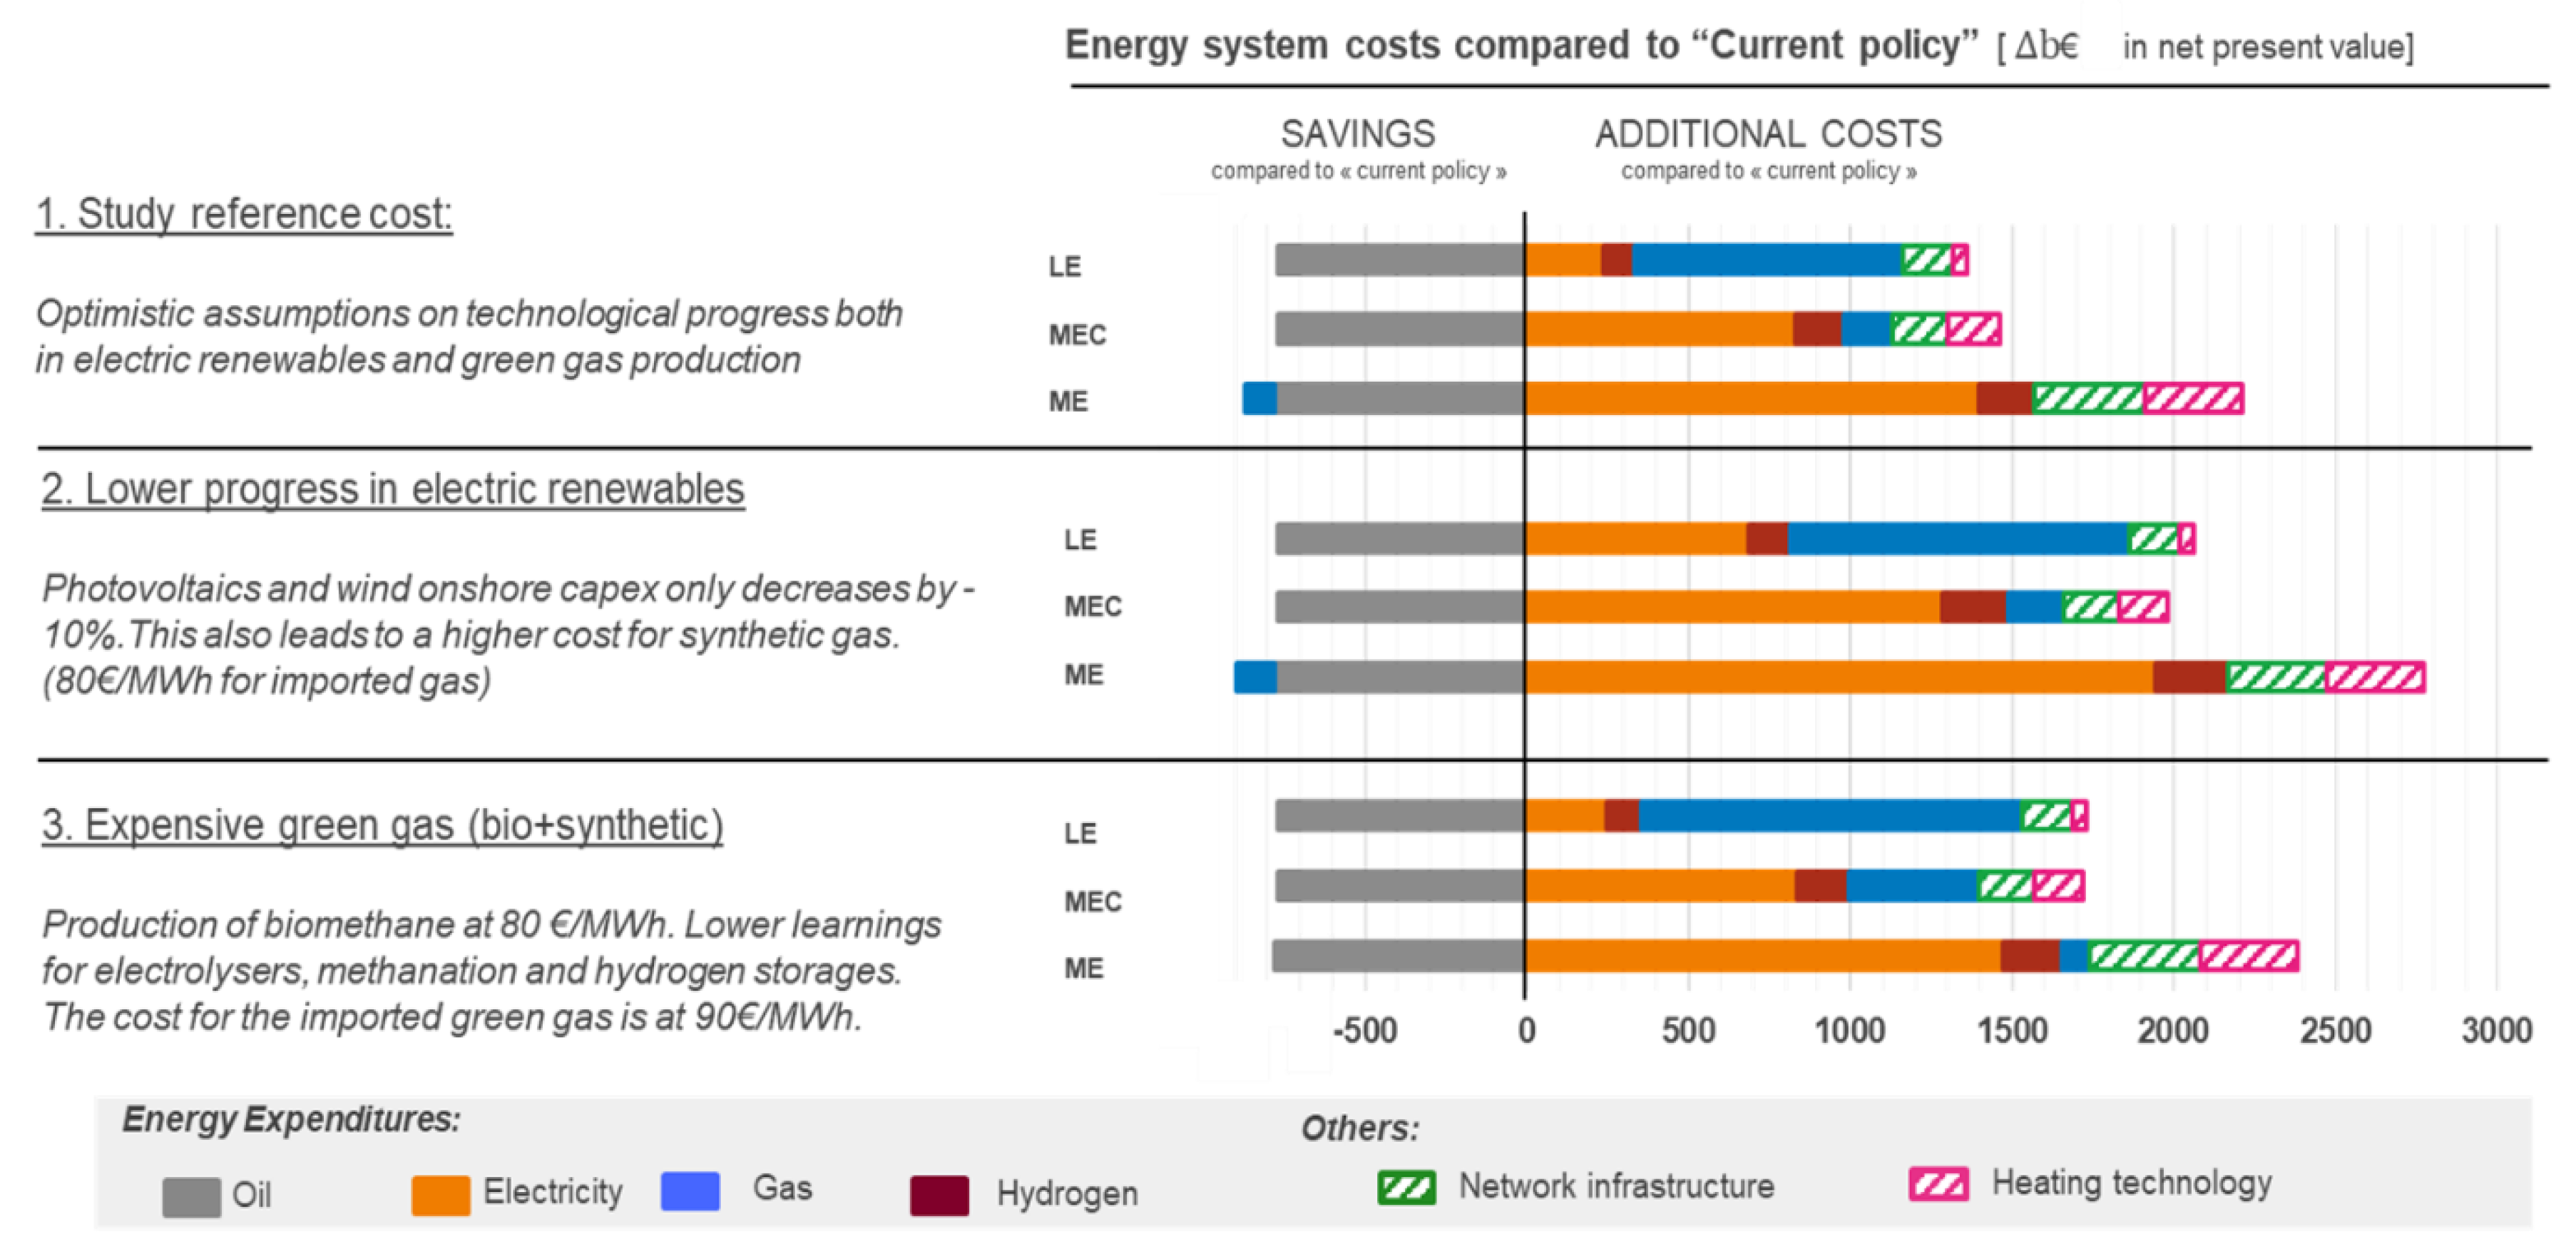
Figure 3 provides the economic evaluation of the scenario in terms of net present value (NPV) of the energy system cost compared to a current policy scenario. The computation is based on a 5% discount rate and the 2050 values were taken as final steady state situation. It compares the increase in energy expenditures per carrier in cost for network infrastructure (taken from Agora [
32] regarding integration of renewables) and in technologies for space heating.
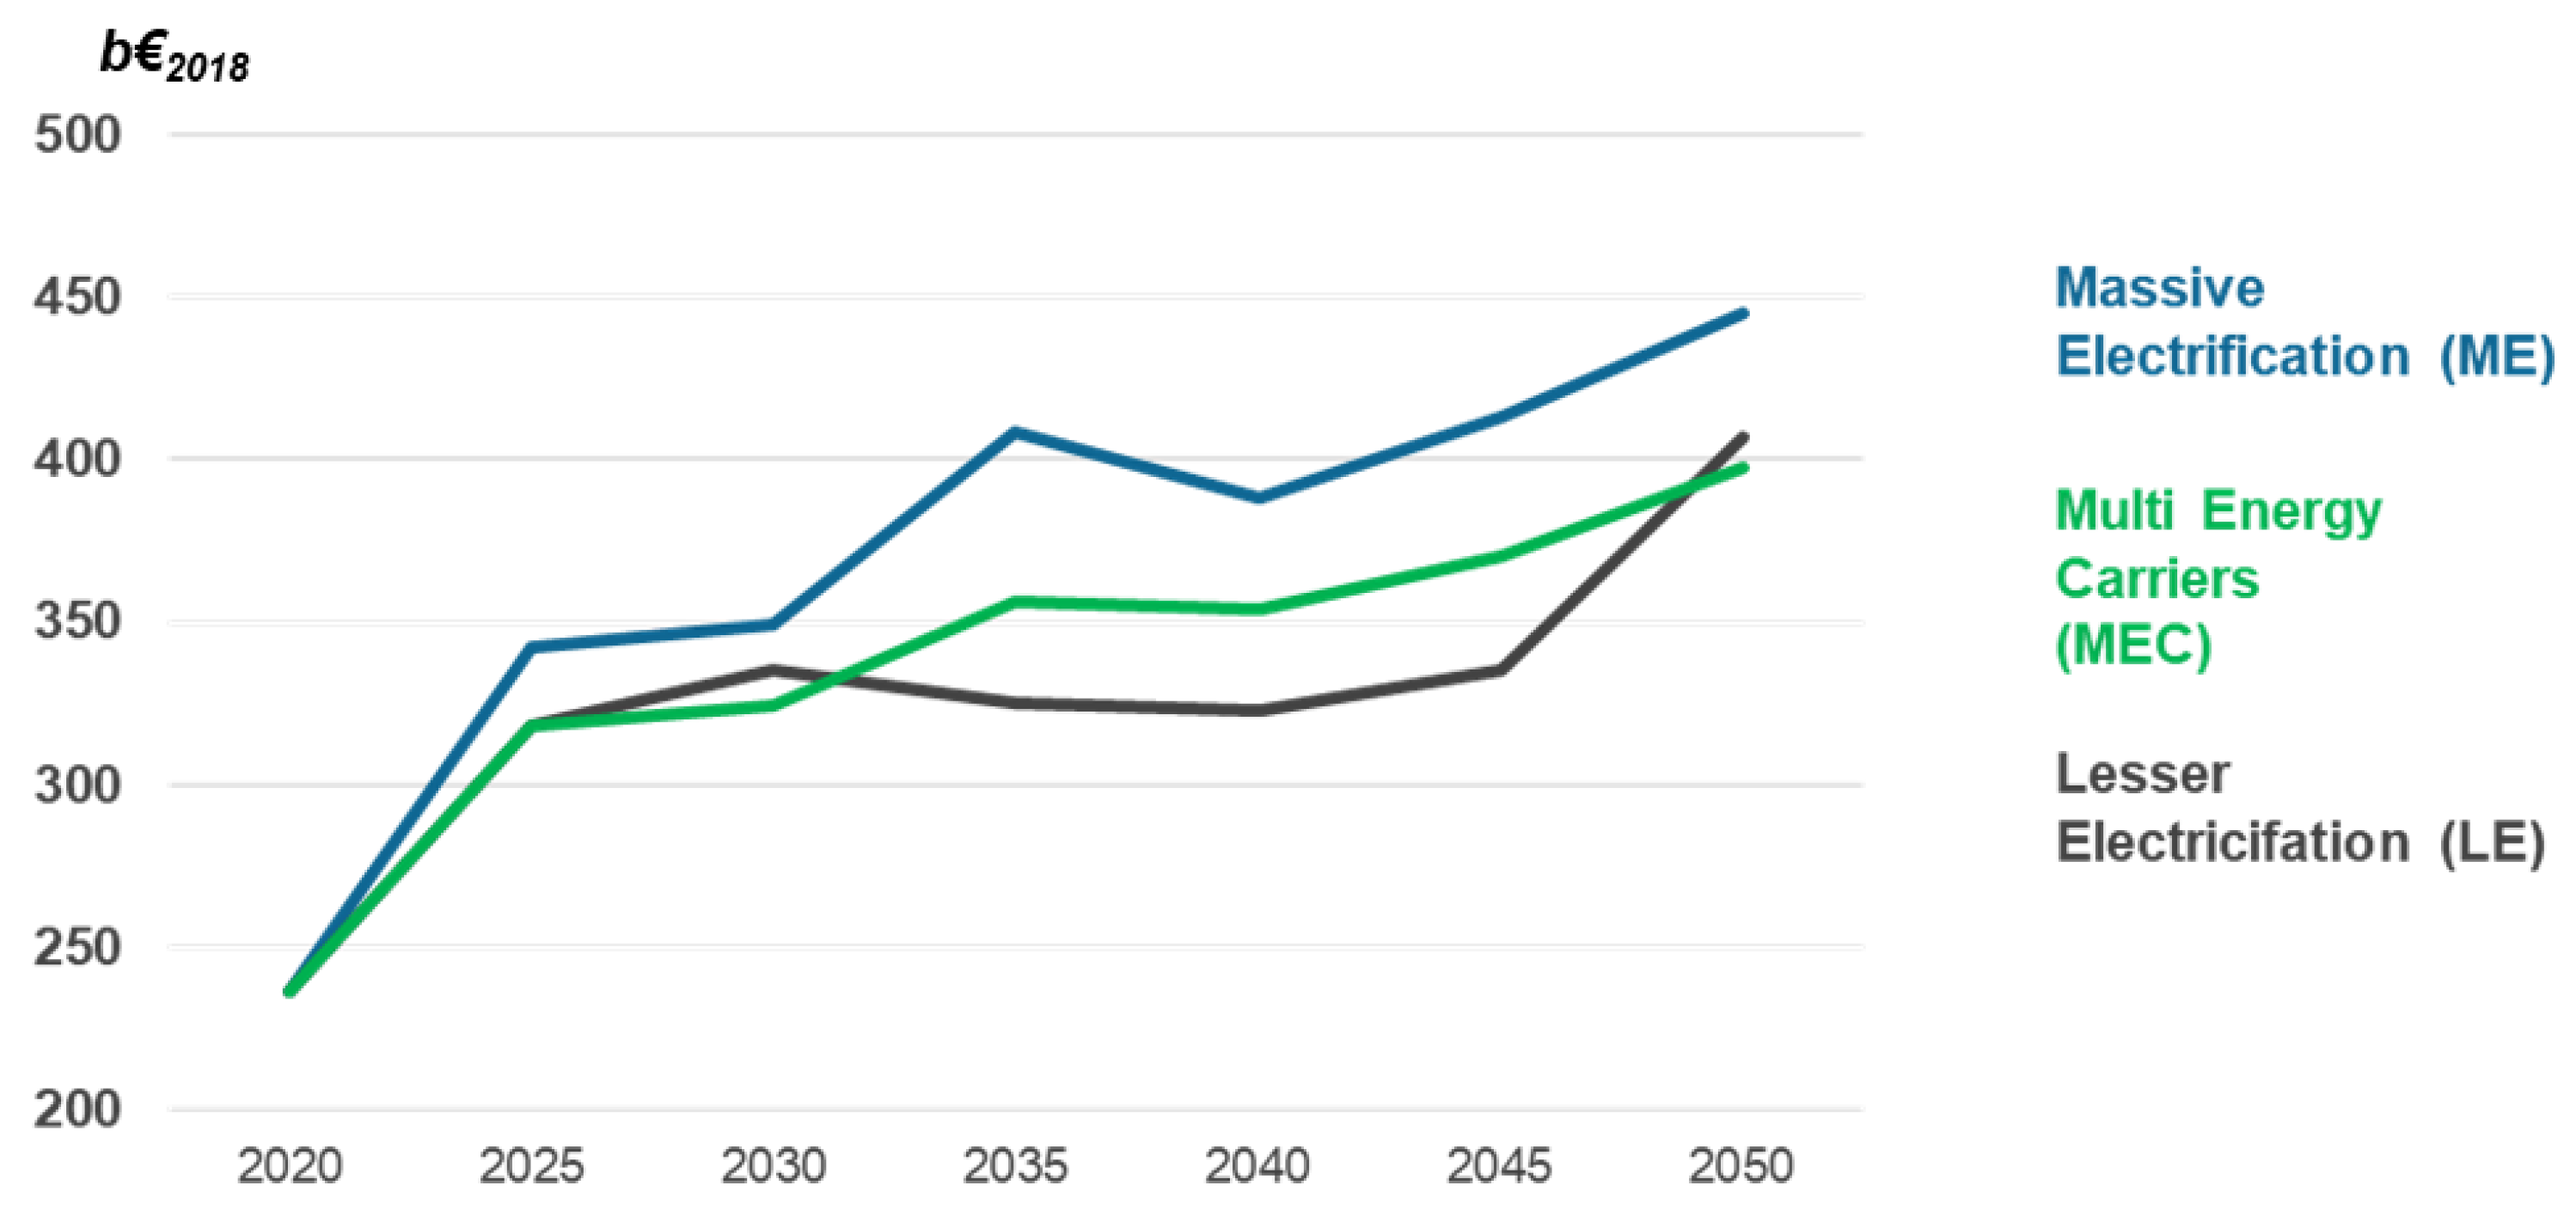
The multi-energy carrier (MEC) is the most resilient policy in terms of transition costs. Massive electrification (ME) is the most expensive scenario, both in terms of net present value (NPV) over the horizon and decarbonization cost in 2050. Electricity expenditures experience both a volume and a price effect as electrification leads to increasing needs for firm capacity (notably in winter to cover episodes with low wind production). Lesser electrification (LE) is slightly less expensive in terms of net present value but is at risk of a higher final cost due to the uncertainty of green gas import price in case of high adoption of this scenario by the market (for instance, in reaction to the high upfront capital costs of ME). NPV gains in LE are only driven by the lower infrastructure and heating technology costs. These considerations are summarized in
Figure 4, which reports the trajectory of energy system costs measured in annualized values.
6. Generalization: Expanding the Scope of Policies
Energy outlooks are generally based on scenarios that represent different, often contrasted, futures. Their number can be arbitrary but is usually small. This study was limited to three scenarios that were related to a central policy by one parameter that described different mixes of electricity and green gas. The objective was to explore the neighborhood of the ME policy to select a mix of electricity and green gas that improved it. The approach can be extended to include a larger set of policy differentiations. This requires that those policies can be represented by targets that become part of the model; this is generally not difficult with LP formulations. Assuming that this model contains the relevant technology space and an accurate representation of intermittent sources (meant to be achieved with hourly granularity), the methodology can be extended to explore a much wider set of policies represented by quantitative targets. The model can then be solved in terms of asset composition, marginal costs, and other criteria. Various experiments were conducted on the basis of this idea, with special attention paid to more detailed policy objectives such as penetration of hybrid heat pumps (heat pump and gas boiler) in residential and/or tertiary heating, market share of hydrogen and synthetic gas targets in heavy duty transport, and, more specifically, hydrogen and synthetic gas targets in power, decarbonization in large energy industries, or carbon capture and storage. The approach leads to the progressive construction of more complex policies that refine the analysis. This could be seen as an application of the well-known principle of depth first search, where policies are elaborated as analysis proceeds. A relevant question is how this search should be guided.
The treatment of variational scenarios is based on the insertion of quantitative target policies in a single energy model formulated as an LP. These targets destroy the interpretation of the model in terms of perfect competition, but this is not different from policies in the real world that also modify the operation of the market. The interpretation of the dual variables as marginal cost of the policies remains intact. Recalling that energy is priced by dual variables in all existing EU and U.S. restructured electricity markets, dual variables are clearly a useful signal that, even though not frequently used in scenario analysis, should not be neglected. In this particular context, high dual variables provide a scarcity signal and hence stresses in the market that might make policies difficult to implement and thereby suggest searching for another target mix.
Another question is whether it is possible to decipher the implicit costs of policies measured through dual variables of target constraints and derive information on effective market instruments (taxes, subsidies, quotas, etc.) to achieve the targets. Converting the identification of a policy expressed as a constraint and its implicit cost to the instruments that makes it possible to achieve is a difficult problem. Murphy et al. [
35] discussed how to solve the reverse problem (computing the Impact of a mix of instruments) through a complementarity problem formulation. Complementarity models extend LP formulations and are now common in energy modeling (see, e.g., Murphy et al. [
34], a tutorial emphasizing the advantages of the complementarity formulation compared to the optimization model). The method described in [
35] has been extensively applied in looking at various aspects of the highly regulated domestic energy prices in Saudi Arabia. The problem can be stated at different degrees of generality. Specifically, a sector or a particular industry can be submitted to different regulations. Transitioning from policy to instrument is a reverse problem of the one treated by Murphy et al. [
36] and this has not yet been studied.
A variant of the above question is completing the model discussed so far by introducing tentative representations of effective policies to directly formulate the model with both targets and some policies intended to contribute to meeting them. Durrmeyer and Samano [
37], who compared two effective policies in the automobile sector, provided the inspiration for doing so. The authors formulated the policies through small equilibrium models that included the representation of the economic agents’ reaction to the complex policies. The solution of these equilibrium models takes the form of a set of equations and/or complementarity inequalities, similar to what is found in complementarity models. Except for global policy constraints to which market (like CO
2) or additive taxes (like excise taxes) can be associated, introducing these relationships would not be possible with an optimization problem. However, it is, in principle, feasible to introduce them in the complementarity form of the optimization model. A discussion of this question was beyond the scope of this study.
7. Conclusions
Electricity is central to the energy transition; this is particularly true in the context of a 100% renewable policy that aims at full decarbonization at the European level. The question is to assess the content of that statement. Wind and solar are the dominant technologies in this context but biomass can play some role and offer operational advantages in terms of storability and load following. The analysis was conducted through a variational scenario approach that examined a neighborhood of an electricity-intensive policy defined as a combination of electricity and biomass and green gas. The approach differed from the usual studies conducted on a discrete set of contrasted scenarios, which aim to identify promising technological paths. The objective was to explore a variety of options offered by a given technological path to identify a promising variant. Starting from an almost pure 100% intermittent renewable electrification policy inspired by an existing national policy, one considers a partial substitution of intermittent renewable sources by green gas and biomass that remain in a realistic domain in terms of crops surfaces and green gas imports. These scenarios retained the 100% renewable target but varied in a range of electrification objectives. They also relied upon the same assumptions on the other carbon mitigation options (i.e., energy demand reductions, decarbonization trajectory, biomass resources, and potential of carbon dioxide removal). Suggestions for improvements were found: a mixed strategy (MEC) of electricity and biomass/green gas reduces costs, offers more flexibility in terms of investment, and is more robust with respect to uncertainty. Finally, given the controversies on the technical feasibility of a 100% intermittent policy, the strategy improves the operability of the system due to the storage possibilities offered by biomass and green gas. The analysis also illustrated the relevance of some comments on the possible difficulty of financing certain plants given their low number of operating hours and how the mixed strategy mitigates these difficulties. Questions on how to fit zero marginal cost renewable plants in the current market design remain. The analysis can be summarized as demonstrating the tradeoff between the availably of biomass and green gas and the need to produce hydrogen.
The paper only explores a unidimensional variety of policies (replacing electrification by green gas), which was based on the inclusion of a parameterized representation of the policy in the LP model. The approach can be extended to a more elaborate mix of policies. Because these induce more complex asset structures, the results will be more robust to uncertainty than those obtained from less diversified technological paths. Because targets are explicitly introduced in the model, their incremental cost can also be directly observed, enabling the search for an effective portfolio of technological paths centered on a reference strategy. More demanding extensions were also briefly discussed.


