Article

Multi-Stage Transmission Network Planning Considering Transmission Congestion in the Power Market

1
School of Electrical Engineering, Zhejiang University, Hangzhou 310027, China
2
School of Electrical Engineering, Shandong University, Jinan 250002, China
3
State Grid Zhejiang Economic Research Institute, Hangzhou 310016, China
*
Author to whom correspondence should be addressed.
Energies 2020, 13(18), 4910; https://doi.org/10.3390/en13184910
Submission received: 2 August 2020 / Revised: 12 September 2020 / Accepted: 14 September 2020 / Published: 18 September 2020
(This article belongs to the Section F: Electrical Engineering)

Abstract

:
The uncertainty of generation and load increases in the transmission network in the power market. Considering the transmission congestion risk caused by various uncertainties of the transmission network, the optimal operation strategies of the transmission network under various operational scenarios are decided, aiming for the maximum of social benefit for the evaluation of the degree of scenario congestion. Then, a screening method for major congestion scenario is proposed based on the shadow price theory. With the goal of maximizing the difference between the social benefits and the investment and maintenance costs of transmission lines under major congestion scenarios, a multi-stage transmission network planning model based on major congestion scenarios is proposed to determine the configuration of transmission lines in each planning stage. In this paper, the multi-stage transmission network planning is a mixed integer linear programming problem. The DC power flow model and the commercial optimization software CPLEX are applied to solve the problem to obtain the planning scheme. The improved six-node Garver power system and the simplified 25-node power system of Zhejiang Province, China are used to verify the effectiveness of the proposed multi-stage planning model.

1. Introduction

Nowadays, China’s power market system is in the accelerating progress of changing from monopoly and regulation to competition [1,2]. The processes of generation, transmission, distribution, and sales in the power market are separated, and the behaviors of multiple participants are becoming more independent and complex [3,4,5]. At the same time, with the energy structure transition and the development of a smart grid in China [6,7], the uncertainty of a transmission network further increases, which generates many new operational scenarios [8,9,10]. When the transmission capacity of the network is insufficient, the power flow through the transmission line is limited due to the physical constraints of a secure and stable operation, and the transmission congestion then takes place [11,12]. Users in transmission congestion areas have to buy more expensive electricity, which makes the locational marginal price (LMP) higher than the system marginal generation cost and increases the operation cost of transmission network. The transmission congestion limits the role of transmission network in optimizing the allocation of network resources and improving the energy efficiency in the power market [13]. It is necessary to study the transmission network planning problem considering transmission congestion in the power market.
In recent years, research work has been carried out on transmission network planning of the power market. In the power market, the power price is quoted by generators and users according to their generation costs and consumption benefits, which forms correct price signals and guides the optimal allocation of network resources [14,15]. Based on the game theory [16,17], the transmission network planning method considering the behavior of generators and the planning decision of the transmission network is studied. In [18,19], a transmission network expansion planning model and a coordinated generation and transmission planning model are established, considering the maximum of social welfare and generators’ benefit. In [20], considering the influence of short-term bidding strategies and long-term network expansion planning of generators, a four-level planning model of generation bidding, market settlement, generation planning, and network planning of the power market is proposed. The transmission network planning method based on game theory reflects the behavior strategy of generators in the power market and balances the interests of the multiple market participants [21]. However, the research work above does not consider the impact of generators’ market power on the transmission network. When the transmission capacity of transmission network is limited, generators can artificially create transmission congestion to increase revenue, which leads to the rise of electricity price and the failure of electricity effective distribution [22]. In the power market, the LMP is used to measure the value of electric energy at different positions in the power system under various operation scenarios and reflect the severity of transmission congestion [23,24,25]. In [26], a novel evaluation method for operation efficiency of the transmission network is proposed based on LMP. A security-constrained unit commitment model considering the impact of mobility of battery-based energy storage transportation system is proposed in [27] to reduce the overall cost of power delivery by transporting the electricity from low LMP areas to high LMP areas. A two-stage algorithm is proposed in [28] to analyze the effect of carbon emission quota allocation on the LMP of day-ahead electricity markets. In [29], a novel electricity market-clearing mechanism based on locational marginal prices is proposed considering the uncertainties of generation and load. The above studies indicate the guiding role of LMP in congestion management from the perspective of network operation and power market. However, the role of LMP in guiding transmission network planning and evaluating the corresponding benefit in alleviating transmission congestion under various operation scenarios is not exerted fully and needs further research.
In the power market, the transmission congestion risks should be mitigated through transmission network planning [30,31]. In [32], the transmission cost allocation is considered for the proposed tri-level transmission network planning model, which effectively defers the expansion planning and reduces the investment cost. In [33], the transmission network is co-optimized with the merchant electrochemical storage in the market environment, which helps to present the interaction between the transmission network expansion planning and the storage configuration. In [34], a multi-objective transmission network planning model is established with minimum investment, congestion, and risk costs. The transmission network planning based on probabilistic analysis should be studied considering the uncertainties of natural environment, generators, loads, and policies on power generation, transmission, and demand side. In [35], the point estimation method and the Monte Carlo method are jointly applied to describe the uncertainty of intermittent energy and load of the transmission network with high proportion of wind power. Then, a multi-objective transmission network expansion planning model considering the investment cost, risk cost, and congestion cost of the transmission network is established. In [36,37], the stochastic programming theory and scenario analysis method are used to describe the uncertainty of power generation, investment, and load demand of the transmission network on a long-time scale, as well as the uncertainty of distributed generation and load on a short-time scale. Then, the joint planning models of transmission network and energy storage are established. However, the transmission network planning method based on uncertainty theory is time consuming in computation. Only a few types of uncertain risk sources are taken into consideration and their correlations are not involved. The transmission network model based on scenario analysis describes the uncertainties as multiple individual probabilistic scenarios, which reduces the difficulty of solving while considering the coupling of uncertain risks [38]. The uncertainties of renewable generation and load demand are represented by a set of scenarios through rough fuzzy clustering in the flexible transmission network expansion planning of [39]. In [40], the scenario identification index is defined to determine the important scenarios for solving the stochastic transmission expansion planning problem with N-1 contingency analysis. In [41], the concept of an extreme scenario of wind power is proposed and a two-stage transmission network planning model based on Benders decomposition is then established. In [42], a scenario-based transmission expansion planning model is established considering the massive scenarios based on the proposed cost-oriented dynamic scenario clustering method. However, the current researches do not consider the transmission congestion scenarios caused by multiple uncertainties from power market. Thus, it is necessary to carry out the network planning considering transmission congestion scenarios to improve the economy of the transmission network planning scheme in the power market.
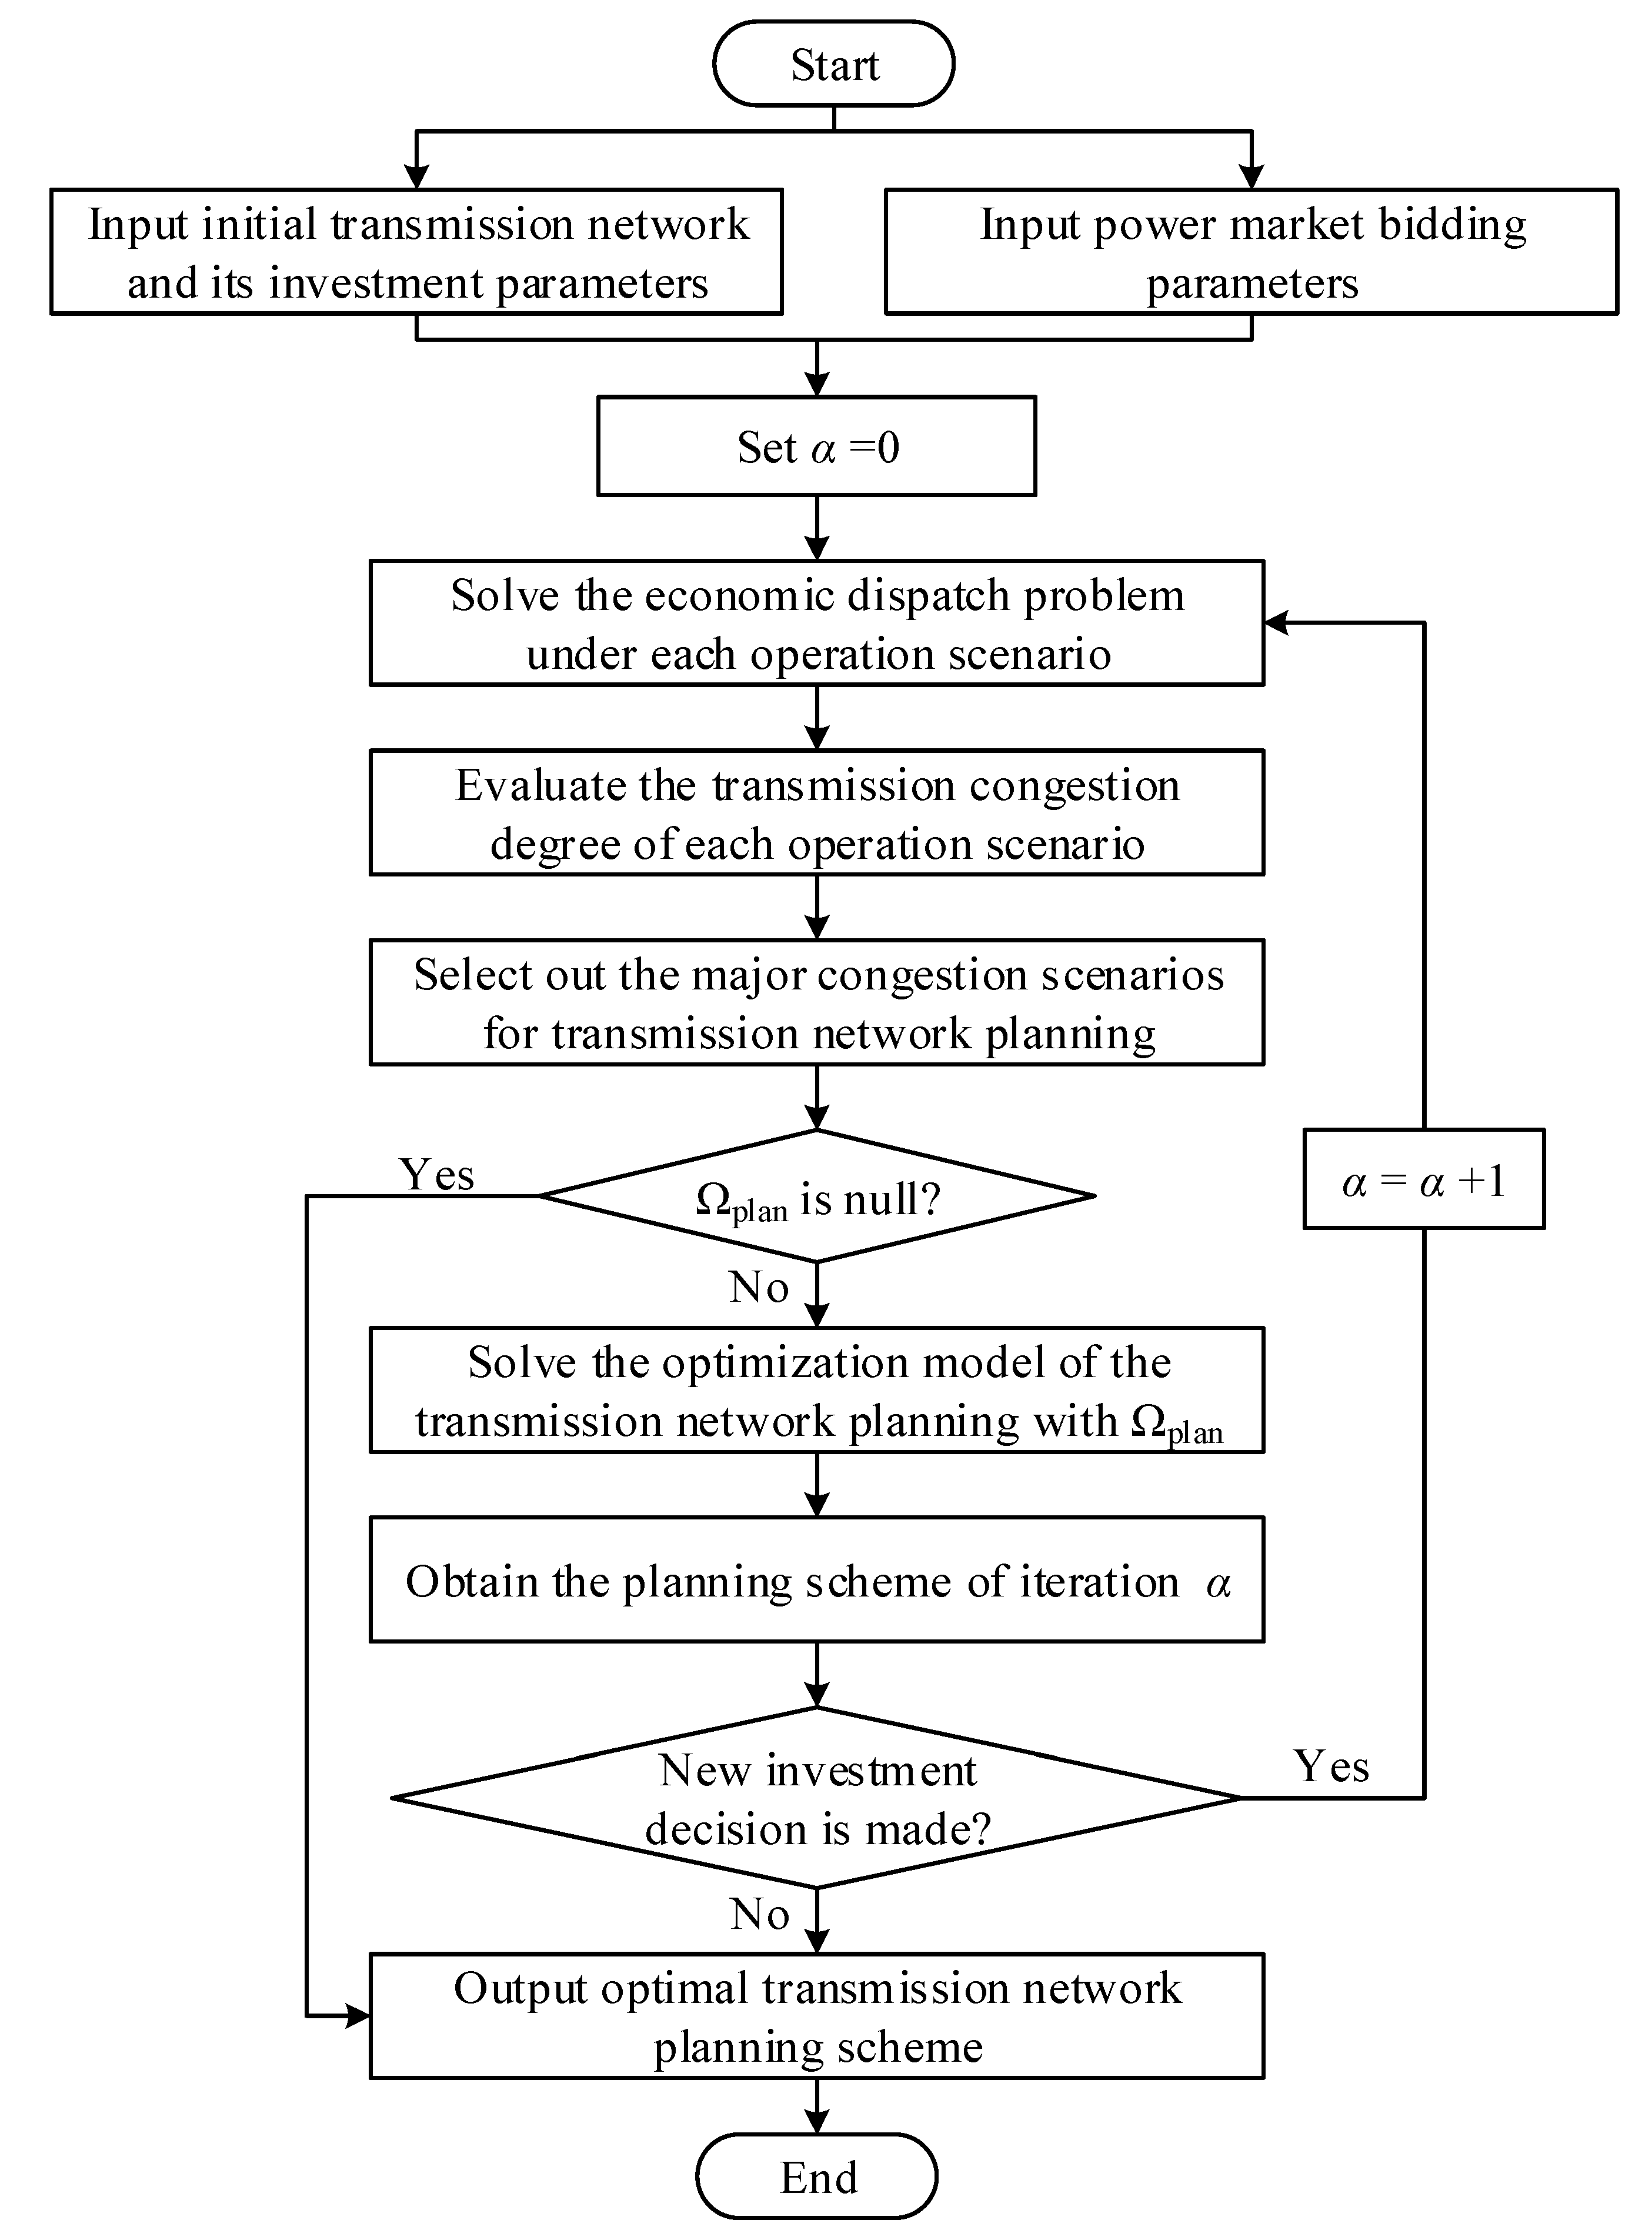
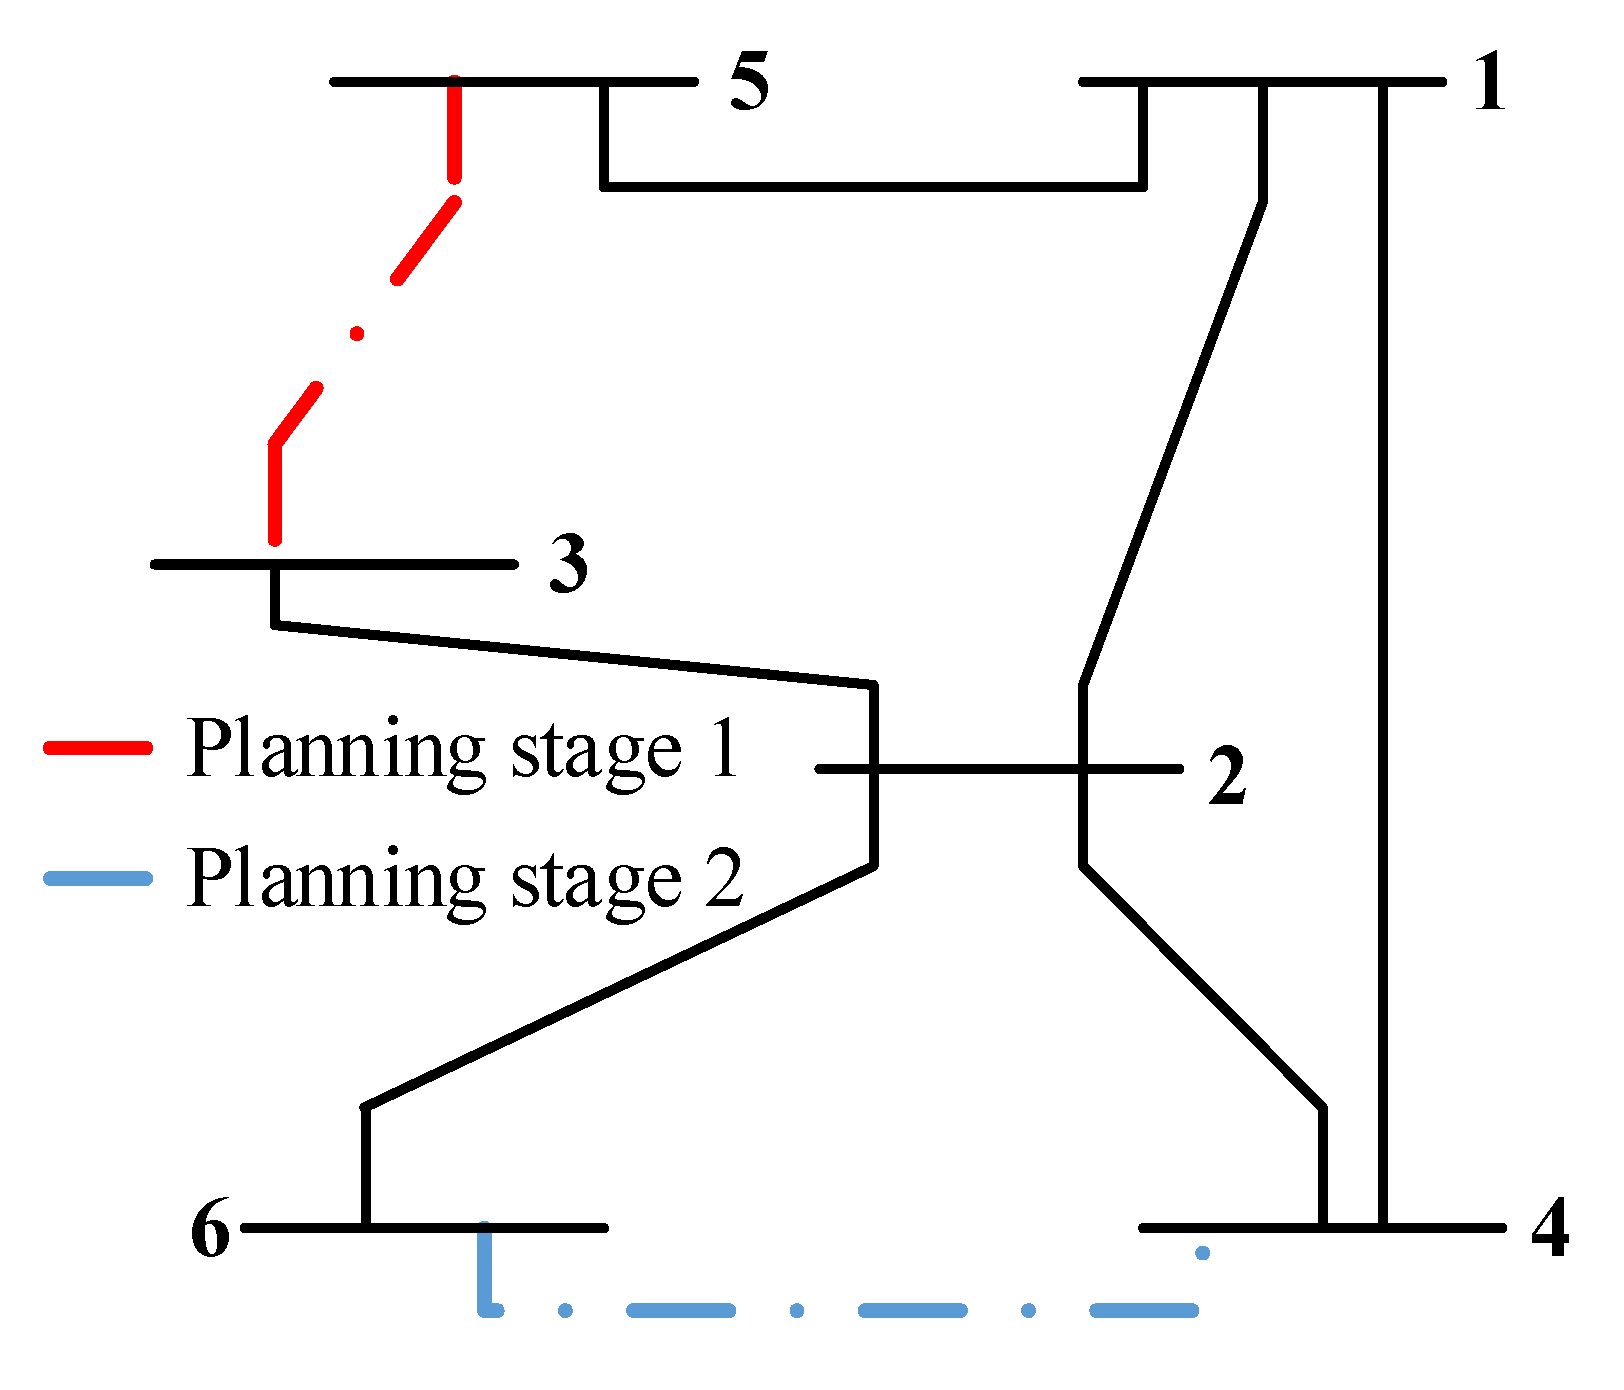
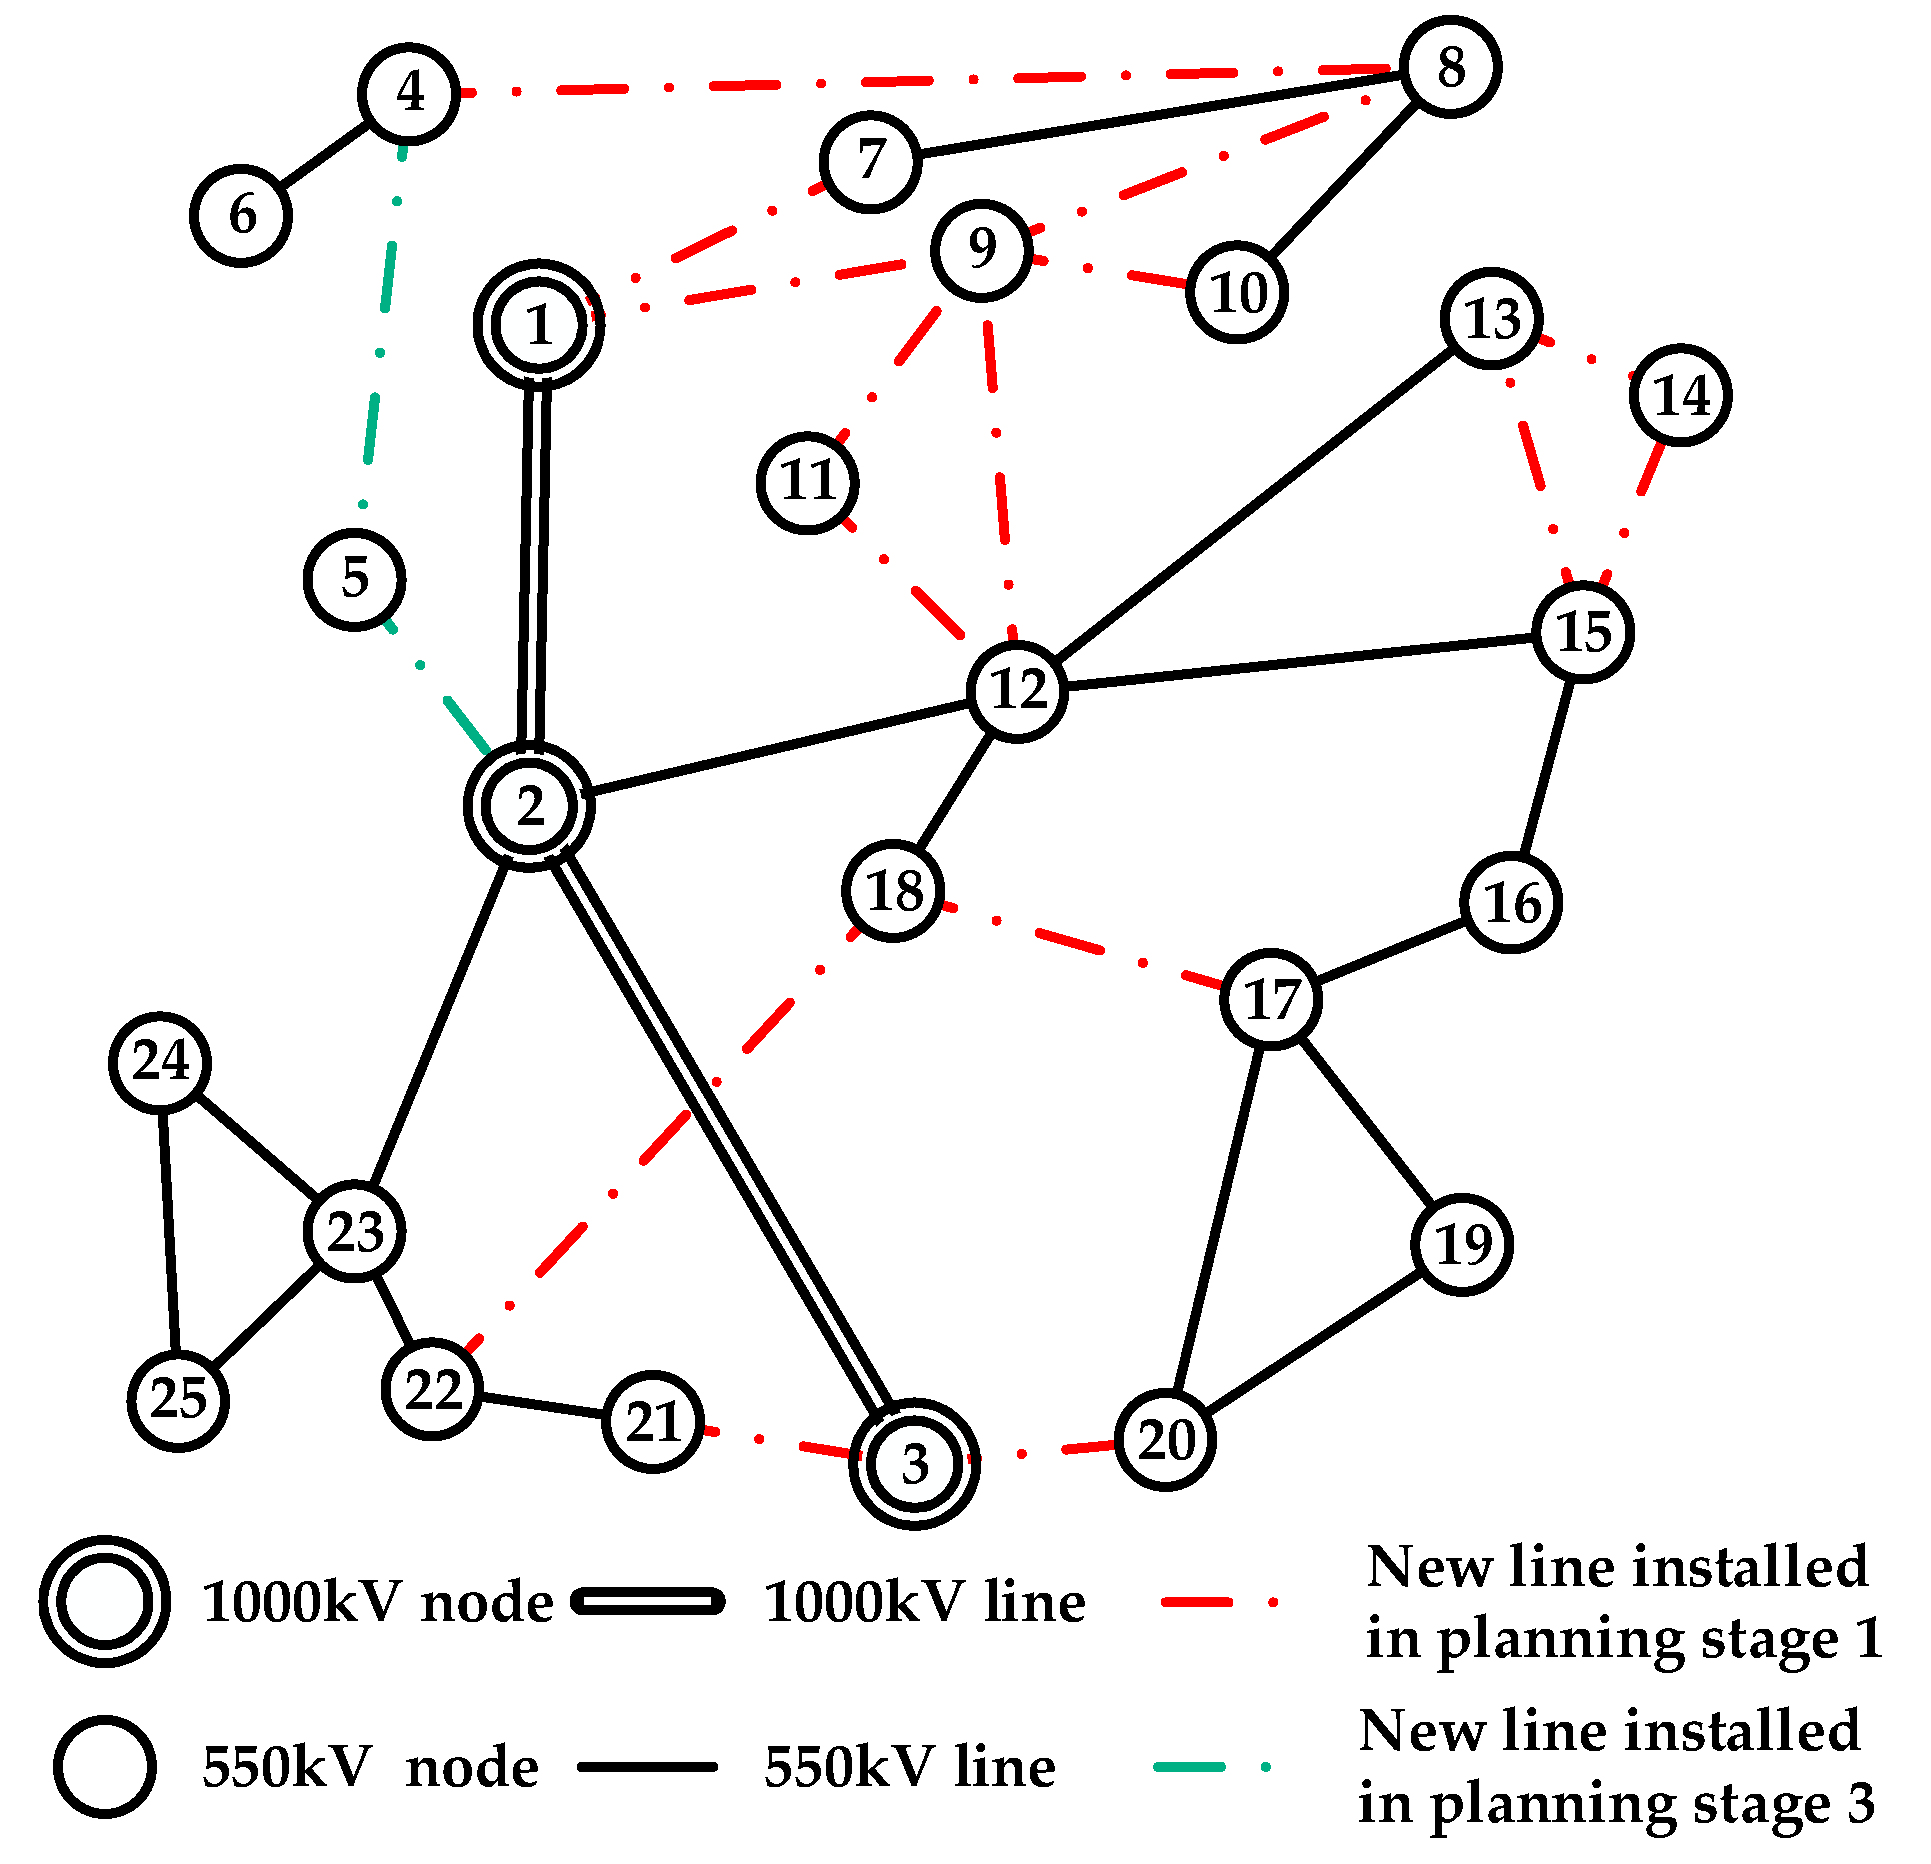
Aiming at the above problems, a multi-stage transmission network planning method considering transmission congestion in the power market is presented in this paper. With the goal of maximizing social benefit, the optimal dispatch problem under each operation scenario is simulated and solved. Based on the shadow price theory, a novel screening method for major congestion scenarios is proposed to provide planning scenarios for the transmission network planning. A multi-stage planning model for a transmission network considering transmission congestion is established, with the maximum difference between the social benefits and the investment and maintenance costs of transmission line under severe congestion scenarios. The proposed model based on DC power flow is a mixed integer linear programming problem, which is solved by the commercial optimization software CPLEX. The validity of the proposed model is verified through the case study based on the improved six-node Garver power system and simplified 25-node power system of Zhejiang Province, China.

2. Transmission Congestion Scenario Screening Based on Shadow Price Theory

The location and severity of transmission congestion are related to the operational scenarios in the transmission network. It is necessary to focus on the operational problems under transmission congestion scenarios in the planning decision-making process to improve the efficiency and economic benefit of planning. With the development of the power market, the operational scenarios of the power system tend to be diversified and complicated, which brings great challenges to the search for major congestion scenarios with planning value. In this section, the optimal operation of transmission network in the power market is discussed with the goal of the maximization of social benefit. In transmission network operation and planning, the DC power flow model is used to obtain the LMP within the acceptable range, assuming that the voltage variance and line losses are neglected [22,43]. Considering the node power balance constraint, power flow constraint, line capacity constraint, generator output constraint, and power loss constraint, the active power of generators and users’ load under various transmission network scenarios are decided to decompose the LMP. Based on the shadow price theory, the index for transmission congestion degree evaluation and the screening method of major congestion scenario are proposed.

2.1. Economic Dispatching Model of Transmission Network in the Power Market

To realize the economic allocation of electricity energy considering the interests of generators and users in the power market, the economic dispatching model of the transmission network aims at maximizing the social benefit Csb. The objective function includes the generation cost of generator and users’ benefit, which is expressed as:
max C s b = i Ω n o d e P i l o a d c i l o a d i Ω n o d e g Ω i g e n P i , g g e n c i , g g e n .
The constraints of the transmission network economic dispatching model are presented as follows:
  • Node power balance constraint
    g Ω i g e n P i , g g e n + i j Ω i l i n e P i j l i n e = P i d .
  • Power flow constraint
    P i j l i n e = k L i j P i j , k l i n e = k L i j n i j , k B i j , k ( θ i θ j ) .
  • Line capacity constraint
    n i j , k S i j , k max P i j , k l i n e n i j , k S i j , k max .
  • Generator power constraint
    P i , g g e n , min P i , g g e n P i , g g e n , max .
  • Phase angle constraint of equilibrium node
    θref = 0.
  • Power losses constraint
    ( 1 ε i E N S ) P i d P i l o a d P i d .

2.2. LMP Decomposition Based on Shadow Price Theory

The LMP in the transmission network is defined as the marginal cost or revenue when the unit load demand of the node changes [44]. In the power market, LMP can provide price signals for market participants, realize fair trade, help transmission companies to solve transmission congestion problems, and guide transmission network planning [45]. When solving the optimal power flow economic dispatching problem of the transmission network, the extended Lagrangian function is constructed to calculate the Lagrangian multiplier of each constraint, which represents the shadow price of the network resources (i.e., lines and generators) associated with the constraint [46,47]. The expression of the extended Lagrangian function is expressed as follows:
L = i Ω n o d e P i l o a d c l o a d ( P i l o a d ) i Ω n o d e g Ω i g e n P i , g g e n c g e n ( P i , g g e n ) + i Ω n o d e λ i ( g Ω g e n , i P i , g g e n P i d ) + i Ω n o d e k L i j μ i j ( P i j l i n e k L i j n i j , k B i j , k ( θ i θ j ) ) + i Ω n o d e k L i j ν i j , k ¯ ( P i j , k l i n e n i j , k S i j , k max ) + i Ω n o d e k L i j ν i j , k _ ( n i j , k S i j , k max P i j , k l i n e ) + i Ω n o d e g Ω g e n , i τ i , g ¯ ( P i , g g e n P i , g g e n , max ) + i Ω n o d e g Ω g e n , i τ i , g _ ( P i , g g e n , min P i , g g e n ) + π θ r e f + i Ω n o d e ω i ¯ ( P i l o a d P i d ) + i Ω n o d e ω i _ [ ( 1 ε i E N S ) P i d P i l o a d ]
The partial derivatives of the extended Lagrange function for each node is expressed as follows:
L P i l o a d = c l o a d ( P i l o a d ) + P i l o a d c l o a d ( P i l o a d ) P i l o a d λ i + k L i j μ i j P i j l i n e P i l o a d + k L i j ( ν i j , k ¯ ν i j , k _ ) P i j , k l i n e P i l o a d + ω i ¯ ω i _ .
Based on the Karush-Kuhn-Tucker (KKT) optimality condition [48,49], the LMP of node i is expressed as:
L M P i l o a d = c l o a d ( P i l o a d ) + P i l o a d c l o a d ( P i l o a d ) P i l o a d = λ i k L i j μ i j P i j l i n e P i l o a d k L i j ( ν i j , k ¯ ν i j , k _ ) P i j , k l i n e P i l o a d ω i ¯ + ω i _
It can be seen that the LMP at load node includes the electric price at the reference node, Lagrange multipliers of the line congestion constraint, and the power losses constraint. The Lagrange multiplier represents the increment of the objective function Csb when the kth circuit of transmission corridor ij expands unit capacity. When the capacity of transmission lines is insufficient and the power flow exceeds the maximum limit, the Lagrange multipliers ν i j , k ¯ and ν i j , k _ are not all zero. The larger ν i j , k ¯ or ν i j , k _ is, the more serious the transmission congestion problem is, and the better the effect of line expansion is on alleviating transmission congestion.
The partial derivatives of the extended Lagrange function for each generator is expressed as follows:
L P i , g g e n = c g e n ( P i , g g e n ) P i , g g e n c g e n ( P i , g g e n ) P i , g g e n + λ i + k L i j μ i j P i j l i n e P i , g g e n + k L i j ( ν i j , k ¯ ν i j , k _ ) P i j , k l i n e P i , g g e n + g Ω g e n , i ( τ i , g ¯ τ i , g _ ) .
Therefore, the LMP of generator g connected with node i, including the reference node price, the line congestion constraint shadow price and the generator output constraint shadow price, is expressed as:
L M P i , g g e n = c g e n ( P i , g g e n ) + P i , g g e n c g e n ( P i , g g e n ) P i , g g e n = λ i + k L i j μ i j P i j l i n e P i , g g e n + k L i j ( ν i j , k ¯ ν i j , k _ ) P i j , k l i n e P i , g g e n + g Ω g e n , i ( τ i , g ¯ τ i , g _ )
The shadow prices of network resources in the economic dispatch problem of the transmission network are related to the Lagrange multipliers of constraints in the optimal power flow model, the marginal cost of generation, the marginal benefit of electricity consumption, and the flow transferring relativity factor. By decomposing the LMP at each node, the value of network resources is effectively evaluated to guide the planning and use of power network resources in the power market.

2.3. Screening of Transmission Network Congestion Scenarios

Since the new electric power restructuring, the trading volume of electricity within and across provinces in China continues to increase. The influence of the power market on the planning and operation of transmission network is expanding day by day. In addition to the traditional risk sources in the transmission network such as the integration of renewable energy, load fluctuation, and equipment failure [
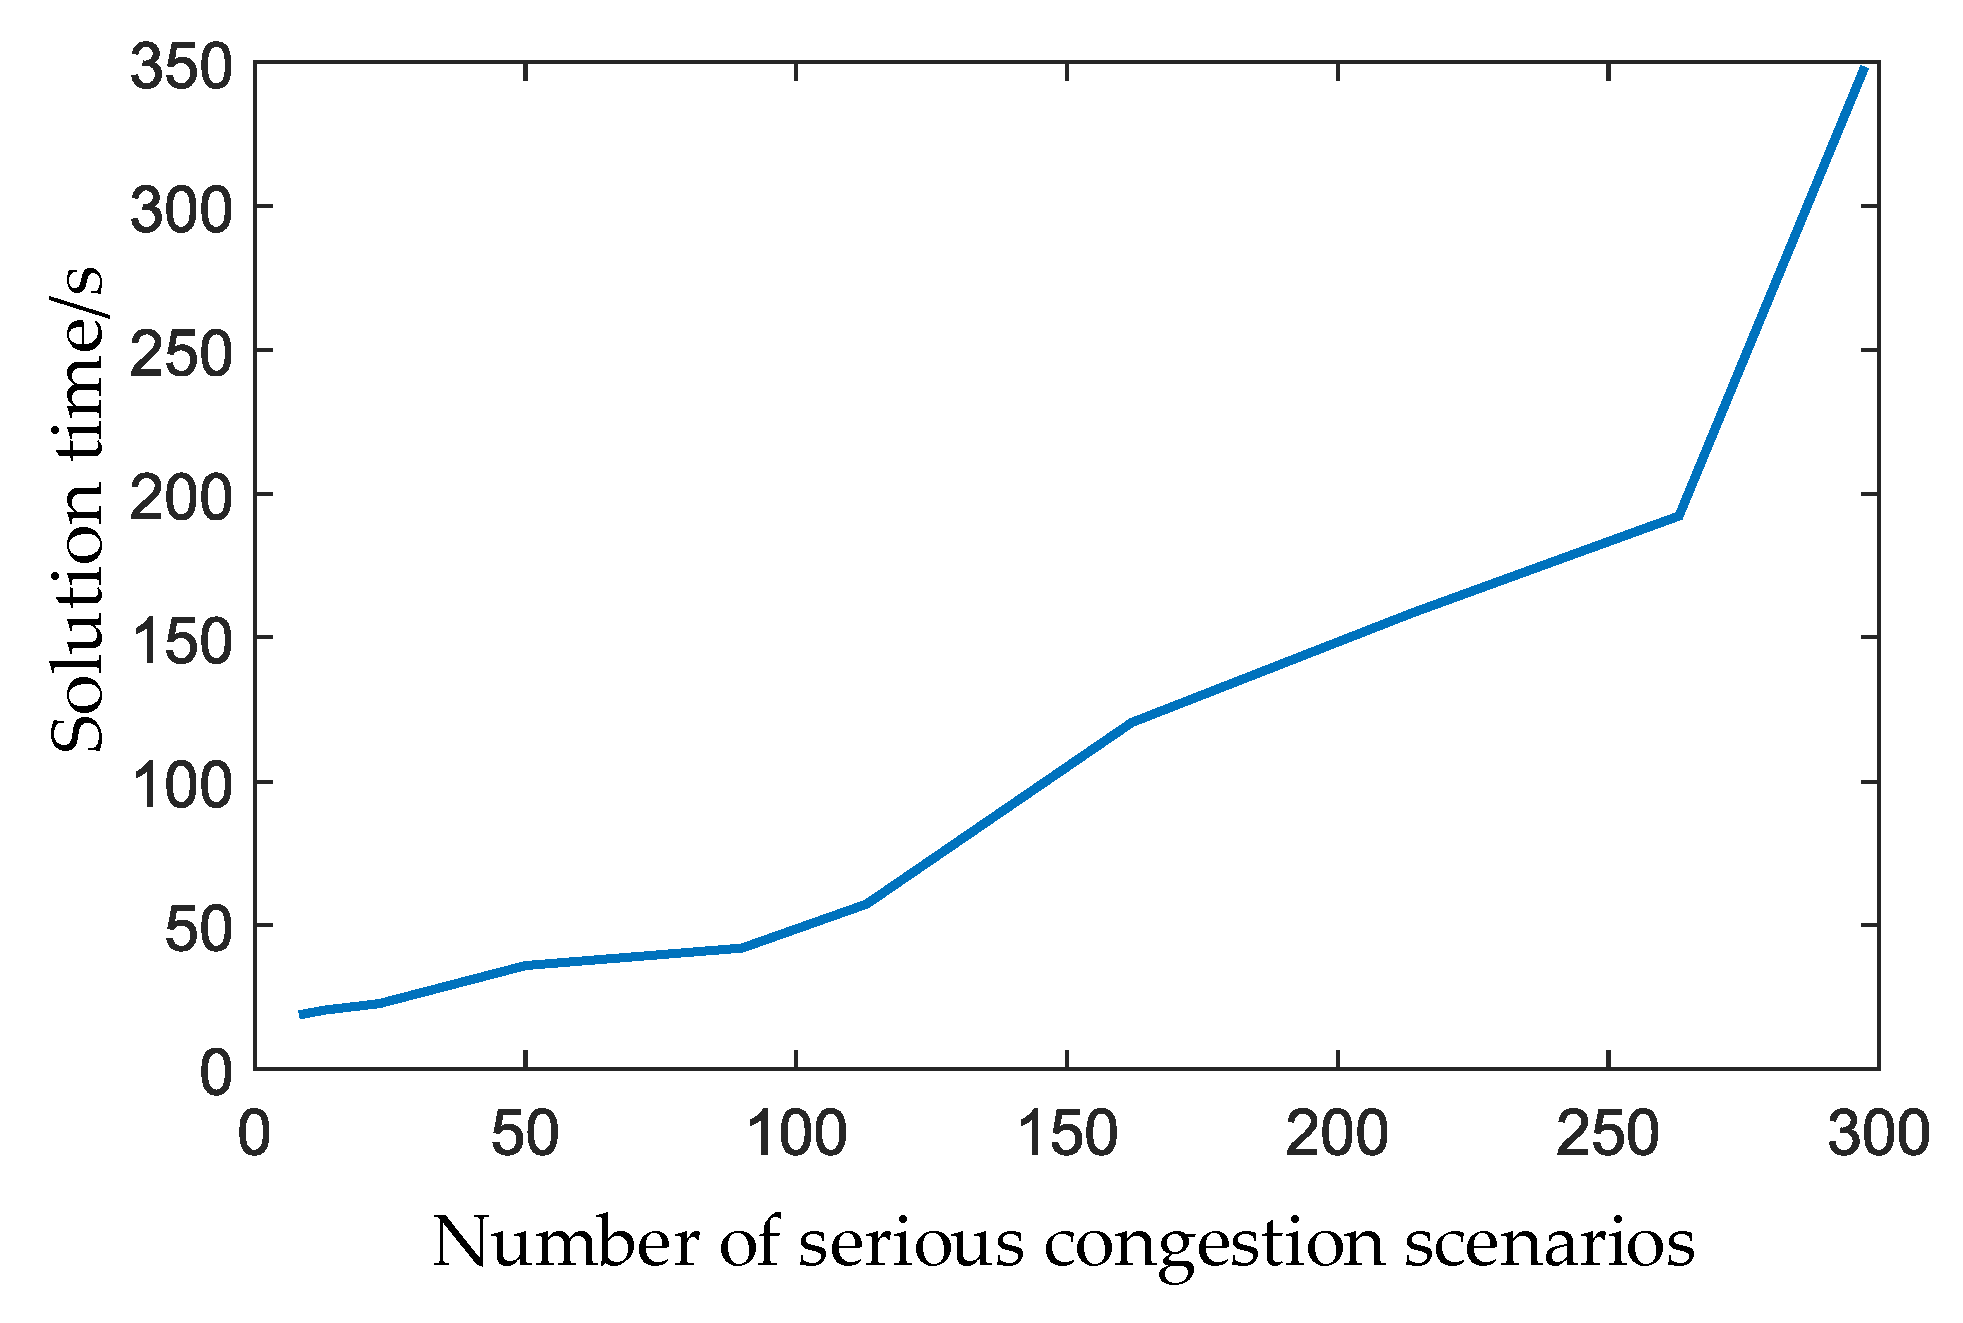
50], new risk sources from the power market such as plant-grid separation, electricity price fluctuation, and direct transaction between generators and users increase the risk degree of the transmission network congestion and the difficulty for transmission companies to coordinate generation and network resources. Generating as many transmission network operation scenarios as possible based on scenario analysis methods and taking them into consideration in planning decision help to fully simulate various potential congestion risks of transmission network, which ensures the economy of the planning scheme. However, the more scenarios there are, the more variables and constraints will be in the planning model, which most likely leads to the dimension disaster and reduces the solving efficiency. Scenarios such as the maximum load, high probability, and failure scenarios are set artificially in the existing transmission network planning method, which cannot objectively evaluate the severity of the congestion problem under various operation scenarios, leading to the neglect of potential congestion scenarios.
Under the transmission congestion scenario, there is a price difference between the two ends of the transmission line, which results in transmission congestion surplus. The transmission congestion surplus is related to the shadow prices (i.e., Lagrange multipliers) μi, ν i j , k ¯ and ν i j , k _ in the optimal power flow model, and the flow transferring relativity factor H i j = P i j l i n e P i g e n = P i j l i n e P i l o a d . Assuming that the network frame is determined, the μi, ν i j , k ¯ and ν i j , k _ can be used to reflect the severity of the transmission congestion. Therefore, an evaluation index for transmission congestion degree is proposed based on the shadow price. Further, a novel screening method for major congestion scenario is proposed to guide transmission network planning considering transmission congestion.
η s = p s φ s = p s i Ω n o d e i j Ω l i n e , i k L i j ( μ s , i j + ν s , i j , k ¯ + ν s , i j , k _ ) .
The proposed transmission congestion degree of scenario comprehensively considers the two dimensions (i.e., probability and impact) of the risk. It objectively describes the transmission congestion risk of the scenario and reflects the influence of the operation scenario on the network planning. The scenario with sufficient planning value should be added into the planning scenario set Ωplan, which is expressed as:
Ω p l a n = { s * | η s * η 0 } .
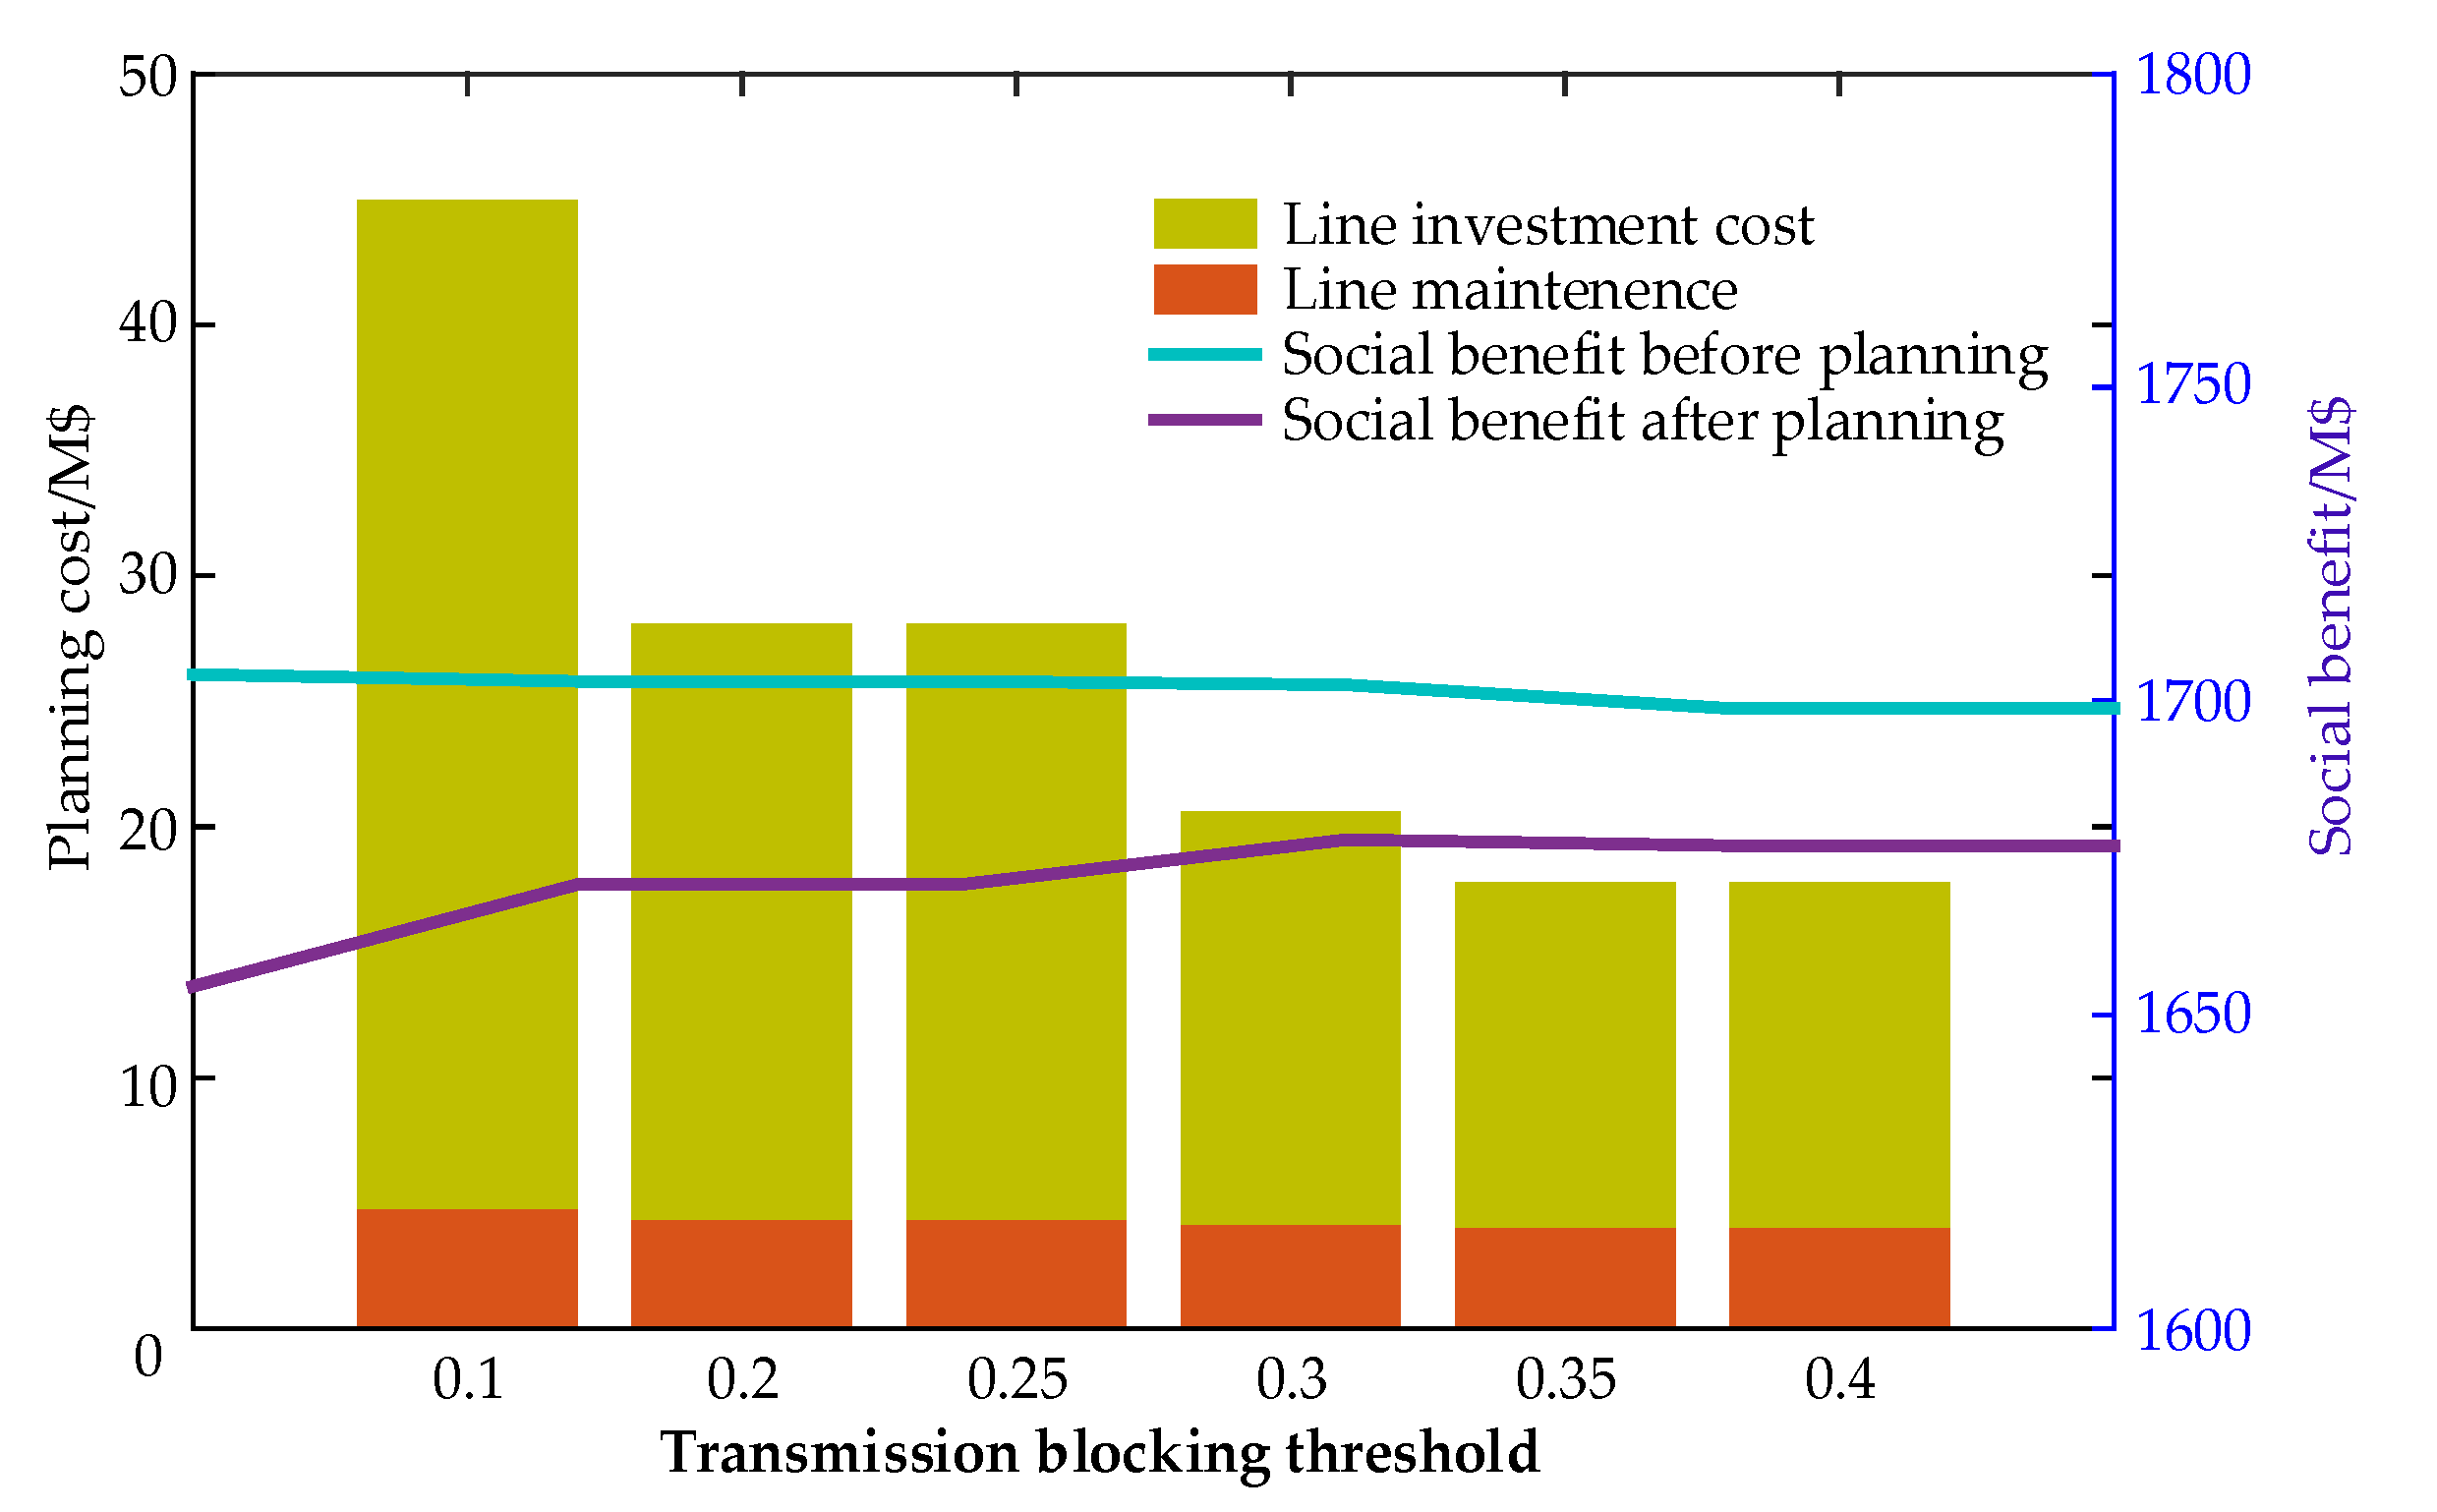
According to (14), the scenario with a transmission congestion degree greater than the transmission congestion threshold η0 is the major congestion scenario and is included into the planning scenario set; otherwise the scenario is the minor congestion scenario and does not need to be considered in the planning problem. The transmission congestion scenario screening provides actual transmission congestion information for the transmission network planning based on the simulation results of transmission network operation, which helps to achieve better planning results.

3. The Network Planning Model Considering Transmission Congestion

In order to improve the ability of transmission network planning model to mitigate the risk of transmission congestion, transmission network planning considering major congestion scenarios is carried out according to the optimized dispatching results of operation scenarios and the screening results of congestion scenarios based on the economic dispatching model. Then, the major congestion scenario is evaluated and screened again based on the current planning scheme. After iterative optimization planning, the optimal multi-stage network frame planning scheme is obtained.

3.1. Multi-stage Planning Model of Transmission Network Considering Major Congestion Scenarios

The transmission network planning model proposed in this paper starts from the point of view of the transmission company, which undertakes social responsibility while deciding the time and circuit number of transmission corridors to be built in the transmission network planning. For multi-stage transmission network planning, the net present value of the total cost in the planning period considers the time benefit, assuming that all cost components occur at the end of each planning stage. The objective function of the planning model includes transmission line investment cost, transmission line maintenance cost and social benefits of the transmission network under major congestion scenario, which is expressed as follows:
max C t o t a l Ω d e c = t = 1 N p l a n [ ζ t ( T h r s Ω p l a n , t p s C s s b C t o m ) σ C t i n v ] = t = 1 N p l a n [ ζ t ( T h r s Ω p l a n , t p s ( i Ω n o d e P s , i l o a d c s , i l o a d i Ω n o d e g Ω i g e n P s , i , g g e n c s , i , g g e n ) i Ω n o d e i j Ω l i n e , i k L i j c i j , k o m n t , i j , k ) , σ i Ω n o d e i j Ω l i n e , i k L i j c i j , k i n v x t , i j , k ] ; Ω d e c = { P s , i l o a d , P s , i , g g e n , n t , i j , k , x t , i j , k }
ζ t = ( 1 + r ) t × T p l a n N p l a n ,
σ = r ( 1 + r ) T l i n e ( 1 + r ) T l i n e 1 .
Constraints of the transmission network planning model are presented as follows:
1.
Constraints on the number of new lines
Each transmission corridor allows the construction of a limited number of transmission lines, i.e.,
0 t = 1 N p l a n k L i j x t , i j , k x i j ¯ .
2.
Timing constraints of transmission line construction
For the kth candidate circuit of transmission corridor ij, once the construction is selected, it cannot be dismantled, i.e.,
n t 1 , i j , k n t , i j , k .
3.
Constraints on the annual cost of transmission network investment
There are budgetary constraints on the investment costs of transmission lines at each planning stage, i.e.,
C t i n v C t bud .
4.
Constraints on the security operation of transmission network
The transmission network planning scheme should satisfy the security operation constraints (2)–(7).

3.2. Iterative Solution Process of Transmission Network Optimization Planning

The iterative solution process of the transmission network planning method proposed in this paper is shown in Figure 1. The initial transmission network and investment parameters and the power market bidding parameters are input into the bi-level collaborative planning as basic data. Before each iteration of transmission network planning, it is necessary to solve the economic dispatch problem under each operation scenario based on the existing network information to evaluate the transmission congestion degree of each operation scenario. Then, the scenarios with high transmission congestion degrees (i.e., major congestion scenarios) are included into the planning scenario set Ωplan and feed back to the upper level. In this way, the process of feedback from the operator to the planner in the actual transmission network planning is simulated, so that the transmission network planning considering the major congestion scenario can be carried out by the upper level. The planning model takes the planning scenario set for optimization. A new generation of the target network frame is obtained for re-evaluating the transmission congestion risk in the next iteration. When no new line investment is made or there is no major congestion scenario with the congestion degree higher than the transmission congestion threshold, the planning model stops the optimization progress and outputs the final transmission network planning scheme. In this paper, the transmission network planning model gives priority to mitigate the operational risk of the major congestion scenario in each generation solution. The planning scenario set changes dynamically with the update of the network configuration scheme, which reflects the change of transmission congestion risk with the transmission line investment. In summary, the proposed model improves the planning efficiency and simulates the interaction between network planning and operation.
The specific iterative solution process of the proposed bi-level collaborative planning model is as follows:
  • Input the initial transmission network and its investment parameters, and the power market bidding parameters.
  • Set the initial value of iteration time α = 0.
  • Solve the economic dispatch problem of transmission network to obtain the optimal economic dispatch scheme under each operation scenario.
  • Evaluate the transmission congestion degree of each operation scenario.
  • Select out the major congestion scenarios for transmission network planning, which composes the planning scenario set Ωplan.
  • If the planning scenario set Ωplan is null, return to step 9; otherwise transmit the planning scenario set Ωplan to the optimization model of transmission network planning.
  • Solve the optimization model of the transmission network planning and obtain the transmission network planning scheme considering major congestion scenarios.
  • If new investment decision is made, set α = α+1 and return to step 2; Otherwise return to step 9.
  • Output the optimal scheme and its benefit of transmission network planning.

4. Case Studies

The following two case studies, i.e., the improved six-node Garver power system and the simplified 25-node power system of Zhejiang Province, China, are employed for verifying the effectiveness of the proposed planning method. It is assumed that the network planning cycle is 15 years, consisting of five planning stages. The load growth rate of each stage is 5%. The capital recovery cycle of the new transmission line is 25 years. The discount rate is assumed to be 8% to calculate the annual cost of transmission line investment in the planning horizon. Moreover, it is assumed that each generating unit quotes according to its marginal cost and the bid of the load demand is based on its actual benefit of electricity. The reactive power compensation equipment is configured at nodes to provide enough reactive power for balance. The proposed multi-stage transmission network planning model considering transmission congestion is a mixed integer linear programming model, which can be effectively solved through the commercial solver CPLEX [51,52] in MATLAB.

4.1. The Improved Six-Node Garver Power System

4.1.1. Parameters of Case Studies

The shown in Figure 2 contains six nodes and 15 transmission corridors. The parameters of transmission corridors are shown in Table 1. It is noted that all cost components of the improved six-node Garver power system are in US dollars. The maximum number of circuits for each transmission corridor is three. In order to simulate the characteristics of the power market, the user side loads are quoted in stages, and the loads at each node are divided into five segments. Each segment is given a different power purchase price. The output range and power supply price of different types of generating units are different. The parameters of generating units and loads are shown in Table 2. Table 3 presents 10 types of load scenarios including ideal state, high load in developed areas, and low load in the whole network during holidays, etc. At the same time, 16 scenarios are used to simulate the changes of generator caused by equipment failures, changes of power generation prices, market policies, and other influences. The transmission congestion threshold η0 is 0.3.

4.1.2. Results of the Proposed Model

The transmission planning scheme for the improved six-node Garver power system and its costs are shown in Figure 2 and Table 4, respectively. Before planning, each operation scenario of transmission network is simulated, and 23 major congestion scenarios of the transmission network are screened out. The information of major congestion scenarios is shown in Table 5.
As can be seen from Table 5, the problem of transmission network congestion is not only affected by load demand growth, but also by coal control policy (scenarios 73, 71, and 80), gas generator price rise (scenario 81), large power input from upper voltage grid due to medium and long-term contracts (scenario 61), and drought or flood seasons (scenarios 21 and 11). In scenario 73, under the influence of the coal control policy, the output level of coal power of nodes 3 and 5 is reduced, the power flow of transmission corridors 11 and 14 exceed the maximum limit in the planning stage 1, and the nuclear power with low electricity price at node 6 cannot be delivered. In order to satisfy the load demand of power users, gas generators with high electricity price are dispatched. Under scenario 1, due to the lack of capacity to meet the demand growth in power transmission, loss of load appeared at node 4 and node 1 in planning stages 3 and 5, respectively. The loss rate of node 4 in planning stages 3 to 5 is 6.0%, 6.0%, and 9.2%, respectively, and that of node 1 in the planning stage 5 is 6.0%. Scenario 1 in planning stages 3 to 5 are added to the planning scenario set. Under scenario 81, the power supply prices of gas generators 2, 4, and 7 increase, which is higher than the quoted prices of some users at each node, resulting in loss of load. The loss of load rates of nodes 1 to 4 are 18.0%, 12.0%, 6.0%, 24%, and 14.6%, respectively. The transmission congestion fails to make full use of the low electricity price in the power system, and limits the social benefit to reach the optimal.
From Figure 2, The proposed planning model decides to build one new circuit for transmission corridor 11 and one new circuit for transmission corridor 14 in planning stage 2. The loss of load at each node in the target transmission network disappears. The degrees of transmission congestion in all scenarios are less than the threshold η0. In Table 4, the social benefit (Csb) represents the sum of social benefit under all operation scenarios, which is obtained based on the simulation results considering universal scenarios. The social benefits of each planning stage increased by 0.6037 M$, 4.4072 M$, 6.4967 M$, 9.8945 M$, and 16.4156 M$, respectively. After deducting the cost of transmission line planning and investment, the power network planning scheme obtained by the model can still bring the whole society with 13.1088 M$.
To sum up, the proposed multi-stage transmission network planning model considering transmission congestion can effectively alleviate the problem of transmission congestion caused by the development of power network load and the change of power market through the optimal planning of transmission line, which improves the economic benefit of transmission network operation in the planning cycle.

4.1.3. Influence of Different Transmission Congestion Thresholds on the Planning Scheme

To analyze the impact of different transmission congestion threshold η0 on the planning scheme, η0 is set to 0.1, 0.2, 0.25, 0.3, 0.35, and 0.4, respectively. The planning schemes and costs are shown in Table 6 and Figure 3. As the transmission congestion threshold η0 increases, the screening of major congestion scenarios tends to be loose; and the types of scenarios included in the planning scenario set increase, which changes the results of transmission network planning. When η0 = 0.4, nine major congestion scenarios are considered in the transmission network planning. Compared with the planning scheme when η0 = 0.3, the line expansion decision of transmission corridor 14 is delayed by one planning stage. Although the line investment cost and maintenance cost are reduced by 2.8103 M$ and 0.0945 M$, respectively, the social benefit is lost at the same time by 3.786 M$, indicating the problem of insufficient transmission line investment. When η0 = 0.1, the number of major congestion scenarios for transmission network planning is 297. Compared with the planning scheme when η0 = 0.3, the line investment cost and maintenance cost of the resulting planning scheme are increased by 24.3564 M$ and 0.6529 M$, respectively. The social benefit is increased only by 1.6596 M$, and the total social benefit is reduced instead. Therefore, when carrying out the transmission network planning considering the transmission congestion scenario, it is necessary to determine the reasonable transmission congestion threshold to prevent the problem of insufficient or excessive investment to realize the optimal benefit of transmission network planning.
The solution time of the planning model under different major congestion scenarios is shown in Figure 4. In Figure 4, as the number of severe congestion scenarios increases, so does the numbers of decision variables and constraints, which leads to the dimensionality disaster with exponential multiplication of computation. If the scale of the transmission system is further expanded, the solving difficulty will continue to increase, which makes it difficult for the model to be applied. Therefore, through the major congestion scenario screening method proposed in this paper, the optimal scheduling simulation under each operation scenario is carried out. According to the predetermined transmission congestion threshold, the major congestion scenario is screened in advance to obtain the planning scheme. The demand of network planning is achieved efficiently under the large scale and complex operational scenarios of the current transmission system.

4.2. Simplified 25-Node Power System of Zhejiang Province, China

The simplified 25-node power system of Zhejiang province, China is used for further analysis and verification. The power system consists of three 1000 kV nodes, 22,550 kV nodes, and 36 transmission corridors. The maximum number of lines that can be built for each transmission corridor is three. The topology of the simplified 25-node system of Zhejiang province, China is shown in Figure 5. Parameters of transmission corridors, load demands and generators in the power system are shown in Table 7, Table 8 and Table 9. It is noted that all cost components of the simplified 25-node power system of Zhejiang province, China are in Chinese Yuan (CNY). According to the actual situation of Zhejiang power market, each load node uses a unified piecewise quotation. The purchase price of each section is 316 CNY/MWh, 538 CNY/MWh, 730 CNY/MWh, and 946 CNY/MWh, respectively. The planning result when η0 = 7.5 and its costs are shown in Figure 5 and Table 10.
The social benefit surplus is the value of the total social benefit under all scenarios deducting the transmission line investment and maintenance costs, which represents the net benefit of the transmission network planning. It can be seen from Table 10 that the social benefit surplus is 16.6 × 10⁶ CNY, indicating that the economics of the transmission network operation is effectively improved through the proposed planning method. The information of major congestion scenarios before planning is shown in Table 11. It can be seen from Figure 5 and Table 11 that the power system is mainly faced with three types of transmission congestion scenarios, including reduction of hydraulic generator output due to drought/flood seasons, limited power generation of coal power due to coal control policy, and large power input due to medium and long-term contracts. Under scenario 71, because of the coal control policy, some coal power units at nodes 13 and 15 are shut down, and their output is halved. Due to the power flow violation of transmission corridors 12 and 14, the electricity power at node 11 cannot be sent out, resulting in loss of load at nodes 15, 16, and 17. The shadow price of scenario 71 before planning reaches 1363.6, which is higher than the shadow price of scenario 1 (φ1 = 1016.8). However, as the probability of scenario 71 is smaller than that of scenario 1, the degree of transmission congestion of scenario 1 is still higher than that of scenario 71. Figure 6 shows the active power of each transmission corridor under scenario 1 before and after the planning. Under scenario 1, the overall load level in this region is relatively high, and the transmission corridors 5, 6, 9, 11, 14, and 32 are congested, resulting in the failure of the electricity with low electricity prices being sent out from nodes 1, 3, 4, and 11. According to the planning result, new transmission lines are built in the above transmission corridors 5, 6, 9, 11, 14, and 32. The transmission capacity of the transmission corridor is improved, and the social benefit in this scenario is increased from 23.3 × 10⁶ CNY to 24.3 × 10⁶ CNY.
The generating power of each generator under scenario 21 is presented in Figure 7. Under scenario 21, nodes 20, 21, and 25 (i.e., the area with rich water resources in southwest Zhejiang) are reasonably affected by climate or generating unit scheduling. The hydropower output is less than the expected value. So, the power transmitted to node 16, 17, and 19 in southeast Zhejiang area is reduced, while the transmitted power of transmission corridor 32 reaches the upper limit. Therefore, the power from node 3 cannot be transmitted to southeast Zhejiang. Loss of load appeared at node 16, 17, and 19, with a loss rate of 12%, 18%, and 18%, respectively. At the same time, in order to meet the demand of high quoted power load, the gas generators at node 20 are called up to 342 MW. Under this circumstance, the power system is in the non-optimal operation mode. After planning, the loss of load at nodes 16, 17, and 19 disappeared; the output of node 3 increased by 1908.0 MW; and the social benefit under this scenario increased from 23.1 × 10⁶ CNY to 24.4 × 10⁶ CNY.
The proposed bi-level transmission network planning model can be used in the actual transmission network system. By analyzing the major congestion scenarios obtained in the planning, it can effectively help the power system planners to identify the power system congestion risk sources and guide the expansion construction of transmission network.

5. Conclusions

The economic scheduling of transmission network is simulated to evaluate the congestion degree of each scenario and screen out the severely congested ones. A multi-stage transmission network planning model considering transmission congestion is then established. The main conclusions are as follows:
(1)
Aiming at the new risks of transmission congestion in the power market, such as the fluctuation of generator quotation, the preemption of transmission medium and long-term contract, a major congestion scenario screening method based on shadow price theory is proposed, which effectively evaluates the congestion risks, screens out major congestion scenarios and provides guidance for multistage planning of transmission network.
(2)
When carrying out transmission network planning with as many operating scenarios as possible, the proposed screening method of transmission network congestion scenarios effectively identifies the major congestion scenarios that need to be considered. Through the iterative optimization of transmission network planning, the optimal planning scheme is obtained to alleviate the transmission congestion risk. The proposed screening method effectively improves the efficiency of solving, prevents the dimension disaster problem, and can successfully be applied to the actual power system.
(3)
Different settings of transmission congestion threshold will affect the transmission network planning results. A reasonable determination of transmission congestion threshold through sensitivity analysis can prevent the over-investment of transmission lines and reduce the difficulty and solution time.
The proposed transmission network planning model aims at maximizing the social benefit considering different scenarios, which fully describe the uncertain bidding strategies of generators and users. However, it does not take the interests of independent agents into full consideration. In fact, there is a game relationship among the independent agents in the power market, which requires multiple optimization objectives to be considered in the transmission network planning model. Future work should be concentrated on establishing the multi-objective planning model of transmission network considering multi-agent game behavior and the interests of all independent agents to improve the economy of the planning result.

Author Contributions

Conceptualization, Y.H. and L.Y.; methodology, L.Y. and Z.L. (Zhenzhi Lin); software, Y.H. and Z.Z.; validation, Y.D., K.S. and Z.L. (Zhou Lan); formal analysis, Y.H. and X.L.; investigation, Y.H.; resources, Y.D.; data curation, K.S.; writing—original draft preparation, Y.H.; writing—review and editing, X.L., Z.L. (Zhenzhi Lin) and L.Y.; visualization, K.Z.; supervision, Z.L. (Zhou Lan); project administration, Y.D., K.S., Z.L. (Zhou Lan) and K.Z.; funding acquisition, Y.D. All authors have read and agreed to the published version of the manuscript.

Funding

This research was funded by Science and Technology Program of State Grid Zhejiang Electric Power Co., Ltd. (5211JY180015), National Natural Science Foundation of China (51777185) and National Key R&D Program of China (2016YFB0900100).

Acknowledgments

This work is supported by Science and Technology Program of State Grid Zhejiang Electric Power Co., Ltd. (5211JY180015), National Natural Science Foundation of China (51777185) and National Key R&D Program of China (2016YFB0900100).

Conflicts of Interest

The authors declare no conflict of interest.

Nomenclature

(1) Indices and Sets
gIndex for generators.ΩnodeSet of transmission network nodes.
i, jIndices for nodes. Ω i g e n Set of generators connected with node i.
kIndex for circuits of transmission corridor.Ωplan,tSet of planning scenarios in planning stage t.
sIndex for scenarios.Ωline,iSet of transmission corridors starting from node i.
tIndex for planning stages.ΩdecSet of decision variables.
αIndex for iterations.LijSet of transmission circuits of transmission corridor ij.
(2) Parameters
Bij,kSusceptance of the kth circuit of transmission corridor ij.ThrLoad duration of each planning stage.
CtotalSurplus of social benefits.TplanYears of the planning cycle.
C s s b Social benefit under operation scenario s.TlineYears of the transmission line capital recovery cycle.
C t i n v Investment cost of transmission line in planning stage t. x i j ¯ Upper limit of the number of transmission line ij that can be constructed.
C t o m Maintenance cost of transmission line in planning stage t. ε i E N S Maximum load loss rate of node i.
C t bud Largest budget for the investment and maintenance of transmission lines in planning stage t.μijLagrange multiplier of the power flow constraint of power transmission corridor ij.
c i j , k i n v Unit investment cost of the kth circuit of transmission corridor ij.λiLagrange multiplier of the power balance constraint of node i.
c i j , k om Unit maintenance cost of the kth circuit of transmission corridor ij. ν i j , k ¯ , ν i j , k _ Lagrange multipliers of the upper and lower limits of capacity constraints of the kth circuit of transmission corridor ij, respectively.
c i , g g e n Electricity price of generator g connected with node i. τ i , g ¯ , τ i , g _ Lagrange multiplier of the upper and lower limits of power constraints of generator g connected with node i, respectively.
c i l o a d Power purchase price at node i.πLagrange multiplier of the phase angle constraint at equilibrium node.
HijFlow transferring relativity factor of transmission corridor ij. ω i ¯ , ω i _ Lagrange multipliers of the upper and lower limits of power losses constraint at node i, respectively.
L M P i l o a d , L M P i , g g e n LMPs of node i and generator g connected with node i, respectively.η0Threshold of transmission congestion degree.
NplanNumber of planning stages.ηsTransmission congestion degree of scenario s.
P i , g g e n , min , P i , g g e n , max Minimum and maximum power of generator g connected with node i, respectively.σLine investment recovery coefficient.
psProbability of scenario s.φsShadow price of scenario s.
rDiscount rate.ζtDiscount coefficient.
S i j , k max Maximum transmission power of the kth circuit of transmission corridor ij.
(3) Variables
P i l o a d Load power of node i.xt,ij,kBinary investment decision variable of the kth circuit of transmission corridor ij in planning stage t.
P i , g g e n Power of generator g connected with node i.nt,ij,kBinary state decision variable of the kth circuit of transmission corridor ij in planning stage t.
P i j l i n e Power flow of transmission corridor ij.θi, θjVoltage phase angles of node i and node j, respectively.
P i d Load demand at node i.θrefVoltage phase angle of the equilibrium node.

References

  1. Relative Policies on Deepening the Reform of Power Industry. Available online: http://www.china-nengyuan.com/news/91900.html (accessed on 28 July 2020).
  2. Zeng, M.; Yang, Y.; Wang, L.; Sun, J. The power industry reform in China 2015: Policies, evaluations and solutions. Renew. Sustain. Energy Rev. 2016, 57, 94–110. [Google Scholar] [CrossRef]
  3. Sun, J.; Ruze, N.; Zhang, J.; Zhao, H.; Shen, B. Evaluating the Investment Efficiency of China’s Provincial Power Grid Enterprises under New Electricity Market Reform: Empirical Evidence Based on Three-Stage DEA Model. Energies 2019, 12, 3524. [Google Scholar] [CrossRef] [Green Version]
  4. Ni, L.; Wen, F.; Liu, W.; Meng, J.; Lin, G.; Dang, S. Congestion management with demand response considering uncertainties of distributed generation outputs and market prices. J. Mod. Power Syst. Clean Energy 2016, 5, 66–78. [Google Scholar] [CrossRef] [Green Version]
  5. Peesapati, R.; Yadav, V.K.; Kumar, N. Transmission congestion management considering multiple and optimal capacity DGs. J. Mod. Power Syst. Clean Energy 2017, 78, 711–724. [Google Scholar] [CrossRef] [Green Version]
  6. Zhou, L.; Zhang, D.; Wu, W.; Zhu, M.; Yang, H.; Li, C.; Li, G.; Li, F.; Cui, M. A comparative study on grid resource utilization rate between China Southern Power Grid and National Grid Plc of UK. Prot. Control. Mod. Power Syst. 2018, 3, 26. [Google Scholar] [CrossRef]
  7. Huang, W.; Zhang, N.; Kang, C.; Li, M.; Huo, M. From demand response to integrated demand response: Review and prospect of research and application. Prot. Control. Mod. Power Syst. 2019, 4, 12. [Google Scholar] [CrossRef] [Green Version]
  8. Wang, Y.; Zhang, N.; Kang, C.; Miao, M.; Shi, R.; Xia, Q. An Efficient Approach to Power System Uncertainty Analysis with High-Dimensional Dependencies. IEEE Trans. Power Syst. 2018, 33, 2984–2994. [Google Scholar] [CrossRef]
  9. Freitas, P.F.S.; Macedo, L.H.; Romero, R. A strategy for transmission network expansion planning considering multiple generation scenarios. Electr. Power Syst. Res. 2019, 172, 22–31. [Google Scholar] [CrossRef]
  10. Wang, Z.; Wang, W.; Liu, C.; Wang, B. Forecasted Scenarios of Regional Wind Farms Based on Regular Vine Copulas. J. Mod. Power Syst. Clean Energy 2020, 8, 77–85. [Google Scholar] [CrossRef]
  11. Bompard, E.; Carpaneto, E.; Chicco, G.; Gross, G. The role of load demand elasticity in congestion management and pricing. In Proceedings of the 2000 Power Engineering Society Summer Meeting (Cat No 00CH37134) PESS-00, Seattle, WA, USA, 16–20 July 2000; Institute of Electrical and Electronics Engineers (IEEE): Piscataway, NJ, USA, 2002; pp. 2229–2234. [Google Scholar]
  12. Pillay, A.; Prabhakar Karthikeyan, S.; Kothari, D.P. Congestion management in power systems—A review. Int. J. Electr. Power Energy Syst. 2015, 70, 83–90. [Google Scholar] [CrossRef]
  13. Esfahani, M.M.; Yousefi, G.R. Real Time Congestion Management in Power Systems Considering Quasi-Dynamic Thermal Rating and Congestion Clearing Time. IEEE Trans. Ind. Inform. 2016, 12, 745–754. [Google Scholar] [CrossRef]
  14. Khayatian, A.; Barati, M.; Lim, G.J. Integrated Microgrid Expansion Planning in Electricity Market With Uncertainty. IEEE Trans. Power Syst. 2017, 33, 3634–3643. [Google Scholar] [CrossRef]
  15. Opara, R.O.; Okafor, K.C.; Dike, D.O.; Chukwudebe, G.A.; Onoshakpor, R.M. Towards Locational Marginal Pricing Model for Nigerian Electricity Tariff Structure using Optimal Power Flow Computation. In Proceedings of the 2019 IEEE PES/IAS PowerAfrica, Abuja, Nigeria, 20–23 August 2019; Institute of Electrical and Electronics Engineers (IEEE): Piscataway, NJ, USA, 2019; pp. 24–29. [Google Scholar]
  16. Shin, H.S.; Rasmusen, E. Games and Information: An Introduction to Games Theory. Econ. J. 1989, 99, 864. [Google Scholar] [CrossRef]
  17. De Paola, A.; Papadaskalopoulos, D.; Angeli, D.; Strbac, G. Investigating the Social Efficiency of Merchant Transmission Planning Through a Non-cooperative Game-Theoretic Framework. IEEE Trans. Power Syst. 2018, 33, 4831–4841. [Google Scholar] [CrossRef]
  18. Hesamzadeh, M.R.; Yazdani, M. Transmission Capacity Expansion in Imperfectly Competitive Power Markets. IEEE Trans. Power Syst. 2013, 29, 62–71. [Google Scholar] [CrossRef]
  19. Jenabi, M.; Ghomi, S.M.T.F.; Smeers, Y. Bi-Level Game Approaches for Coordination of Generation and Transmission Expansion Planning Within a Market Environment. IEEE Trans. Power Syst. 2013, 28, 2639–2650. [Google Scholar] [CrossRef]
  20. Motamedi, A.; Zareipour, H.; Buygi, M.O.; Rosehart, W.D. A Transmission Planning Framework Considering Future Generation Expansions in Electricity Markets. IEEE Trans. Power Syst. 2010, 25, 1987–1995. [Google Scholar] [CrossRef]
  21. Askari, M.T.; Kadir, M.Z.A.A.; Tahmasebi, M.; Bolandifar, E. Modeling optimal long-term investment strategies of hybrid wind-thermal companies in restructured power market. J. Mod. Power Syst. Clean Energy 2019, 7, 1267–1279. [Google Scholar] [CrossRef] [Green Version]
  22. Yang, Z.; Bose, A.; Zhong, H.; Zhang, N.; Lin, J.; Xia, Q.; Kang, C. LMP Revisited: A Linear Model for the Loss-Embedded LMP. IEEE Trans. Power Syst. 2017, 32, 4080–4090. [Google Scholar] [CrossRef]
  23. Liu, M.; Quilumba, F.L.; Lee, W.-J. Dispatch Scheduling for a Wind Farm With Hybrid Energy Storage Based on Wind and LMP Forecasting. IEEE Trans. Ind. Appl. 2014, 51, 1970–1977. [Google Scholar] [CrossRef]
  24. Conejo, A.J.; Castillo, E.F.; Mínguez, R.; Milano, F. Locational Marginal Price Sensitivities. IEEE Trans. Power Syst. 2005, 20, 2026–2033. [Google Scholar] [CrossRef]
  25. Orfanogianni, T.; Gross, G. A General Formulation for LMP Evaluation. IEEE Trans. Power Syst. 2007, 22, 1163–1173. [Google Scholar] [CrossRef] [Green Version]
  26. Wang, Z. A Novel Evaluation Method of Transmission Grid Performance in Power Spot Market. IEEE Access 2019, 7, 181178–181183. [Google Scholar] [CrossRef]
  27. Sun, Y.; Li, Z.; Tian, W.; Shahidehpour, M. A Lagrangian Decomposition Approach to Energy Storage Transportation Scheduling in Power Systems. IEEE Trans. Power Syst. 2016, 31, 4348–4356. [Google Scholar] [CrossRef]
  28. Wu, M.; Lu, Z.; Chen, Q.; Zhu, T.; Lu, E.; Lu, W.; Liu, M. A Two-Stage Algorithm of Locational Marginal Price Calculation Subject to Carbon Emission Allowance. Energies 2020, 13, 2510. [Google Scholar] [CrossRef]
  29. Fang, X.; Hodge, B.-M.; Du, E.; Kang, C.; Li, F. Introducing Uncertainty Components in Locational Marginal Prices for Pricing Wind Power and Load Uncertainties. IEEE Trans. Power Syst. 2019, 34, 2013–2024. [Google Scholar] [CrossRef]
  30. Mahdavi, M.; Sabillon, C.; Ajalli, M.; Romero, R. Transmission Expansion Planning: Literature Review and Classification. IEEE Syst. J. 2019, 13, 3129–3140. [Google Scholar] [CrossRef]
  31. Min, C. Impact Analysis of Transmission Congestion on Power System Flexibility in Korea. Energies 2020, 13, 2191. [Google Scholar] [CrossRef]
  32. Wang, J.; Zhong, H.; Tang, W.; Rajagopal, R.; Xia, Q.; Kang, C. Tri-Level Expansion Planning for Transmission Networks and Distributed Energy Resources Considering Transmission Cost Allocation. IEEE Trans. Sustain. Energy 2018, 9, 1844–1856. [Google Scholar] [CrossRef]
  33. Dvorkin, Y.; Fernandez-Blanco, R.; Wang, Y.; Xu, B.; Kirschen, D.S.; Pandžić, H.; Watson, J.-P.; Silva-Monroy, C.A.; Carramolino, R.F.B. Co-Planning of Investments in Transmission and Merchant Energy Storage. IEEE Trans. Power Syst. 2018, 33, 245–256. [Google Scholar] [CrossRef]
  34. Abbasi, S.; Abdi, H.; Bruno, S.; La Scala, M. Transmission network expansion planning considering load correlation using unscented transformation. Int. J. Electr. Power Energy Syst. 2018, 103, 12–20. [Google Scholar] [CrossRef]
  35. Moeini-Aghtaie, M.; Abbaspour, A.; Fotuhi-Firuzabad, M. Incorporating Large-Scale Distant Wind Farms in Probabilistic Transmission Expansion Planning—Part I: Theory and Algorithm. IEEE Trans. Power Syst. 2012, 27, 1585–1593. [Google Scholar] [CrossRef]
  36. Zhang, X.; Conejo, A.J. Coordinated Investment in Transmission and Storage Systems Representing Long- and Short-Term Uncertainty. IEEE Trans. Power Syst. 2018, 33, 7143–7151. [Google Scholar] [CrossRef]
  37. Liu, Y.; Sioshansi, R.; Conejo, A.J. Multistage Stochastic Investment Planning With Multiscale Representation of Uncertainties and Decisions. IEEE Trans. Power Syst. 2018, 33, 781–791. [Google Scholar] [CrossRef]
  38. Maghouli, P.; Hosseini, S.H.; Buygi, M.O.; Shahidehpour, M. A Scenario-Based Multi-Objective Model for Multi-Stage Transmission Expansion Planning. IEEE Trans. Power Syst. 2010, 26, 470–478. [Google Scholar] [CrossRef]
  39. Li, Y.-H.; Wang, J. Flexible Transmission Network Expansion Planning Considering Uncertain Renewable Generation and Load Demand Based on Hybrid Clustering Analysis. Appl. Sci. 2015, 6, 3. [Google Scholar] [CrossRef] [Green Version]
  40. Majidi-Qadikolai, M.; Baldick, R. Stochastic Transmission Capacity Expansion Planning With Special Scenario Selection for Integrating N−1N−1 Contingency Analysis. IEEE Trans. Power Syst. 2016, 31, 4901–4912. [Google Scholar] [CrossRef]
  41. Liang, Z.; Chen, H.; Wang, X.; Ibn Idris, I.; Tan, B.; Zhang, C. An Extreme Scenario Method for Robust Transmission Expansion Planning with Wind Power Uncertainty. Energies 2018, 11, 2116. [Google Scholar] [CrossRef] [Green Version]
  42. Zhuo, Z.; Du, E.; Zhang, N.; Kang, C.; Xia, Q.; Wang, Z. Incorporating Massive Scenarios in Transmission Expansion Planning With High Renewable Energy Penetration. IEEE Trans. Power Syst. 2020, 35, 1061–1074. [Google Scholar] [CrossRef]
  43. Tor, O.B.; Guven, A.N.; Shahidehpour, M. Congestion-Driven Transmission Planning Considering the Impact of Generator Expansion. IEEE Trans. Power Syst. 2008, 23, 781–789. [Google Scholar] [CrossRef]
  44. Tinney, W.F.; Bright, J.M.; Demaree, K.D.; Hughes, B.A. Some deficiencies in optimal power flow. IEEE Trans. Power Syst. 1988, 3, 676–683. [Google Scholar] [CrossRef]
  45. Yan, X.; Gu, C.; Li, F.; Wang, Z. LMP-Based Pricing for Energy Storage in Local Market to Facilitate PV Penetration. IEEE Trans. Power Syst. 2018, 33, 3373–3382. [Google Scholar] [CrossRef]
  46. Sadr, S.M.; Mashhadi, H.R. Evaluation of price-sensitive loads’ impacts on transmission network congestion using an analytical approach. IET Gener. Transm. Distrib. 2015, 9, 523–530. [Google Scholar] [CrossRef] [Green Version]
  47. Hajiabadi, M.E.; Samadi, M. Locational marginal price share: A new structural market power index. J. Mod. Power Syst. Clean Energy 2019, 7, 1709–1720. [Google Scholar] [CrossRef] [Green Version]
  48. Akbari, T.; Moghaddam, S.Z. Coordinated scheme for expansion planning of distribution networks: A bilevel game approach. IET Gener. Transm. Distrib. 2020, 14, 2839–2846. [Google Scholar] [CrossRef]
  49. Fang, X.; Yang, Z.; Yu, J.; Lai, X.; Xia, Q. Electricity Pricing under Constraint Violations. IEEE Trans. Power Syst. 2020, 35, 1. [Google Scholar] [CrossRef]
  50. Liu, S.; Lin, Z.; Zhao, Y.; Liu, Y.; Ding, Y.; Zhang, B.; Wang, Q.; Yang, L.; White, S.E. Robust System Separation Strategy Considering Online Wide-area Coherency Identification and Uncertainties of Renewable Energy Sources. IEEE Trans. Power Syst. 2020, 1. [Google Scholar] [CrossRef]
  51. Weibezahn, J.; Kendziorski, M. Illustrating the Benefits of Openness: A Large-Scale Spatial Economic Dispatch Model Using the Julia Language. Energies 2019, 12, 1153. [Google Scholar] [CrossRef] [Green Version]
  52. Wang, G.; Tan, Z.; Lin, H.; Tan, Q.; Yang, S.; Ju, L.; Ren, Z. Multi-Level Market Transaction Optimization Model for Electricity Sales Companies with Energy Storage Plant. Energies 2019, 12, 145. [Google Scholar] [CrossRef] [Green Version]
Figure 1. Bi-level collaborative planning process of transmission network.
Energies 13 04910 g001
Figure 2. Topology diagram and planning scheme in the improved six-node Garver power system.
Energies 13 04910 g002
Figure 3. Planning costs under different transmission congestion thresholds.
Energies 13 04910 g003
Figure 4. Solution time of the planning models with different major congestion scenarios.
Energies 13 04910 g004
Figure 5. Topology and planning results of 25-node power system of Zhejiang province, China.
Energies 13 04910 g005
Figure 6. Active power of each transmission corridor under scenario 1.
Energies 13 04910 g006
Figure 7. Generating power of each generator under scenario 21.
Energies 13 04910 g007
Table 1. Parameters of transmission line in the improved six-node Garver power system.
CorridorFromToReactance (p.u.)Line Capacity (MW)Investment Cost (×106 $)Number of Existing LinesLength (km)
1120.408040120
2130.388038019
3140.606460130
4150.208030115
5160.685668034
6230.208020110
7240.408040120
8250.318031015.5
9260.308030115
10340.5965.659029.5
11350.208020110
12360.488048024
13450.636063031.5
14460.308030115
15560.6162.461030.5
Table 2. Parameters of generating units in the six-node Garver power system.
NodeGenerator No.Capacity (MW)Minimum Output (MW)Power Supply Price ($/MWh)
1G125022510
2G2150020
3G31206018
G480022
4----
5G51206017
G61005012
6G7100020
G81005015
G925010019
G1080021
Table 3. Parameters of load nodes in the improved six-node Garver power system.
NodePower Purchase Price ($/MWh)Load Demand (MW)
Scenario
12345678910
130,28,26,24,23120968412012084108108108120
230,29,27,25,23120968412012084108108108120
334,32,30,28,25200160140260200200180140180220
432,30,27,26,24150120105150150150135105135150
534,30,26,25,24170136119170221170119153119187
634,30,26,25,24130104911301301309111791130
Table 4. Planning cost in the improved six-node Garver power system.
TypeCost
Line investment cost (Cinv)/106 $20.6093
Line maintenance cost (Com)/106 $4.0995
Social benefit (Csb) before planning/109 $1.6648
Social benefit (Csb) after planning/109 $1.7026
Table 5. Major congestion scenarios in improved six-node Garver power system.
ScenarioPlanning StageProbabilityDegree of Transmission Congestion
Before PlanningAfter Planning
7311.50%0.63 0
152.40%0.61 0
7151.50%0.58 0.19
312.40%0.47 0
132.40%0.46 0
142.40%0.46 0
7141.50%0.44 0.22
242.40%0.44 0
1051.44%0.43 0.18
7131.20%0.38 0.23
6151.50%0.38 0
8050.90%0.37 0.26
1041.44%0.37 0
2151.20%0.35 0.15
8040.90%0.35 0.13
4150.45%0.32 0.15
8150.75%0.31 0.17
222.40%0.31 0
232.40%0.31 0
352.40%0.31 0
2141.20%0.31 0
1151.20%0.31 0
8120.75%0.30 0.16
Table 6. Comparison of transmission network planning schemes under different transmission congestion thresholds.
η0Number of Severely Congestion ScenariosPlanning SchemeSolution Time/s
0.12979(1), 11(1), 14(1), 14(2), 6(5)347.1317
0.29011(1), 14(1), 6(5), 14(5)42.0618
0.255011(1), 14(1), 6(5)35.8863
0.32311(1), 14(2)22.6523
0.351311(1), 14(2)20.5243
0.4911(1), 14(3)19.0354
Note: In the third column, the numbers outside and inside the bracket indicate the indices of expended transmission corridors and the planning stages of the planning scheme, respectively.
Table 7. Parameters of transmission corridors in simplified 25-node power system of Zhejiang province, China.
CorridorFromToReactance (p.u.)Capacity (MW)Investment Cost (×106 CNY)Number of Existing LinesLength (km)
1120.004637500/2100
2230.002817500/2100
3250.008122200348287
4540.00145220056214
5480.007622300312278
6170.0013300080220
7780.002942200120230
8190.004254300328282
9980.002972700124231
108100.005851800244261
119100.005941800240260
129110.00343200160240
139120.00194360080220
1411120.002213200104226
152120.007172700294273.5
1612130.006132700254.8263.7
1713140.004373700180245
1814150.002762300164241
1913150.005382800210252.5
2012150.006083100280370
2112180.004782900200250
2217180.0121527005002125
2316170.0062700250262.5
2415160.005222900210.8252.7
2518220.004874300220255.0
262230.0100427004161104
2723240.005042300224256
2824240.008682700368292
2923250.006582900272268
3022310.005692800224256
312130.0001822006.6821.67
323200.0103522004002100
3317200.004872800202150.5
3417190.006143700255.6263.9
3519200.002692400114228.5
36460.00372200149.6237.4
3722230.00192200102425.5
Table 8. Parameters of load demand in simplified 25-node power system of Zhejiang province, China.
NodeLoad Demand (MW)
Scenario
12345678910
10000000000
20000000000
30000000000
42782250422261947166913912226222622262782
54790431138323353287423953832383238324790
690817263544572727272
75318478642543722319126594254425442544254
89793881478346855587648977834783478347834
910,146913181167102608750738116811681168116
10132119106927966106106106106
110000000000
128754787970036128525243777003700361287003
132533228020261773152012662026202617732026
1414212611195791261261111260
1513,65612,29010,925955981946828955910,925955913,656
16168915201351118210138451182118211821351
176256563050054379375431284379437950055005
184981448339853487298924913487398539853985
19857771686600514429600514686686
209740876677926818584448706818584477927792
212032182916261422121910161422162616261626
220000000000
23176215861410123310578811233141014101410
2411651049932816699583816932932932
252539228520311777152312701777203120312031
Table 9. Parameters of generators in simplified 25-node power system of Zhejiang province, China.
GeneratorNodePrice (CNY/MWh)Maximum Output (MW)Minimum Output (MW)Type
163671800900Pumped storage
2754711410Gas generator
38405.31320528Coal power
48415.321781089Nuclear power
5860740780Gas generator
6954713560Gas generator
710405.640562028Nuclear power
812385.32000800Coal power
9123671200600Pumped storage
10126079040Gas generator
1113385.31320528Coal power
12135476800Gas generator
13136077880Gas generator
1414385.327801112Coal power
1515385.32400960Coal power
161554711310Gas generator
1716385.32400960Coal power
1817385.32000800Coal power
19183671500750Pumped storage
20186071860Gas generator
2119385.3630252Coal power
2220405.325201008Coal power
2320385.32000800Coal power
24206073420Gas generator
2524405.325201008Coal power
262554713230Gas generator
2720519.6200100Hydropower
2820656.8600300Hydropower
2921412.4305152.5Hydropower
3025386.3320160Hydropower
31136960001800Power from external regions
32336060001800Power from external regions
33436960001800Power from external regions
34536950001500Power from external regions
35835850001500Power from external regions
361133975002250Power from external regions
37223581000300Power from external regions
382230175002250Power from external regions
Table 10. Costs of the planning scheme in 25-node power system of Zhejiang province, China.
TypeCost
Line investment cost (Cinv)/106 CNY1826.7
Line maintenance cost (Com)/106 CNY271.5
Social benefits (Csb) under severe congestion scenarios/109 CNY14,807.6
Social benefit (Csb) surplus after planning/106 CNY16.6
Table 11. Major congestion scenarios in 25-node power system of Zhejiang province, China.
ScenarioPlanning StageProbabilityDegree of Transmission Congestion
Before PlanningAfter Planning
151.6%16.30.5
7151.0%13.60.0
252.4%12.51.6
141.6%12.21.3
2150.8%10.20.0
6151.0%10.20.3
131.6%9.10.8
7141.0%9.11.0
7251.5%9.01.0
6251.5%7.51.0

