Monitoring System of Transmission Line in Mountainous Area Based on LPWAN


Abstract
1. Introduction
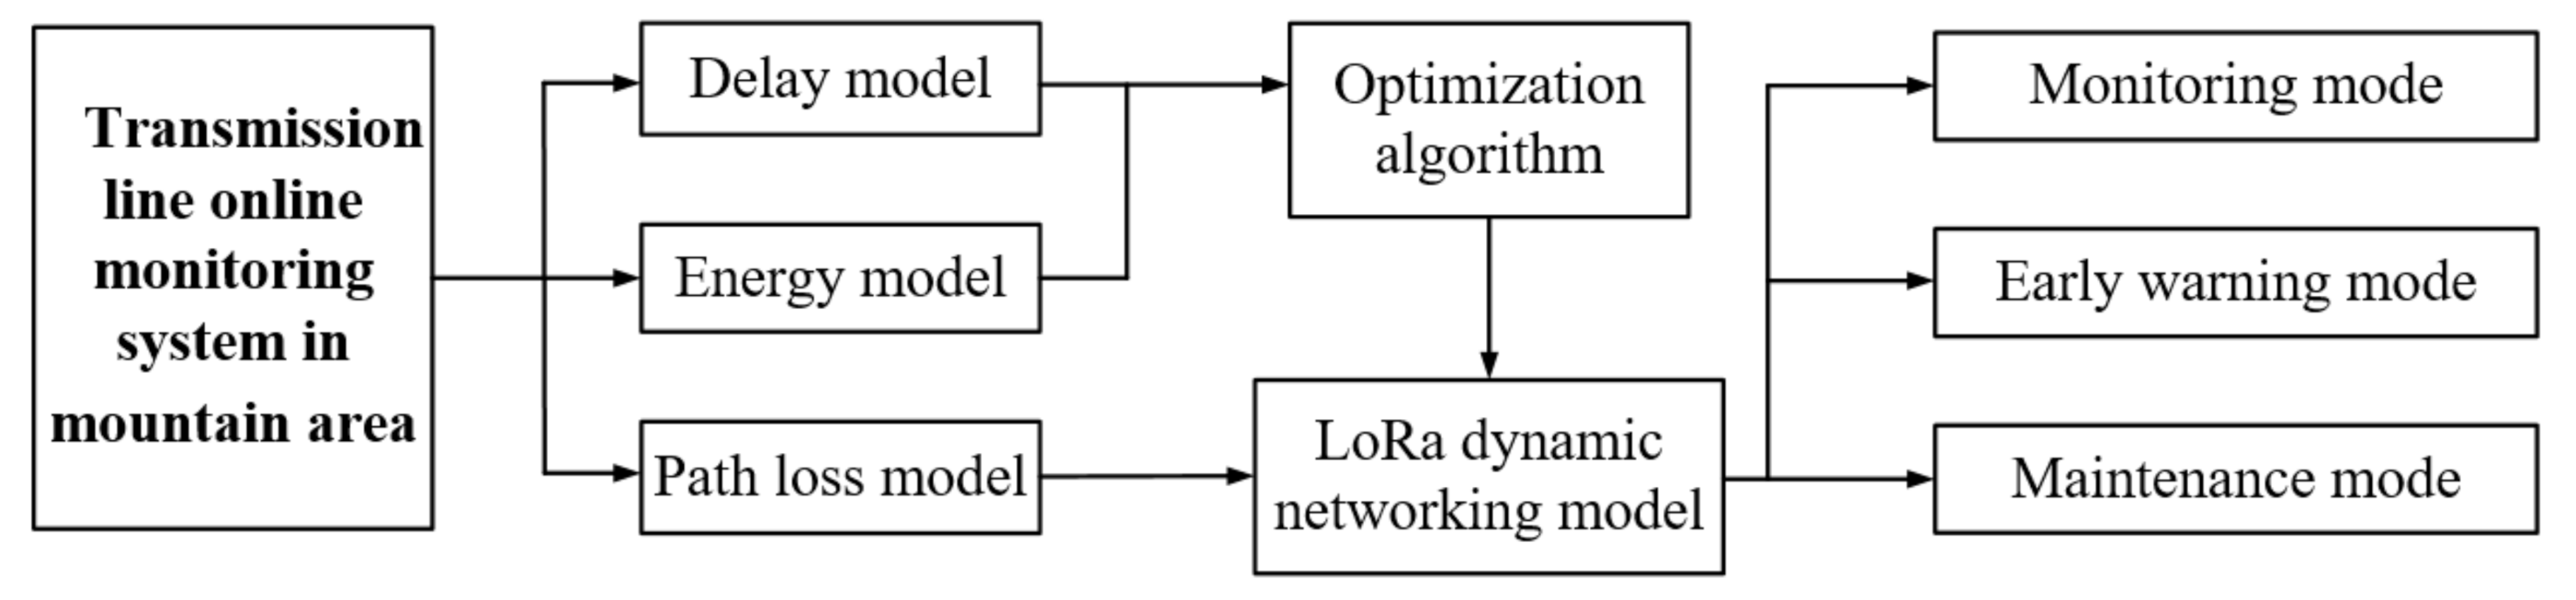
2. Transmission Line Monitoring Network Architecture in Mountainous Areas
3. Model and Method
3.1. Path Loss Model Design
3.2. Network Model Design
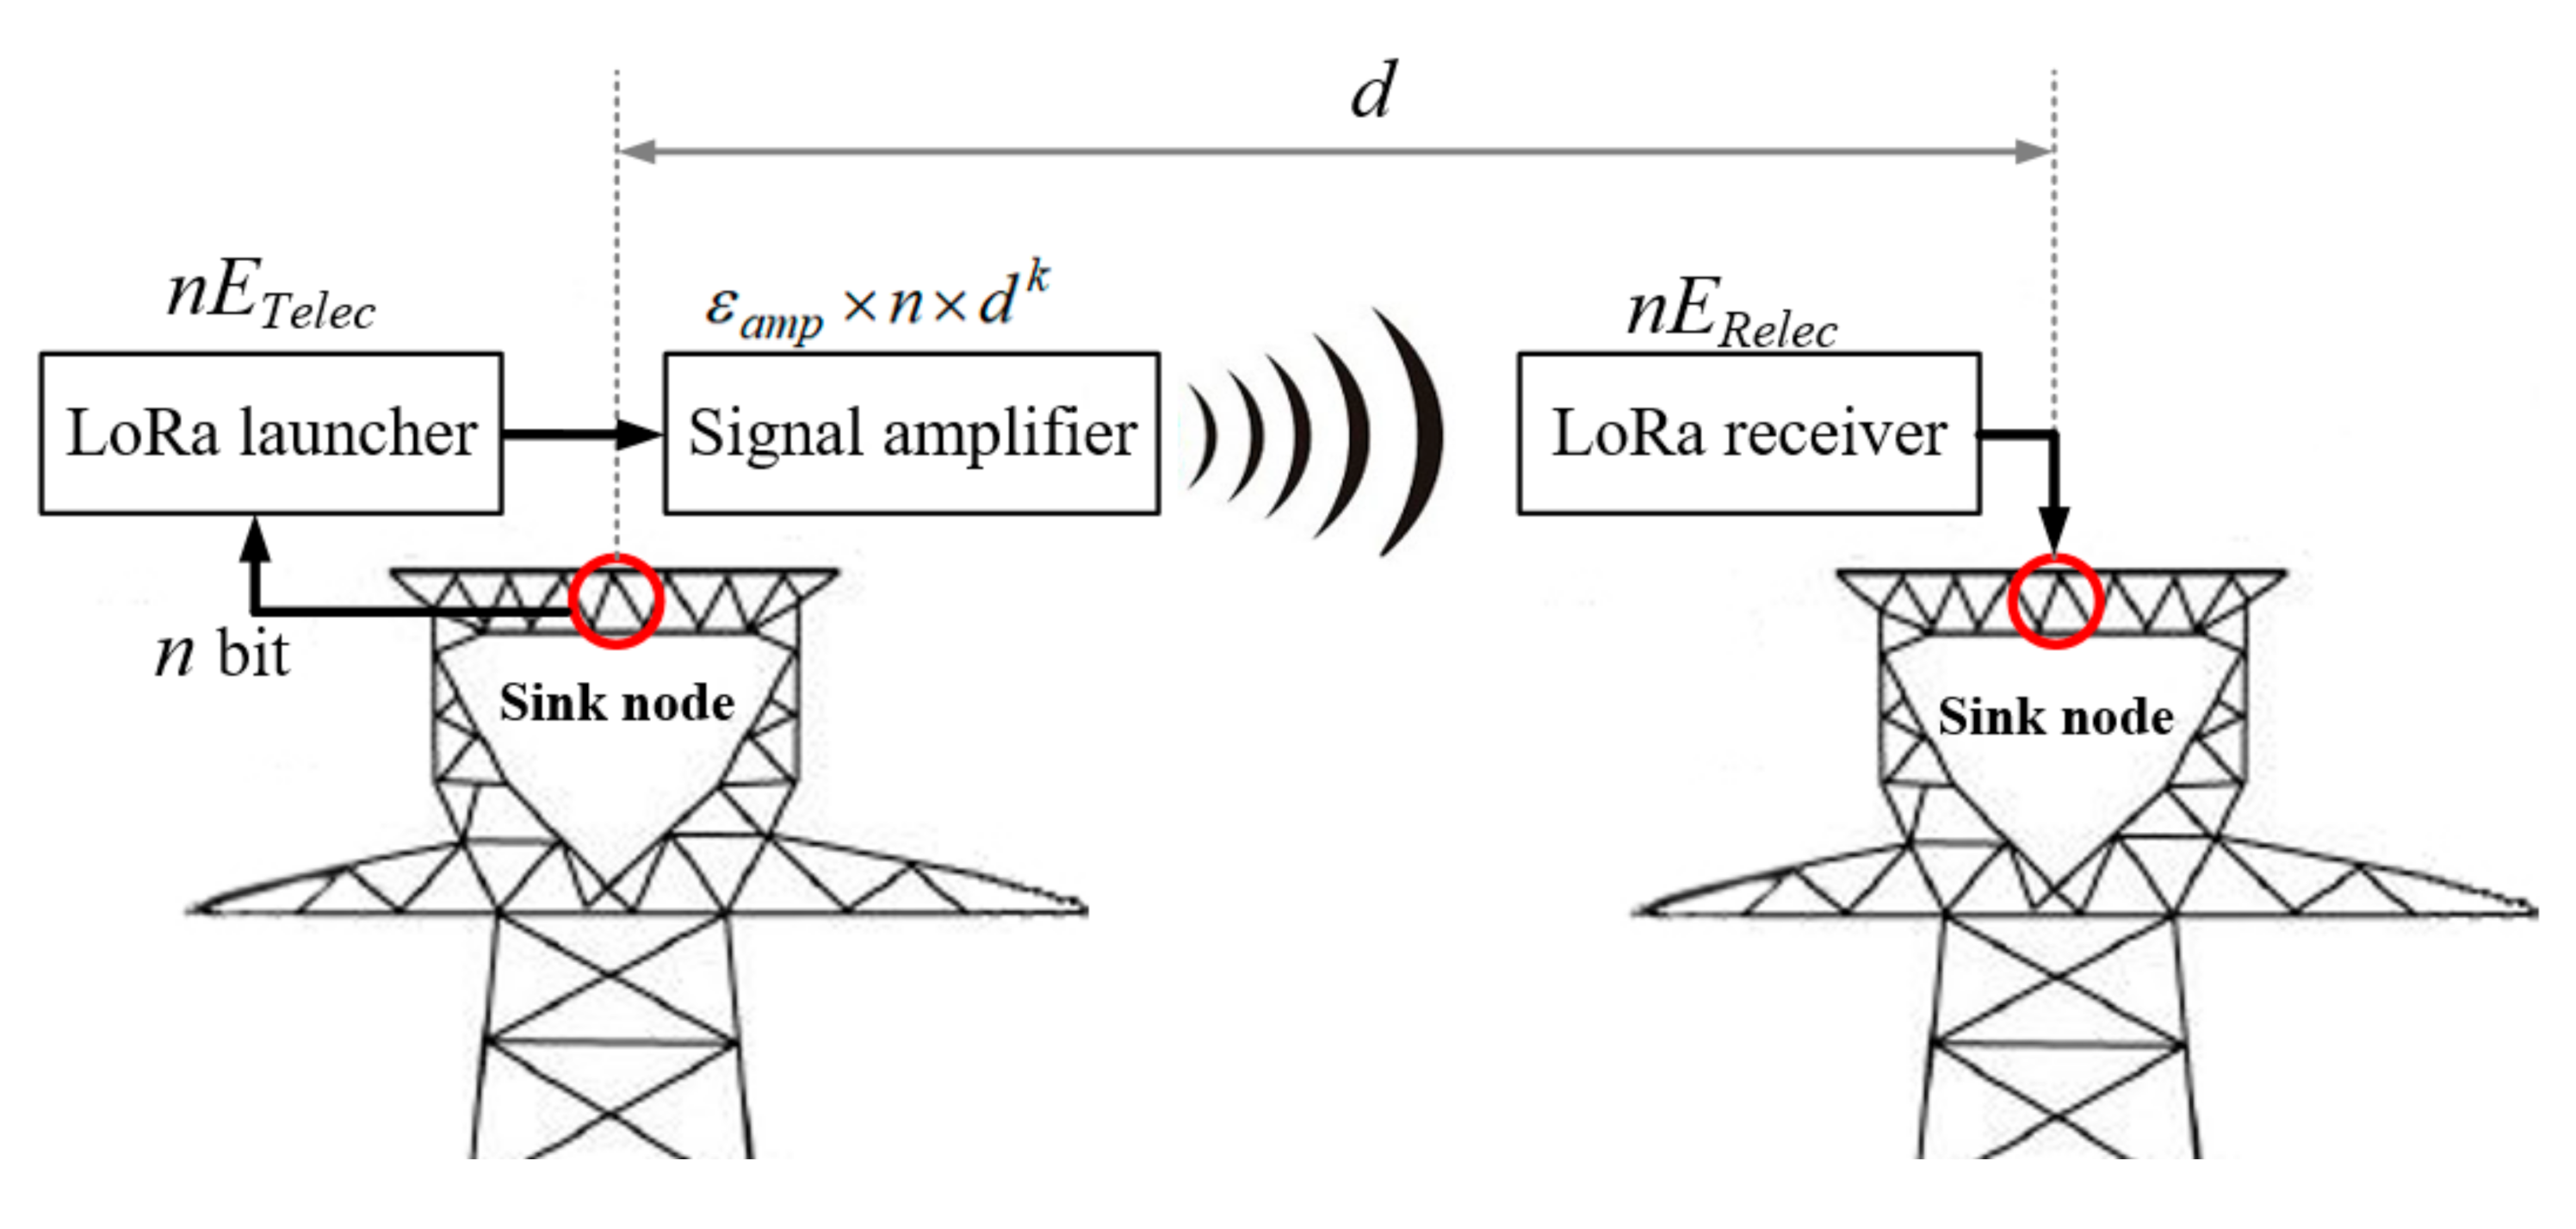
3.3. Delay Model and Energy Consumption Model Design
3.4. Multi Objective Particle Swarm Optimization Algorithm
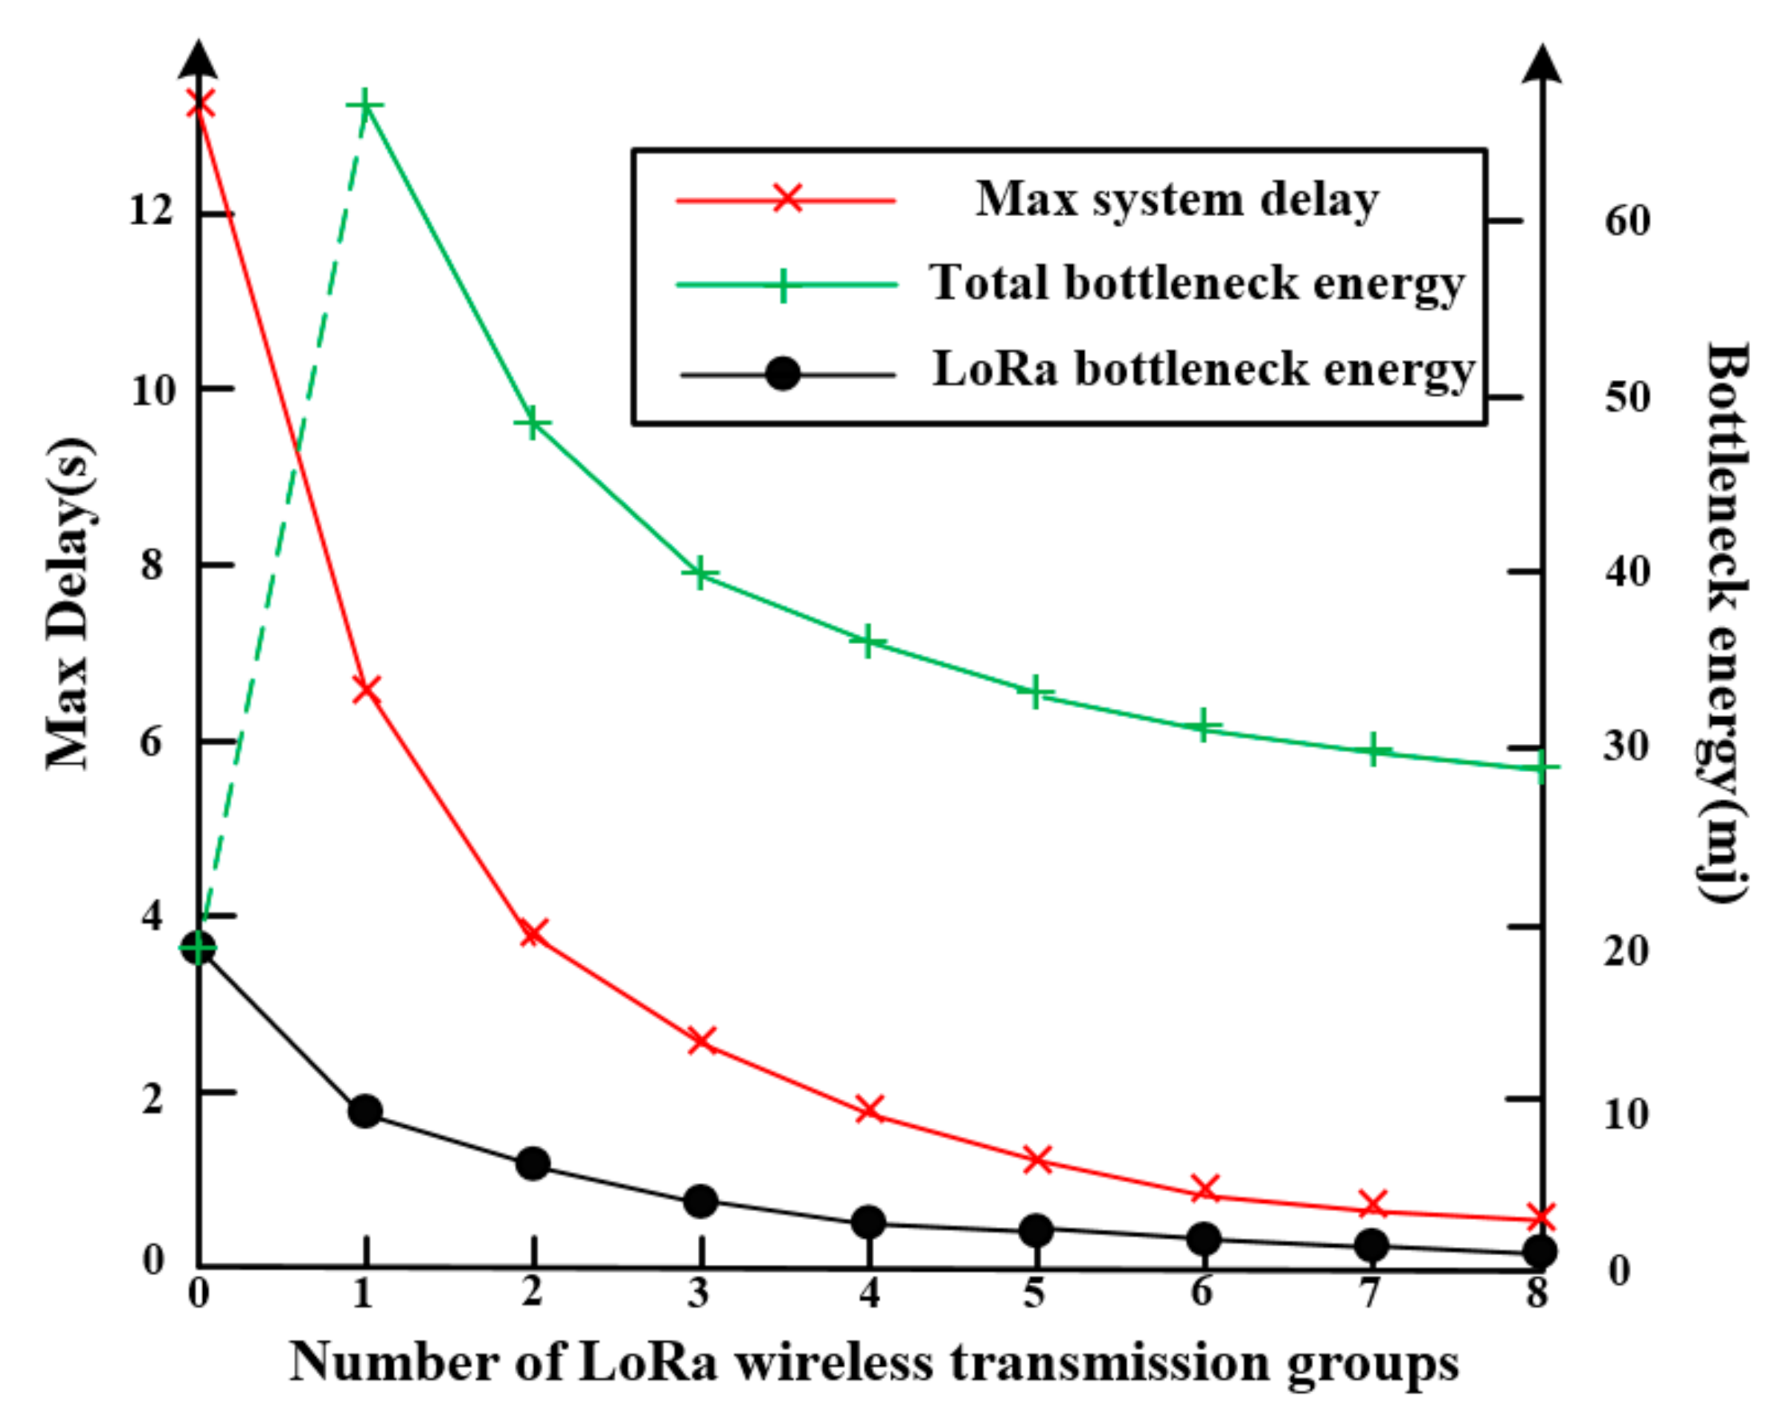
4. Experiment and Simulation Analysis
4.1. Model Validation and Calibration
4.2. Working Mode Selection
4.3. System Life Calculation
5. Conclusions
Author Contributions
Funding
Conflicts of Interest
Data Availability Statement
References
- Li, Y.; Teng, Y.; Leng, O.; Yuan, S.; Cai, Z. Reliability evaluation of on-line monitoring device over transmission line based on data driven concept. Proc. CSEE 2018, 31, 4410–4419. [Google Scholar]
- Jiang, S.; Jiang, W.; Huang, W.; Yang, L. UAV-based oblique photogrammetry for outdoor data acquisition and offsite visual inspection of transmission line. Remote Sens. 2017, 9, 278. [Google Scholar] [CrossRef]
- Zhao, X.; Tan, M.; Hui, X.; Bian, J. Deep-learning-based autonomous navigation approach for UAV transmission line inspection. In Proceedings of the 2018 IEEE International Conference on Advanced Computational Intelligence, Xiamen, China, 29–31 March 2018; pp. 455–460. [Google Scholar]
- Cao, W.; Zhu, L.; Han, J.; Wang, T.; Du, Y. High voltage transmission line detection for UAV based routing inspection. In Proceedings of the 2013 IEEE International Conference on Advanced Intelligent Mechatronics, Wollongong, Australia, 9–12 July 2013; pp. 554–558. [Google Scholar]
- Bian, J.; Hui, X.; Zhao, X.; Tan, M. A novel monocular-based navigation approach for UAV autonomous transmission-line inspection. In Proceedings of the 2018 IEEE Intelligent Robots and Systems, Madrid, Spain, 1–5 October 2018; pp. 1–7. [Google Scholar]
- Boucouvalas, A.C.; Papageorgiou, C.; Georgantzos, E. Elliptical fibre dielectric waveguides: A transverse transmission line analysis. IET Optoelectron. 2020, 14, 1–9. [Google Scholar] [CrossRef]
- Tavakoli, F.; Ebrahimi, S. Planar optical waveguide for refractive index determining with high sensitivity and dual-band characteristic for Nano-sensor application. Opt. Quantum Electron. 2019, 51, 185. [Google Scholar] [CrossRef]
- Lazaropoulos, A.G. Wireless sensor network design for transmission line monitoring, metering, and controlling: Introducing broadband over power lines-enhanced network model (BPLeNM). Int. Sch. Res. Not. 2014, 1–22. [Google Scholar] [CrossRef]
- Ding, T.; Ding, M.; Mao, G.; Lin, Z.; López-Pérez, D.; Zomaya, A.Y. Uplink performance analysis of dense cellular networks with LoS and NLoS transmissions. IEEE Trans. Wirel. Commun. 2017, 16, 2601–2613. [Google Scholar] [CrossRef]
- Cui, Y.; Song, X.; Zhao, L.; Yuan, H.; Wu, G.; Wang, H. WSN-based measurement of ion-current density under high-voltage direct current transmission lines. IEEE Access 2019, 10947–10955. [Google Scholar] [CrossRef]
- Zhou, X.; Mu, H.; Wei, J.; He, J.; Zhang, G. Verification system of monitoring equipment to overhead galloping transmission lines based on draw-wire sensors. In Proceedings of the 2016 IEEE International Conference on Condition Monitoring and Diagnosis, Xi’an, China, 25–28 September 2016; pp. 606–609. [Google Scholar]
- Huang, X.; Zhao, L.; Chen, G. Design of a wireless sensor module for monitoring conductor galloping of transmission lines. Sensors 2016, 16, 1657. [Google Scholar] [CrossRef]
- Yan, Z.; Li, Z.; Savory, E.; Lin, W.E. Galloping of a single iced conductor based on curved-beam theory. J. Wind Eng. Ind. Aerodyn. 2013, 123, 77–87. [Google Scholar] [CrossRef]
- Zhengming, L.; Yu, Z.; Zheng, W. An icing on-line monitoring system of transmission lines based on WSN. In Proceedings of the 2013 IEEE International Conference on Measuring Technology and Mechatronics Automation, Vicenza, Italy, 27 February–1 March 2013; pp. 194–197. [Google Scholar]
- Yafeng, C.; Ming, L.; Yishi, Y.; Shihua, Z.; Feng, W.; Cheng, W. Analysis and countermeasures of prevent ice-melting flashover for hunan power grid transmission lines. Hunan Electr. Power 2017, 3, 30–33. [Google Scholar]
- Peng, L.; Min, C.; Qimao, L.; Xinling, S.; Shangfei, G. Overview on icing prediction models and decision-making methods of de-icing for power transmission line. In Proceedings of the 2012 Chinese Control Conference, Hefei, China, 25–27 July 2012; pp. 7125–7130. [Google Scholar]
- Shudan, G.U.; Lailiang, C.; Shanshan, W.; Deyun, S. Simulation experiment of line tower tilt monitoring. Bull. Surv. Mapp. 2018, 1, 202–207. [Google Scholar]
- Deng, F.; Zuo, P.; Wen, K.; Wu, X.; He, Y. Low delay technology research of transmission line tower monitoring network integrating WSN and RFID. IEEE Access 2019, 111065–111073. [Google Scholar] [CrossRef]
- Zhang, Q.C.; Zhang, Z.H. Research on wireless sensor network node for tower crane safety monitoring system. Appl. Mech. Mater. 2014, 494–495, 781–784. [Google Scholar] [CrossRef]
- Xiuchao, H.; Jianwei, Z.; Jianye, Z.; Moufu, H.; Jiajun, T.; Jianfeng, Z. Design of transmission tower tilt on-line monitoring system based on ZigBee technology. Mod. Electron. Tech. 2019, 42, 95–99. [Google Scholar]
- Raza, U.; Kulkarni, P.; Sooriyabandara, M. Low power wide area networks: An overview. IEEE Commun. Surv. Tutor. 2017, 19, 855–873. [Google Scholar] [CrossRef]
- Mikhaylov, K.; Petaejaejaervi, J.; Haenninen, T. Analysis of capacity and scalability of the lora low power wide area network technology. In Proceedings of the 2016 European Wireless Conference, Oulu, Finland, 18–20 May 2016; pp. 1–6. [Google Scholar]
- Mekki, K.; Bajic, E.; Chaxel, F.; Meyer, F. A comparative study of LPWAN technologies for large-scale IoT deployment. ICT Express 2018, 5, 1–7. [Google Scholar] [CrossRef]
- Petajajarvi, J.; Mikhaylov, K.; Hamalainen, M.; Linatti, J. Evaluation of LoRa LPWAN technology for remote health and wellbeing monitoring. In Proceedings of the 2016 International Symposium on Medical Information and Communication Technology, Worcester, MA, USA, 21 May 2016; pp. 153–165. [Google Scholar]
- Oh, S.; Shin, J. An efficient small data transmission scheme in the 3GPP NB-IoT system. IEEE Commun. Lett. 2017, 21, 660–663. [Google Scholar] [CrossRef]
- Beyene, Y.; Jantti, R.; Ruttik, K.; Lraji, S. On the performance of narrow-band internet of things (NB-IoT). In Proceedings of the 2017 IEEE Wireless Communications and Networking Conference, San Francisco, CA, USA, 19–22 March 2017; pp. 1–6. [Google Scholar]
- Mahmoud, M.S.; Mohamad, A.A.H. A study of efficient power consumption wireless communication techniques/ modules for internet of things (IoT) applications. Adv. Internet Things 2016, 6, 19–29. [Google Scholar] [CrossRef]
- Petajajarvi, J.; Mikhaylov, K.; Roivainen, A.; Hnninen, T. On the coverage of LPWANs: Range evaluation and channel attenuation model for LoRa technology. In Proceedings of the 2015 IEEE International Conference on Its Telecommunications, Copenhagen, Denmark, 2–4 December 2015; pp. 55–59. [Google Scholar]
- Augustin, A.; Yi, J.; Clausen, T.; William, T. A study of LoRa: Long range & low power networks for the internet of things. Sensors 2016, 16, 1466. [Google Scholar]
- Parri, L.; Parrino, S.; Peruzzi, G.; Pozzebon, A. Low Power Wide Area Networks (LPWAN) at sea: Performance analysis of offshore data transmission by means of LoRaWAN connectivity for marine monitoring applications. Sensors 2019, 19, 3239. [Google Scholar] [CrossRef]
- Zhang, X.; Zhang, M.; Meng, F.; Qiao, Y.; Xu, S.; Hour, S. A low-power wide-area network information monitoring system by combining NB-IoT and LoRa. IEEE Internet Things J. 2019, 6, 590–598. [Google Scholar] [CrossRef]
- Kong, P.; Liu, C.; Jiang, J. Cost-efficient placement of communication connections for transmission line monitoring. IEEE Trans. Ind. Electron. 2017, 64, 4058–4067. [Google Scholar] [CrossRef]
- Fateh, B.; Govindarasu, M.; Ajjarapu, V. Wireless network design for transmission line monitoring in smart grid. IEEE Trans. Smart Grid 2013, 4, 1076–1086. [Google Scholar] [CrossRef]
- Zhang, W.; Yu, H.; Yan, Z.; Xu, J. Study on disaster monitoring technology of mountain fire based on UAV transmission line inspection. In Proceedings of the 2017 IEEE International Conference on Unmanned Systems (ICUS), Beijing, China, 27–29 October 2017. [Google Scholar]
- Shanqiang, G.; Biwu, Y.; Chun, Z.; Tao, W.; Qing, L. Application of lightning optical path monitoring system on 500kV transmission lines in mountain area. In Proceedings of the 2016 International Conference on Lightning Protection, Estoril, Lisboa, Portugal, 25–30 September 2016; pp. 1–5. [Google Scholar]
- Rao, T.R.; Rao, S.V.B.; Prasad, M.V.S.N.; Sain, M.; Lqbal, A.; Lakshmi, D.R. Mobile radio propagation path loss studies at VHF/UHF bands in Southern India. IEEE Trans. Broadcasting 2000, 46, 158–164. [Google Scholar] [CrossRef]
- Taheri, P.; Kordi, B.; Gole, A.M. Parametric study of transient electromagnetic fields due to overhead transmission lines and buried cables in the vicinity of lossy ground. IEEE Trans. Power Deliv. 2011, 26, 2287–2298. [Google Scholar] [CrossRef]
- Hainan, W. The Comparative Analysis and Application of the Common Wireless Radio Transmittal Model. Master’s Thesis, Jilin University, Changchun, China, 2011. [Google Scholar]
- Adelantado, F.; Vilajosana, X.; Tuset-Peiro, P.; Martinez, B.; Melia-Segui, J.; Watteyne, T. Understanding the limits of LoRaWAN. IEEE Commun. Mag. 2017, 55, 34–40. [Google Scholar] [CrossRef]
- Xiong, Y.; Chen, G.; Lu, M.; Wan, X.; Wu, M.; She, J. A Two-phase lifetime-enhancing method for hybrid energy-harvesting wireless sensor network. IEEE Sens. J. 2020, 20, 1934–1946. [Google Scholar] [CrossRef]
- Centenaro, M.; Vangelista, L.; Zanella, A.; Zoezi, M. Long-range communications in unlicensed bands: The rising stars in the IoT and smart city scenarios. IEEE Wirel. Commun. 2016, 23, 60–67. [Google Scholar] [CrossRef]
- Gungor, V.C.; Sahin, D.; Kocak, T.; Ergut, S.; Buccella, C.; Cecati, C.; Hancke, G. Smart grid technologies: Communication technologies and standards. IEEE Trans. Ind. Inform. 2011, 7, 529–539. [Google Scholar] [CrossRef]


| Detection Target | Detection Mode | Data Generated by Single Acquisition (bit) |
|---|---|---|
| Ambient temperature | Temperature sensor | 170 |
| Ambient humidity | Humidity sensor | 170 |
| Inclination angle of transmission tower | Angle sensor | 830 |
| Climatic wind speed | Wind speed sensor | 170 |
| Vibration acceleration of transmission line | Acceleration sensor | 570 |
| Vibration amplitude of transmission line | Amplitude sensor | 400 |
| Conductor temperature | Temperature sensor | 170 |
| Insulator leakage current | Electromagnetic sensor | 100 |
| String tension | Friction sensor | 150 |
| Algorithm | Population Size | Maximum Number of Iterations | ||
|---|---|---|---|---|
| ZDT | DTLZ | ZDT | DTLZ | |
| Multi objective particle swarm optimization algorithm | 100 | 100 | 100 | 100 |
| Weight ω | SF | BW (kHz) | Transmission Distance (km) | D(xk)(s) | E(xk)(mJ) | Q(xk) |
|---|---|---|---|---|---|---|
| 0.1 | 12 | 125 | 1 | 9.21 | 11 | 10.83 |
| 0.2 | 11 | 125 | 1.5 | 5.11 | 15 | 13.61 |
| 0.3 | 10 | 125 | 2 | 2.84 | 26 | 24.81 |
| 0.4 | 8 | 125 | 2.6 | 0.92 | 33 | 25.57 |
| 0.5 | 7 | 125 | 3 | 0.55 | 47 | 33.24 |
| 0.6 | 8 | 250 | 3.5 | 0.46 | 51 | 32.26 |
| 0.7 | 6 | 125 | 4 | 0.34 | 60 | 32.86 |
| 0.8 | 7 | 250 | 4.6 | 0.27 | 70 | 31.31 |
| 0.9 | 6 | 250 | 5 | 0.17 | 76 | 24.03 |
| Working Mode | Transmission Distance/km | Received Packet | Loss Rate | Communication Quality Requirements |
|---|---|---|---|---|
| Monitoring mode | 1.5 | 940 | <6% | Low |
| 1.5 | 957 | <5% | ||
| 1.5 | 959 | <5% | ||
| Early warning mode | 3 | 982 | <3% | Normal |
| 3 | 985 | <3% | ||
| 3 | 980 | <3% | ||
| Maintenance mode | 5 | 998 | <1% | High |
| 5 | 997 | <1% | ||
| 5 | 995 | <1% |
| Reporting Interval/s | Packet Size/bit | Battery Life/year | |
|---|---|---|---|
| Monitoring mode | 300 | 8 | 18.611 |
| Early warning mode | 5 | 24 | 0.090 |
| Maintenance mode | 1.2 | 36 | 0.016 |
| Line Length/100 km | Trip Rate/Time * 100 km * year | |
|---|---|---|
| 2013 | 74.83 | 0.175 |
| 2012 | 71.72 | 0.177 |
| 2011 | 67.29 | 0.213 |
© 2020 by the authors. Licensee MDPI, Basel, Switzerland. This article is an open access article distributed under the terms and conditions of the Creative Commons Attribution (CC BY) license (http://creativecommons.org/licenses/by/4.0/).
Share and Cite
Zeng, H.; Zuo, P.; Deng, F.; Zhang, P. Monitoring System of Transmission Line in Mountainous Area Based on LPWAN. Energies 2020, 13, 4898. https://doi.org/10.3390/en13184898
Zeng H, Zuo P, Deng F, Zhang P. Monitoring System of Transmission Line in Mountainous Area Based on LPWAN. Energies. 2020; 13(18):4898. https://doi.org/10.3390/en13184898
Chicago/Turabian StyleZeng, Han, Pengqi Zuo, Fangming Deng, and Pei Zhang. 2020. "Monitoring System of Transmission Line in Mountainous Area Based on LPWAN" Energies 13, no. 18: 4898. https://doi.org/10.3390/en13184898
APA StyleZeng, H., Zuo, P., Deng, F., & Zhang, P. (2020). Monitoring System of Transmission Line in Mountainous Area Based on LPWAN. Energies, 13(18), 4898. https://doi.org/10.3390/en13184898