Abstract
Renewable Energy Communities consist in an emerging decentralized market mechanism which allows local energy exchanges between end-users, bypassing the traditional wholesale/retail market structure. In that configuration, local consumers and prosumers gather in communities and can either cooperate or compete towards a common objective, such as the minimization of the electricity costs and/or the minimization of greenhouse gas emissions for instance. This paper proposes data analytics modules which aim at helping the community members to schedule the usage of their resources (generation and consumption) in order to minimize their electricity bill. A day-ahead local wind power forecasting algorithm, which relies on state-of-the-art Machine Learning techniques currently used in worldwide forecasting contests, is in that way proposed. We develop furthermore an original method to improve the performance of neural network forecasting models in presence of abnormal wind power data. A technique for computing representative profiles of the community members electricity consumption is also presented. The proposed techniques are tested and deployed operationally on a pilot Renewable Energy Community established on an Medium Voltage network in Belgium, involving of wind and 18 Small and Medium Enterprises who had the possibility to freely access the results of the developed data modules by connecting to a dedicated web platform. We first show that our method for dealing with abnormal wind power data improves the forecasting accuracy by 10% in terms of Root Mean Square Error. The impact of the developed data modules on the consumption behaviour of the community members is then quantified, by analyzing the evolution of their monthly self-consumption and self-sufficiency during the pilot. No significant changes in the members behaviour, in relation with the information provided by the models, were observed in the recorded data. The pilot was however perturbed by the COVID-19 crisis which had a significant impact on the economic activity of the involved companies. We conclude by providing recommendations for the future set up of similar communities.
1. Introduction
1.1. Context
The operation and planning of modern electric power systems face major transformations nowadays, due to the increasing share of renewable generation (e.g., wind or solar) in the electricity mix, which is uncertain by nature and tends to be deployed in a decentralized way, and to the liberalization and unbundling of the electricity supply chain which occurred in the 1990s in Europe.
The main challenge with electricity systems consists in the fact that generation and consumption must be physically equal at every instant in order to maintain system stability, since electrical energy is as for now difficultly storable at a large scale. Extreme problems of coordination must thereby be solved by modern Transmission System Operators (TSOs), which are furthermore complicated by the fact that they do not own the generation (and consumption) assets, since the liberalization of the electricity sector. The coordination is in that context performed through market platforms on which the market actors can interact. The wholesale market level allows in that way interactions between large producers, large consumers and entities known as Access Responsible Parties (ARPs) (or Balance Repsonible Parties—BRPs—depending on the country), which are responsible for maintaining the balance in their portfolio (containing injection, offtakes and possibly exchanges with other ARPs/BRPs). Bilateral contracts, and power exchange platforms such as EPEX SPOT [1] in Western Europe, provide such opportunities at the wholesale level, with exchange horizons starting from years ahead to close to real time. The retail market enables on the other hand interactions between small end-users (consumers and prosumers) and electricity suppliers (through e.g., fix and varying tariff contracts), which are often themselves ARPs/BRPs.
Currently, new modes of exchange of electricity tend to emerge at the local level, which question the market structure depicted above. This is motivated firstly by the proliferation of decentralized renewable energy resources (owned by small end-users or prosumers), following the ambitious environmental targets promoted at the European and worldwide scale, for which a more efficient coordination could be achieved locally. The increasing willingness of the citizen to play an active role in the electricity supply chain is another important driving factor. The literature speaks of ’consumer-centric electric systems’, for which the end-user is placed at the centre of the electrical energy value chain.
Some studies propose in that way to keep a centralized market structure, while adapting the wholesale markets to extend their conditions of access to small end-users [2,3]. On the other hand, fully decentralized structures relying on peer-to-peer exchanges, in which all prosumers and consumers are directly interconnected between each other for buying and selling energy services, are discussed in [4,5]. An intermediate solution promotes the grouping of local consumers/prosumers into organized communities, in which energy resources are pooled and allocated to reach a common objective. The modes of exchanges of energy inside the community may however vary depending on authors: local competitive markets are for instance established in [6,7], whereas collaboration prevails over competition in [8,9]. Peer-to-peer exchanges inside communities are also studied in [10,11].
In its directive 2018/2001 on the promotion of the use of energy from renewable sources [12], the European (EU) Commission has formalized the concept of Renewable Energy Communities (or RECs), in which end-users would be allowed to exchange renewable energy produced locally. The directive has since been transposed into decrees and legal frameworks in many countries of the European Union, e.g., in Wallonia in Belgium [13], in France [14] or in Italy [15]. The science and technology communities have in parallel launched many initiatives to study and implement pilot projects of RECs: the cVPP project [16], lead by the Technische Universiteit of Eindhoven, and the E-Cloud project [17,18], lead by ORES (one of the main Walloon Distribution System Operator or DSO) and which will further be described in Section 3, are two striking examples. The present paper focuses more particularly on the case of such RECs.
1.2. Related Work
Many challenges related to the modeling of RECs are still investigated in the literature, which mainly deal with the optimal operation (e.g., how should we allocate in day-ahead energy resources among members in a community to fulfill a given objective?) and sizing (how should we dimension renewable generation, storage, etc. in a community?) of the communities (see references [6,7,8,9,10,11] exposed above). More particularly, the multi-agent nature of the underlying optimization problems has driven an increasing attention of the researchers towards game theoretical models for studying the economic equilibria that can appear inside the communities [11,19,20]. Some authors are focusing on the other hand on regulatory aspects related to RECs: these communities consist indeed in a new market design which can play a role at the macroeconomic scale in case of a general adoption. Authors in [21] use cooperative game theory to show for instance that inadequate grid tariffs may lead to an excess adoption of the model, with a potential snowball effect.
Optimally allocating resources in day-ahead in a community requires however to be informed with accurate prospects in terms of local injections (renewable energy production) occurring in the community, with a small time granularity (e.g., quarter hourly). The role of demand (i.e., electricity consumption) response for better matching the generation, in the context of RECs and more generally in electrical power systems, is furthermore well-kown and heavily investigated in the literature, through e.g., the direct control of appliances (see e.g., [22]), or appropriate ex ante recommendations on the consumption behavior of end-users, provided possibly by optimization routines driven by economic signals (see e.g., [23]).
More particularly, data analytics techniques, and especially Machine Learning, can play an important role in better anticipating the generation and demand primitives in communities. The 1 h ahead forecasts of the electricity consumption are for instance performed in [24] using neural networks, in order to support a fuzzy-logic based controller which implements the resource matching in rural communities. Authors in [25] developed a Markov Chain for forecasting a day ahead the aggregated solar generation surplus and residual load in a community comprising storage. A Long Short Term memory network is proposed in [26] to forecast in day-ahead the energy demand in a whole P2P community. Other researchers try on the other hand to avoid the complexity of forecasting models by developing online optimization methods [27,28]. Finally, some studies leverage data analytics for improving the sizing of the communities, such as [29], in which a load profile generator based on Self Organized Maps (SOMs) is proposed.
1.3. Objectives and Contributions
In this paper, we focus on the day-ahead forecasting of time series of local wind power generation in a community, whereas most of the literature studies communities with solar generation only, and on the modeling of the electricity consumption of the individual community members, whereas most of references focus on the consumption quantities aggregated at the community level. We develop data analytics modules, relying on state-of-the-art Machine Learning models, which are expected to help the community members to adapt their consumption profiles to the local renewable energy generation, thereby improving the local coordination. More particularly:
- we develop a day-ahead local wind power forecasting model, based on the use of state-of-the-art Machine Learning models (tree-based techniques and neural network architectures) trained using a backtesting procedure commonly used in the field of time series forecasting, among the best currently used in worldwide energy forecasting contests [30],
- we propose an original method for improving the performance of neural network forecasting models in presence of wind power abnormal data, which is quite abundant when performing localized wind power predictions,
- rather than developing pure load forecasting models for each individual, which is a complex task requiring explanatory variables difficultly obtainable in practice (e.g., for privacy concerns), we propose an algorithm for generating representative profiles of the community members electricity consumption at the considered time of the year, which is solely based on past consumption data,
- we deploy operationally the developed data analytics modules in a pilot REC established on an industrial area in Tournai (Belgium) on the existing Medium Voltage (MV) distribution grid in the framework of the E-Cloud project [17,18], comprising of wind generation and 18 Small and Medium Enterprises (SMEs), who had the possibility to freely access the results of the developed data modules by connecting to a dedicated web platform,
- we quantify the impact of the modules on the operation of the REC (forecasting performance of the developed models, and behaviour of the community members via the evolution of their self-sufficiency and self-consumption during the pilot).
The paper is organized as follows. Section 2 describes the developed data analytics models, with an emphasis on local wind power forecasting in Section 2.1 and on the generation of representative electricity consumption profiles in Section 2.2. Section 3 first describes the pilot REC on which the developed modules are applied (Section 3.1), focuses then on the performance of the wind power forecasting module (Section 3.2 and Section 3.3), and finally quantifies the impact of the data analytics modules on the behaviour of the community members and on the operation of the REC, by analyzing the evolution of the community self-consumption and self-sufficiency (Section 3.4).
2. Methodology
The developed data analytics modules, which aim at improving the operation of the RECs through a better coordination between local generation and consumption, are explained in the present section. More particularly, a local day-ahead wind power forecasting model, able to deal with wind power abnormal data, is presented in Section 2.1. Section 2.2 describes the generator of electricity consumption representative profiles.
2.1. Local Wind Power Forecasting
This section first describes the different Machine Learning models that are employed for the day-ahead prediction of wind power time series. An original methodology for automatically dealing with abnormal wind power data, which are abundant in the case of localized predictions (as opposed to the case of aggregate predictions made at the regional or national level), during the learning phase of neural network models, thereby improving the forecast performance, is then presented.
2.1.1. Forecasting Model
The forecasting of wind power time series is cast as a Machine Learning regression problem, a particular class of supervized learning problems for which the output is continuous. In this paper, five different models are employed and compared. We first implement two state-of-the-art neural network architectures, namely the traditional feedforward MultiLayer Perceptron or MLP [31], as well as recurrent extensions such as the LongShort Term Memory network or LSTM [32] and its bidirectional variant BLSTM [33], recently applied in the energy sector in [34,35]. We then implement two tree-based techniques, namely Random Forests or RF [36], and Gradient Boosting Decision Tree techniques or GBDT [37]. Finally, the fifth forecasting model (ENSEMBLE) is an ensemble forecast whose output is simply the average of the four previous models. The employed models represent a snapshot of current state-of-the-art Machine Learning techniques, as exemplified by their high performances in contests such as the Global Energy Forecasting Competition [30].
We focus on the day-ahead prediction of wind power, i.e., we aim at forecasting at 12:00 p.m. of day the wind power for the 96 quarters of an hour of day D. Figure 1 depicts the overall procedure. Input features are composed of historical data (i.e., past wind power production and meteorological data such as wind speed, temperature and pression) and of future data (in this case the publicly available day-ahead onshore wind power forecast made by the Transmission System Operator—or TSO—at the national level). In the case of the tree-based models, i.e., RF and GBDT, one model is trained for each of the 96 quarters of an hour of day D, and the quarter hourly forecasts (or ) are combined in a forecast vector (or ) for the whole day D. One single MLP model with an output layer of size 96 predicts the wind power for day D , and one single unrolled BLSTM model predicts . Finally, the output of the ENSEMBLE model, i.e., , is computed by calculating the average of , , and .
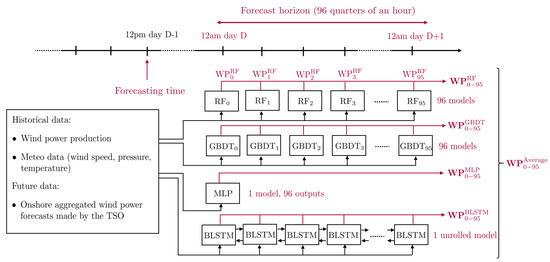
Figure 1.
Wind power forecasting methodology.
2.1.2. Strategy for Dealing with Abnormal Wind Power Data
Abnormal data—or outliers—are quite common in localized wind power data, which may have a strong impact on the performance of wind power forecasting models which are built on such data. These can be detected by analyzing the wind turbine power curve (which depicts wind power as a function of wind speed), and can be classified into four categories depending on their position with respect to the normal power curve, according to [38]: bottom curve stacked outliers (due to turbine failure, communication equipment failure, measurement terminal failure, unplanned maintenance—see zone 1 of Figure 2), mid-curve stacked outliers (caused by wind curtailment or communication issues—see zone 2 of Figure 2), top-curve stacked outliers (caused by communication error or wind speed sensor failure—see zone 3 of Figure 2) and around-curve stacked outliers (due to random factors such as signal propagation noise and extreme weather conditions—see zone 4 of Figure 2).
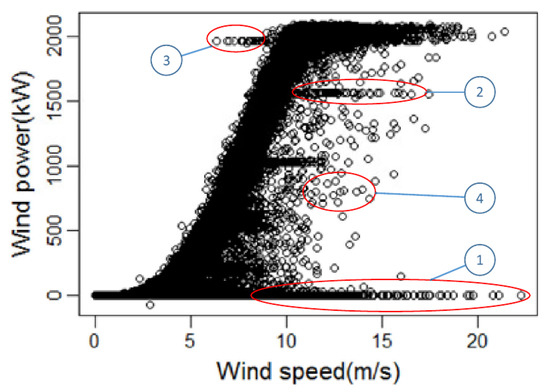
Figure 2.
Abnormal data in wind power curves (extracted from [38]).
In this paper, we propose an original method for taking into account the presence of abnormal wind power data directly in the learning procedure of the neural network wind power forecast models, in order to improve the forecast performance. In practice (and voluntarily summarizing the process for the sake of clarity), the learning procedure for neural networks, and more generally for supervised learning models, consists in identifying the values of the model parameters (e.g., the weights of a neural network) minimizing a loss function , which quantifies how well the model fits the training data:
with the output of model , x the vector of input features, y the target vector (i.e., the true forecast values extracted from the training set , with N the number of samples in the training set), and the optimal parameters values. Problem (1) is solved using variants of the gradient descent algorithm, for most of supervised learning models.
In that context, the main idea of our adapted learning procedure consists in modifying the loss function in order to cancel the contribution of data objects which are tagged as abnormal by an ad hoc abnormal data detection algorithm. The general procedure, depicted in Figure 3, can be described as follows in the case of a neural network model. Each time a training sample is presented at the input of the model, apply the following steps:
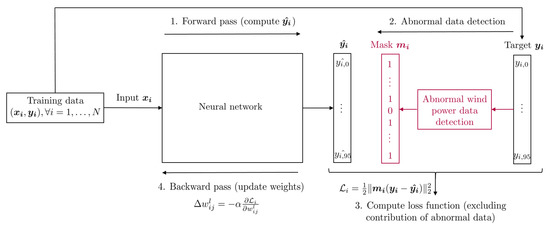
Figure 3.
Strategy for training neural networks in presence of wind power abnormal data.
- Forward pass. Compute , i.e., an estimation of the true forecast .
- Abnormal data detection. Detect abnormal wind power data in the target vector using an ad-hoc data detection algorithm. Reference [38] proposes for instance a two-step algorithm, based on a combination of the changing-point grouping method and the quartile method, for automatically detecting and tagging wind power abnormal data, and that we propose to use in the present work. By doing so, a masking vector , which contains 1 when the data are normal and 0 if the data are considered as abnormal, is created.
- Compute loss function. Compute the loss function , excluding the contribution of components tagged as abnormal data. The classical -norm is in that way modified as follows:
- Backward pass. Update the parameters (i.e., the weights of the neural network, with , , , and with the number of layers in the neural network and the number of neurons in layer l) according to standard backpropagation formula.
2.2. Electricity Consumption Representative Profiles
Forecasting in day-ahead the electricity consumption of individual companies with the required time granularity (quarter hourly in the present case) is a complex task. The consumption of companies in different branches shows indeed a high variance, as exemplified in [39]. An accurate forecast would require therefore explanatory variables which precisely describe the economic activity of the company, and which are therefore difficultly obtainable in practice, mainly for privacy reasons. In that context, researchers tend to aggregate the electricity consumption at an appropriate level before performing the forecasting task (see e.g., [26,34]), or focus on longer time spans (such as [39] in which the authors predict the annual electricity consumption of enterprises).
In this paper, instead of developing pure forecasting models for each company of the community, we propose a method for generating representative electricity consumption profiles for each member, which is solely based on their past consumption data. The method is inspired by [40] and adapted to the present context.
In the following, we assume that a dataset of daily profiles of electricity consumption, sampled at a quarter hourly rate, is available for each member. Each data object is therefore a 96-dimensional vector (). The procedure is explained below for one community member.
- Data preprocessing. We firstly remove from the original dataset data objects with missing data.
- Segmentation of the full dataset according to calendar information. For each community member, we segment the available dataset of quarter hourly electricity consumption according to seasons (spring, ..., winter) and days (Monday, ..., Sunday). By doing so, 28 datasets are generated for each member (7 days in one week times 4 seasons). Official off-days are pooled in a separate dataset, so that 29 datasets () are finally created for each community member.
- Computing representative profiles for each dataset. Then, a representative profile (or prototype) is calculated for each of the 29 datasets of each client. The medoid of each dataset, i.e., the data object for which the sum of distances to all other objects is minimized, is in that way computed:with a dataset of N consumption profiles, and a distance function between two data objects. We use a Dynamic Time Warping (DTW) distance in this work, which is a distance originally developed in the field of speech processing [41] but is now generally employed when comparing time series, and more particularly in shape-based time series clustering [42].
- Generate consumption profiles between two pre-specified dates. Finally, electricity consumption profiles between day d and day are created by 1. generating the sequence of dates between d and and 2. assigning to each date the corresponding medoid (winter Monday profile, summer Tuesday profile, off-day profile, etc.).
3. Use Case and Results
The data analytics modules described in Section 2 are applied in this section on a pilot REC established in Belgium in the framework of the E-Cloud project [17]. We begin by describing the selected use-case (Section 3.1), focus then on the performance of the wind power forecasting module (Section 3.2 and Section 3.3), and finally quantify the impact of the data analytics modules on the behaviour of the community members and on the operation of the REC, by analyzing the evolution of the members self-consumption and self-sufficiency (Section 3.4).
3.1. Use Case Description
The E-Cloud project [17,18], led by ORES (one of the main Walloon DSOs) in collaboration with local private and public entities (Luminus, IDETA, Siemens, DAPESCO, N-Side and the University of Mons- UMONS- ), established a pilot REC in Tournai (Belgium), on an industrial area connected to the Medium Voltage electricity distribution network.
The REC involved 18 members (mainly Small or Medium Enterprises or SMEs) and included 18 of wind power generation (of which a portion of only was allocated to the community, the rest was sold through traditional market processes and wasa therefore out of the scope of the present work), as well as 70 of peak photovoltaic generation, owned by third-party investors (the community itself could however own the generation assets, which will be studied in future works). A temporary derogation was granted by the regional Walloon regulator (’Commission Wallonne Pour l’Energie’, or CWAPE) in order to apply a tailored pricing scheme inside the community; in that way, community members were allowed to purchase, at an advantageous price, (part of) their electricity consumption directly to the local renewable generation when it was available, bypassing the traditional wholesale-retail market structure and favouring local consumption of the local available generation. A distribution key calculated a priori [18] specified the portion of local renewable energy allocated to each community member every quarter of an hour. For the consumption not covered by the local generation, members were free to establish contracts with suppliers in the classical retail market. In the E-Cloud project, thanks to the data analytics modules presented in this paper, community members were furthermore informed in day-ahead of the prospects in terms of renewable energy production, as well as of their own typical electricity consumption profiles at the concerned time of year. They were in that way incentivized to adapt their consumption to local generation via the preferential tariff which was applied in the community.
The project preparatory phase started in 2017, and the pilot was effectively deployed in Tournai, applying the pricing derogation granted by the regulator, from July 2019 to June 2020. During the pilot life, approximately 7500 were produced by local generation, of which 56% have been consumed locally. The total consumption of the 18 involved companies during the full year of the pilot can be observed on Table 1.

Table 1.
Total electricity consumption of the 18 member companies during the pilot (July 2019–June 2020).
3.2. Dealing with Wind Power Abnormal Data
We first demonstrated the efficiency of the original procedure proposed in Section 2.1.2 for dealing with abnormal wind power data in the training of neural network based forecast models. To that end, we leveraged a dataset made available in the framework of the E-Cloud project, consisting of approximately 1.4 years (January 2018–May 2019) of:
- historical wind power data for the wind farm installed in Tournai, sampled at a quarter hourly scale,
- historical meteorological data (wind speed, atmospheric pressure, temperature), sampled at a quarter hourly scale,
- onshore wind power forecasts at the national level, made available publicly by the Belgian Transmission System Operator (TSO) Elia [43] with the objective to benefit market participants and improve the electricity market outcomes [44], sampled at a quarter hourly scale.
The abnormal data detection algorithm [38] presented in Section 2.1.2 was first applied on the farm level wind power curve created using wind power and wind speed data. The outcome of the procedure is depicted in Figure 4, where green circles refer to normal data, and red crosses (blue stars) correspond to abnormal data detected by the quartile method (change point method respectively).
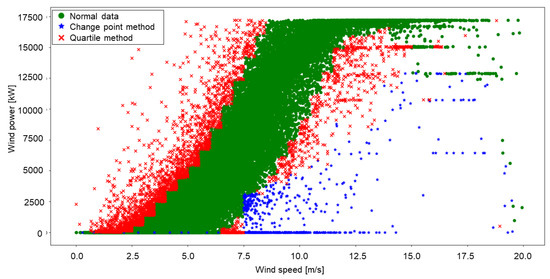
Figure 4.
Abnormal wind power data filtering on the E-Cloud data, according to the procedure exposed in [38]. Normal points are tagged with green circles, and abnormal points are tagged with blue stars (red crosses) if they have been identified using the change point method (quartile method).
The abnormal data points were employed to create masking vectors , which were involved in the modified learning procedure of the wind power neural network forecasting models. A 96-output MultiLayer Perceptron (MLP) which aimed at performing a day-ahead wind power forecast was in that way trained on the dataset depicted above, according to the procedure of Figure 3. More precisely, in accordance with standard text books in Machine Learning [31], a backtesting procedure based on cross-validation and which respected the temporal order of observations, which is common in the field of time series prediction, was performed by decomposing the 1.4 years dataset into three sets: a 13-month training set (January 2018–February 2019) which was used for estimating the model parameters (e.g., the weights of the neural networks, etc.), a 1-month validation set (March 2019) which was employed for tuning model hyperparameters (such as e.g., the number of neurons per layer and the number of layers in neural networks, etc.) and prevent overfitting, as well as a 2-month test set (April–May 2019), for evaluating the model performances on new data that had not been seen previously by the model.
The Python libraries Keras [45] and TensorFlow [46] were employed for implementing and training the neural networks. The Adam optimization algorithm [47], a state-of-the-art variant of stochastic gradient descent, was selected as the training algorithm for estimating the neural network weights. The Tree-structured Parzen Estimator (TPE) approach [48] was employed for optimizing the hyperparameters of the neural network (i.e., the number of hidden layers, the number of neurons in each layer, the size of the input feature vector, etc.), with the help of the Hyperopt Python library [49], which led to an MLP architecture with one hidden layer, 32 neurons, and an input layer including 12 past time steps for the wind power, seven past time steps for the wind speed and the atmospheric pressure, and 31 past time steps for the temperature.
We then compared the performance of the trained neural network in two different configurations, i.e., when masking the contribution of wind power abnormal data during training according to the procedure exposed in Section 2.1.2 (’MLP with mask’), and without applying any masking effect (’MLP without mask’). To that end, we trained 100 neural networks with the best architecture found above, and computed the Root Mean Square Error (RMSE) obtained on the test set by comparing the forecast and the true value of wind power generation. The Adam training algorithm was indeed a stochastic algorithm, which aimed at minimizing a highly non convex cost function, and which thereby ended up in local minima which varied according to different initial conditions, training parameter values, etc. [47]. The average of the RMSEs, as well as the standard deviation, the min and max values of the RMSE, are depicted in Table 2, for the two approaches (with and without mask). It is shown that the masking of wind power abnormal data was able to decerase the average RMSE by approximately 10%, which confirms the interest and efficiency of the proposed methodology.
Table 2.
Strategy for dealing with wind power abnormal data: forecasting performance of the trained MultiLayer Perceptrons (MLPs) with and without the proposed mask.
3.3. Forecasting Performance
The performance of the five day-ahead wind power forecasting models described in Section 2.1.1 is studied in this section. The neural networks models were implemented in Keras [45], using the original training procedure presented in the previous section, and the tree-based models (RF and GBDT) were implemented in Python using the Scikitlearn library [50]. The output of the ENSEMBLE model was simply coded in Python by computing the average of the outputs of the four other models. The same dataset and input features than the previous section were employed, and cross-validation was also performed for the training-evaluation procedure. Figure 5 depicts the wind power forecast obtained with the ENSEMBLE model (in red) as a function of time, as well as the actual wind power generation (in black), for a random day of the test set. One can observe that, even if the forecast error remained clearly visible, the model was most of the time able to correctly capture the time of day when the peak of wind power generation occurred, which is fundamental information for the community members for scheduling their consumption for the upcoming day.
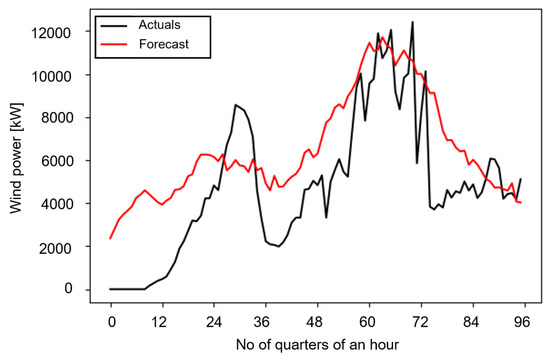
Figure 5.
Time series of wind power forecast and actuals for a day of the test set.
Table 3 shows the RMSE of the five developed forecast models. We observed that the RF model was the individual model which provided the smallest forecast error in this particular application, and that the ENSEMBLE model (which was simply built by taking the average of the four other models), was still able to slightly improve the accuracy. The ENSEMBLE model was therefore selected for the operational deployment described in Section 3.4.
Table 3.
Forecasting performance in terms of Root Mean Square Error (RMSE), for the five local day-ahead wind power forecast models (Random Forest—RF, Gradient Boosting Decision Tree—GBDT, MultiLayer Percpetron—MLP, Bi-LSTM—BLSTM, and ENSEMBLE.
3.4. Impact on the Consumption Behaviour of the Renewable Energy Community Members
The two data analytics modules developed in this work were deployed operationally in the E-Cloud pilot using Mindsphere [51], a cloud-based open IoT operating system developed by Siemens. Each member of the pilot community received a personal access that he used to freely connect to a dedicated web platform using his personal computer, on his own initiative. Each member was in that way able to consult general data such as his own monthly self-consumption or self-sufficiency (see definitions below), as well as the same quantities for the whole community. It is important to mention that personal data from the other community members was hidden, for the sake of privacy. As explained in the previous sections, a common (i.e., the same for each member) day-ahead renewable generation forecast under the form of a quarter hourly time series, which was refreshed every day at 12 pm, was also made available to each member, using the methodology of Section 2.1. Each member was also able to consult a typical consumption profile for the upcoming day, representative of his past consumption at the considered time of year, according to the procedure exposed in Section 2.2. Given the preferential tariff that was in application in the community for the purchase of energy which was locally produced, we expected that the members would take advantage of the information provided by the data modules, on their own initiative, in order to adapt their consumption profiles to local generation, thereby decreasing their energy bill.
The modules became effectively operational from April 2020 to June 2020. A downscaled version of the regional solar forecast made available publicly by the TSO Elia [43] was employed for the 70 kW of solar generation installed in the community, since the absence of metered solar data in the pilot prevented the training of a local solar forecast model. The amount of installed wind generation—1.8MW—was however 20 times higher than installed PV power, which mitigated the necessity to have a very accurate solar forecasting module in this particular case.
We show the impact of the data analytics modules on the behaviour of the community members by computing the monthly self-consumption of members, i.e., the ratio between the member self-consumed energy (i.e., the member electrical energy consumption covered by the local energy which was put at his disposal) and the local energy which was put at his disposal (i.e., the portion of local generation that was allocated to him, according to predefined distribution keys mentioned in Section 3.1), during one month. This first index quantified to what extent the community generation tended to be consumed locally, where it has been produced: a self-consumption of 100% for a member meant for instance that he had consumed all the local renewable generation that was allocated to him for the considered month. The monthly self-consumption of member i during month m was in that way expressed as follows:
with the total energy generated locally in the community during month m, the fraction of that energy that is allocated to member i (constant during the whole pilot), the energy consumed by member i during month m that was covered by , and () the set of community members i (respectively considered months m). It should be noted that if renewable energy was allocated to a member who did not consume it entirely, the corresponding excess of energy was not counted in the numerator of (4).
Similarly, we computed the monthly self-sufficiency of members, i.e., the ratio between the member electrical energy consumption covered by the local generation that was allocated to him and the total energy consumed by the member, again during 1 month. This index shows what part of his electricity consumption the member consumed from local resources, and by extension what part he had to purchase on the traditional retail market: a self-sufficiency of 100% means that the member was able to cover all its consumption with the local generation that was allocated to him during the considered month. Self-sufficiency of member i during month m is in that way computed as follows:
with the total energy consumed by member i during month m.
The left part of Figure 6 shows the monthly self-consumption of the 18 community members during the pilot duration, i.e., from July 2019 to June 2020. It is first very important to note that the data analytics module were effectively deployed on-site in April 2020, one month after the generalized lockdown that occurred in Belgium as a consequence of the COVID-19 crisis. The economic activity of the 18 companies involved in the community suffered in that context from a drastic reduction, which has been materialized by a significant drop of their electricity consumption, while the generation remained unchanged compared to the pre-COVID situation. This explains in the authors opinion why the self-consumption of almost all members significantly decreased starting from March 2020 to May 2020, with a progressive increase in May and June 2020, in line with the progressive removal of lockdown measures that occured in mid-May 2020 in Belgium. This effect masked unfortunately the possible positive impact of the data analytics modules on the behaviour of the community members.
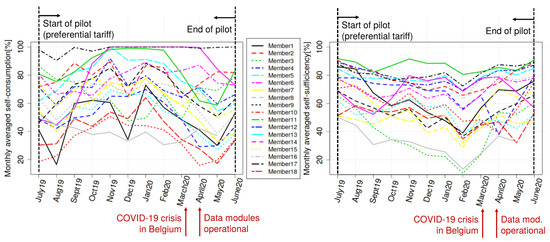
Figure 6.
Monthly self consumption (left) and self-sufficiency (right) of the 18 members of the E-Cloud pilot. The preferential tariff became effective in July 2019, which started the pilot officially, and ended late June 2020. The data analytics modules developed in this work were effectively deployed on site in April 2020, during approximately 3 months.
The right part of Figure 6 depicts the monthly self-sufficiency of each member during the pilot duration, which should be a priori less impacted by the COVID-19 crisis since it is a ratio between two consumptions, namely the member consumption covered by local resources and the member total consumption, which are both expected to decrease in the COVID-19 situation. We observed a global increasing trend in the self-sufficiency of the community members from March to June 2020. It was however not possible to entirely attribute this positive effect to the operational availability of the developed data modules: the effect of the COVID-19 crisis on the trends in self-sufficiency could not be completely discarded, since changes in economic activity may have modified the shape of the daily consumption patterns (due to the temporary suspension of some industrial processes, etc.), which can impact the self-sufficiency as likely. Furthermore, the global increase in terms of self-sufficiency may also be attributed to a yearly seasonal effect, which is possible considering the values in July 2019, at the beginning of the pilot. The time span covered by the pilot, i.e., one year according to the special derogation granted by the Walloon regulator (CWAPE), is however not sufficient to discard or confirm that hypothesis.
Finally, we show in Table 4 the relative change in terms of self-sufficiency for each member between July 2019 and June 2020, in percent. We expect in that way to compare consumer habits at almost one year interval, which can be a better indicator of possible changes in consumption patterns. For 11 out of the 18 members, it appeared that the self-sufficiency decreased, whereas it increased for six members. Again, no significant impact of the data modules on the consumption behaviour was observed (to be more conclusive, July 2020 should have been compared with July 2019, but the pilot was scheduled to end in June 2020 as explained above). The effect of the COVID-19 crisis in June 2020 could not be completely discarded as well, since the economic activity in Belgium had not recovered its pre-COVID intensity in July 2020 yet, at the time of writing.
Table 4.
Change in self-sufficiency between July 2019 and June 2020 for each community member, in percent.
4. Conclusions and Perspectives
This work proposed energy analytics tools to inform the members of Renewable Energy Communities (RECs) of the day-ahead prospects in terms of local renewable energy generation, as well as in terms of electricity consumption profiles which are representative of the members behaviour at the considered time of the year. By doing so, the members were expected to adapt their own consumption patterns to local generation, in order to benefit of advantageous energy pricing mechanisms which prevail in a community.
A localized day-ahead wind power forecasting tool, based on state-of-the-art Machine Learning algorithms, has been developed in that way. The ENSEMBLE model, whose output is computed as the average of the outputs of four other Machine Learning models (Random Forests, Gradient Boosting Decision Trees, a MultiLayer Perceptron and a Bi-directional LSTM) has shown the best forecasting performance on the E-Cloud pilot project data. Forecasting accuracy has been further improved by automatically detecting wind power abnormal data samples and by adapting the training procedure accordingly. A procedure for generating representative electricity consumption profiles of the community members, relying on Dynamic Time Warping (a state-of-the-art Machine Learning distance employed when comparing time series), has further been implemented.
The data modules have been deployed on-site in the framework of the E-Cloud pilot project, on a REC connected to the existing Medium Voltage distribution grid in an industrial area in Belgium, and composed by 18 members (mainly Small and Medium Enterprises or SMEs) and by local generation (mainly wind power). The information provided by the data modules was freely available to the community members by connecting to a dedicated web platform on their own initiative. Global quantities, such as the monthly self-sufficiency and self-consumption of the community members, have been computed to quantify the impact of the data modules on the consumption behaviour of the community members. We were not able however to highlight significant changes in the consumer habits. It is worth mentioning though that the general lockdown that occurred in Belgium in March 2020 due to the COVID-19 crisis significantly affected the results, especially knowing that the data modules became operational for the first time in April 2020, during lockdown. Yearly seasonal effects were furthermore observed in the self-sufficiency patterns, which further masked the potential benefits of the deployed data modules. We recommend therefore to extend in accordance with the local regulator the duration of similar REC pilots to more than one year, in order to better understand these yearly seasonal effects, and to better quantify the impact on the members consumption behaviour. Furthermore, we strongly encourage researchers and industrials that will implement similar pilot RECs in the future to establish a system for monitoring the usage of the displayed information by the community members (for instance by recording the number of connections to the dedicated web platform), in order to quantify and possibly stimulate their interest in the provided tools.
As a first perspective, we intend to deploy a pilot REC for a longer time span, with an active monitoring of the members interest in the available tools, in order to confirm/infirm the hypotheses raised in this work. This is however a slow process, since temporary derogations by the local regulator are mandatory currently in Belgium for applying a community-based pricing scheme. We further aim at building another pilot REC in a residential area, in order to analyze the behaviour of domestic consumers. We finally intend to improve the accuracy of the wind power forecasting module by using turbine-level data in the model definition, and by adapting the learning procedure of tree-based algorithms to the presence of wind power abnormal data. We also intend to focus our research effort on the correct prediction of peaks of generation, since the community benefits are optimized when members shift their consumption to generation peak times, and on the recalibration of the wind power forecasting models in the flavour of [52].
Author Contributions
Conceptualization, Z.D.G. and D.V.; Data curation, J.B. and A.A.; Methodology, Z.D.G., J.B., A.W., P.-D.D. and J.-F.T.; Project administration, Z.D.G. and D.V.; Resources, D.V. and F.V.; Supervision, F.V.; Validation, D.V. and A.A.; Writing—original draft, Z.D.G.; Writing—review & editing, J.B., D.V., A.A., J.-F.T. and F.V.. All authors have read and agreed to the published version of the manuscript.
Funding
This research has been funded by ORES. J.-F. Toubeau is supported by F.R.S./FNRS (Belgian National Fund of Scientific Research).
Acknowledgments
The authors would like to thank the participants of the E-Cloud project for their valuable inputs to the present study: ORES, Luminus, IDETA, Siemens, N-Side, DAPESCO.
Conflicts of Interest
The authors declare no conflict of interest.
References
- EPEX Spot. Available online: https://www.epexspot.com/en (accessed on 10 July 2020).
- Elia Group. Towards a Consumer-Centric Electric System. 2018. Available online: https://www.elia.be/-/media/project/elia/elia-site/company/publication/studies-and-reports/studies/elia-vision-paper-2018_front-spreads-back.pdf (accessed on 15 February 2020).
- Pinson, P.; Baroche, T.; Moret, F.; Sousa, T.; Sorin, E.; You, Z. The Emergence of Consumer-Centric Electric Markets. 2018. Available online: http://pierrepinson.com/docs/pinsonetal17consumercentric.pdf (accessed on 10 January 2020).
- Parag, Y.; Sovacool, B.K. Electrcity market design for the prosumer era. Nat. Energy 2016, 1, 16032. [Google Scholar] [CrossRef]
- Crosby, M. An Airbnb or Uber for the Electricity Grid? How DERs Prepare the Power Sector to Evolve into a Sharing Economy Platform. RMI Outlet Blog: Rocky Mountain Institute. Available online: https://rmi.org/airbnb-uber-electricity-grid/ (accessed on 10 July 2020).
- Moret, F.; Pinson, P. Energy Collectives: A Community and Fairness Approach to Future Electricity markets. IEEE Trans. Power Syst. 2019, 34, 3994–4004. [Google Scholar] [CrossRef]
- Duschene, L.; Cornélusse, B.; Savelli, I. Sensitivity analysis of a local market model for community microgrids. In Proceedings of the PowerTech Conference (PowerTech2019), Milan, Italy, 23–27 June 2019. [Google Scholar]
- Hupez, M.; De Grève, Z.; Vallée, F. Cooperative demand-side management scenario for the low-voltage network in liberalised electricity markets. IET Gener. Transm. Distrib. 2018, 12, 5990–5999. [Google Scholar] [CrossRef]
- Hupez, M.; Toubeau, J.-F.; De Grève, Z.; Vallée, F. A New Cooperative Framework for a Fair and Cost-Optimal Allocation of Resources within a Low Voltage Electricity Community. IEEE Trans. Smart Grids. Under Review.
- Morstyn, T.; McCulloch, M. Multiclass energy management for peer-to-peer energy trading driven by prosumer preferences. IEEE Trans. Power Syst. 2019, 34, 2005–2014. [Google Scholar] [CrossRef]
- Cadre, H.L.; Jacquot, P.; Wan, C.; Alasseur, C. Peer-to-peer electricity market analysis: from variational to Generalized Nash equilibrium. Eur. J. Oper. Res. (EJOR) 2020, 282, 753–771. [Google Scholar] [CrossRef]
- Directive (EU) 2018/2001 of the European Parliament and of the Council of 11 December 2018 on the Promotion of the Use of Energy from Renewable Sources. Available online: https://eur-lex.europa.eu/legal-content/EN/TXT/?uri=uriserv:OJ.L_.2018.328.01.0082.01.ENG&toc=OJ:L:2018:328:TOC (accessed on 5 April 2020).
- Walloon Parliament-Belgium, Décret modifiant les décrets des 12 avril 2001 relatif à l’organisation du marché régional de l’électricité, du 19 décembre 2002 relatif à l’organisation du marché régional du gaz et du 19 janvier 2017 relatif à la méthodologie Tarifaire Applicable aux Gestionnaires de réseau de Distribution de gaz et d’électricité en vue de Favoriser le déVeloppement des Communautés d’énergie Renouvelable. April 2019. Available online: https://wallex.wallonie.be/contents/acts/19/19007/1.html (accessed on 10 February 2020).
- French Parliament. Loi du 8 Novembre 2019 Relative à l’énergie et au climat. 8 November 2019. Available online: https://www.vie-publique.fr/loi/23814-loi-energie-et-climat-du-8-novembre-2019 (accessed on 10 February 2020).
- Gazzetta Ufficiale Della Republica Italiana. Conversione in legge, con modificazioni, del decreto-legge 30 dicembre 2019, n. 162, recante disposizioni urgenti in materia di proroga di termini legislativi, di organizzazione delle pubbliche amministrazioni, nonche di innovazione tecnologica (20G00021). 28 February 2020. Available online: https://www.gazzettaufficiale.it/eli/id/2020/02/29/20G00021/sg (accessed on 10 July 2020).
- cVPP—Community-Based Virtual Power Plant: A Novel Model of Radical Decarbonisation Based on Empowerment of Low-Carbon Community Driven Energy Initiatives. Interreg NW Europe, 2017–2020. Available online: https://www.nweurope.eu/projects/project-search/cvpp-community-based-virtual-power-plant/ (accessed on 15 May 2020).
- ”L’« E-Cloud »: l’autoconsommation collective au service des entreprises, avec des perspectives d’économie sur la facture d’électricité de 8 à 14%“, Cluster TWEED, August 2019. Available online: https://clusters.wallonie.be/tweed-fr/08-08-2019-l-e-cloud-l-autoconsommation-collective-au-service-des-entreprises-avec-des-perspectives-d-economie-sur-la-fa.html?IDC=6928&IDD=121138 (accessed on 25 March 2020).
- Vangulick, D.; Cornélusse, B.; Vanherck, T.; Devolder, O.; Lachi, S. E-CLOUD, the open microgrid in existing network infrastructure. In Proceedings of the 24th International Conference & Exhibition on Electricity Distribution (CIRED2017), Glasgow, UK, 12–15 June 2017; pp. 2703–2716. [Google Scholar]
- Jacquot, P.; Beaude, O.; Gaubert, S.; Oujdane, N. Analysis and implementation of an hourly billing mechanism for demand response management. IEEE Trans. Smart Grids 2019, 10, 4265–4278. [Google Scholar] [CrossRef]
- Rahi, G.E.; Etesami, S.R.; Saad, W.; Mandayam, N.; Poor, H.V. Managing price uncertainty in prosumer-centric energy trading: A prospect-theoretic Stackelberg game approach. IEEE Trans. Smart Grids 2019, 10, 702–713. [Google Scholar] [CrossRef]
- Abada, I.; Ehrenmann, A.; Lambin, X. Unintended consequences, the snowball effect of energy communities. Energy Policy 2020, 143, 14. [Google Scholar] [CrossRef]
- Conejo, A.; Morales, J.M.; Baringo, L. Real time demand response model. IEEE Trans. Smart Grids 2010, 1, 236–242. [Google Scholar] [CrossRef]
- Atzeni, I.; Ordonez, L.G.; Scutari, G.; Palomar, D.P.; Fonollosa, J.R. Demand-side management via distributed energy generation and storage optimization. IEEE Trans. Smart Grids 2013, 4, 866–876. [Google Scholar] [CrossRef]
- Maheshwari, Z.; Ramakumar, R. A framework for intelligent control of SIRES in rural commuities. In Proceedings of the 2017 IEEE Power & Energy Society General Meeting (PESGM), Chicago, IL, USA, 16–20 July 2017. [Google Scholar] [CrossRef]
- AlSkaif, T.; Schram, W.; Litjens, G.; van Sark, W. Smart charging of community storage units using Markov chains. In Proceedings of the 2017 IEEE PES Innovative Smart Grid Technologies Conference Europe (ISGT-Europe), Torino, Italy, 26–29 September 2017. [Google Scholar] [CrossRef]
- Zou, L.; Munir, M.S.; Kim, K.; Hong, C.S. Day-ahead Energy Sharing Schedule for the P2P Prosumer Community Using LSTM and Swarm Intelligence. In Proceedings of the 2020 International Conference on Information Networking (ICOIN), Barcelona, Spain, 7–10 January 2020. [Google Scholar] [CrossRef]
- Jia, K.; Liu, B.; Iyogun, M.; Bi, T. Smart control for battery energy storage system in a community grid. In Proceedings of the 2014 International Conference on Power System Technology, Chengdu, China, 20–22 October 2014. [Google Scholar] [CrossRef]
- Wang, G. Lyapunov Optimization Based Online Energy Flow Control for Multi-energy Community Microgrids. In Proceedings of the 2019 IEEE PES GTD Grand International Conference and Exposition Asia (GTD Asia), Bangkok, Thailand, 19–23 March 2019. [Google Scholar] [CrossRef]
- Llanos, J.; Saez, D.; Palma-Behnke, R.; Nunez, A.; Jimenez-Estéves, G. Load profile generator and load forecasting for a renewable based microgrid using Self Organizing Maps and neural networks. In Proceedings of the 2012 International Joint Conference on Neural Networks (IJCNN), Brisbane, Australia, 10–15 June 2015. [Google Scholar] [CrossRef]
- Hong, T.; Xie, J.; Black, J. Global energy forecasting competition 2017: Hierarchical probabilistic load forecasting. Int. J. Forecast. 2019, 35, 1389–1399. [Google Scholar] [CrossRef]
- Hastie, T.; Tibshirani, R.; Friedman, J. The Elements of Statistical Learning: Data Mining, Inference, and Prediction; Springer: New York, NY, USA, 2009. [Google Scholar]
- Hochreiter, S.; Schmidhuber, J. Long Short-Term Memory. Neural Comput. 1997, 9, 1735–1780. [Google Scholar] [CrossRef] [PubMed]
- Schuster, M.; Paliwal, K.K. Bidirectional Recurrent Neural Networks. IEEE Trans. Signal Process. 1997, 45, 2673–2681. [Google Scholar] [CrossRef]
- Toubeau, J.-F.; Bottieau, J.; Vallée, F.; De Grève, Z. Deep Learning-based Multivariate Probabilistic Forecasting for Short-Term Scheduling in Power Markets. IEEE Trans. Power Syst. 2019, 34, 1203–1215. [Google Scholar] [CrossRef]
- Toubeau, J.-F.; Bottieau, J.; Vallée, F.; De Grève, Z. Improved day-ahead predictions of load and renewable generation by optimally exploiting multi-scale dependencies. In Proceedings of the 7th IEEE Conf. Innovative Smart Grid Technology, Torino, Italy, 26–29 September 2017. [Google Scholar]
- Breiman, L. Random Forests. Mach. Learn. 2001, 45, 5–32. [Google Scholar] [CrossRef]
- Chen, T.; Guestrin, C. XGboost: A scalable tree boosting system. In Proceedings of the 22nd ACM SIGKDD International Conference on Knowledge Discovery and Data Mining, San Francisco, CA, USA, 13–17 August 2016; pp. 785–794. [Google Scholar]
- Shen, X.; Fu, X.; Zhou, C. A combined algorithm for cleaning abnormal data of wind turbine power curve based on change point grouping algorithm and quartile algorithm. IEEE Trans. Sustain. Energy 2019, 10, 46–54. [Google Scholar] [CrossRef]
- Stingl, C.; Hopf, K.; Staake, T. Explaining and predicting annual electricity demand of enterprises—A case study from Switzerland. Energy Inform. 2018, 1. [Google Scholar] [CrossRef]
- Aguas, A. EDPD’S experience with data analytics and stochastic simulation methods for risk-controlled network planning. In Proceedings of the 25th International Conference on & Exhibition on Electricity Distribution (CIRED2018), Ljublana, Slovenia, 7–8 June 2018. [Google Scholar]
- Sakoe, H.; Chiba, S. Dynamic programming algorithm optimization for spoken word recognition. IEEE Trans. Acoust. Speech Signal Process. 1978, 26, 43–49. [Google Scholar] [CrossRef]
- Aghabozorgi, S.; Shirkhorshidi, A.S.; Wah, T.Y. Time-Series Clustering—A Decade Review. Inf. Syst. 2015, 53, 16–38. [Google Scholar] [CrossRef]
- Available online: https://www.elia.be/fr/donnees-de-reseau/production/donnees-de-production-eolienne (accessed on 10 July 2019).
- Exizidis, L.; Kazempour, J.; Pinson, P.; De Grève, Z.; Vallée, F. Impact of public aggregate wind forecasts on electricity market outcomes. IEEE Trans. Sustain. Energy 2017, 8, 1394–1405. [Google Scholar] [CrossRef]
- Chollet, F. Keras, Github. 2015. Available online: https://github.com/fchollet/keras (accessed on 20 July 2019).
- Abadi, M. Tensorflow: A system for large-scale machine learning. In Proceedings of the 12th USENIX Symposium on Operating Systems Design and Implementation (OSDI’16), Savannah, GA, USA, 2–4 November 2016; pp. 265–283. [Google Scholar]
- Kingma, D.P.; Ba, J. Adam: A Method for Stochastic Optimization. In Proceedings of the 3rd International Conference for Learning Representations (ICLR2015), San Diego, CA, USA, 7–9 May 2015. [Google Scholar]
- Bergstra, J.; Bardenet, R.; Bengio, Y. Algorithms for hyperparameter optimization. In Advances in Neural Information Processing Systems 24; Curran Associates Inc.: Dutchess County, NY, USA, 2011; pp. 2546–2554. [Google Scholar]
- Bergstra, J.; Komer, B.; Eliasmith, C.; Yamins, D.; Cox, D.D. Hyperopt: A Python library for model selection and hyperparameter optimization. Comput. Sci. Discov. 2015, 8, 014008. [Google Scholar] [CrossRef]
- Pedregosa, F. Scikit-learn: Machine Learning in Python. J. Mach. Learn. 2011, 12, 2825–2830. [Google Scholar]
- Siemens. MindSphere, the Cloud-Based, Open IoT Operating System. Available online: https://siemens.mindsphere.io/en (accessed on 10 September 2019).
- Toubeau, J.-F.; Dapoz, P.-D.; Bottieau, J.; Wautier, A.; De Grève, Z.; Vallée, F. Recalibration of Recurrent Neural Networks for Short-Term Wind Power Forecasting. Electr. Power Syst. Res. 2020, 190, 1–7. [Google Scholar] [CrossRef]


© 2020 by the authors. Licensee MDPI, Basel, Switzerland. This article is an open access article distributed under the terms and conditions of the Creative Commons Attribution (CC BY) license (http://creativecommons.org/licenses/by/4.0/).