Article

Investigation of the Spray Development Process of Gasoline-Biodiesel Blended Fuel Sprays in a Constant Volume Chamber

1
Division of Mechanical Convergence Engineering, Silla University, 140 Baegyang-daero(Blvd), 700beon-gil(Rd.), Sasang-Gu, Busan 46958, Korea
2
School of Mechanical Engineering, University of Ulsan, San 29, Mugeo2-dong, Nam-gu, Ulsan 44610, Korea
*
Author to whom correspondence should be addressed.
Energies 2020, 13(18), 4819; https://doi.org/10.3390/en13184819
Submission received: 20 August 2020 / Revised: 9 September 2020 / Accepted: 10 September 2020 / Published: 15 September 2020

Abstract

:
This study investigated gasoline–biodiesel blended fuel (GB) subjected to a fuel spray development process on macroscopic and microscopic scales. The four tested fuels were neat gasoline and gasoline containing biodiesel (5%, 20%, and 40% by volume) at three different ratios. The initial spray near the nozzle revealed that the spray penetration and spray tip velocity both decreased with decreasing biodiesel blending ratio. In addition, the different spray tip velocities at the start of spraying result in different atomization regimes between the fuels. The GB fuels with a low biodiesel blending ratio were disadvantaged in terms of spray atomization due to their lower spray penetration and tip velocity. The macroscopic spray penetration changes were similar to those observed in the microscopic spray. The fuel with the lower biodiesel blending ratio had a larger spray cone angle, indicating increased radial spray dispersion.

1. Introduction

Fuel spray research is a key pathway to further enhance knowledge of combustible mixture formation, combustion processes, and emissions of an internal combustion engine. Better spray knowledge will motivate researchers to investigate critical parameters to optimize the next generation of fuel efficient, high-power, low-emission engines. Some of the optimization processes for more efficient combustion and reduced emission levels are directly dependent on an experimental approach and scientific understanding of spray phenomenology. Research on fuel injection has a very small time domain and is highly dependent on the thermodynamic state of the environment, including the ambient pressure, density, temperature, and other factors related to the air–fuel mixture and geometry of the injector nozzle. Fuel spray relevant to compression ignition (CI) engines has been studied experimentally and numerically for more than several decades [1,2], where much of the knowledge has been gained from an optically accessible engine and combustion chamber. More extensive focus has been drawn to macroscopic spray and well-established empirical co-relationships were proposed [3]. Macroscopic spray is appropriate for overall shape prediction, but visualization is not able to capture the instabilities, initial formation of droplets and ligaments, and their subsequent breakup. This intrinsically stochastic spray was further captured on the microscopic scale and several studies have been reported for diesel fuel [4,5].
Gasoline-like fuels have higher volatility and lower ignitability compared to diesel-like fuels. Gasoline-like fuels are referred to as low reactivity fuels due to their low ignitability. [5]. Gasoline-like fuels are referred to as low reactivity fuels due to their low ignitability. Gasoline-like fuels that perform with high ignition delays, leading to longer mixing times due to their low reactivity, have recently been tested in advanced combustion strategies to improve the mixing of fuel and air [6,7,8,9,10,11]. It was reported that gasoline-like fuels are advantageous in achieving mid-to-high load conditions with significantly low fuel consumption and emissions, but with high emissions of HC and CO and combustion instability under low load conditions. These problems under low loads are due to the excessively high resistance of gasoline fuels to auto-ignition and thus, many researchers have found that fuels with octane numbers of about 70–80, which are lower than conventional high-octane fuels, are more suitable than high-octane fuels for gasoline CI engines [10,11,12,13,14]. Therefore, a number of researchers have tested dieseline, which is a mixture of diesel and gasoline, in CI engines. Zhang et al. [15] used dieseline to conduct a direct injection study. Although fuel blends may add complexity, they provide researchers a design and control tool for fuel properties. Direct mixing of gasoline and diesel before injection can avoid stratification in the cylinder, along with the benefit of minimal modification to current injection systems. However, researchers must thoroughly study their combined chemical and physical properties.
Biodiesel is a highly viscous, oxygenated, and renewable fuel [16]. To reduce emissions and ensure energy security, modern engine manufacturers focus on the use of biodiesel and biodiesel blends with fossil fuels, according to the regulatory mandates of biofuel utilization in the Renewable Fuel Standard (RFS) program by the Environmental Protecting Agency (EPA) [17,18,19]. The most common biodiesel blends described in the alternative fuel data center are B6 to B20 (6% to 20% biodiesel blended with petroleum diesel, respectively) and B5 (5% biodiesel, 95% petroleum diesel) [20].
The lower volatility of biodiesel compared to diesel fuel promotes its longer liquid spray penetration. Tang et al. compared the initial spray development process near the nozzle of a di-n-butyl ether/biodiesel blend of diesel and soybean biodiesel [21]. They calculated the penetration, projected area, and spray cone angle for the initial spray and concluded that the biodiesel spray generated the worst spray atomization due to its high density and surface tension. Other researchers have reported similar conclusions based on comparisons of different fuels via microscopic investigations [22,23,24]. Due to biodiesel’s high oxygen content, complete combustion is possible. Adams et al. [18] studied the effect of biodiesel–gasoline blends on gasoline compression ignition (GCI) combustion by examining 5 and 10% biodiesel blends using a partially premixed, split-injection strategy. They observed that these additions of biodiesel significantly reduced the intake temperature requirement. They also concluded that higher NOx and lower CO and UHC (unburned hydrocarbon) quantities were emitted, due to gasoline’s higher average spatial bulk temperature. Hoang used preheating to improve physical and chemical properties of biodiesel such as reducing high viscosity and surface tension. Mo et al. mixed butanol in biodiesel. They reported the result of improved atomization as the amount of air introduced into the spray was increased due to the change in the physical properties of the biodiesel [25]. Ma et al. mixed n-pentanol in biodiesel and applied preheating [26]. In particular, when the content of pentanol was high and the temperature was high, spray atomization was highly improved [24]. Das et al. reported that spray tip penetration was dramatically decreased when biodiesel was mixed with gasoline because of lower density and kinematic viscosity. They also revealed that the spray cone angle was highly affected by the gasoline percentage due to the change in radial momentum [27]. Zhong et al. reported that due to the high vaporization of gasoline, the spray resistance to air was weakened, so that diffusion in the direction of the spray radius occurred quickly [28]. Fu et al. reported that spray tip penetration and spray cone angle were highly affected by di-n-butyl ether composition in blended fuel. They revealed that a high di-n-butyl ether composition could improve spray atomization of biodiesel [23,29]. Yanuandri compared GB20 (gasoline 80%, biodiesel 20%) and diesel fuel modes in a single-cylinder diesel engine to investigate the peak pressure rise rate, combustion phasing, ignition delay, and NOx and HC emissions [30]. They observed a shorter ignition delay and lower HC emissions using GB20. This finding indicates that biodiesel has a strong potential to solve several problems in GCI engine applications, such as low lubricity when blended with gasoline. When biodiesel and gasoline are mixed and applied to CI engines, two fuels can help complete combustion in a way that offsets each other’s weaknesses. Biodiesel can improve the ignitability of gasoline, and gasoline can help blended fuel vaporize better. Yanuandri [31] also studied a 5% biodiesel blend with gasoline under pilot and main injection strategies and observed that GB05 offered better combustion stability. Zhong et al. reported that a higher gasoline ratio caused longer ignition delays and lift off length due to the high octane number characteristic [28]. Ma et al. reported that gasoline blending in biodiesel decreased soot emission. They found that flame intensity from soot incandescence was weakened when the gasoline composition was high [24]. Because the use of blended fuels of biodiesel and gasoline is becoming increasingly common, it is important to understand the spray development process under different biodiesel fractions.
As investigated above, biodiesel-gasoline blended fuel can improve GCI engine performance by complementing each fuel’s weaknesses. A study on the spray characteristics of biodiesel and gasoline mixed fuel was partially conducted as previously investigated. It was reported that the shape of the spray may change macroscopically as the characteristics of the fuel change as gasoline is mixed. However, there is a lack of studies that have analyzed the initial spray development and atomization characteristics through a microscopic visualization analysis of the spray characteristics. In this study, by changing the biodiesel content and the injection pressure of the fuel, the authors tried to analyze the relation between the spray velocity and the atomization characteristics at the very beginning of the mixed fuel spray development process. In addition, the macroscopic spray characteristics were also measured, and the macroscopic characteristics and microscopic characteristics were coupled, compared, analyzed, and their relevance was confirmed.

2. Experimental Setup and Conditions

2.1. Fuel Properties

The pure gasoline utilized during the experimental process was commercial grade gasoline fuel obtained from the local distribution network (S-oil, South Korea). The biodiesel used in this study was also a commercial product and was extracted from soybeans. The biodiesel was produced by a reaction of vegetable oils or animal fats with methanol or ethanol in the presence of sodium hydroxide. This is the most common method of biodiesel production. Neat gasoline and three different gasoline-biodiesel blends were tested in this study and the blending method was performed through volume mixing rules. Neat gasoline is denoted by GB00 and 5%, 20%, and 40% concentration (by volume) of the biodiesel in the blends are denoted as GB05, GB20, and GB40, respectively. The letters G and B represent gasoline and biodiesel, respectively, and the numbers indicate the percentage content (by volume) of biodiesel in the blends. Experimental fuel temperatures were initially stored in a Lab Companion temperature and humidity chamber for 1–2 days and the fuel blends were then prepared using an adequate shaking and rotary mixing process for 5–10 min to prepare a homogenous mixture prior to the experiment. All physical properties except cetane number and surface tension were measured according to the Korea Institute of Petroleum Authority (K-Petro) protocols, and are listed in Table 1. As shown in Table 1, since the cetane number and surface tension values are referenced in the literature, there may be differences from the physical properties of the fuel used in the actual experiment. Physical properties were remarkably varied according to the blending ratio. Density, kinematic viscosity and surface tension linearly increased with an increased biodiesel blending ratio.

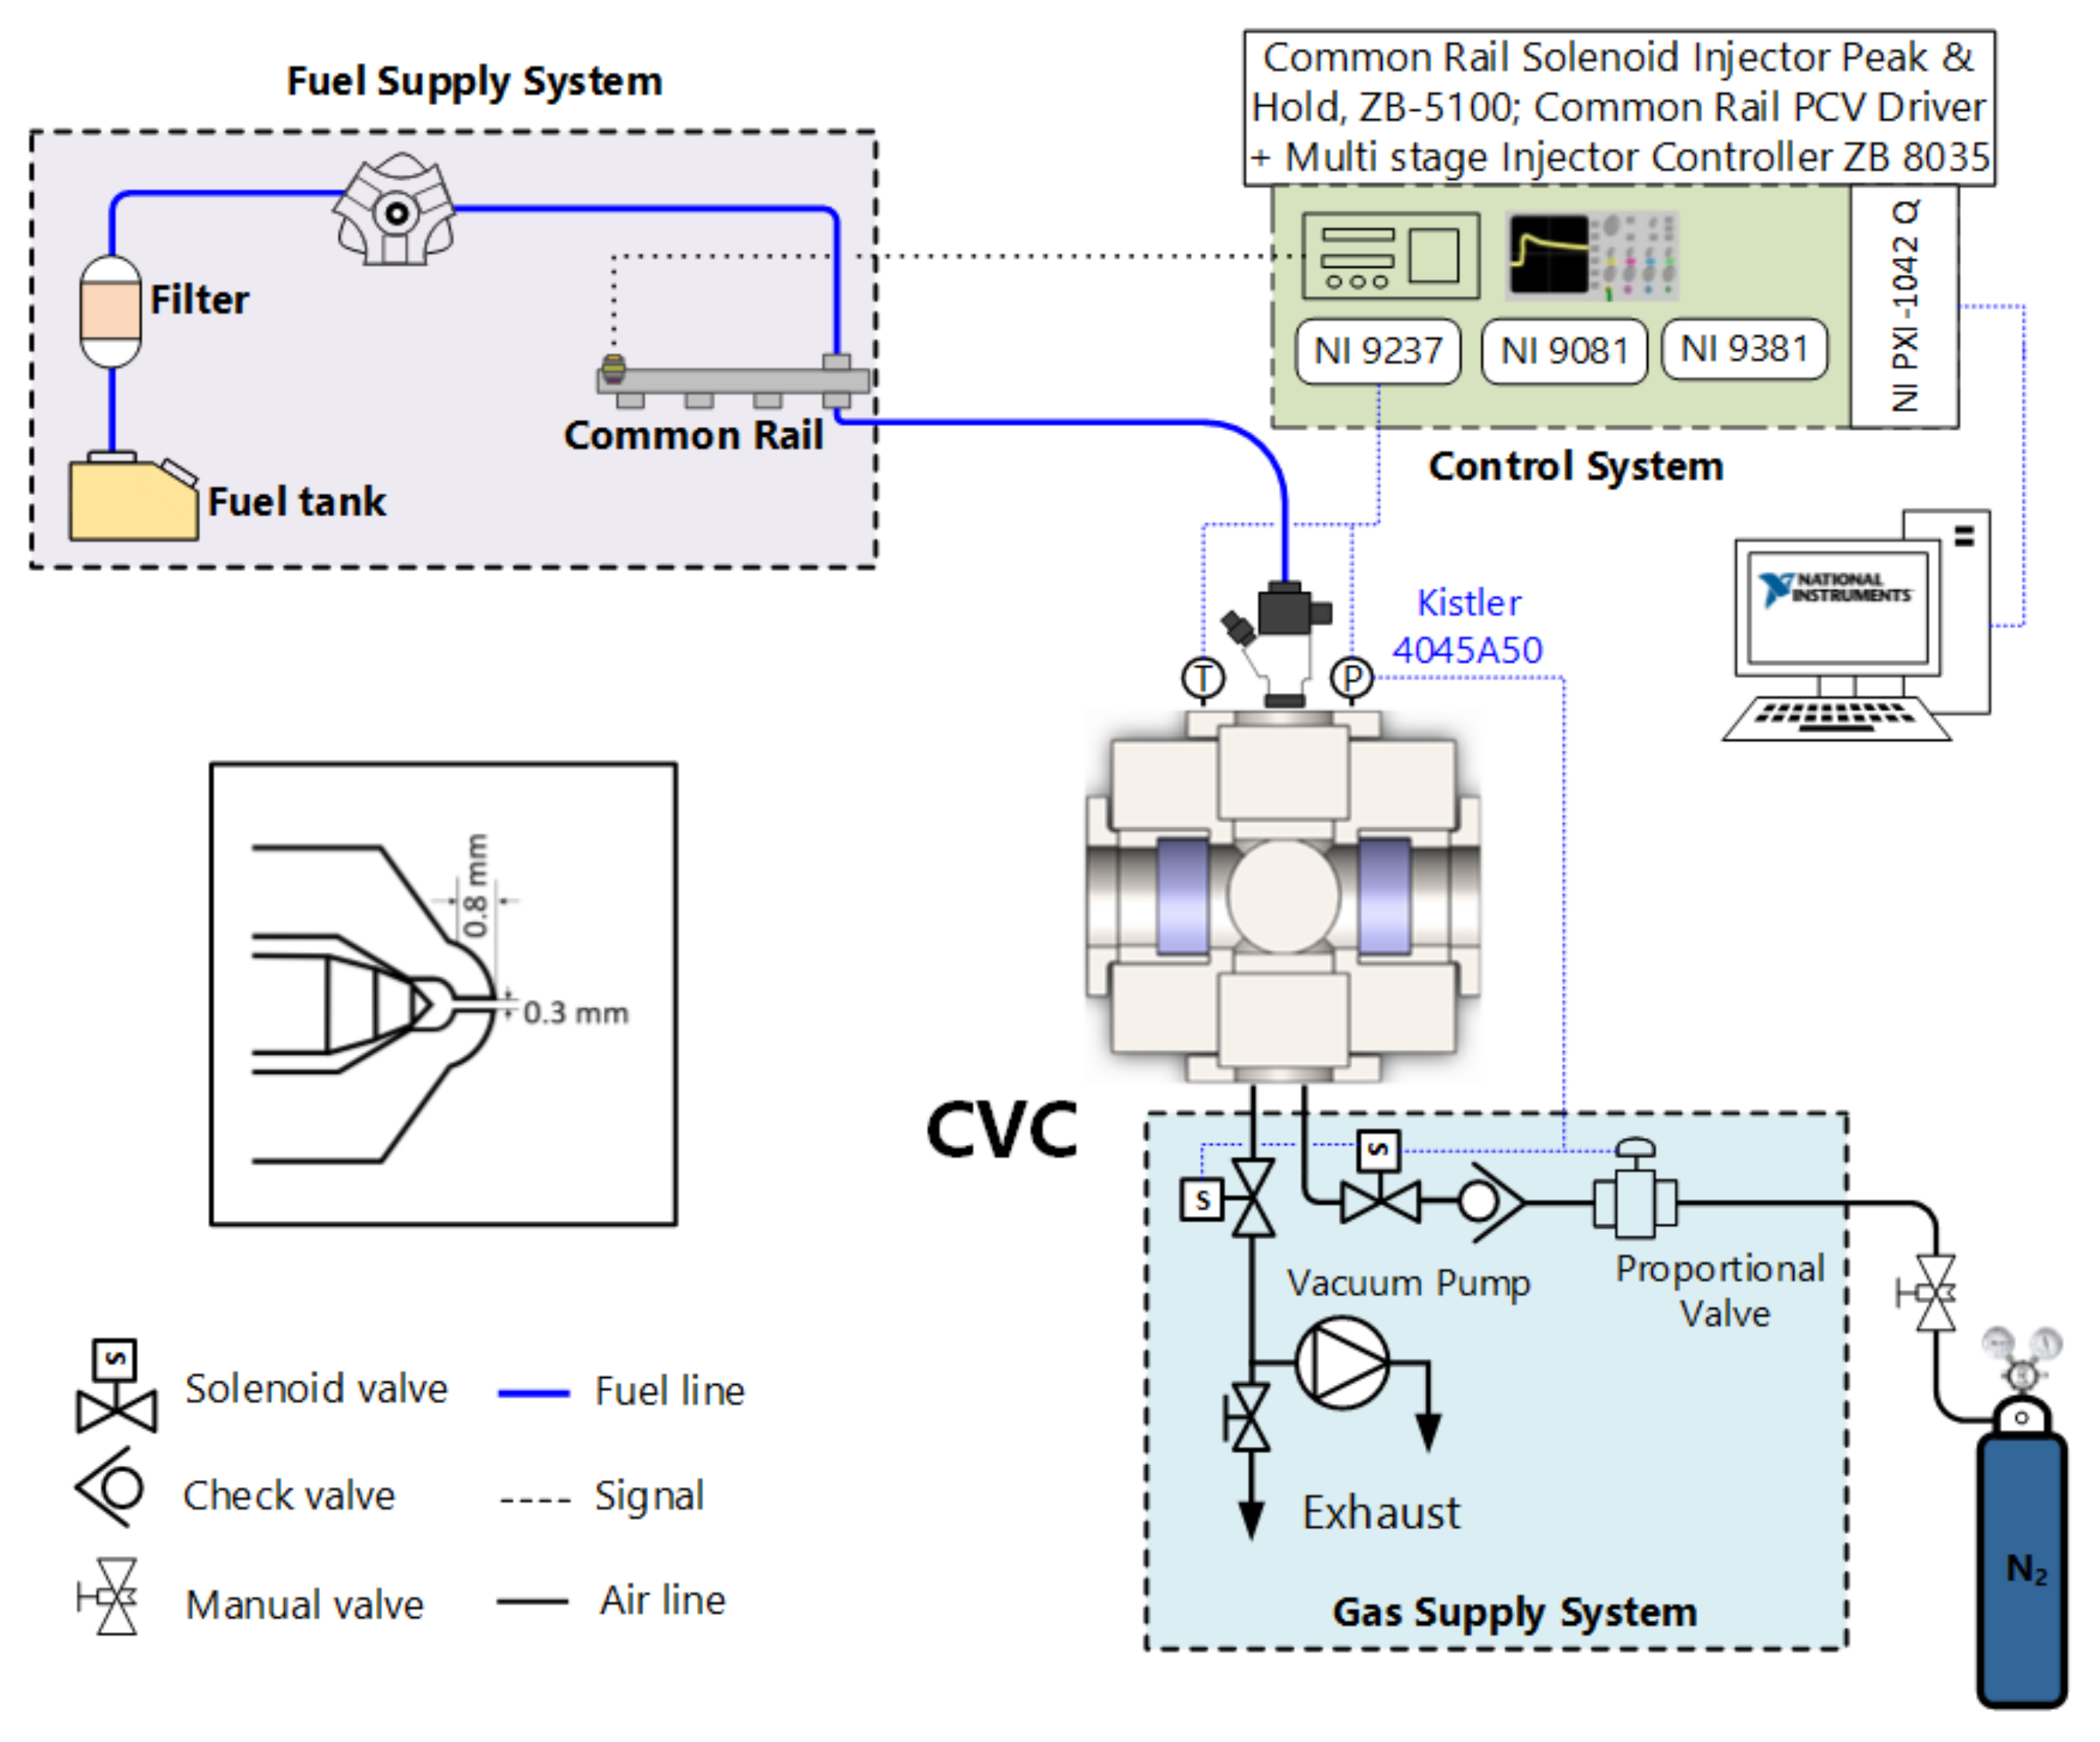
2.2. Materials and Method

A schematic diagram of the experimental setup is shown in Figure 1. A high-pressure common-rail system was used for the fuel injection. The fuel pressure was controlled by a common-rail PCV (pressure control valve) driver (ZB-1100, Zenobalti) while the injection timing and duration were controlled by a multistage injection engine controller (ZB-8035, Zenobalti) combined with a common-rail solenoid injector peak-and-hold driver (ZB-5100, Zenobalti). We used a research grade single-hole injector. The nozzle orifice was cylindrical with a diameter of 300 μm and a length of 800 μm.
The fuel was injected into a cylindrically shaped constant-volume chamber (CVC) having an internal volume of 1.1 L. Two facing sides of the chamber were installed with quartz windows with diameters of 80 mm to enable optical visualization. The fuel injector was placed in the combustion chamber such that the injected fuel propagated along the horizontal axis of the chamber from left to right during the spray development.
The experimental conditions and optical setup for the spray visualization are summarized in Table 2. As described in Section 2.1, we examined four different types of fuels in this study. The fuel injection duration was fixed at 1,000 µs, regardless of the injection pressure, to ensure that the spray reached quasi-steady state conditions.
Schematic diagrams of the microscopy and macroscopy optical arrangements are shown in Figure 2. A diode pump solid state laser (532 nm) was used as the light source for the spray illumination. The diffused back-illumination method was used to obtain the microscopic spray images. A long-distance microscope lens (K2 DistaMax, Infinity) was mounted in front of the high-speed camera (SA 1.1 675K-C1, Photron). The images were obtained with a resolution of 1024 × 752 pixels at a speed of 8000 fps using a high-speed camera. We selected an exposure time of 0.37 µs to capture the microscopic spray images with well-defined boundaries, spray tips, and sharp edges.
Because the microscopic images are enlarged views in the vicinity of the nozzle and feature very high magnification, a speed of 8000 fps might not be sufficient for a comprehensive study. Therefore, we captured several images with different initial delays, as shown in Figure 3. These images with different initial delays were post-processed and aligned into the same time domain, which provided an equivalent image acquisition rate of 80,000–250,000 fps, according to the injection pressure conditions. The post-processed results were also appropriately aligned to the same time domain for better understanding of the temporal evolution of the spray.
We visualized the macroscopic spray using z-type focus shadowgraphs. The point-source laser light was magnified to a certain circular beam with a series of plano concave lenses and two concave mirrors (diameter of 150 mm and focal length of 2000 mm) to create the z-shape arrangement. We captured the images using a 200 mm lens (aperture set to f/2.5) with a resolution of 512 × 256 pixels at a speed of 40,000 fps.

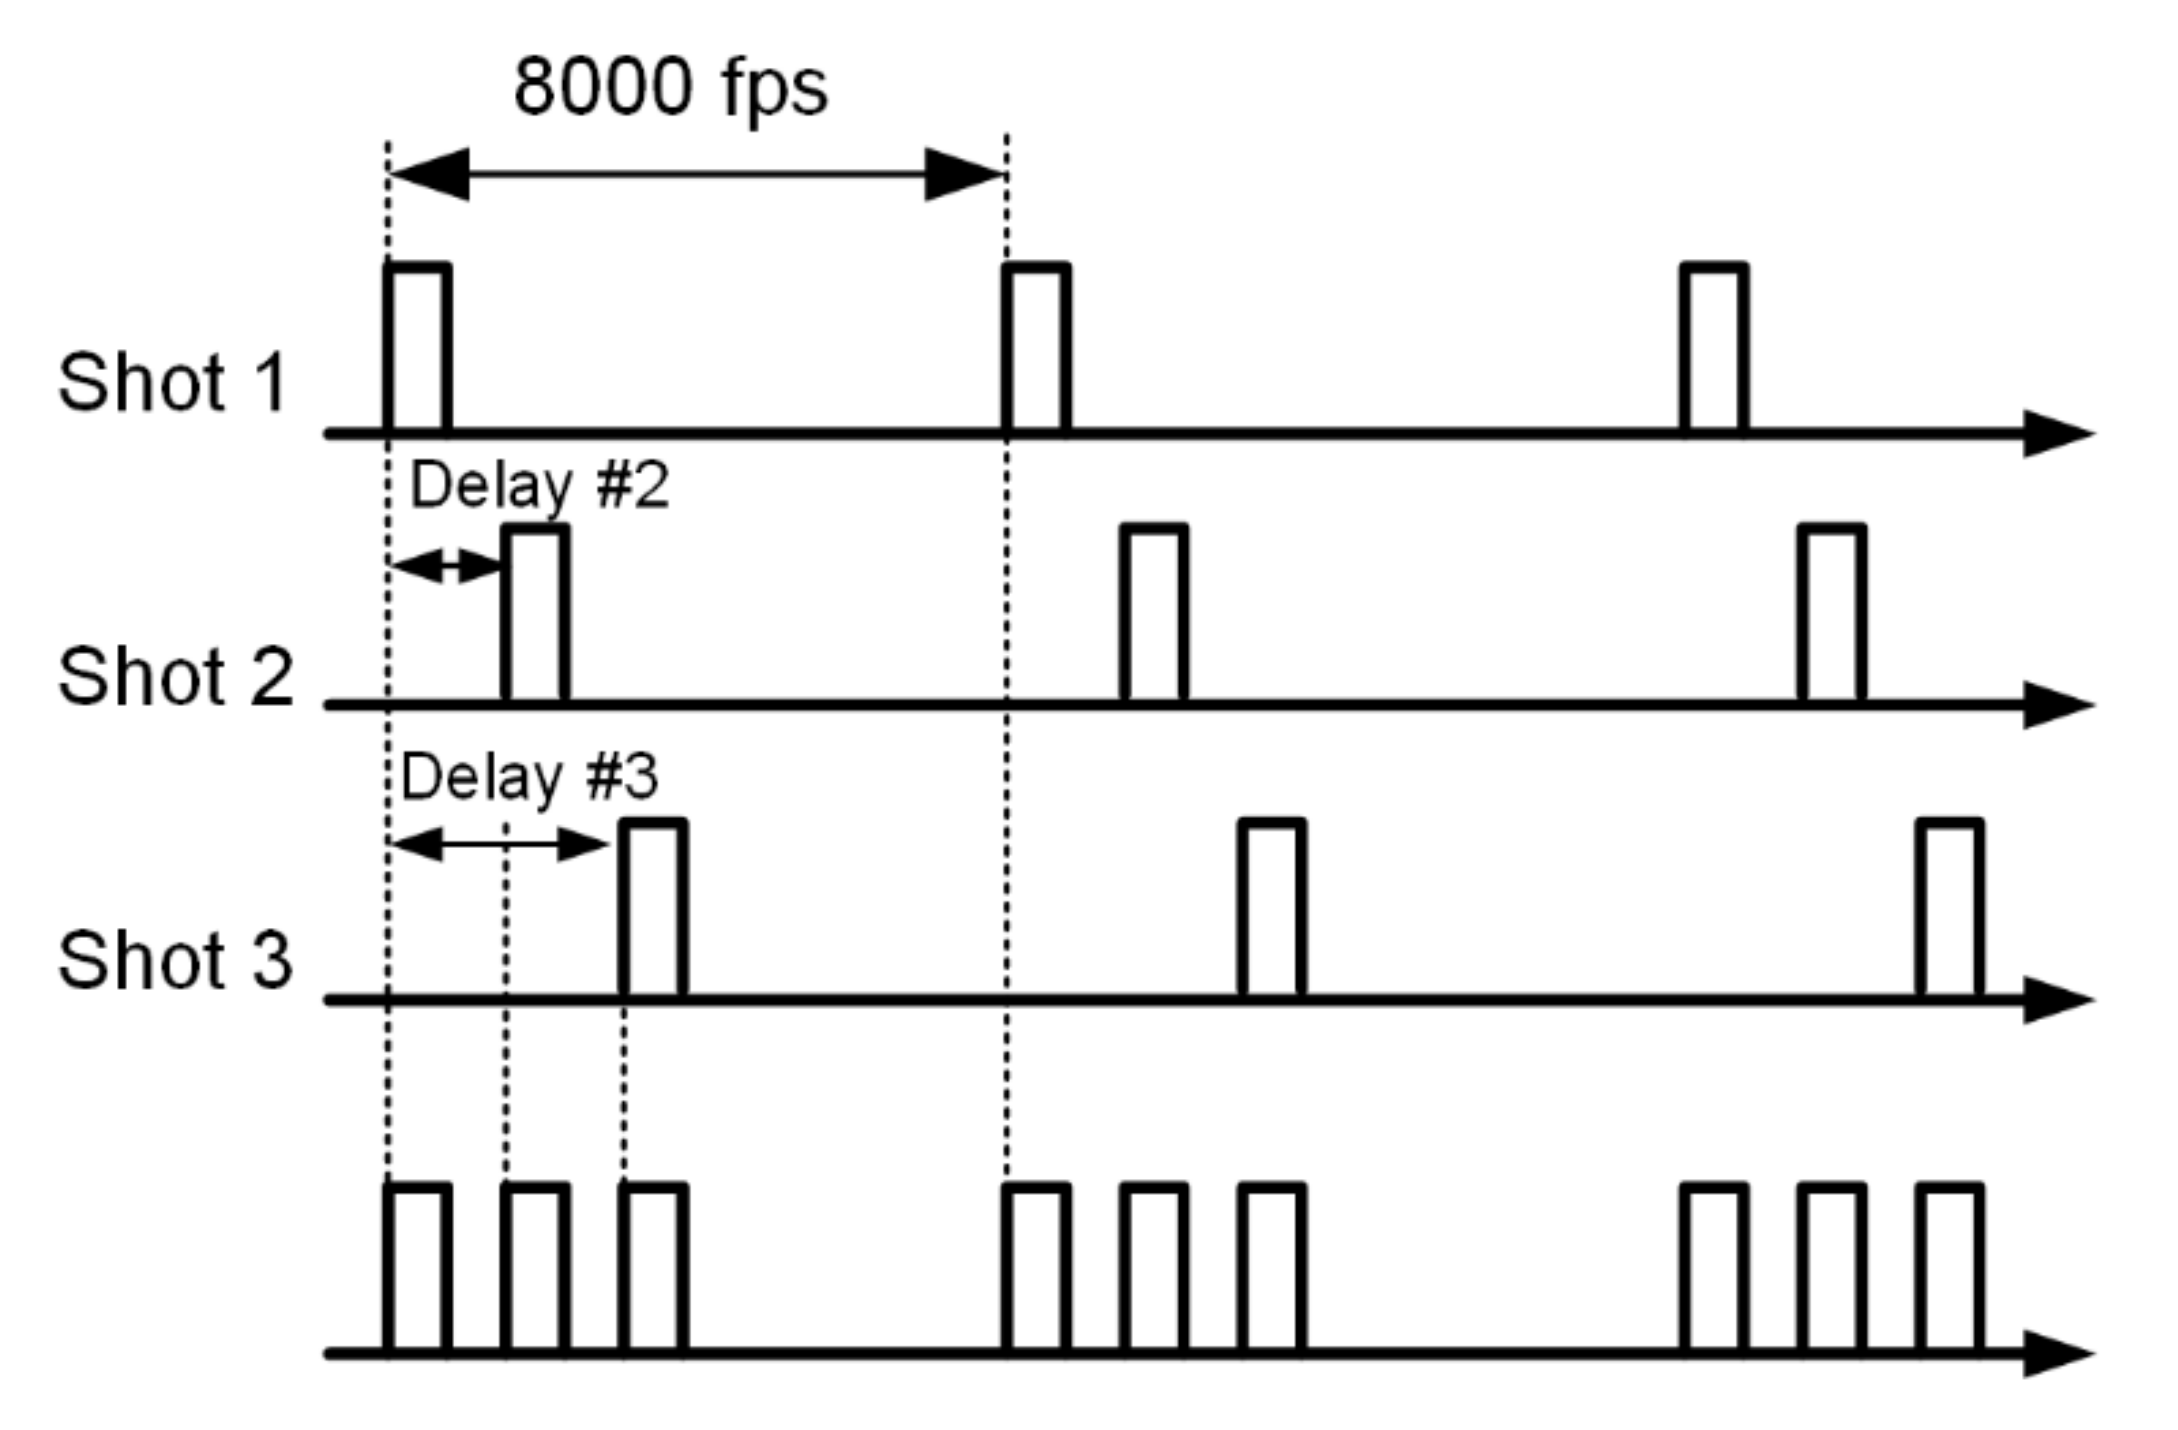
2.3. Spray Analysis Method

Microscopic spray images were captured and acquired ten times under the same conditions, which is enough to find the trend according to the fuel blending ratio and injection pressures. All processed results shown in the figures were displayed together with their corresponding standard deviation results, in order that the deviation of data could be confirmed. We acquired the spray penetration, spray angle, projected area, particle sizes, and total numbers of particles through image post-processing. We used the spray projected area for microscopic images as an alternative indicator of the spray angle. We did this because the spray in the vicinity of the nozzle interacts with ambient air vigorously and the value of the spray angle is greatly dependent on the distance downstream from the nozzle tip. It is difficult to capture an accurate spray angle by simply drawing a triangle of a certain height over the spray because the periphery of the side of the spray cannot be interpreted as a simple straight line. In addition, the spray is highly asymmetric across the spray axis near the nozzle. Therefore, the spray area provides more intuitive results of how much the spray has dispersed radially. For macroscopic images, the conventional spray angle was calculated to indicate spray dispersion.
The boundary of the spray, at the attenuation of the light intensity, can be derived using the concept of optical thickness. A clear spray image can be obtained by taking the logarithm of the ratio of the background image. The image was then linearized for boundary detection. The necessary spray parameters can then be obtained from this binary image.
Regarding our analysis of the particle sizes and numbers, we only considered particles with diameters of 8 to 170 μm in the analysis. We did not address the detailed shapes of the particles. Droplets and tiny liquid ligaments separated from the liquid core which satisfied these size criteria were considered as particles and taken into account in the analysis. We obtained the total numbers of particles and their average diameters from the images. To calculate the average diameter, we used the equivalent diameters of the particles, which are the diameters of circles having the same areas as the projected particle areas. A post-processed microscopic spray image is given in Figure 4. The nozzle tip with a round shape is located at the left side of the figure, and the fuel spray is injected toward the right side of the figure. The spray image shown in Figure 4 is selected as the sample to show the capability of spray edge detection for irregular and wavy spray shapes. The red colored line shows the boundary of the upper spray area and the blue colored line shows the boundary of the lower spray area. Colored lines display the spray boundary clearly as shown in Figure 4. The length of the center line indicates the straight distance measured from the nozzle center to the spray tip. Spray droplets detached from the core spray were separately processed to measure their number and size.

3. Results and Discussions

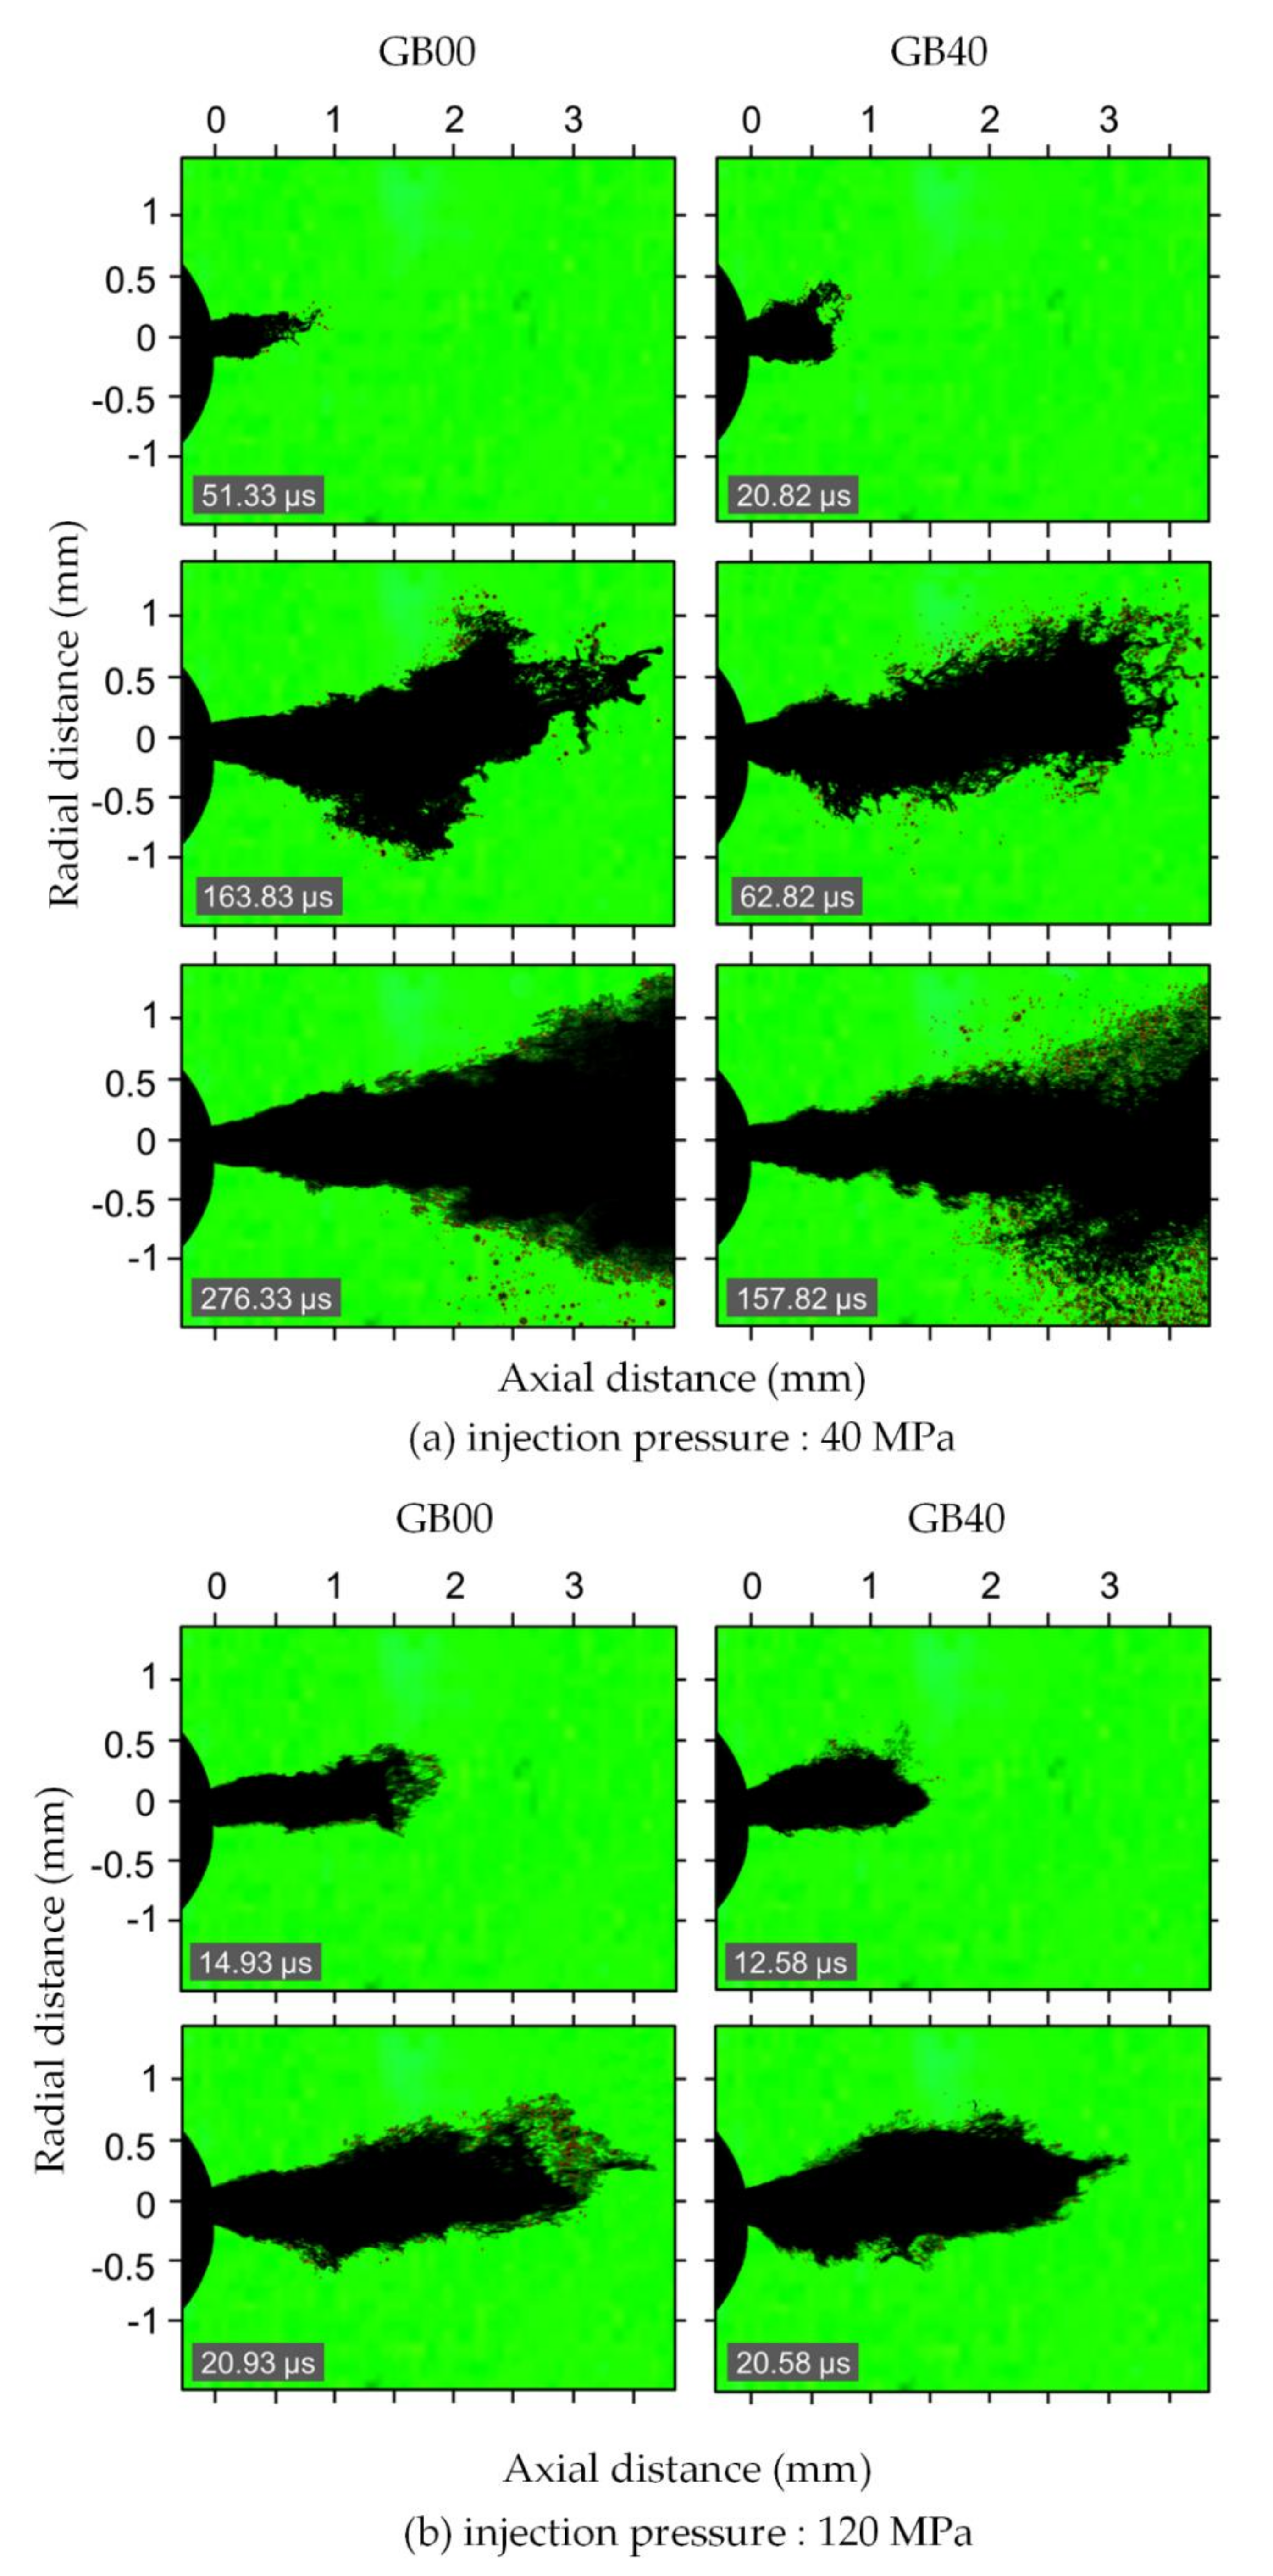
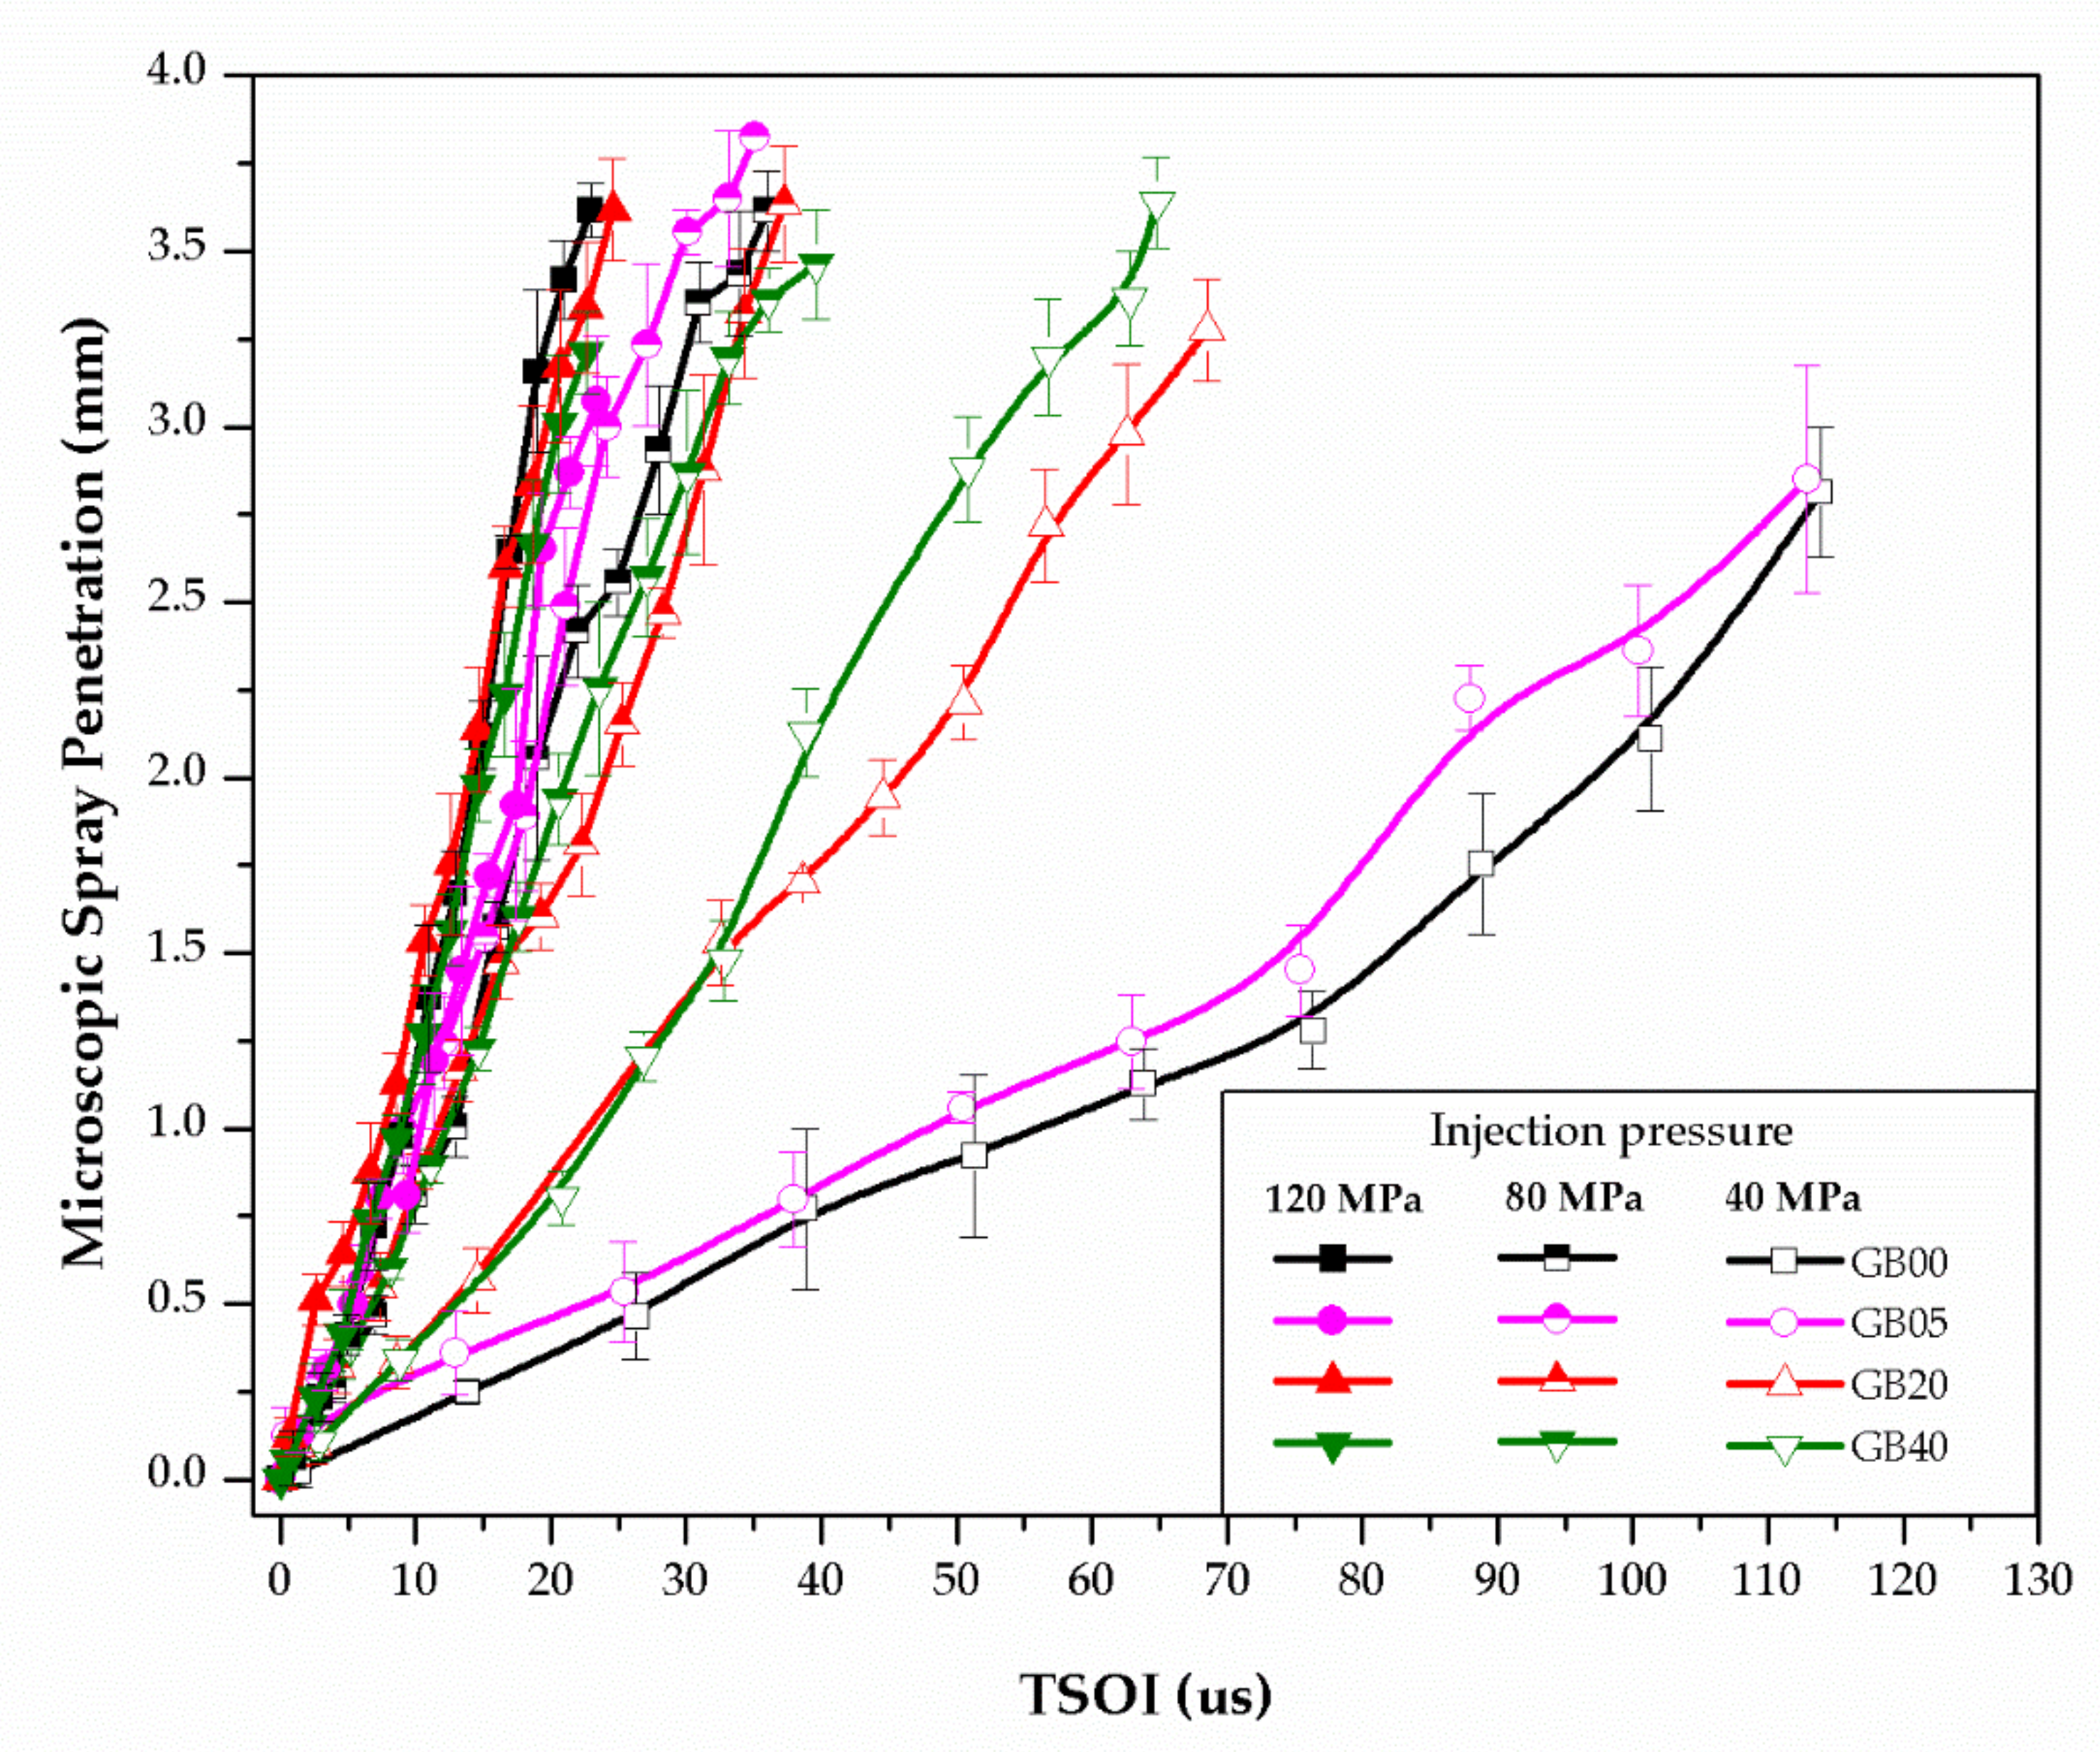
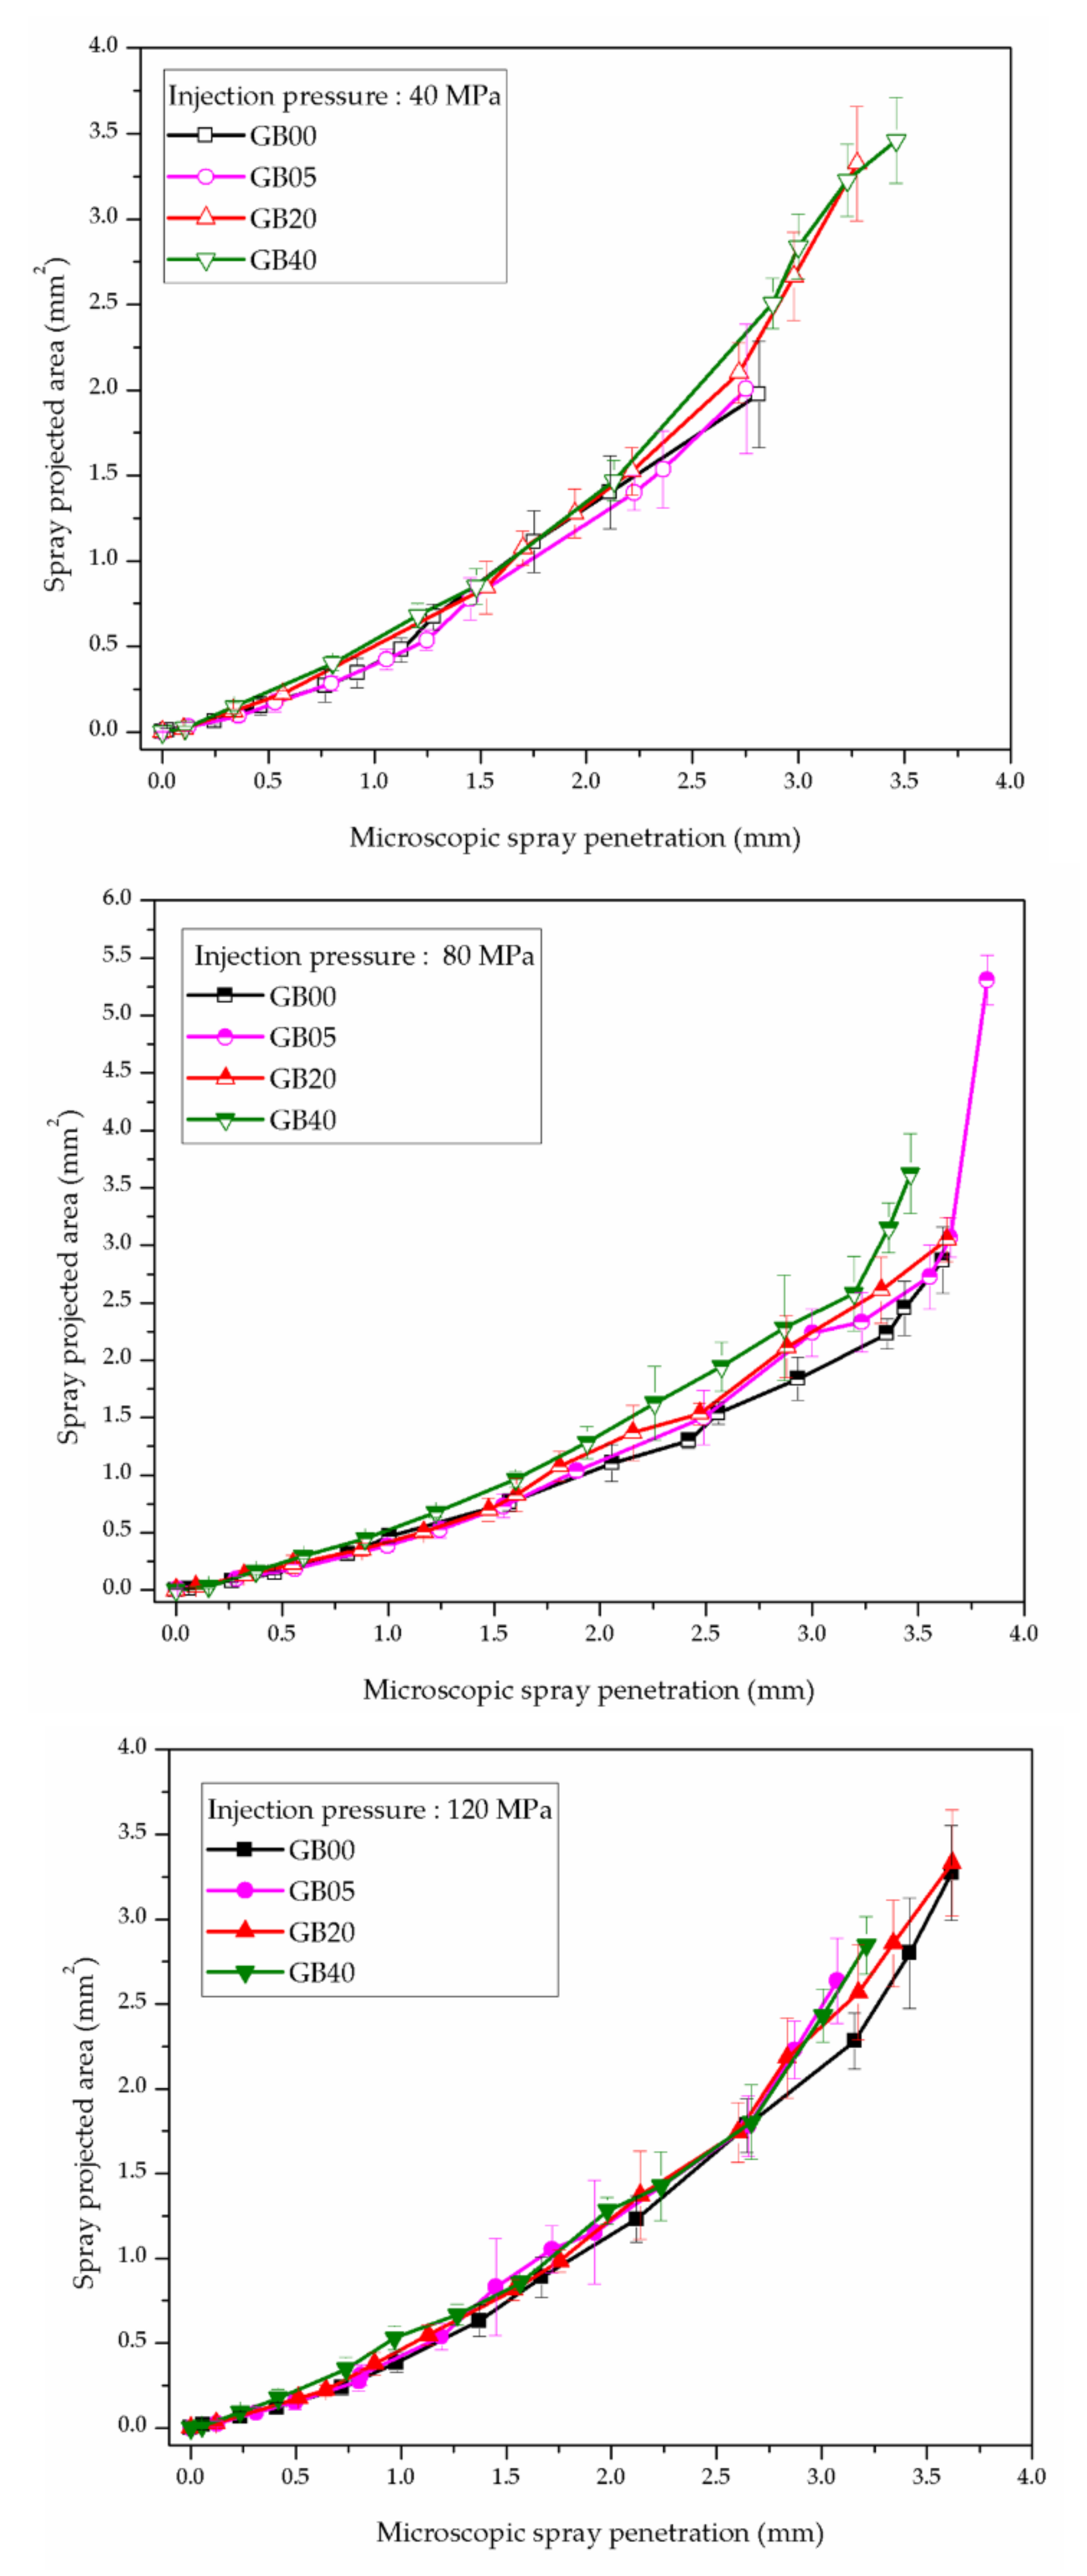
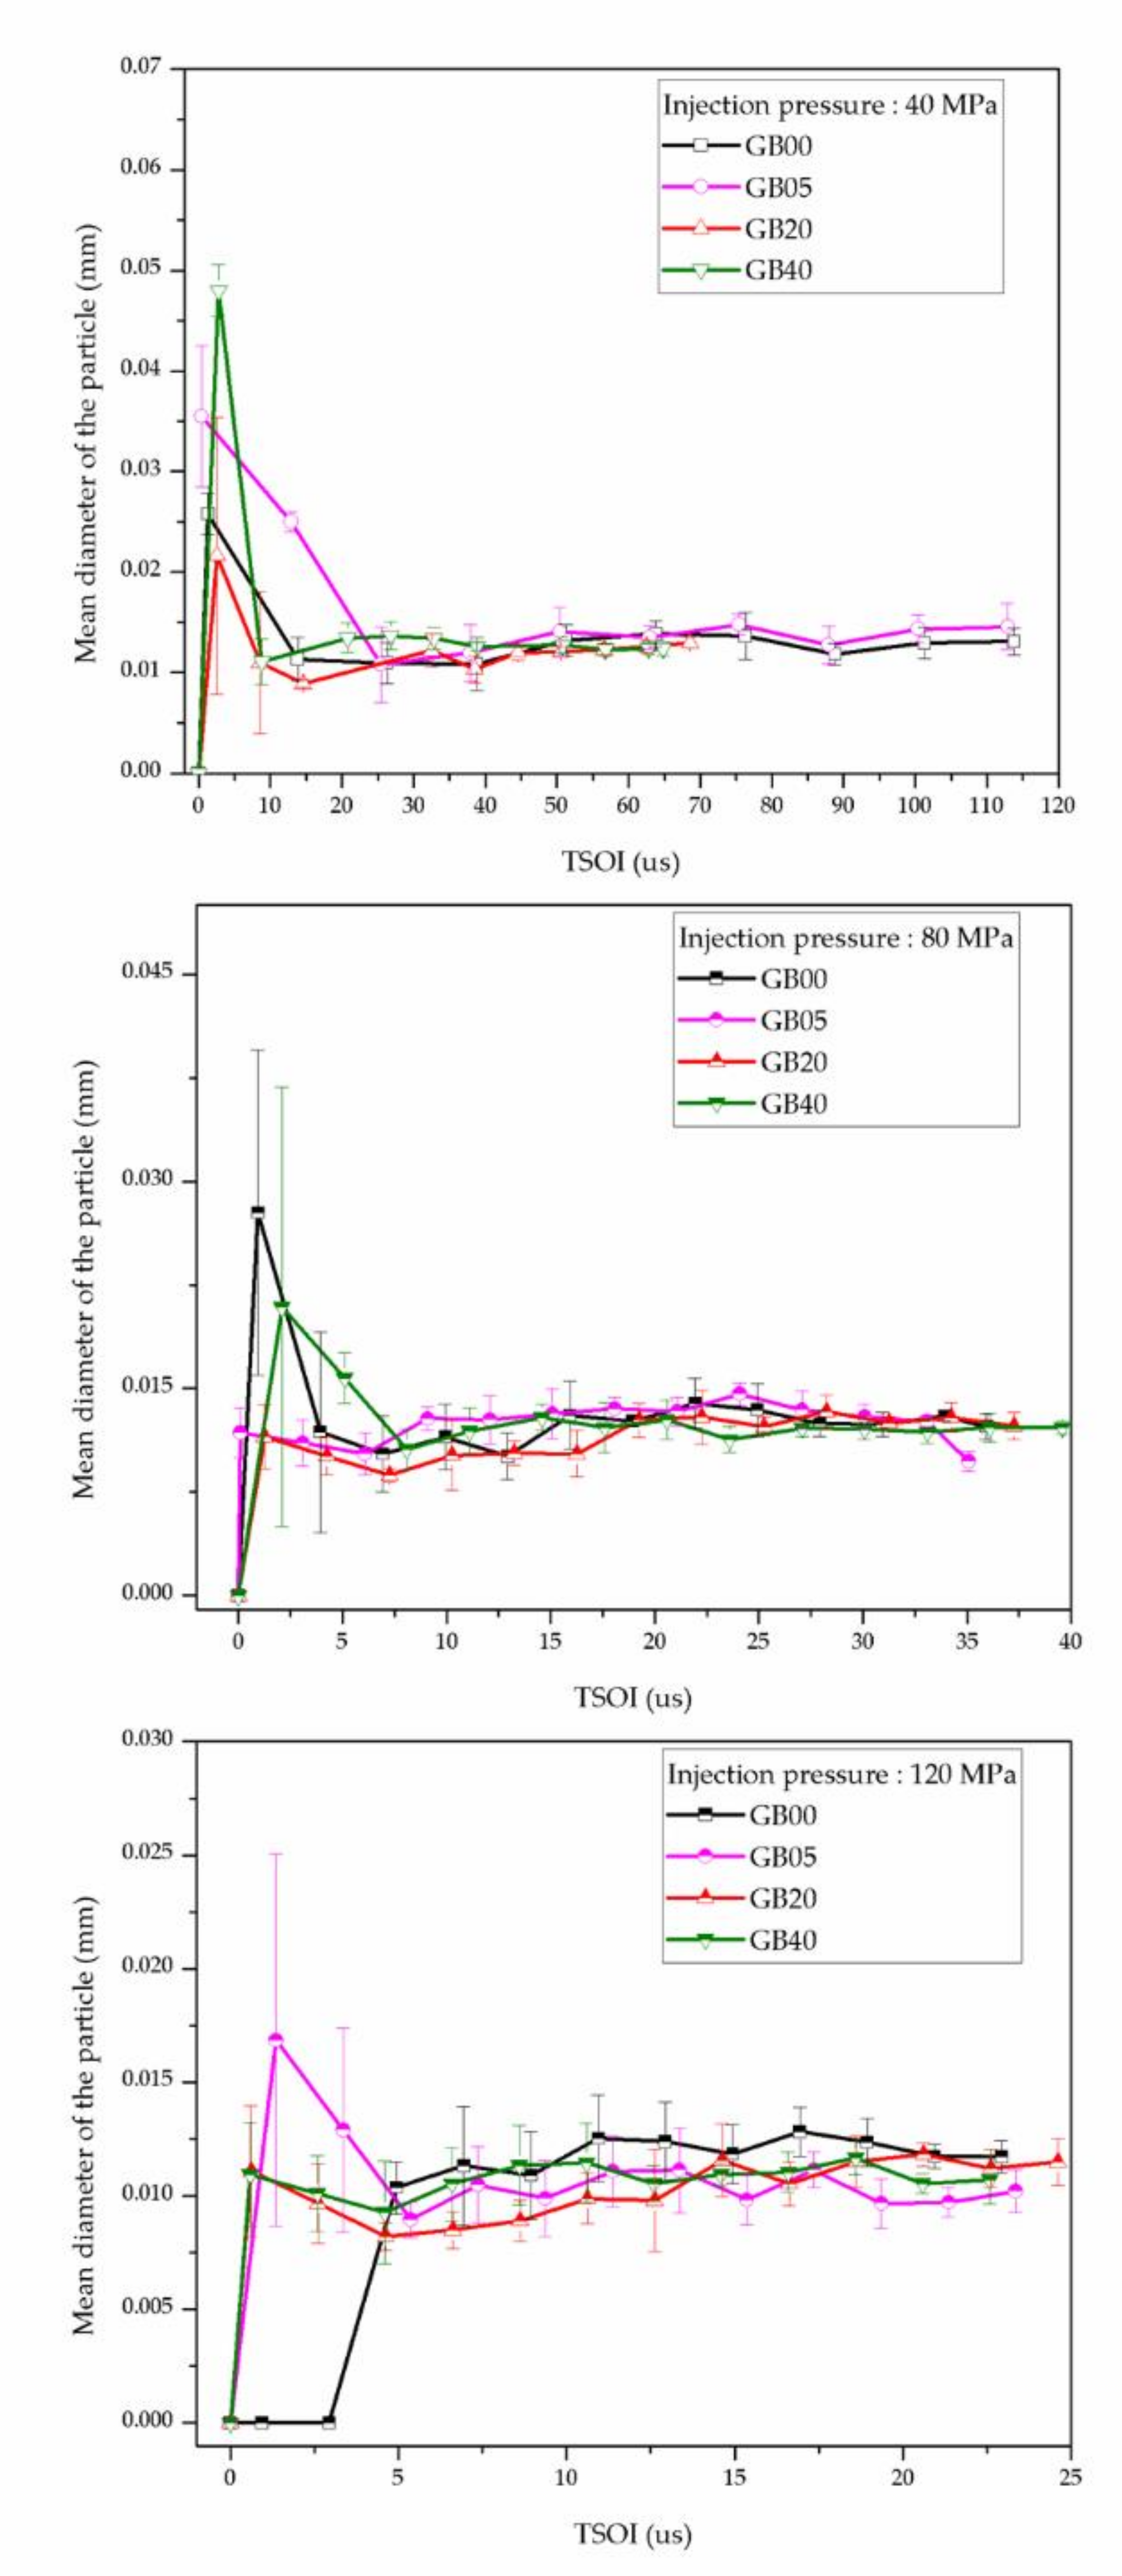
3.1. Microscopic Spray Characteristics

Figure 5 shows an example of the initial spray development process at injection pressures of 40 and 120 MPa for GB00 and GB40 fuels in the vicinity of the nozzle tip. The start of injection (SOI) timing (0 ms ASOI) is defined as the time of the first appearance of the fuel from the nozzle in the microscopic images, but not the at the start of the energizing time by the injection signal pulse. Therefore, any injection delay caused by the different fuel types or injection pressure can be neglected.
Three rows of Figure 5a show the development of the spray according to time, at the injection pressure of 40 MPa. The fuel spray starts to penetrate from the left side and continues to the right side. Images of the three rows are selected from one spray event. For GB00 and GB40 fuels, the shape of the spray was compared at the point of passing through a similar spray penetration distance.
In the first row of Figure 5a, spray just appeared from the nozzle. At a spray penetration of 1 mm sprays of the two fuels were compared.
The GB00 fuel shows a relatively stable spray shape from the very early spray development, whereas the GB40 fuel showed some ligaments and droplets detached from the spray. In the case of the GB00 spray, the width of the spray was narrow in the radial direction, but the tendency of the GB40 spray to spread out in radial direction was observed. The second row of Figure 5a shows the difference in atomization between the two fuels. The GB00 spray only exhibited small amounts of ligaments and droplets at the spray boundary, whereas greater amounts of ligaments and droplets of various sizes were observed at the boundary and at the center of the spray for the GB40 spray. Furthermore, in the case of the GB00 spray, there were droplets and ligaments only at the spray tip periphery. Except for this region, most of the spray boundary was very clear. On the other hand, for the GB40 spray, it can be seen that a large number of ligaments and droplets are found, due to active fragmentation from the boundary of about 0.5 mm from the nozzle to the entire spray. Particularly at the tip of the spray, very active atomization occurs, and large and small droplets are evenly distributed.
In addition, it can be seen that the time for the GB00 spray to reach a spray penetration distance is more than twice the time for the GB40 spray to reach the same distance. This indicates that the spray velocity of the GB00 spray was less than half that of the GB40 spray near the nozzle tip, at the early spray development.
The third row of Figure 5a compared the spray of the two fuels when both sprays were out of the visible window and reached an almost fully developed state. In the case of the GB00 spray, there was a tendency for a few droplets to atomize only at the tip and edge of the spray. On the other hand, GB40 spray had a very wavy boundary near the nozzle, and the amount of waviness increased further as it went to the spray end. It was observed that fragmentation occurred into numerous liquid ligaments and droplets. This difference in atomization should be due to the difference of the spray penetration velocity.
Figure 5b shows the spray development according to time for the GB00 and GB40 fuels, at the injection pressure of 120 MPa. The first row of Figure 5b is at a spray penetration of about 1.6 mm and the second row is at a spray penetration of about 3 mm. Firstly, it was shown that the time it takes to reach the same spray penetration is very similar for both fuels. It implies that spray velocity at the early spray development was similar for the two fuels at the higher injection pressure of 120 MPa. Compared with the injection pressure of 40 MPa, the spray velocity was increased by two times. Both fuels showed decreased amounts of atomization and spreading out in the radial direction. This was attributed to the increased spray velocity by two times along the spray axis.
Secondly, as shown in Figure 5b, the first row of Figure 5b shows that many ligaments and droplets are located at the spray tip area for the GB00 fuel spray. This trend was significantly shown at the second row of Figure 5b. A more unstable spray surface morphology, more ligaments, and more droplets appeared with the GB00 fuel. This suggests that, for similar spray tip velocities, the low viscosity and surface tension characteristics of the GB00 fuel increased the shearing instabilities with the surrounding air, thus resulting in an enhanced atomization process. Quantitative analysis about these images was performed and explained in the following figures.
The post-processed results of the images are shown in Figure 6, Figure 7 and Figure 8. Figure 6 shows the microscopic spray penetration under different injection pressures for the different fuel types. Similar to the results shown in Figure 5, the spray penetration was shorter for GB fuels with lower biodiesel blending ratios and the low injection pressure of 40 MPa. The spray penetrations for the GB00 and the GB05 fuels were similar and those for the GB20 and the GB40 fuels exhibited similar penetrations. Overall, the spray penetration increased as the blending ratio of the biodiesel increased. These results were confirmed as a trend similar to the result reported by Fu et al. [23]. Moreover, the difference of the spray penetrations of the different fuels was remarkably reduced as the injection pressure increased. This is consistent with the raw images shown in Figure 5.
GB00 and GB05 showed much shorter penetration during the very beginning of the spray development. This is a result which has not been reported by the literatures. One reason for the shorter spray penetration of the GB00 and GB05 fuels at an injection pressure of 40 MPa is their low fuel viscosity and surface tension. Low viscosity and surface tension lead to cavitation in the nozzle flow, which results in a reduced discharge coefficient of the nozzle and reduced flow characteristics. The second reason is the different radial dispersion characteristics of the fuels. A fuel with a low biodiesel ratio showed slow spray development in the direction of the spray axis, since it experienced high instability on the spray surface. The low viscosity and surface tension of the fuel tended to interfere with penetration in the direction of the spray axis and tended to spread in the radial direction due to interfacial shearing instabilities at the spray surface during the spray development process. This analysis is similar to the analysis from recently reported literatures of the spray characteristics of the biodiesel-blended fuel [23,24,25]. As shown in Figure 7, under all injection pressure conditions, there was no visible difference of the spray projected areas of the different fuels. Qualitative analysis of the spray images revealed no noticeable differences of the spray cone angles. Therefore, the differences of the axial spray penetration lengths are primarily due to the mass flow rate differences resulting from the physical properties of the fuels.
We derived the spray tip velocity under each injection pressure condition to investigate the spray regime according to the spray penetration velocity and the physical characteristics of each GB fuel. We calculated the Re, We, and Oh numbers using the following equations:
Re L = ρ L U L d μ L   ,   We L = ρ L U L 2 d σ ,   We gG = ρ g U L 2 d σ   ,   Oh = μ L ρ L d σ   ,
where ρg and ρL are the density of the gas and the liquid fuel, respectively, μL is the dynamic viscosity of the fuel, d is the diameter of the nozzle and σ is the surface tension of the fuel. Re is the Reynolds number, which explains the ratio of inertial force to viscous force. We is the Weber number, which explains the ratio of inertial force to surface tension force.Weg is the Weber number of the gas. WeL is the Weber number of the liquid. Oh is the ohnesorge number, which explains the ratio of viscous force to inertial and surface tension forces. We is the average injection velocity during the spray development period for the velocity term, UL. For the GB00 fuel, Weg = 5.5 and WeL = 3200 at the injection pressure of 40 MPa. This corresponds to the first and second wind-induced regimes, respectively, of the primary breakup regime of the spray, in accordance with Dumouchel and Bekdemir [32,33]. In this region, a dominant perturbation is normally observed on the surface of the spray and a distinct two-stage primary breakup process is also observed. However, complete jet disruption from the exit of the nozzle in the first and second wind-induced regimes is known to be less active than in the atomization regime. Figure 8 shows the Re and We values calculated from the time-averaged velocity of sprays for the GB fuels for different injection pressures. As shown in the figure, at an injection pressure of 40 MPa, GB00 and GB05 belong to the first and second wind-induced regimes, respectively.
Figure 8 shows the primary breakup regimes for different injection pressures and fuel types, based on the Oh number calculated from the Re and We numbers. Most of the experimental conditions fell into the atomization regime, except for the GB00 and GB05 fuels under an injection pressure of 40 MPa. The differences of the primary breakup regime led to differences of the atomization performance of the spray, as shown in Figure 5.
Figure 9 shows the number of droplets detected in the microscopic images versus the time after SOI. The method for calculating the number of droplets from the spray image is described in Section 2.3. At the injection pressure of 40 MPa, the difference was clearly dependent on the fuel blending ratio. More particles were observed around the GB20 and GB40 fuel sprays than around the GB00 and GB05 fuel sprays. This is because, as described above, the atomization characteristics were different due to the different spray tip velocities. However, as the spray became fully developed, the number of particles for GB00 and GB05 became similar to the number of particles for GB20 and GB40 because the spray velocities became similar. As the injection pressure increased, the difference decreased. GB fuels with lower biodiesel blending ratios showed greater numbers of particles under injection pressures of 80 and 120 MPa. This is because the difference of the spray penetration velocities between the fuels decreased as the injection pressure increased, where the fuel properties played a more dominant role in the spray atomization process.
Figure 10 shows the average particle size of the droplets observed around the GB fuel spray according to the time after the start of injection. Unlike what is generally known, we observed no significant decrease of the average droplet diameter with increasing injection pressure. The particle sizes were also similar between the GB fuels. The particle size was slightly greater due to the large droplets at the very early stage of spraying under all injection pressure conditions, but the results converged to a constant value over time.

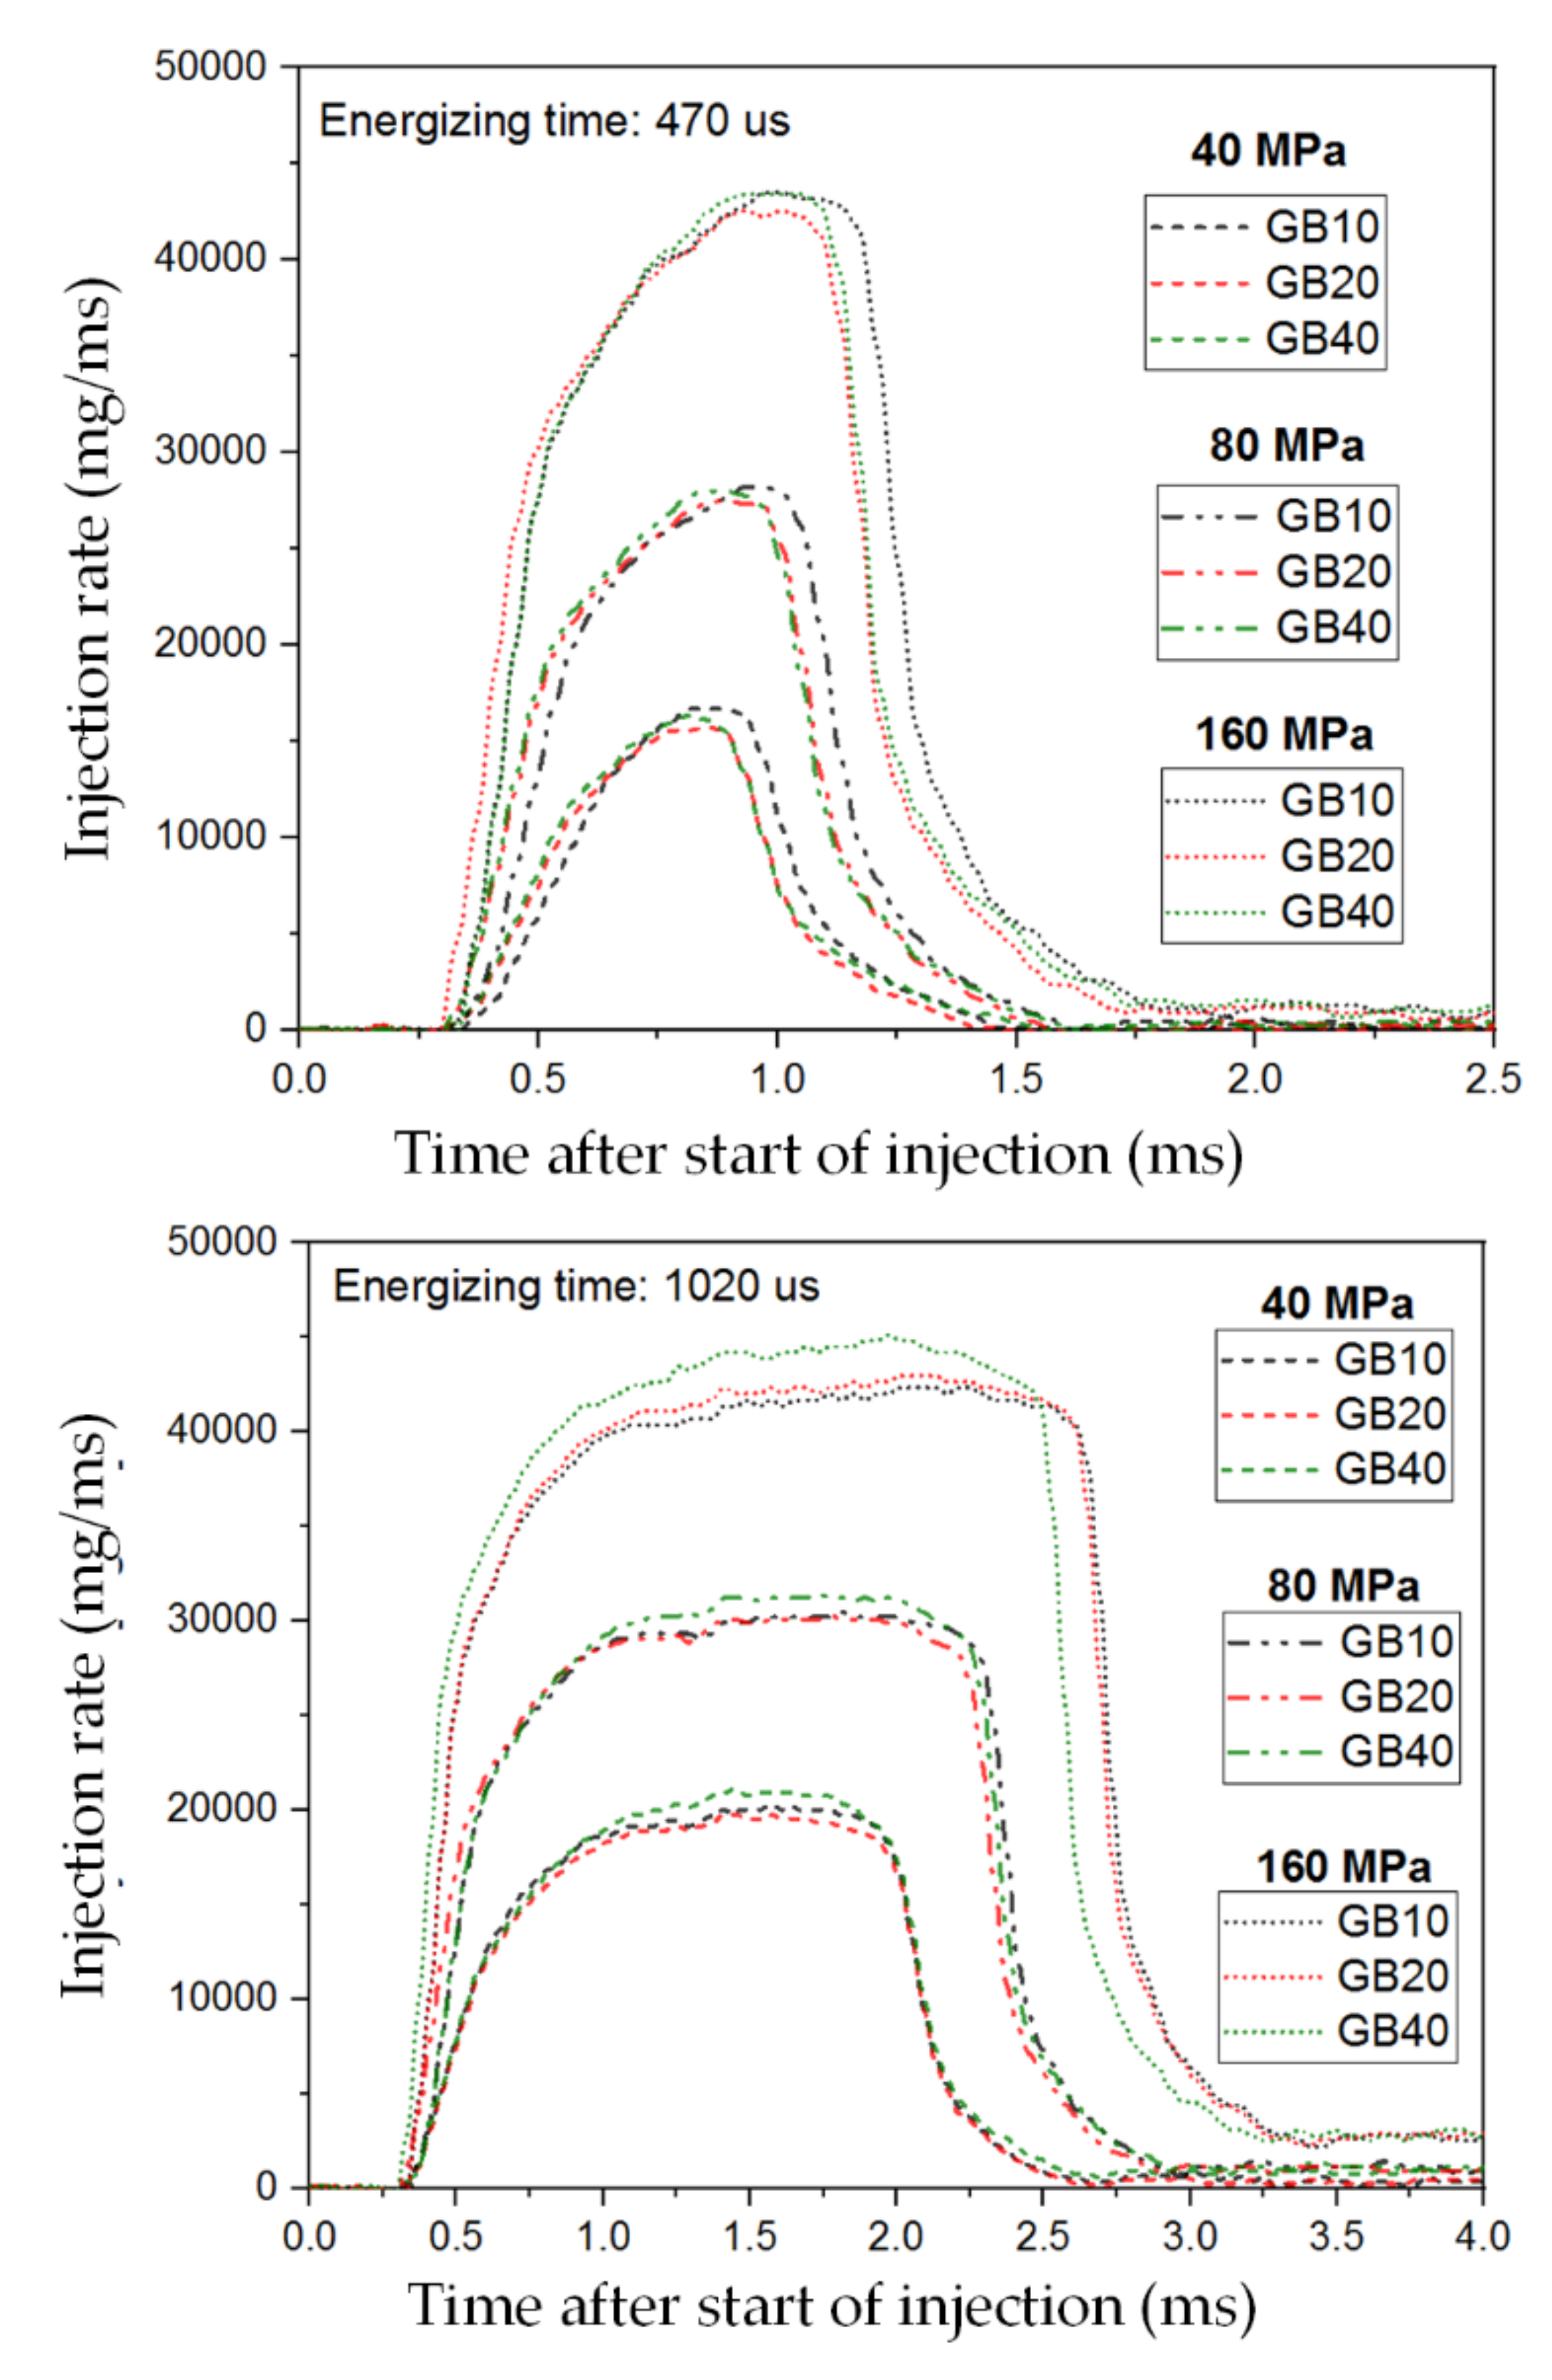
3.2. Effects of the Properties of the Fuels on the Injection Rate and Correlation with Spray Development

The injection rates of GB10, GB20, and GB40 under injection pressures of 40, 80, and 160 MPa for two different energizing times of 470 and 1,020 µs are depicted in Figure 11 to demonstrate the behaviors of partial opening, full opening and injection termination. Injection rates were measured and acquired 256 times at each condition, and averaged data was used. A short injection pulse demonstrates the partial opening situation whereas the long injection pulse corresponds to the wide opening situation. For shorter energizing events under an injection pressure of 40 MPa, GB40 and GB20 had earlier starts and higher injection rates up to 750 µs, and then the higher injection rate profile is dominated by GB10. The increased injection rates for GB20 and GB40 during the transient injection period, ascribed by the starting of the needle movement, is possibly caused by the increasing percentage of the biodiesel fraction. A higher fuel density and viscosity corresponds to a higher flow rate at the partial needle opening, but later for the needle opening condition. The lower density and lower viscosity of the fuel decreases the flow resistance with increasing time and hence, a higher injection rate profile is visible for the rest of the time period for GB10, for both the 40 and 80 MPa cases. Also, a low fuel viscosity delays the closing movement of the needle, so the injection duration of GB10 was longer than the durations of GB20 and GB40. For a higher injection pressure, the rate at the stable injection period is consistently higher and since the higher injection pressure slows down the needle closing process, a retarded shape was observed for all of the higher injection pressure cases. For the 160 MPa case for both 470 and 1020 µs, a higher biodiesel fraction dominates the rate of injection from the beginning until the end. The late start of injection for GB10 explains why a slow spray development of fuels with a lower portion of gasoline was observed in the microscopic spray visualization. For longer energizing events (1020 µs energizing time), a full needle opening region appeared and GB40 showed the highest injection rate in the full needle opening region due to the highest density characteristic. The GB10 fuel still showed the fastest injection start and longest injection duration.

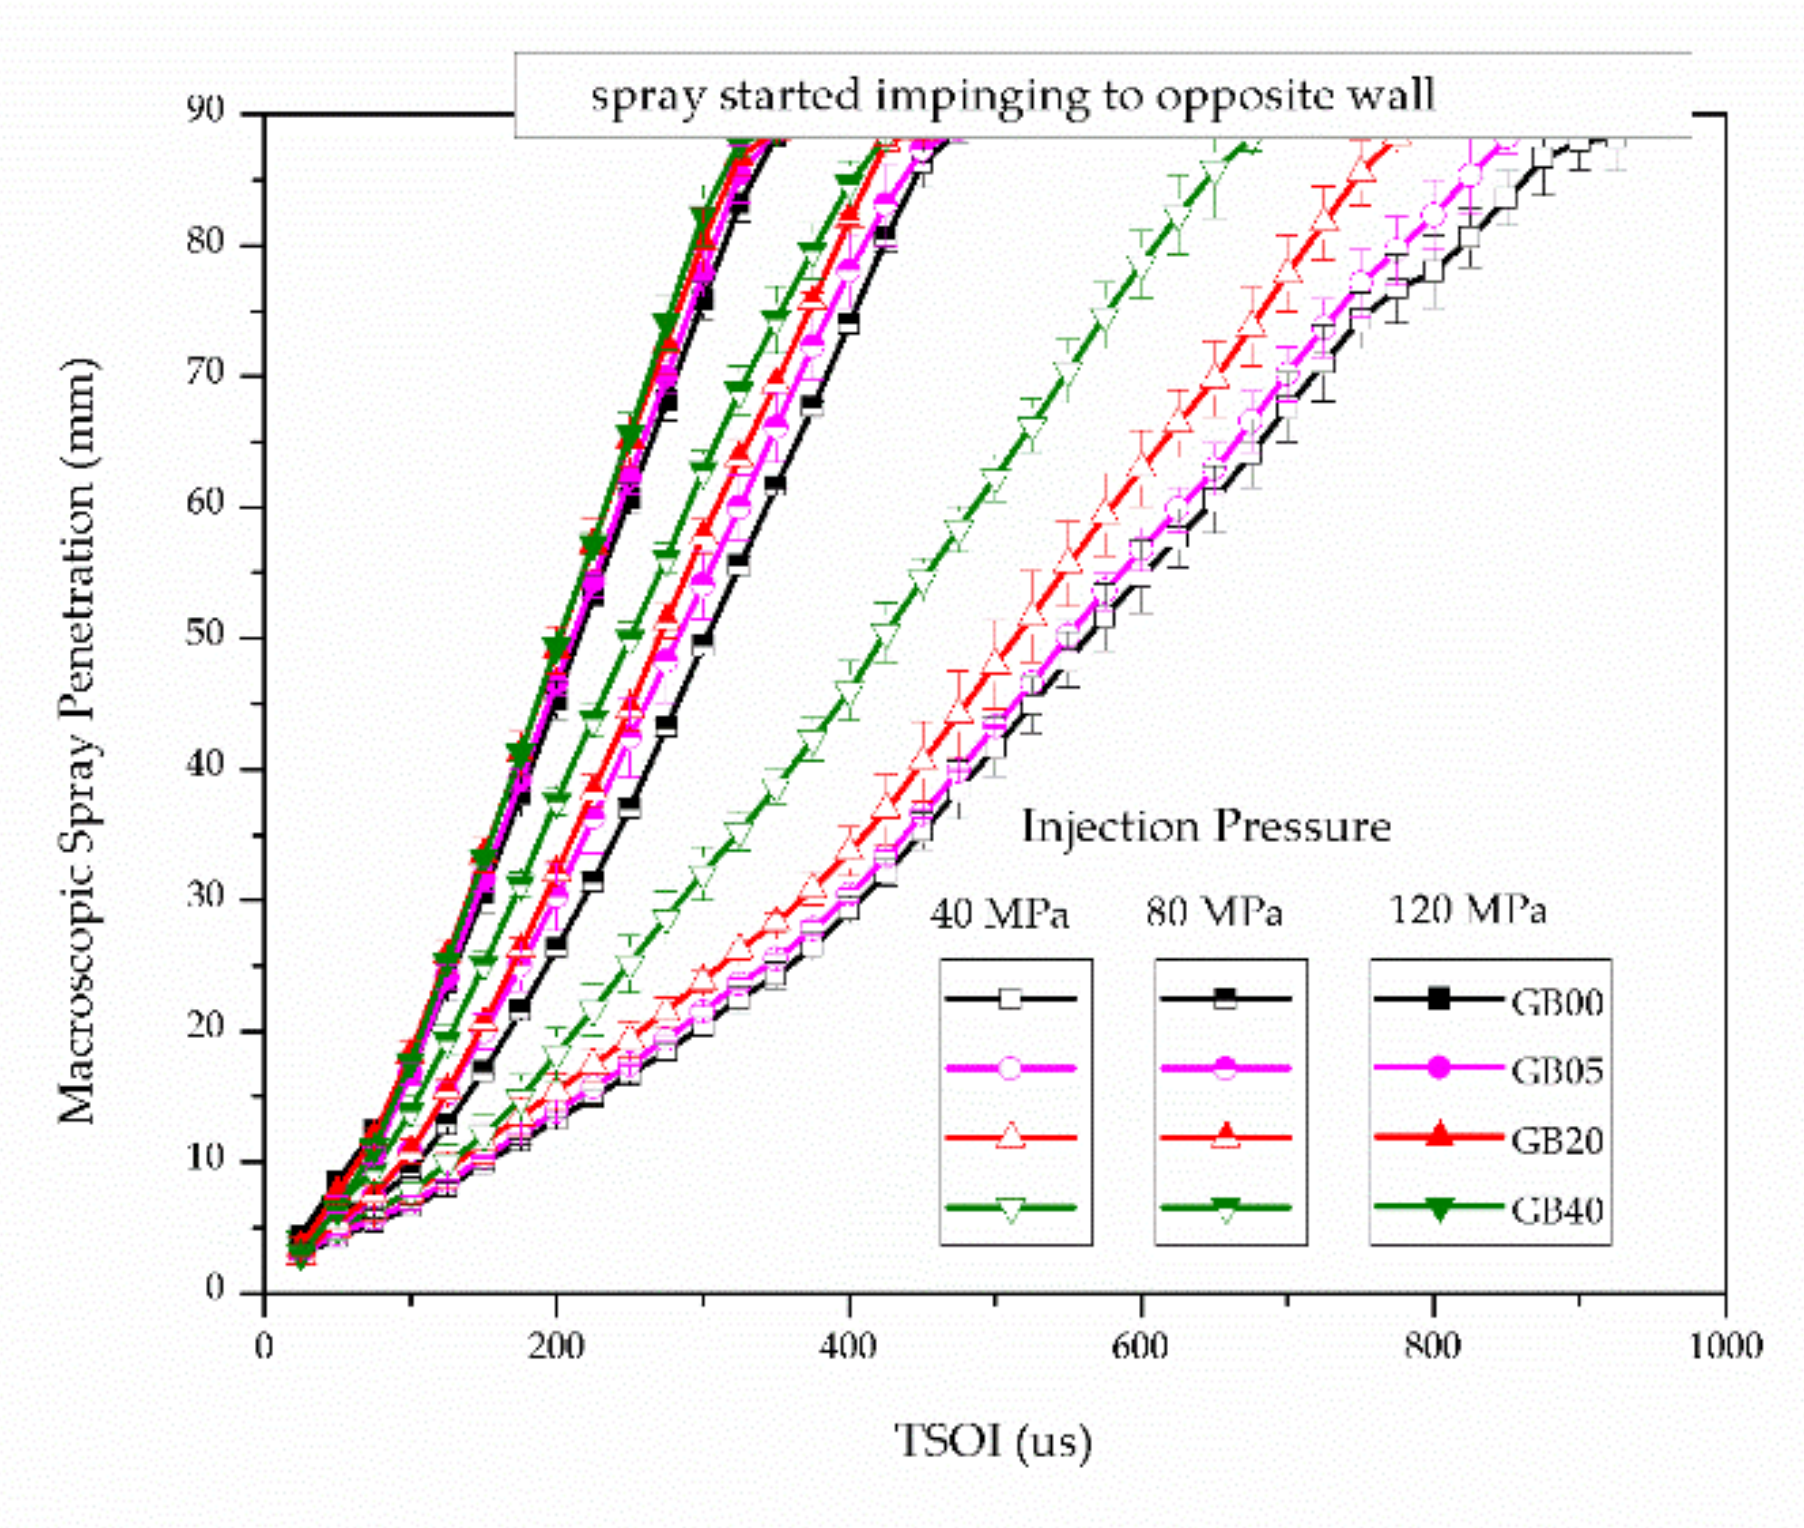
3.3. Macroscopic Spray Characteristics

Figure 12 shows the spray penetrations of all tested fuels over time after the start of injection. The average values over six injection events are presented. The spray evolution of all tested fuels under atmospheric pressure reveals a narrow spray structure due to less interaction with the ambient gas and little effect from aerodynamic forces due to the high-density ratio of the liquid and gas. This behavior results from both the high injection rate and the highly viscous fuel characteristics. A higher viscosity fuel causes difficulty in the dispersion and the breakup process in the air entrained spray boundary, but potentially increases axially, which is a reason for the increasing tip penetration. The macroscopic spray penetration of biodiesel fuel is usually higher compared to gasoline fuel, which has been reported experimentally and numerically in various studies [23,24,25]. However, an increase of the injection pressure attenuates these fuel-specific property effects on penetration, which leads to less deviation among the temporal spray development results of the GB00, GB05, GB20, and GB40 fuels. However, we still observed a slightly higher macroscopic spray penetration for GB40 than that of GB00. The microscopic spray penetration showed little difference according to the blending ratio of the fuel. This is due to the increased fuel density and viscosity properties as the biodiesel ratio increased. However, as the spray developed, the spray penetration of the fuels with higher blending ratios of biodiesel increased faster due to the fuel properties, especially for high viscosity. Therefore, we conclude that the spray penetrations of the fuels with higher biodiesel ratios were slightly greater due to the fuel properties, even under increased injection pressures.
The spray cone angle is a representative parameter that defines the dispersion phenomenon and depends on various influencing parameters. The spray cone angle is an important index to determine the degree of radial diffusion of a spray. In our microscopic spray study, we used the calculated projected spray area instead of the spray cone angle because of large fluctuations over the spray periphery, whereas we calculated the spray cone angle in the macroscopic spray study. Figure 13 shows the spray cone angles of the GB fuels according to the injection pressure. As is well known, the spray angle is high at the beginning of injection and converges to a constant value as the spray develops.
Initial spray cone angles of 50–60 degrees were observed and the value continuously decreased for all fuels. The higher standard deviation early in the graph indicates the spray’s highly transient unsteady nature and this deviation was too large to find specific tendencies at the early stage of spray development. In the microscopic spray investigation, which focused on the phenomenon beginning 50 µs after the start of the injection, we analyzed the radial dispersion of the spray using projected spray area calculations. This analysis did not show a clear trend for each fuel. In the macroscopic spray investigation, we do not see a significant difference in the spray cone angle between 0 and 100 µs and the standard deviation is very large due to the spray’s highly transient unstable nature. However, the spray cone angle between fuels became significantly different after about 100 µs.
The spray cone angle tended to be higher for GB fuels with lower biodiesel blending ratios. This trend coincides with the result reported by Das et al. [27]. However, as the injection pressure increases, the difference of the spray cone angle between the fuels decreased. The difference of the radial dispersion of the spray is clearly due to the different shearing instabilities that occur around the spray due to differences of the fuel properties, especially viscosity and surface tension. GB fuels with higher gasoline blending ratios have lower viscosities and surface tensions, resulting in more active radial dispersion due to increased shearing instabilities on the spray surface.
The above analysis shows that the radial dispersion of the macroscopic spray and the radial dispersion of the microscopic spray are not proportional, and it is difficult to find their relationship based on the calculation of the spray area. Therefore, to determine the radial dispersion of the spray, it is necessary to introduce various analytical indices into the microscopic investigations, rather than using the spray area calculation. Thus, we concluded that the temporal variation of the spray axis, the asymmetry of the spray, the amount of ligaments and droplets formed, and the shape of the spray surface should be comprehensively analyzed to better understand and predict all of the spray development characteristics.

4. Conclusions

This study aimed to investigate the atomization process near the nozzle of gasoline-biodiesel blended fuels, by microscopic spray visualization. Spray velocity and injection rates were measured and used to explain the effect on the atomization processes. In addition, the authors tried to explain the macroscopic spray development process coupled with the microscopic spray development process. The fuel mixing ratio and the injection pressures were varied as experimental parameters. The following conclusions are drawn based on the investigation:
  • At the low injection pressure of 40 MPa, low biodiesel ratio fuels of GB00 and GB05 have lower spray velocity by about 60% compared with high biodiesel ratio fuels of GB20 and GB40. Low spray velocity led to a different atomization regime, so spray atomization of GB00 and GB05 was disadvantageous at the initial stage of the spray development.
  • As injection pressure increases, spray velocities at the initial spray development becomes similar for all fuels. Under similar spray velocity conditions, low biodiesel ratio fuel was advantageous for spray atomization. This was attributed to the gasoline’s lower kinematic viscosity and surface tension.
  • Microscopic spray analysis and macroscopic spray analysis showed similar trends of spray shape, such as the spray tip penetration and the spray cone angle. However, atomization performance was only found by microscopic spray analysis.
  • Various ambient conditions should be tested to investigate the whole atomization process, including evaporation, so this should be an objective of further research.

Author Contributions

Conceptualization, O.L.; methodology, O.L.; data acquisition, K.K.; Writing-review, K.K. and O.L. All authors have read and agreed to the published version of the manuscript.

Funding

This work was supported by Shipbuilding and Offshore Industry Core Technology Development Business by the Ministry of Trade, Industry and Energy(MOTIE, Korea)[Project Name: Development of Low Print Point Alternative Fuel Injection System for Small and Medium Vessel Enfines for Ships Hazardous Emission Reduce]. (20013146)

Conflicts of Interest

The authors declare no conflict of interests.

References

  1. Hiroyasu, H.; Arai, M. Structures of fuel sprays in diesel engines. In SAE Transactions; SAE International: Warrendale, PA, USA, 1990; pp. 1050–1061. [Google Scholar]
  2. Naber, J.D.; Siebers, D.L. Effects of gas density and vaporization on penetration and dispersion of diesel sprays. In SAE Transactions; SAE International: Warrendale, PA, USA, 1996; pp. 82–111. [Google Scholar]
  3. Kegl, B.; Lešnik, L. Modeling of macroscopic mineral diesel and biodiesel spray characteristics. Fuel 2018, 222, 810–820. [Google Scholar] [CrossRef]
  4. Crua, C.; Heikal, M.R.; Gold, M.R. Microscopic imaging of the initial stage of diesel spray formation. Fuel 2015, 157, 140–150. [Google Scholar] [CrossRef] [Green Version]
  5. Manin, J.; Bardi, M.; Pickett, L.M.; Payri, R. Boundary condition and fuel composition effects on injection processes of high-pressure sprays at the microscopic level. Int. J. Multiph. Flow 2016, 83, 267–278. [Google Scholar] [CrossRef] [Green Version]
  6. Heimgärtner, C.; Leipertz, A. Investigation of the Primary Spray Breakup Close to the Nozzle of a Common-Rail High Pressure Diesel Injection System; SAE Paper no. 2000-01-1799; SAE International: Warrendale, PA, USA, 2000. [Google Scholar]
  7. Sjoeberg, H.; Manneberg, G.; Cronhjort, A. Long-working-distance microscope used for diesel injection spray imaging. Opt. Eng. 1996, 35, 3591–3597. [Google Scholar] [CrossRef]
  8. Bae, C.; Yu, J.; Kang, J.; Kong, J.; Lee, K.O. Effect of Nozzle Geometry on the Common-Rail Diesel Spray; SAE Paper no. 2002-01-1625; SAE International: Warrendale, PA, USA, 2002. [Google Scholar]
  9. Kalghatgi, G.T.; Risberg, P.; Ångström, H. Partially Pre-Mixed Auto-Ignition of Gasoline To Attain Low Smoke and Low Nox at High Load in a Compression Ignition Engine and Comparison with a Diesel Fuel; SAE Paper 2007-01-0006; SAE International: Warrendale, PA, USA, 2007. [Google Scholar]
  10. Manente, V.; Johansson, B.; Tunestal, P.; Cannella, W. Effects of Different Type of Gasoline Fuels on Heavy Duty Partially Premixed Combustion; SAE Paper 2009-01-2668; SAE International: Warrendale, PA, USA, 2010; Volume 2, pp. 71–88. [Google Scholar]
  11. Manente, V.; Zander, C.G.; Johansson, B.; Tunestal, P.; Cannella, W. An Advanced Internal Combustion Engine Concept for Low Emissions and High Efficiency from Idle to Max Load Using Gasoline Partially Premixed Combustion; SAE Paper 2010-01-2198; SAE International: Warrendale, PA, USA, 2010. [Google Scholar]
  12. Manente, V.; Johansson, B.; Canella, W. Gasoline partially premixed combustion, the future of internal combustion engines? Int. J. Eng. Res. 2011, 12, 194–208. [Google Scholar] [CrossRef]
  13. Lewander, C.; Johansson, B.; Tunestal, P. Extending the Operating Region of Multi-Cylinder Partially Premixed Combustion Using High Octane Number Fuel; SAE Technical Paper no. 2011-01-1394; SAE International: Warrendale, PA, USA, 2011. [Google Scholar]
  14. Sellnau, M.; Sinnamon, J.; Hoyer, K.; Husted, H. Full-time gasoline direct-injection compression ignition for high efficiency and low NOx and PM. SAE Int. J. Eng. 2012, 5, 300–314. [Google Scholar] [CrossRef]
  15. Zhang, F.; Xu, H.; Rezaei, S.Z.; Kalghatgi, G.; Shuai, S.J. Combustion and Emission Characteristics of a PPCI Engine Fuelled with Dieseline; SAE paper 2012-01-1138; SAE International: Warrendale, PA, USA, 2012. [Google Scholar]
  16. Bohl, T.; Tian, G.; Smallbone, A.; Roskilly, A.P. Macroscopic spray characteristics of next-generation bio-derived diesel fuels in comparison to mineral diesel. Appl. Energy 2017, 186, 562–573. [Google Scholar] [CrossRef]
  17. EPA. Finalizes Regulations for the National Renewable Fuel Standard Program for 2010 and Beyond-Regulatory Announcement; United States Environmental Protection Agency: Washington, DC, USA, 2010. [Google Scholar]
  18. Adams, C.A.; Loeper, P.; Krieger, R.; Andrie, M.J.; Foster, D.E. Effects of biodiesel–gasoline blends on gasoline direct-injection compression ignition (GCI) combustion. Fuel 2013, 111, 784–790. [Google Scholar] [CrossRef]
  19. Misra, R.D.; Murthy, M.S. Blending of additives with biodiesels to improve the cold flow properties, combustion and emission performance in a compression ignition engine—A review. Renew. Sustain. Energy Rev. 2011, 15, 2413–2422. [Google Scholar] [CrossRef]
  20. U.S. Department of Energy. Biodiesel Handling and Use Guide, 5th ed.; DOE/GO-102016-4875; U.S. Department of Energy: Washington, DC, USA, 2016.
  21. Tang, C.; Guan, L.; Eng, Z.; Zhan, C.; Yang, K.; Huang, Z. Effect of di-n-butyl ether blending with soybean-biodiesel on the near-nozzle spray characteristics. Fuel 2017, 191, 300–311. [Google Scholar] [CrossRef]
  22. Wang, X.; Huang, Z.; Kuti, O.A. Experimental and analytical study on biodiesel and diesel spray characteristics under ultra-high injection pressure. Int. J. Heat Fluid Flow 2010, 31, 659–666. [Google Scholar] [CrossRef]
  23. Fu, W.; Li, F.; Meng, K. Experiment and analysis of spray characteristics of biodiesel blending with di-n-butyl ether in a direct injection combustion chamber. Energy 2019, 185, 77–89. [Google Scholar] [CrossRef]
  24. Ma, Y.; Huang, R.; Huang, S. Experimental investigation on the effect of n-pentanol blending on spray, ignition and combustion characteristics of waste cooking oil biodiesel. Energy Convers. Manag. 2017, 148, 440–455. [Google Scholar] [CrossRef]
  25. Hoang, A. Experimental study on spray and emission characteristics of a diesel engine fueled with preheated bio-oils and diesel fuel. Energy 2019, 171, 795–808. [Google Scholar] [CrossRef]
  26. Mo, J.; Tang, C.; Li, J.; Guan, L.; Huang, Z. Experimental investigation on the effect of n-butanol blending on spray characteristics of soybean biodiesel in a common-rail fuel injection system. Fuel 2016, 182, 391–401. [Google Scholar] [CrossRef]
  27. Das, S.; Kim, K.; Lim, O. Experimental study on non-vaporizing spray characteristics of biodiesel-blended gasoline fuel in a constant volume chamber. Fuel Process. Technol. 2018, 178, 322–335. [Google Scholar] [CrossRef]
  28. Zhong, W.; Li, B.; He, Z.; Xuan, T.; Lu, P.; Wang, Q. Experimental study on spray and combustion of gasoline/hydrogenated catalytic biodiesel blends in a constant volume combustion chamber aimed for GCI engines. Fuel 2019, 253, 129–138. [Google Scholar] [CrossRef]
  29. Chen, H.; Su, X.; Li, J.; Zhong, X. Effects of gasoline and polyoxymethylene dimethyl ethers blending in diesel on the combustion and emission of a common rail diesel engine. Energy 2019, 171, 981–999. [Google Scholar] [CrossRef]
  30. Putrasari, Y.; Lim, O. A Study on Combustion and Emission of GCI Engines Fueled with Gasoline-Biodiesel Blends. Fuel 2017, 189, 141–154. [Google Scholar] [CrossRef]
  31. Putrasari, Y.; Lim, O. A study of a GCI engine fueled with gasoline-biodiesel blends under pilot and main injection strategies. Fuel 2018, 221, 269–282. [Google Scholar] [CrossRef]
  32. Dumouchel, C. On the experimental investigation on primary atomization of liquid streams. Exp. Fluids 2008, 45, 371–422. [Google Scholar] [CrossRef]
  33. Bekdemir, C. Numerical modeling of Diesel spray formation and combustion. Master’s Thesis, Eindhoven University of Technology, Eindhoven, The Netherlands, 2008. [Google Scholar]
Figure 1. Schematic diagram of the experimental setup (the fuel injection system and the constant-volume chamber).
Energies 13 04819 g001
Figure 2. Optical setups for (a) the microscopic spray, (b) macroscopic spray visualizations, and (c) the constant volume chamber system.
Energies 13 04819 g002
Figure 3. Alignment of the microscopic images (@8000 fps) in the time domain resulting in an effect equivalent to a higher frame rate.
Energies 13 04819 g003
Figure 4. Post-processed microscopic image.
Energies 13 04819 g004
Figure 5. Microscopic images obtained under injection pressures of (a) 40 MPa and (b) 120 MPa.
Energies 13 04819 g005
Figure 6. Microscopic spray penetration of GB fuels according to the injection pressure (GB00: gasoline 100% and biodiesel 0%, GB05: gasoline 95% and biodiesel 5%, GB20: gasoline 80% and biodiesel 20%, GB40: gasoline 60% and biodiesel 40%).
Energies 13 04819 g006
Figure 7. Spray projected areas of GB fuels according to the injection pressure. Top row: 40MPa, Middle row: 80 MPa, Bottom row: 120 MPa (GB00: gasoline 100% and biodiesel 0%, GB05: gasoline 95% and biodiesel 5%, GB20: gasoline 80% and biodiesel 20%, GB40: gasoline 60% and biodiesel 40%).
Energies 13 04819 g007
Figure 8. Spray atomization regimes of GB fuels during the initial spray development, according to the injection pressure (GB00: gasoline 100% and biodiesel 0%, GB05: gasoline 95% and biodiesel 5%, GB20: gasoline 80% and biodiesel 20%, GB40: gasoline 60% and biodiesel 40%).
Energies 13 04819 g008
Figure 9. Particle numbers observed in the spray development of GB fuels according to the injection pressure. Top row: 40MPa, Middle row: 80 MPa, Bottom row: 120 MPa(GB00: gasoline 100% and biodiesel 0%, GB05: gasoline 95% and biodiesel 5%, GB20: gasoline 80% and biodiesel 20%, GB40: gasoline 60% and biodiesel 40%).
Energies 13 04819 g009
Figure 10. Mean diameters of the particles observed around the spray development of GB fuels according to the injection pressure. Top row: 40MPa, Middle row: 80 MPa, Bottom row: 120 MPa (GB00: gasoline 100% and biodiesel 0%, GB05: gasoline 95% and biodiesel 5%, GB20: gasoline 80% and biodiesel 20%, GB40: gasoline 60% and biodiesel 40%).
Energies 13 04819 g010
Figure 11. The injection rates of the fuels under injection pressures of 40, 80, and 160 MPa, upper figure: Energizing time 470us, lower figure: Energizing time 1020us (GB00: gasoline 100% and biodiesel 0%, GB05: gasoline 95% and biodiesel 5%, GB20: gasoline 80% and biodiesel 20%, GB40: gasoline 60% and biodiesel 40%).
Energies 13 04819 g011
Figure 12. Macroscopic spray penetration of GB fuels according to the injection pressure (GB00: gasoline 100% and biodiesel 0%, GB05: gasoline 95% and biodiesel 5%, GB20: gasoline 80% and biodiesel 20%, GB40: gasoline 60% and biodiesel 40%).
Energies 13 04819 g012
Figure 13. Spray cone angle of GB fuels according to the injection pressure. Top row: 40MPa, Middle row: 80 MPa, Bottom row: 120 MPa (GB00: gasoline 100% and biodiesel 0%, GB05: gasoline 95% and biodiesel 5%, GB20: gasoline 80% and biodiesel 20%, GB40: gasoline 60% and biodiesel 40%).
Energies 13 04819 g013
Table 1. Physical properties of the GB00 (neat gasoline), GB05, GB20, and GB40 fuels used in this study [1,2,3,4,5,6,7].
PropertyUnitTest MethodGB00GB05GB20GB40B100
Density at 15 °Ckg/m3KS M ISO 12185:2003712.7722.3757.1789.3882.3
LubricitymmKS R ISO 12156-1:2012548290236212189
Cloud point at 15 °C °CKS M ISO 3015:2008−57−57−16−83
Kinematic viscosity at 40 °Cmm2/sKS M ISO 3104:20080.735 [1]0.9097 [2]1.4338 [2]2.1326 [2]4.229
Heating value MJ/kgASTM D240:200945.86 43.643.639.79
Surface tension at 20 °CmN/mASTM D971:200918.93 [3]19.56 [4]21.53 [4]24.07 [4]31.7 [5]
Stoichiometric air–fuel ratio - 14.7 14.27613.85212.58
Octane number (RON)- 91 [6] ---
Cetane number (CN)- 16.38 23.931.4354 [7]
Blend ratio of gasoline- 1.00.950.800.60-
Table 2. Experimental conditions and optical setup for spray visualization.
Ambient Conditions
Ambient gas density (kg/m3)1.2
Ambient temperature (K)310
FuelsGB00, GB05, GB20, GB40
Fuel temperature (K)313
Injector typeBosch solenoid CRIN 2
Nozzle orifice diameter (mm)0.30
Injector nozzle typeSingle hole SAC
Injection pressure (MPa)40, 80, 120
Injection duration (µs)1000
Optical setupMicroscopic imagingMacroscopic imaging
Light sourceSolid state laser MGL-W-532nm
Frame rate (frame/sec)800040,000
Exposure time (µs)0.373.25
Image resolution (pixel × pixel)1024 × 752512 × 256
Scaling factor (mm/pixel)0.0040.179
Aperturef/2.8f/2.8

