1. Introduction
Battery energy storage systems (BESSs) operating within microgrids and in isolation can improve the electrical grid’s operational flexibility [
1]. The ability of microgrids to act as an isolated grid capable of islanding away from a region’s interconnected electrical grid can also enhance resilience for parties covered by microgrid assets [
2]. In recent years, an extensive body of literature has formed around questions addressing the economic and resilience benefits of microgrids.
Optimal sizing and scheduling of remote microgrid assets operating in isolation have been addressed in several recent studies. For example, [
3] proposes a risk-based stochastic approach to optimally scheduling microgrid assets. In [
4], a Monte Carlo simulation-based stochastic programming approach is used to define an optimal design for a remote microgrid based on reliability and cost criteria. Based on the assessment of a subset of representative days, annualized costs and fuel consumption rates are minimized through the optimal scaling and operation of microgrid assets in [
5]. The coordination of wind turbines, an energy storage system and a diesel generator operating in a remote microgrid is achieved through a dynamic programming method in [
6].
There have also been several articles recently published that focus on maximizing the economic benefits of distributed energy resources (DERs) operating behind-the-meter (BTM) under normal conditions while in grid-connected mode. A mixed integer programming method is proposed in [
7] for optimally scaling battery energy storage systems (BESS) to minimize total investment and minimize the deviation between scheduled and actual imported power to the end user. Optimal DER planning with the objective of minimizing fuel consumption while complying with state renewable energy mandates at industrial sites and campus communities is addressed in [
8]. The authors address this problem through the use of Lagrange Multipliers with consideration given to numerous factors, including climate conditions, environmental regulations and energy resource availability. In [
9], the economic returns of a BESS are evaluated while operating BTM at a military base in the Independent System Operator New England (ISO-NE) territory and when being used to minimize energy and demand charges, reduce capacity payments and participate in regional demand response programs. This study evaluates a range of BESS power and energy capacities in order to optimally scale the system based on the landscape of economic opportunity.
There is a smaller subset of the literature base dedicated to simultaneously evaluating the economic and resiliency performance of microgrids. In [
10], the authors propose a resiliency-oriented microgrid optimal scheduling method. Under normal operation, it minimizes the operating costs of the microgrid. For resiliency analyses during outages, it solves a max–min problem to minimize the worst-case energy imbalance. Although both economic and resiliency are covered in the analyses, limited bill reduction benefits (only time-of-use pricing) is considered and no asset failure is modeled. The authors of [
11] evaluate both the economic and resiliency benefits of DERs, including BESS and photovoltaic (PV) units, integrated into large buildings. This study evaluates the energy cost reductions associated with microgrid operations but does not include the value of outage mitigation. In [
12], an approach is proposed for optimally scaling a solar-plus-storage system in order to minimize financial losses caused by disruptions resulting from grid outages. In [
13], a method is proposed for incorporating the value of resilience delivered by BESSs and PV systems into investment decisions for building-scale microgrids.
The main contributions of this paper are twofold.
Unlike many existing microgrid planning and expansion studies that consider either economic or resilience benefits, this paper presents an innovative evaluation framework for microgrid assets to capture economic benefits from various grid and BTM services in grid-connecting mode and resilience benefits in islanding mode.
As for the resiliency analysis, an innovative method was proposed to explicitly quantify the microgrid survivability against a random outage. The method proposed here models the stochastic nature of PV generation, system load, and potential distributed generator (DG) failure during an outage. In addition, to optimally use the microgrid assets, coordination strategies are developed to minimize unserved energy and improve system survivability, considering different levels of system connectedness. In particular, rules are proposed to fairly distribute unserved energy among facilities when load shedding becomes inevitable.
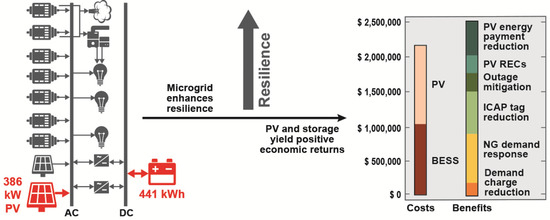
The proposed framework has been applied to evaluate a proposed microgrid in Northampton, Massachusetts that would link the Northampton Department of Public Works (DPW), Cooley Dickenson Hospital (CDH), and Smith Vocational Area High School (SVAHS). The findings of this analysis indicate that over a 20-year economic life, a 441 kW/441 kWh BESS and 386 kW PV solar array can generate $2.5 million in present value benefits, yielding a 1.16 return on investment (ROI) ratio. Results of this study also show that forming a microgrid generally improves system survivability, but the resilience performance of individual facilities varies depending on power-sharing strategies.
The rest of this paper is organized as follows. In
Section 2, we present an overview of the Northampton Microgrid Project (NMP) and outline the methods and data used to perform the economic and resilience evaluations of the NMP. Using the proposed methods, NMP economic returns were defined and resiliency analysis was performed for a number of representative scenarios characterized by season, system connectedness, DER availability, and outage durations. Analysis results are presented in
Section 3.
Section 4 presents a discussion of the results within the context of other recent microgrid assessments.
Section 5 presents study conclusions.
2. Materials and Methods
The City of Northampton, Massachusetts, in partnership with the CDH, was awarded a
$3,078,960 grant from the Massachusetts Department of Energy Resources (DOER) to develop a microgrid as part of its Community Clean Energy Resiliency Initiative. The grant stemmed from a DOER-supported analysis of three linked Northampton facilities. These facilities include: CDH, the SVAHS, and the Northampton DPW. SVAHS is a 10-building school campus that serves approximately 600 people a day. The facility also acts as the regional Red Cross Emergency Shelter while providing emergency overflow services for CDH. The Northampton DPW provides support for a number of critical city functions, including emergency services radio communication, flood control, stormwater systems, and clean water processing and delivery. The CDH campus includes emergency services facilities, as well as a number of other patient care facilities and serves approximately 2500 people each day under normal conditions and 1000 during an emergency. All three facilities are shown in
Figure 1.
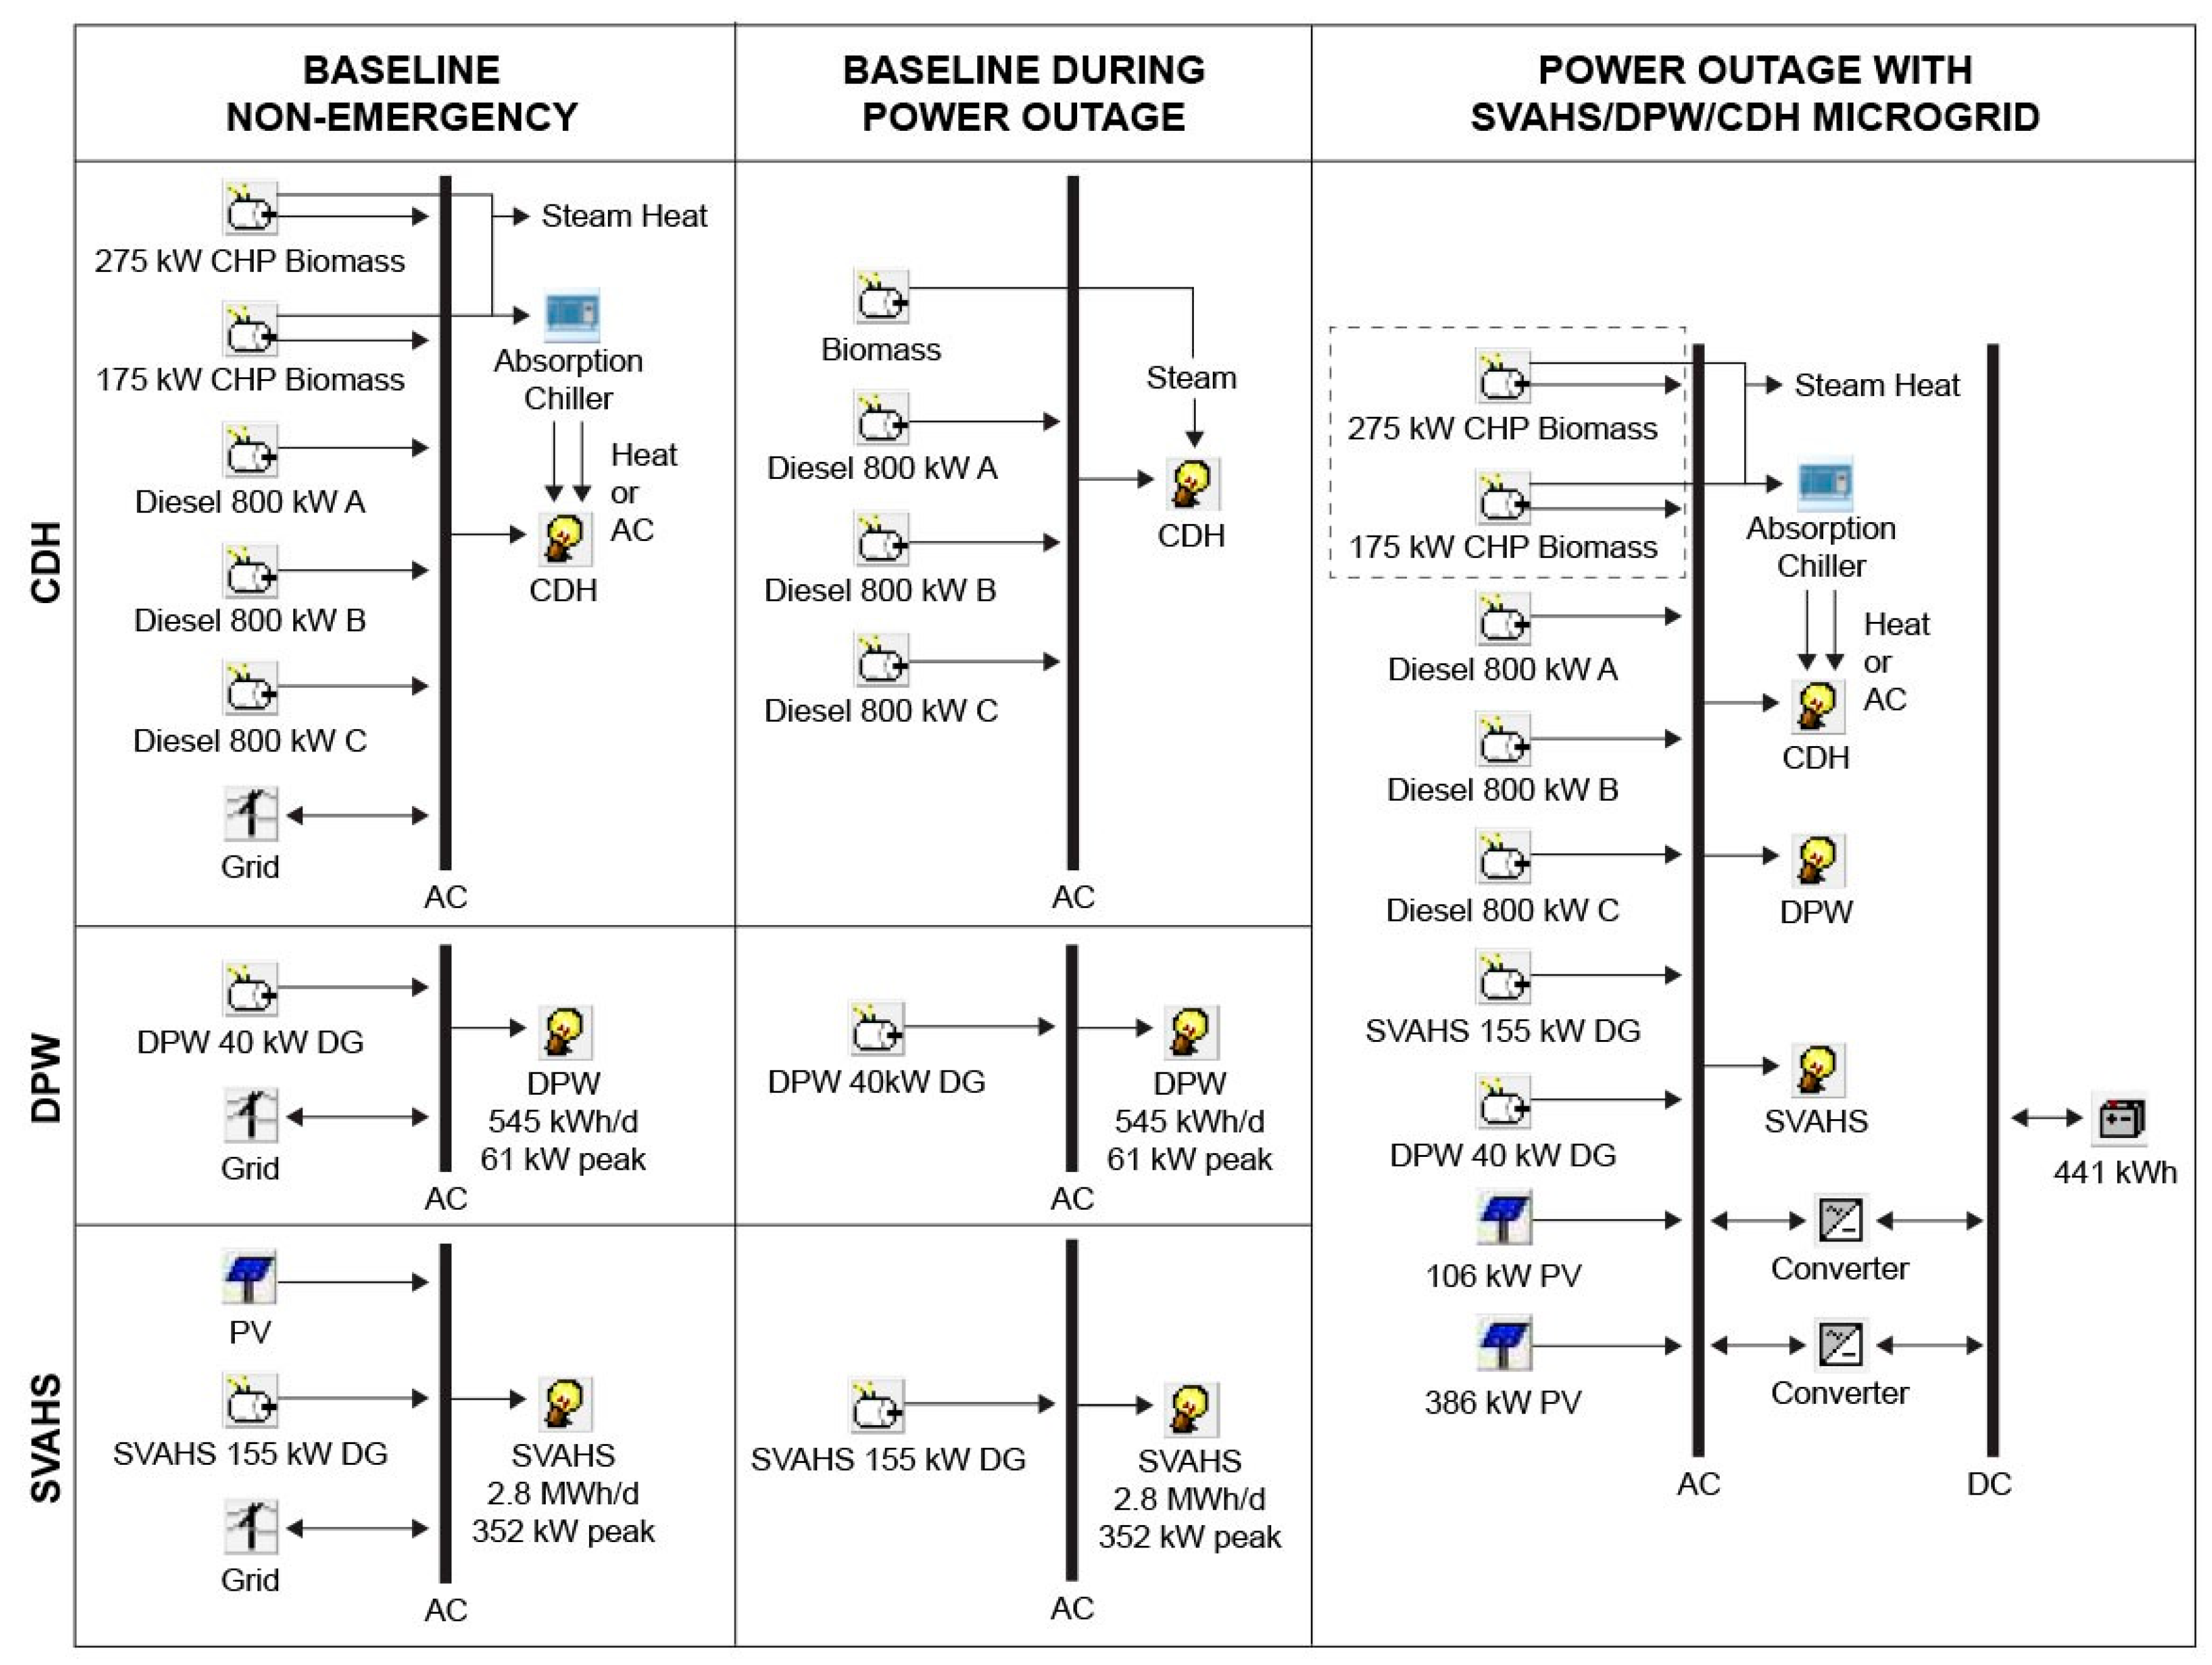
The NMP, which is in the design phase, is planned to be comprised of PV, energy storage, a biomass facility, and diesel generators. During normal operations these assets will be operated in isolation in order to minimize the electricity bills of each separate facility. In the event of an outage these assets will be aggregated to create an islanded microgrid capable of enhancing the resiliency for all three facilities.
Currently, CDH operates a 275 kW biomass steam turbine generation unit and a 175 kW turbine supporting a 700 ton absorption chiller. CDH is considering the addition of a 386 kW PV array, as well as a 441 kW/441 kWh BESS. Under current NMP plans, the BESS included in the microgrid will use a lithium-ion battery technology. This was chosen over a sealed lead acid battery due to the sensitivity of the latter to deep discharges, which the battery would face during outage events. While a lithium-ion battery’s economic life would not typically be expected to exceed 10 years, this analysis assumes that an augmentation plan, or extended warranty, is purchased to extend its life to 20 years. Additionally, SVAHS currently has a 106 kW PV array installed and existing diesel generators at the three sites include:
- 1.
155 kW at SVAHS;
- 2.
40 kW at the DPW; and,
- 3.
2.4 MW at the CDH (3 units at 800 kW each).
Figure 2 presents the aforementioned power components as currently configured at all three facilities when operating under either normal or emergency conditions. The enhanced microgrid as it would operate during power outages is presented in the far-right box. Note that the biomass facilities were excluded from the resiliency analysis because they would trip off during voltage sags and would therefore be unsuitable for providing power when operated in islanded mode.
The objectives in conducting this research have been to define and model the financial and resilience opportunities available to the City of Northampton, Massachusetts associated with installing a microgrid connecting the Northampton DPW, CDH, and SVAHS. This section presents the methodologies employed on our economic and resiliency assessments.
2.1. Economic Methodology
The energy assets proposed for the microgrid were modeled to enable simulation of Northampton microgrid operations. Bundling of services (providing multiple services over a set period) was analyzed and the improvement in the overall economics of the microgrid evaluated.
The Battery Storage Evaluation Tool (BSET—PNNL, Richland, WA, USA), which was developed by this project team for Pacific Northwest National Laboratory (PNNL), was used to estimate the economic benefits of a BESS and a PV unit. A large linear programming problem was formulated to maximize the total benefits from multiple value streams, considering various system- and component-level constraints, such as power balancing, BESS charging/discharging limits, state of charge dynamics, models for each individual use cases and their couplings. The mathematical basis of the BSET model was presented in [
16].
Economic benefits associated with NMP operations were modeled in BSET for a one-year period. BSET was used to determine the value of each use case or service and the number of hours the BESS would optimally engage in providing each service. After microgrid operations were modeled for one year, the results were used for several purposes, including: (a) evaluating the economic benefits of the planned BESS and PV additions, and (b) assessing microgrid capacity to improve resiliency.
This economic assessment evaluates each of the services outlined below:
National Grid demand charge reduction
National Grid demand response program participation
ISO-NE installed capacity tag reduction
Outage mitigation
Energy purchase reduction through PV array production
PV renewable energy credits (RECs)
Each of the services above and their associated methodologies will be described later in this section. Prior to this discussion, we focus first on the load analysis that supported the economic optimization.
2.1.1. Load Analysis
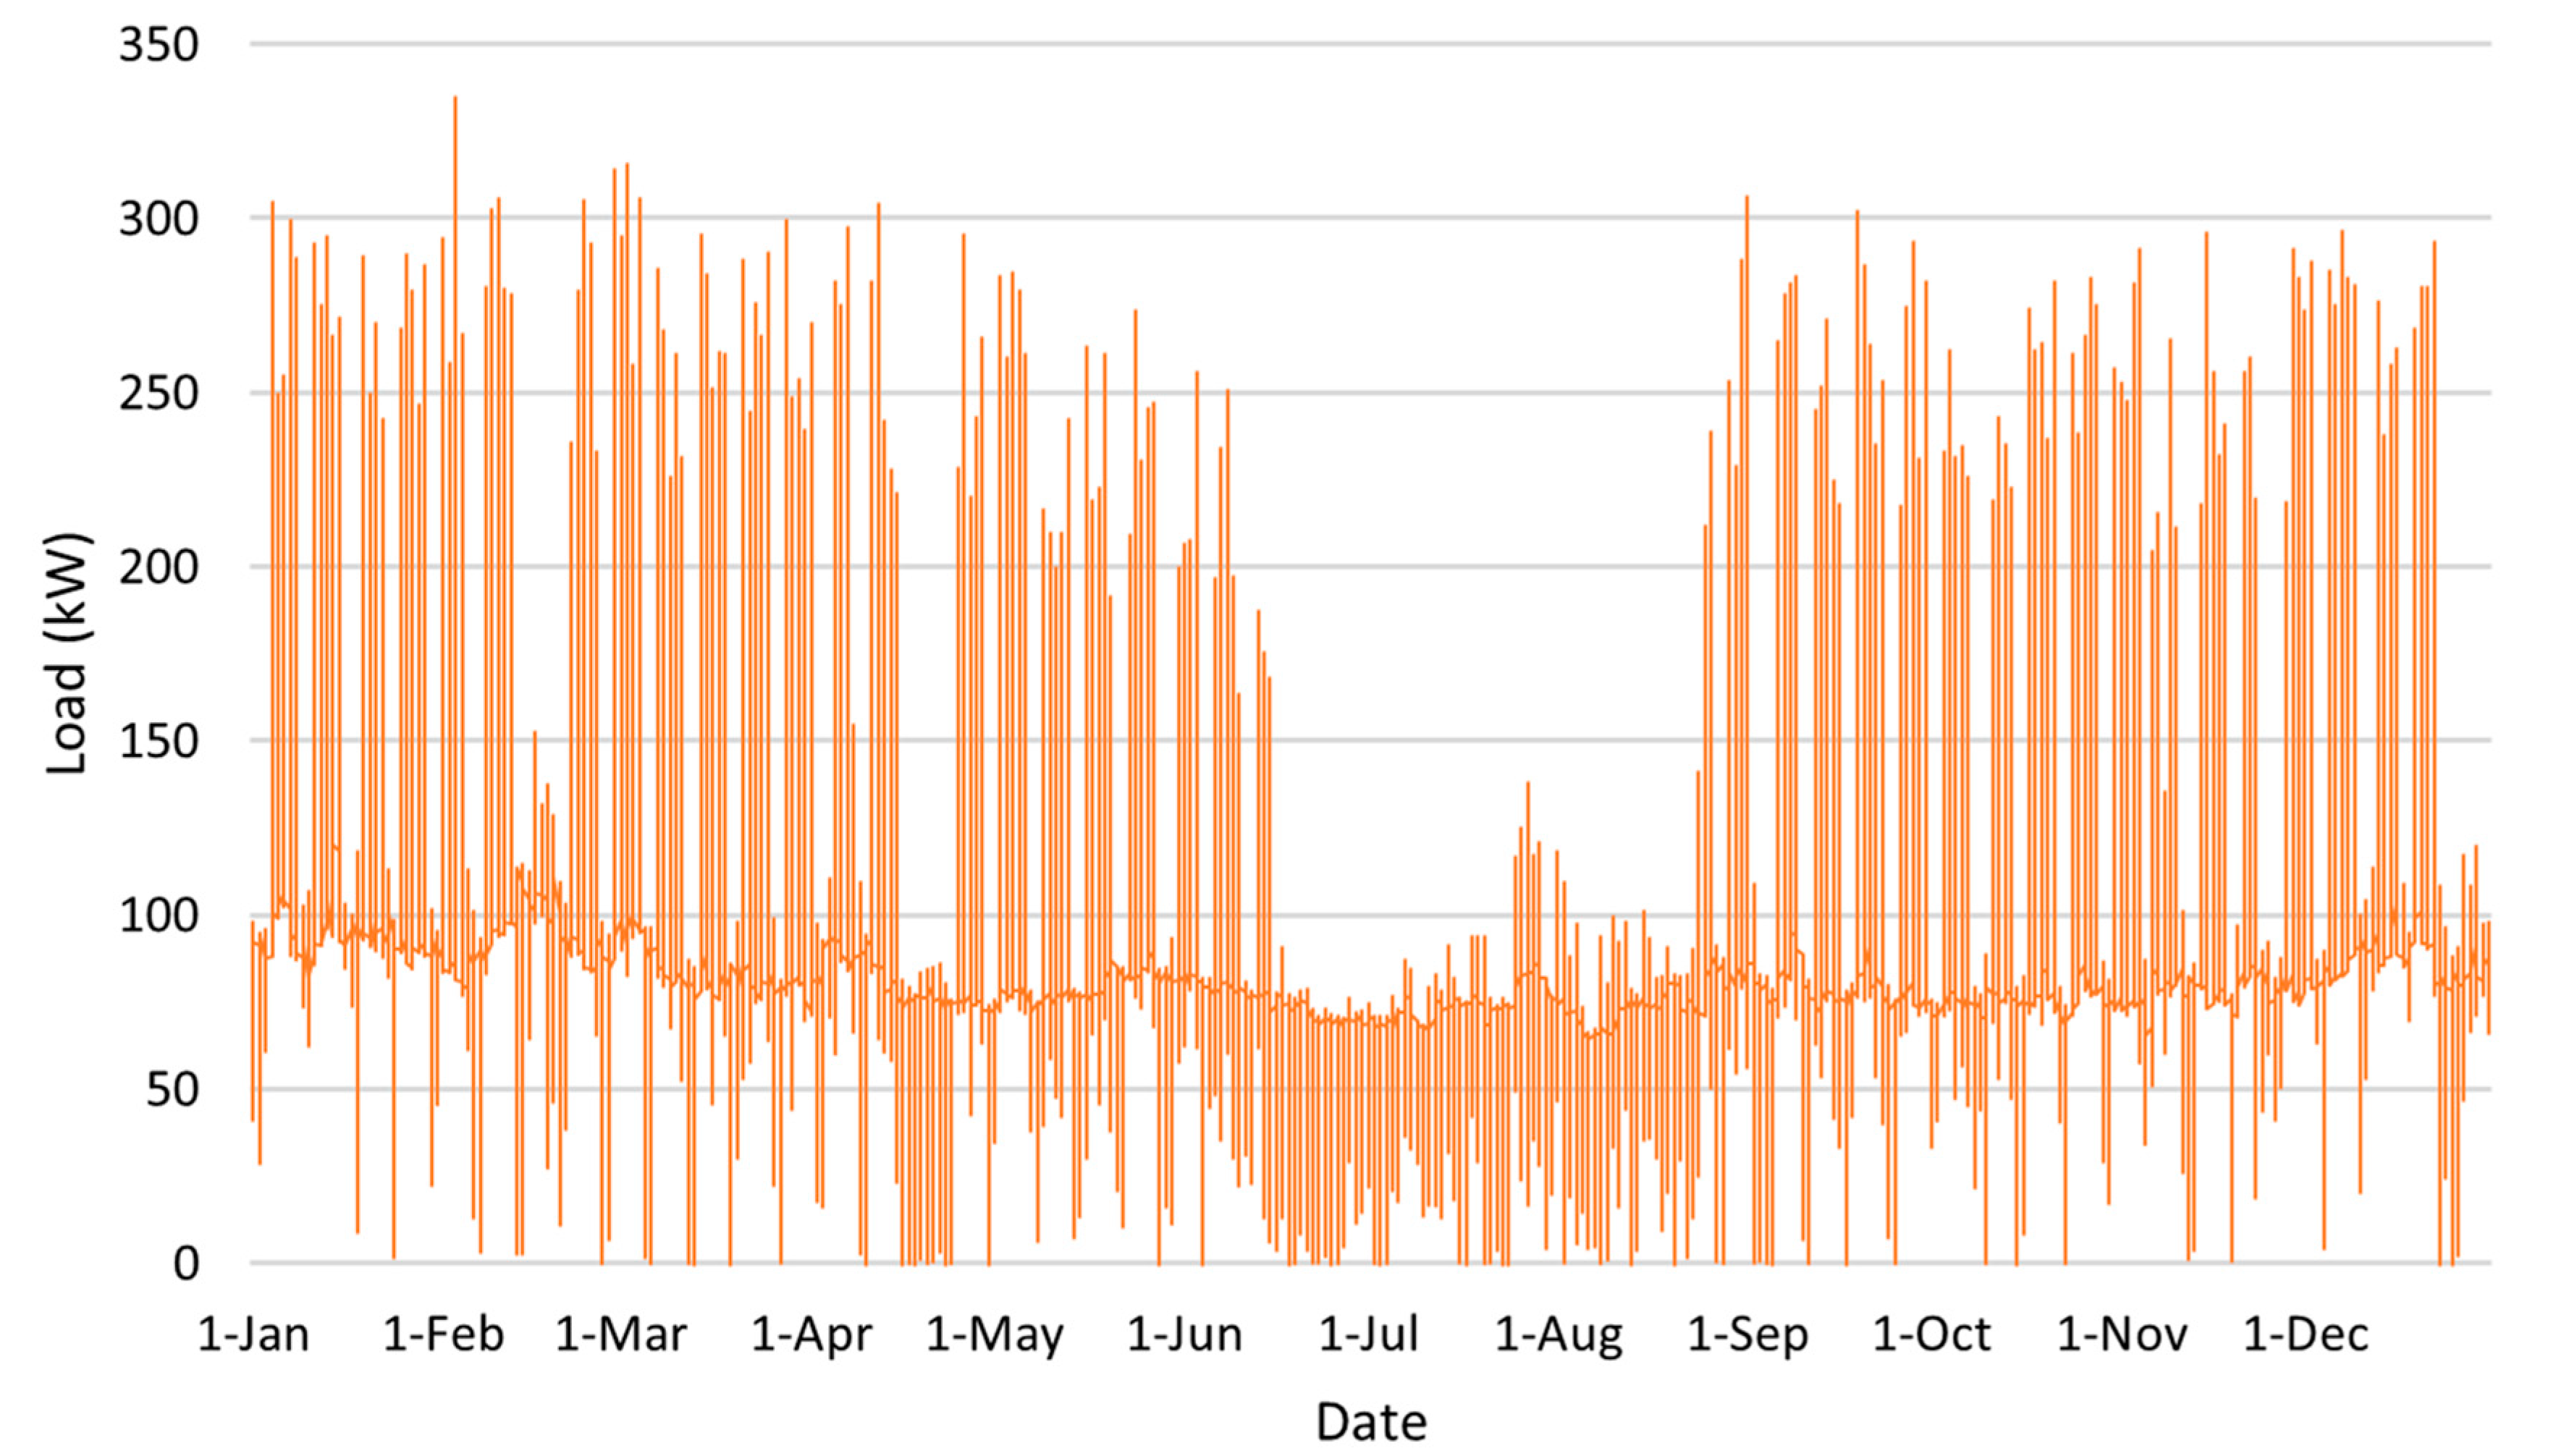
The CDH and SVAHS each have historical interval electricity data available from the utility to assist with understanding electric loads, variation, and sizing of the microgrid system (
Figure 3 and
Figure 4). However, the Northampton DPW facility did not have a record of electrical load at such intervals, and only monthly billing totals were available. Therefore, the Facility Energy Decision System (FEDS—PNNL, Richland, WA, USA) software was used to derive representative load profiles for the DPW buildings.
FEDS is a building energy simulation and analysis tool developed by PNNL, which has been used extensively to understand energy use and opportunities for cost-effective energy saving projects within single building and multi-building campuses across the U.S. and around the world. FEDS relies on detailed building system inputs and is backed by a sophisticated inference engine to allow for relatively quick yet robust modeling of building systems, loads, and energy use. Key inputs range from building types, size, vintage, location, hourly weather data, plus details on occupancy, building envelope, lighting, heating, cooling, ventilation (HVAC), and hot water systems. Based on the inputs and inferred parameters, FEDS performs an hourly simulation of energy use at each technology, end use, and building level. An hourly profile for energy use for each fuel consumed is one of the outputs and is used to represent the electricity load profile for buildings for resilience assessments and input for sizing of backup power or microgrid systems [
17].
There are two buildings at the Northampton DPW site: a small administration building and a garage. These are shown in the satellite image in
Figure 5. The administration building is 3868 ft
2 and was built in 1973. The 20,700 ft
2 garage is an old trolley barn built around the start of the 20th century, and provides vehicle bays, shops, and some limited office space. Without the ability to perform an on-site walk-through, available data on occupancy, HVAC, and hot water systems were provided by City of Northampton staff, along with the result of recent assessments that included information on envelope characteristics, lighting types, and counts. Google Earth satellite and street view imagery (Apache Software Foundation, Wakefield, MA, USA) was used to help validate select data, and fill in gaps regarding modeling geometries, construction characteristics, window fraction, and more. Energy billing data was also provided by the city, including monthly electricity and natural gas consumption for recent years.
FEDS models were developed for each of the two DPW buildings based on data provided and gathered from available sources. One of the unique features of FEDS is that it requires only a relatively small set of input parameters in order to begin modeling. Parameters not specified are automatically inferred by FEDS to the most likely value based on all of the specified inputs (including but not limited to building type, size, vintage, location, use, and technology types). These inferences are based on a combination of building survey data, building codes, equipment standards, along with decades of experience with buildings and building systems. All inferred values can be reviewed, updated or overridden by the modeler.
Screen captures of the two DPW FEDS models are shown in
Figure 6. They show high-level building inputs for each model, along with some of the details modeled for lighting, HVAC, and hot water systems. Additionally, FEDS is able to infer base plug and process loads for each building based on use type. For the DPW garage, two distinct use areas were modeled covering the garage/shop and office areas.
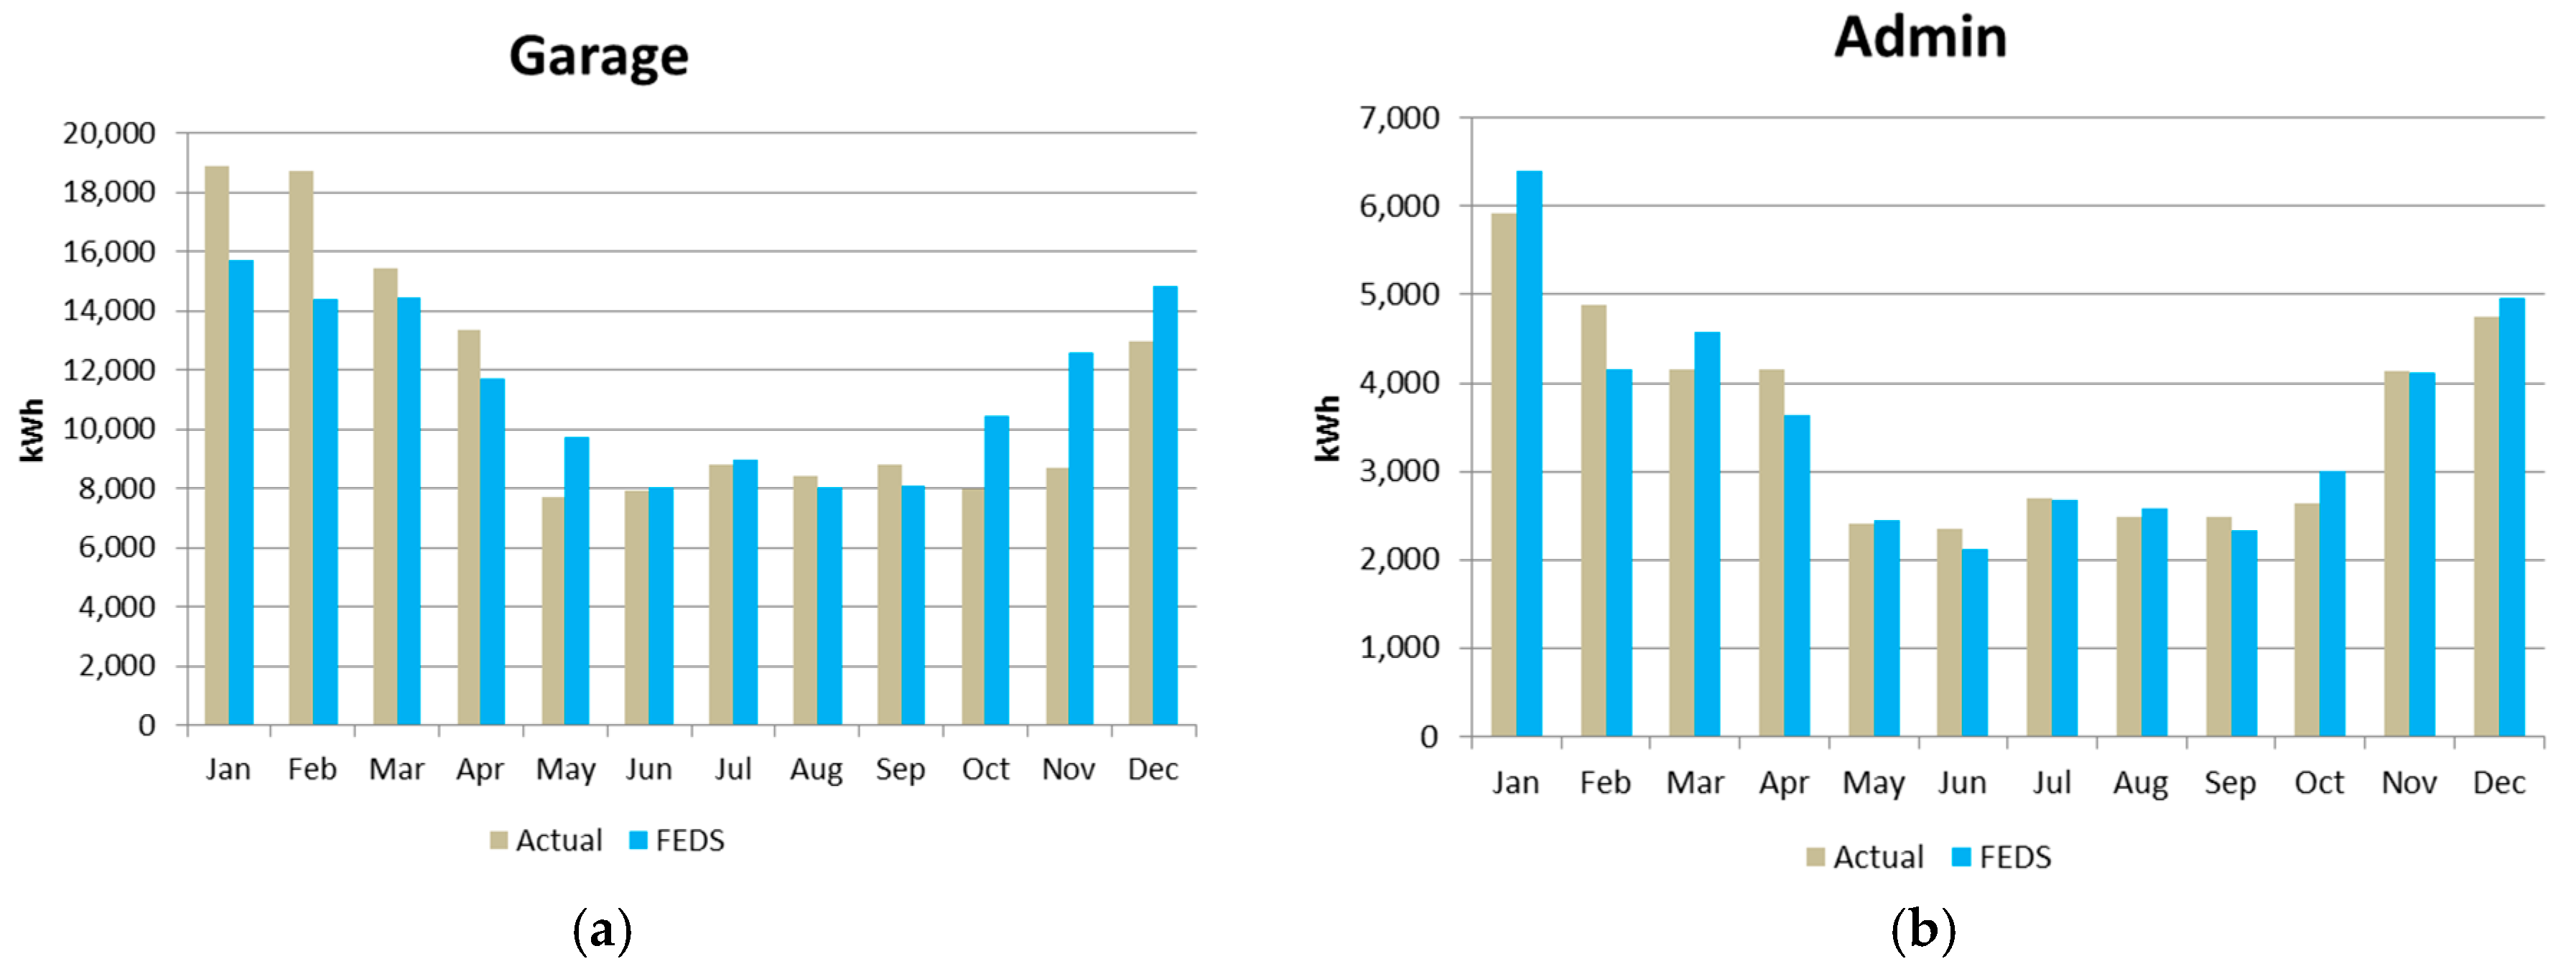
Once developed, the FEDS models were reviewed and calibrated to recent historical meter data to ensure a representative simulation and resulting load profiles. A weather adjustment was applied to the typical meteorological year weather data used by the FEDS simulation, based on the actual weather trends for each calibration year. The models were calibrated to both 2017 and 2018 metered consumption data for each building. Both models were calibrated to match the annual energy consumption while maintaining similar monthly magnitude and trends. Results of the calibration comparing monthly electricity consumption from the FEDS simulation compared to actual consumption are highlighted by
Figure 7.
Once the building models were satisfactorily calibrated, each building model was simulated with FEDS to produce a representative hourly load profile covering an entire year. A typical meteorological weather year was applied to represent typical historical weather patterns against the calibrated models. The resulting annual hourly electric load profile for the two DPW buildings, as simulated by FEDS, is shown in
Figure 8.
2.1.2. Use Cases
This section defines the use cases that could result in financial benefits to the NMP partners. The methods used to assign value to the benefits tied to both BESS and PV operations are defined.
National Grid Demand Charge Reduction
The three sites that comprise the microgrid all purchase energy from National Grid—a large distribution utility that serves customers in Massachusetts and beyond. Every month, each of these microgrid members faces a demand charge of
$5.76/kW on their energy bills, which is correlated to their single highest 15 min load between the hours of 8:00 am and 9:00 pm, Monday through Friday. If the BESS reduced the peak load in a given month by 200 kW by discharging at the appropriate times, then
$1152 is obtained in value each month. Of the three sites of the microgrid project, a CDH account had the largest peaks in summer months and, therefore, stands to gain the most benefit through demand charge reduction. Therefore, the battery was modeled at CDH using BSET and historic load data defined in
Section 2.1.1.
National Grid Demand Response Program Participation
A BTM BESS could participate in the Connected Solutions Program, which compensates commercial and industrial customers to curtail their energy when the ISO-NE system is forecasted to be at its peak. A participating BESS would be compensated for the amount of energy curtailed on a pay-for-performance basis.
The program offers three options to participate:
- 1.
Targeted dispatch to reduce load at the peak hour of the year (two to eight dispatch events per summer), valued at $35/kW—summer.
- 2.
Daily dispatch to reduce load at the peak hour of the year and during daily peaks in July and August (30–60 dispatch events per summer), valued at $200/kW—summer.
- 3.
Winter dispatch to reduce load during five peak hours of the winter, valued at $25/kW—winter.
The events last between two to three hours for daily dispatch and three hours for targeted dispatch. An event can happen anytime between 2:00–7:00 pm on non-holiday weekdays during summer or winter. For a 441 kW/441 kWh BESS, only one-third of its capacity could be bid into the demand response program because the basis of compensation is the average energy discharged during the three-hour window.
Based on input directly from a distribution utility in Massachusetts, we assume the daily dispatch events will start on 1 July and would be held on every non-holiday weekday from 4:00–7:00 pm until all 60 calls take place. The summer and winter targeted dispatch are typically scheduled to occur on the days when the utility expects the summer and winter peaks to happen, respectively. For the winter program, we assume that calls occur on the five peak days registered during winter, which all fall between 1 January and 7 January.
We assume that the BESS would participate in the daily dispatch and targeted winter dispatch program. While additional benefits could be obtained by participating in the summer targeted dispatch program, the BESS would have to provide twice the capacity to obtain those benefits simultaneously while also participating in the daily dispatch program. Therefore, we exclude the summer targeted dispatch program.
ISO-NE Installed Capacity Tag Reduction
The members of the Northampton microgrid face a monthly charge called the installed capacity (ICAP) tag. The charge amount is dependent on their measured load during ISO-NE’s peak hour each year. This calculation is made only once a year but affects the following year’s monthly bills. That is, an ICAP calculated in July of 2020 will not take effect until June 2021 at the start of the next billing season.
The price for the ICAP follows an annual schedule, multiple years of which are shown in
Table 1. Forecasts beyond the actual values provided in the table were provided by National Grid for an analysis of a BESS deployed on Nantucket Island, Massachusetts. More information regarding this forecast can be found in [
19].
Typically, the ISO-NE annual peak occurs in June, July, or August and usually between the hours of 2:00–5:00 pm. It is also important to note that it will almost certainly be coincident with one of the National Grid demand response events described previously. That is, by hitting all National Grid demand response events during a summer, it is almost guaranteed to hit the ICAP tag date/time, picking up double benefits for the same load reduction.
Table 2 shows historic values of when the ICAP tag has been called.
Reductions in load tied to PV production are also included in the value obtained for this use case. Solar production reduces the registered demand during the system-wide peak, thereby reducing the total kW-demand that forms the basis of the ICAP tag.
Outage Mitigation
In the event of an outage, the BESS has the capability to effectively operate in an islanded mode. This operation would be monetized in terms of the value of lost load (VOLL). To estimate the benefits that can be derived from outage mitigation, historical events were examined at DPW and SVAHS. CDH does not experience outages due to the presence of onsite generation, but outages do occur at the Northampton DPW and SVAHS. From these historical outage occurrences, the timing and duration of the outages were defined for these facilities.
In order to assign monetary values to reducing or eliminating potential outages, the findings of [
20] from Lawrence Berkeley National Laboratory were used. This process estimates costs based on customer group (residential, small commercial and industrial (<50,000 annual kWh load) and medium/large commercial and industrial) and the duration of the outage.
Figure 9 presents an example of the trendline used to estimate the cost for different lengths of outage for medium/large commercial and industrial customers.
Outages were modeled with no foresight, meaning that the BESS would not be prepared for outages but rather would use available energy based on its state of charge, along with energy output from the PV unit, to address any outage. The savings to customers served by the microgrid is estimated to be $13,085 annually based on the aforementioned cost assumptions and the duration and frequency of outages.
Energy Purchase Reductions from PV Production
As previously described, the members of the Northampton microgrid purchase their energy from National Grid at time of use rates. The installation of the 386 kW solar array at CDH will reduce their monthly electricity purchases for all hours when the array generates energy.
To evaluate the potential energy production from solar PV panels in Northampton, a number of solar profiles were used with an established solar PV production model. The solar data was gathered from the National Solar Radiation Database (NSRDB)—specifically, the Physical Solar Model (PSM) dataset. This dataset provides both a large temporal coverage over 20 years of data, as well as relatively fine spatial resolution (4 × 4 km) for all locations in the continental U.S. (
Figure 10). The data used in this evaluation is hourly (though 30-min data is also available) [
21].
The data itself is not measured data but rather modeled data based on satellite observations and models that estimate the impact on solar parameters due to atmospheric conditions. A comprehensive evaluation of the modeling techniques can be found at [
22], which shows that modeled PSM data has a mean bias error of ±5% to ±10%, depending on the solar parameter. Though higher accuracy is always more desirable, for the purposes of this analysis this data was deemed sufficient.
Based on the PV modeling, the solar is expected to produce approximately 406,228 kWh of energy each year. An annual rate of degradation of 0.5% was assumed.
PV RECs
RECs are renewable energy certificates that solar owners receive at a rate of 1 REC per MWh of produced solar energy. These certificates are oftentimes sold to utilities so that they may meet renewable portfolio standards outlined in their state. Electricity providers must obtain RECs as proof that they have met guidelines for renewable generation. Various programs exist across various states that offer higher compensation for RECs, Massachusetts included. However, the 386 kW solar array would currently only be able to qualify for Class I RECs, which could be sold in the Class I REC auction.
Figure 11 shows recent Class I REC prices, including those in Massachusetts, from Power Advisory, LLC. Using these auction prices in combination with the solar production analysis, value can be estimated [
23].
2.1.3. Valuation Model
PNNL used BSET to model the operation of a BESS and a PV unit on an hourly basis over a year to evaluate their benefits. For each service, revenue or avoided costs were defined on an hourly basis using the methods outlined in the previous section, along with any power reservation or energy requirements to satisfy the demands of each use case. BSET was then used to co-optimize the benefits among these services, subject to the technical constraints of the BESS. Model output includes the value of, and the number of hours the BESS would be engaged in providing, each service.
2.1.4. Costs and Financial Parameters
The individual cost components of the project are broken down in
Table 3 and
Table 4.
Table 3 presents upfront costs incurred at the outset of the project except for fixed operations and maintenance (O & M) costs, which are incurred on an annual basis. For
Table 4, it is assumed that major maintenance is conducted in Years 7 and 14 with full battery module replacement in Year 10. Maintenance and replacement are required to ensure battery operation for 20 years—lithium-ion systems typically have a 10-year usable life otherwise.
The cost of the PV array was estimated based on the median
$2.95/watt cost from commercial solar producers in Massachusetts, estimated by the Massachusetts Clean Energy Center for 2018–2019 [
24]. Based on this cost estimate, the total cost of the 386 kW array is estimated to be
$1.14 million. A detailed pro forma for the BESS and PV systems were prepared to estimate full costs. The financial parameters used in the pro forma are presented in
Table 5.
Based on the combination of costs and financial parameters outlined previously in this section, the researchers were able to produce a pro forma that accounted for full system costs. For the BESS, total costs for Northampton amount to
$1,024,299. For the solar PV, the present value cost is
$1,298,844 based on the median
$/watt rate for commercial PV installations in Massachusetts from 2018–2019 [
24].
2.2. Resilience Analysis Methodology
A resiliency analysis was conducted in addition to the economic analysis. The objective of the resiliency analysis is to understand the system survivability against a random outage with different starting times and durations in summer and winter seasons, considering different system connectedness, DER availability, and impacts of DG failure rates. The benefits of microgrid operations from the perspective of resiliency is evaluated by comparing the survivability across various scenarios. This section presents the key assumptions and modeling method.
2.2.1. Resiliency Modeling Methodology
To evaluate system resiliency, we randomly generated a large number of outages for each scenario characterized by changes in outage duration, season, system configuration, and DER availability. For each outage event, we formulated an optimal dispatch problem to minimize load shedding. The outputs of the optimal dispatch problem include whether there is any load shedding, DER operating levels, and hours with load shedding for each facility. The results from all outage events are used to calculate the survivability (the probability of the system to survive a random outage) and statistics of unserved energy at the facility level.
In the optimal dispatch formulation, we model the physical capability and operation of each DER:
For the BESS, we adopt the linear model developed in [
16] to capture power and energy limits, charging/discharging efficiencies, and dynamics of battery energy state.
For PV, the same normalized power output in economic analysis is scaled by the installed capacity to calculate its power output in maximum power point tracking mode. Please note that dump energy from PV is allowed when the system cannot absorb all power from PV.
For DG, a simplified linear model is used to represent fuel efficiency and power output limits. DG failure rates under different operating conditions are also considered.
Variables of hourly unserved energy are introduced to capture hourly load shedding in each outage event. A power balancing constraint is introduced for each hour at either the system or facility level, where the total supply from DERs plus unserved energy is equal to the load. For each outage event, the total fuel consumption cannot exceed the onsite fuel storage capacity. The objective of the optimal dispatch problem is, therefore, to minimize the total unserved energy during an outage. When there are multiple optimal solutions, the one with the least fuel consumption is preferred. Additional modeling details are provided as follows.
2.2.2. System Connectedness
We consider three levels of connectedness in the resiliency analysis:
- 1.
No microgrid: This is the case where power-sharing is not enabled among the three facilities. During an outage, each facility purely relies on its local resources to support its load until power balance is maintained at the facility level.
- 2.
Limited microgrid: In this case, power-sharing is allowed but the three DGs at CDH are reserved for the local load. Only the power from PV and the BESS can be exported to support the load at the other two facilities.
- 3.
Full microgrid: This is the case where power can be fully shared among three facilities.
Please note that in limited and full microgrid mode, when load shedding cannot be avoided, we need to determine how to distribute load shedding among the three facilities. In the following, let the term “net demand” at a facility denote the deficit of local generation in relation to the local load. To ensure realistic and reasonable load shedding, we impose two rules during post processing of the results:
a facility should not import and export power simultaneously, and
the amount of energy a facility imports each hour should be proportionate to its net demand. In other words, the total amount of energy export should be proportionally distributed to all facilities requiring energy import according to their net demand.
2.2.3. DG Failure
Three types of DG failure described in [
25] are considered in this resiliency analysis:
- 1.
Fail to start: a DG fails to start up on demand.
- 2.
Fail to load: a DG fails to pick up load after started.
- 3.
Fail to run: a DG fails in the second hour of serving load or later.
The status of each DG is simulated in each hour according to the flowchart in
Figure 12. The function rand() generates a random number that is uniformly distributed between 0 and 1. PFTS, PFTL, and PFTR respectively denote the probability of the three types of failure in an hour. Once a failure occurs, the corresponding DG becomes unavailable and DERs need to be re-dispatched for the remaining hours of an outage.
The optimal dispatch of available assets is formulated as a linear programming problem. The primary objective is to minimize total unserved energy and the secondary is to minimize fuel consumption. The decision variables include: generation power (negative for BESS charging) from each asset in the k-th hour , BESS discharging power , charging power , energy state , imported power at each site in the k-th hour , and unserved load at each site in the k-th hour . Input parameters are hourly load at each site , energy capacity of the BESS at CDH , the efficiency of charging and discharging , rated power of each asset , and hourly power output from PV in maximum power point tracking mode.
In the full microgrid mode, the optimization is formulated as minimize:
subject to
where
R is the fuel consumption rate of DGs and
is a large constant to guarantee that reducing unserved load energy is prioritized over fuel conservation.
In the limited microgrid mode, only the power from PV and the BESS can be exported to support the load at the other two facilities. Another constraint is added to ensure that the power exported from CDH does not exceed the total power from the BESS and PV:
In the case of no microgrid, (15) should be replaced by (16) to disable power sharing.
3. Results
This section is divided into two sections presenting first the economic analysis results and, last, the results of the resiliency analysis.
3.1. Economic Analysis Results
The economic analysis is designed to define the value that the NMP can achieve and to inform the development of operational guidelines for securing value post deployment. In so doing, the analysis could also be useful to other microgrid operators facing similar investment decisions and those attempting to extract maximum value from existing microgrid assets.
3.1.1. Evaluation of Benefits and Costs
In this section, benefits associated with BESS and PV operations are specified. Results are presented in
Table 6 and
Figure 13.
Over the 20-year economic life of the BESS and PV array, we estimate that the benefits would total approximately $2.5 million, presented in present value terms. Of the benefits tied to BESS operation, the largest portion (28.3% of total benefits) results from demand response benefits, which measure $711.7 thousand. The second largest benefit of BESS operations is from ICAP tag reduction at $605.6 thousand or 24.1% of total benefits. PV benefits, comprised of energy savings and RECs, total $735.5 thousand or 29.3% of the total. When compared to present value system costs of $2.2 million, net benefits are calculated at $345.2 thousand. The overall return on investment is 1.16, meaning that every dollar of investment would be expected to yield $1.16 in returns.
The research team conducted sensitivity analysis (SA) to test the effects of varying certain parameters on study results. The various scenarios are outlined below and their impacts were measured in comparison to the base case. SA was performed by making the following adjustments to the assumptions:
SA 1: Vary discount rate by +/−1%
SA 2: Vary price growth rate by +/−1%
Use DOER grant to eliminate cost of BESS.
The results of each SA are presented in
Figure 14. Note that the table with results appears below the figure. Decreasing the discount rate by 1% led to an increase of
$311 thousand in total net present value (NPV) benefits, while increasing it by 1% decreased NPV by
$166 thousand. Increasing the annual benefit growth rate by 1% resulted in an NPV increase of
$264 thousand and a 1% decrease resulted in an NPV drop of
$129 thousand. Using a grant from the DOER to eliminate all capital costs associated with the BESS would improve NPV by
$577 thousand.
3.1.2. Financial Impact of Incentives
There are a number of incentive programs that could improve the financial results of the NMP. NMP partners have already taken advantage of the Community Clean Energy Resiliency Initiative administered by the Massachusetts DOER. The NMP was awarded a $3.1 million grant under this program, which was designed to address long-duration outages, a need that became clear after Massachusetts experienced significant electricity service disruptions in the aftermath of Hurricane Sandy.
Several clean energy incentive programs could also yield benefits for this and other microgrid projects. If the PV and/or storage were procured through a power purchase agreement with a private third-party vendor, additional tax benefits could accrue to the vendor and ultimately be passed through to the partners. With the capital cost of the PV system and BESS exceeding
$1.7 million, the value of a 30% Federal Investment Tax Credit would be
$515 thousand. Microgrid financials could also be improved as a result of a statewide carbon tax. Carbon taxes around the world reach as high as
$139 per ton CO
2e in Sweden [
26]. To explore the value of a
$50/ton carbon tax, the annual value of CO
2 savings associated with PV production (406 MWh) was first multiplied by the average CO
2 emissions (808 pounds) per MWh of net generation for the State of Massachusetts [
27]. That yields 164 tons of annual CO
2 emission reductions, which would be valued at
$8206 annually or
$160 thousand in present value terms over a 25-year economic life of the PV array.
3.2. Resiliency Analysis Results
Following the proposed modeling method, we performed comprehensive analysis for the system considering 72 scenarios with different combinations of the following aspects:
- 1.
With and without the 386 kW PV at CDH
- 2.
Outage durations: 3 days, 7 days, and 14 days
- 3.
With and without modeling DG failure rates
- 4.
Seasons: summer (June–October) and winter (November–May)
- 5.
System connectedness: no microgrid, limited microgrid, and full microgrid.
In all scenarios, 10,000 outage events are generated to evaluate the system survivability. Key resiliency analysis results are summarized as follows.
3.2.1. With PV Array at CDH
One of the key metrics of resiliency is the survival rate of a system. It is calculated as
The survival rate and fuel consumption of the system under various scenarios are presented in
Figure 15. In the figure, different colors are used to differentiate facilities, and shapes for system connectedness. The summer season is denoted by filled markers, whereas the winter season is represented by unfilled ones. Marker sizes are used to represent outage lengths. In addition, a dot is added to the center of the marker for scenarios where DG failures are considered. The exact numbers are recorded in tables in the following sections for 3 days, 7 days, and 14 days outages, respectively.
Three Days Outages
The survivability for each facility with different levels of connectedness is summarized in the key observations and insights provided below, which are based on the results presented in
Table 7.
Forming a microgrid helps to increase survivability for all facilities, and the “Full Microgrid” mode results in the highest resiliency level.
In the “No Microgrid” and “Limited Microgrid” modes, SVAHS and DPW are more likely to survive outages in summer than those in winter because their loads are generally lower in summer.
When DG failures are considered, survivability of CDH in the “Full Microgrid” mode is slightly better than that in the “Limited Microgrid” mode. Limited power-sharing from CDH causes frequent charging and discharging of the battery, which leads to more frequent DG start-ups and increasing DG failures.
The mean total fuel consumption of the system in the same outages are presented in
Table 8. The diesel reserve of 15,200 gallons is more than enough to cope with 3 days outages. In fact, it is likely to be sufficient for any outage shorter than two weeks.
Seven Days Outages
The survival rates of the system and the fuel consumption in 7 days outages are summarized in
Table 9 and
Table 10, respectively. We have very similar observations as in 3 days outages. The benefit of forming a microgrid becomes more significant.
Fourteen Days Outages
The survival rates of the system and the fuel consumption in 14 days outages are summarized in
Table 11 and
Table 12, respectively. Key observations and insights are provided below.
Compared with 3 days and 7 days outages, survival rates drop significantly for prolonged outages due to fuel shortages;
Survival rates in summer are lower because the total energy consumption is higher;
CDH is more likely to survive in the “No Microgrid” mode, because fuel is conserved for CDH by not sharing power while shedding loads at SVAHS and DPW.
3.2.2. Without PV Array at CDH
To evaluate the benefits of installing the PV array at CDH in terms of the resiliency improvement of the system, we run a similar analysis for the system without the PV array and compare the results with the previous ones. The results are presented in
Figure 16.
Three Days Outages
Compared with the case with CDH PV, significantly lower survival rates of SVAHS and DPW under the “Limited Microgrid” mode are observed because the PV and BESS were the only assets that can help support the load at SVAHS and DPW under this mode. Results are presented in
Table 13 and
Table 14.
Seven Days Outages
For 7 days outages, there are similar observations as for 3 days outages. The survivability differences between “No DG Failure” and “With DG Failures”, as well as that among different levels of system connectedness, become more significant due to the longer outage duration. Results are presented in
Table 15 and
Table 16.
Fourteen Days Outages
Compared to results with PV arrays at CDH included, worse survival rates across the board are observed. The energy that would have been generated by PV arrays will have to be generated by DGs instead. The fuel shortage is therefore aggravated. Results are presented in
Table 17 and
Table 18.
An interesting observation under the “No Microgrid” mode is that CDH is more likely to survive when DG failures are considered. This is because the failures of DGs at SVAHS and DPW effectively save fuel for CDH. The benefit of such savings is manifested in the 14 days outages cases due to the shortage of fuel. Similar phenomena can also be observed in the “Limited Microgrid” mode.
4. Discussion
This report examines the economic and resilience benefits of a proposed microgrid in Northampton, Massachusetts that would link the Northampton DPW, CDH, and SVAHS. We modeled financial benefits of microgrid operations—including demand response revenue, capacity charge reduction, demand charge reduction, outage mitigation, energy charge reductions due to solar PV energy production, and renewable energy credits—by simulating one-year of microgrid operations in BSET. The simulation resulted in an estimate that is technically achievable given the capacities of the microgrid assets and the co-optimization algorithms that ensure no double counting of benefits. To evaluate resilience benefits, we performed a comprehensive analysis for the system considering 72 scenarios characterized by changes in outage duration, season, system configuration, and distributed generator availability.
There are a number of studies that have estimated the economic benefits of DERs in the northeastern U.S. In these studies, outage mitigation benefits are typically measured in terms of improvements in outage statistics (e.g., system average interruption duration index, system average interruption frequency index) or VOLL to customers. In [
19], the Nantucket Island distribution network was modeled using two open-source simulation programs, OpenDSS (Electric Power Research Institute, Palo Alto, CA, USA) and GridLAB-D (PNNL, Richland, WA, USA), and historic outages over an 11-year period were modeled with the change in outage costs to customers due to the use of a combustion turbine generator with a temperature-dependence maximum capacity of 16 MW and a 6 MW/48 MWh lithium-ion BESS being measured. In [
28], VOLL was estimated for a number of scenarios varying based on BESS energy capacity, with the BESS being used to provide power to the town’s police station and dispatch center in an islanded mode during outages.
This paper presents a comprehensive approach that considers both economic and resilience benefits. While the economic analysis effectively captures stacked value streams and an innovative method was used to quantify microgrid survivability against a random outage, more research could be done to evaluate tradeoffs between economic and resilience objectives. In addition, a refined model could be used to optimally scale microgrid assets given resilience targets or to maximize resilience benefits with net costs of the assets set to meet certain budget constraints.
5. Conclusions
This report examined the operational and economic benefits of a microgrid proposed in Northampton, Massachusetts that would link the Northampton DPW, CDH, and SVAHS. Historically, all three of these facilities have experienced half-day to two days outages due to severe weather events with the longest outage in recent years lasting three days. A DOER-supported analysis investigated the potential to link these three facilities together and confirmed the capability of the three campuses to island from the grid and continue operating for up to three days with grant-supported investments in microgrid infrastructure. If successfully implemented, the microgrid could offer substantial benefits to the facilities by mitigating the outages to which they have historically been subjected.
PNNL was engaged by the U.S. Department of Energy to review, modify, and model these potential benefits, as well as evaluate the technical performance and financial opportunities available to the NMP partners. The results provide insights into operation of the microgrid by the three partners. The following lessons were drawn from this analysis:
- 1.
Over a 20-year life, the BESS and the 386 kW solar array are estimated to generate $2.5 million in present value benefits. This value exceeds the $2.2 million in present value costs necessary to install, maintain, and operate the assets. The overall ROI ratio for the project under this scenario is 1.16.
- 2.
Sensitivity analysis showed that decreasing the discount rate by one percent led to an increase of $311 thousand in NPV benefits while increasing it by one percent decreased NPV by $166 thousand. Increasing the annual benefit growth rate by 1% resulted in an NPV increase of $264 thousand and a 1% decrease resulted in an NPV drop of $129 thousand. Using a grant from the DOER to eliminate all capital costs associated with the BESS would improve NPV by $577 thousand.
- 3.
With the PV array included at CDH, forming a microgrid helps increase survivability of all facilities when a three days outage strikes. Limited power sharing under this scenario causes frequent charging and discharging of the battery system, which leads to more frequent DG start-ups and increasing DG failures. When there is a full microgrid, no DG failure, and it is the winter season, all three facilities have a survivability of 100%. With no microgrid and the assumption of DG failures, the SVAHS survivability drops to 6.54% and DPW survivability drops to 41.43%.
- 4.
Under seven days outage scenarios, the benefits of forming a microgrid become more significant. With full sharing between all microgrid members, all facilities are able to withstand 100% of the outage in both summer and winter. When factoring in DG failure probability, the average survivability across all three facilities when the microgrid exists drops to around 95% per facility in summer and 99% per facility in winter. If no microgrid exists, the survivability of SVAHS and the DPW during a seven days outage in summer and assuming no DG failure drops to 41.24% and 88.95%, respectively. Under the same scenario, but with DG failure assumed, the SVAHS survivability drops to <1% and DPW to 18.43%.
- 5.
When 14 days outages are considered, survivability drops significantly due to fuel shortage. Summer survivability is lower than winter due to higher total energy consumption. Under all scenarios under this outage duration, CDH has higher survivability when no microgrid exists. When a full microgrid is assumed, all facilities have an approximate eight percent survivability rate in summer regardless of DG failure. In winter, this increases substantially to about 67% across all facilities. In summer and without a microgrid, CDH has an approximate 25% survivability rate while SVAHS has <1% and DPW has an 8.35% survivability, assuming no DG failure. If DG failure is assumed, both SVAHS and DPW have <1% chance of surviving the outage while CDH only drops to 23.5%.
- 6.
When the potential PV array at CDH is removed from the microgrid configuration, survival rates drop for SVAHS and DPW especially. Compared with the case with CDH and PV, significantly lower survival rates of SVAHS and DPW under “Limited Microgrid” mode are observed, because the PV and BESS were the only assets that can help support the load at SVAHS and DPW under this mode.
- 7.
The worst subset of scenarios for resilience across all scenarios is a 14 days outage with no PV. Under this configuration and when there is a full microgrid in summer, there is a zero percent survivability rate across all facilities both with and without DG failure considered. In winter, the survivability under the same configuration increases to approximately 53% for each facility. CDH is consistently better off with no microgrid during long-duration outages as they are able to reserve fuel that would otherwise be shared with other microgrid members.
The results of this and other similar microgrid assessments demonstrate that when certain conditions are present, well-designed microgrids hold the potential to achieve resiliency goals while largely, if not entirely, paying for themselves through grid operations. While diesel and natural gas-fired generators may offer the least costly option for achieving resiliency goals, their operation may be limited to emergency conditions due to noise and emission constraints. Microgrids that include generators plus PV and BESSs could lower the net cost of the system required to meet resiliency goals by generating revenue during normal grid operations to offset system costs.
Author Contributions
Conceptualization, P.B., D.W. (Di Wu), and R.D.; validation, P.B.; formal analysis, K.M., P.B., D.W. (Di Wu), D.W. (Dexin Wang) and R.D.; investigation, K.M., P.B., D.W. (Di Wu), D.W. (Dexin Wang), R.D. and V.F.; resources, P.B.; data curation, K.M., P.B., D.W. (Di Wu), D.W. (Dexin Wang), R.D. and V.F.; writing—original draft preparation K.M., P.B., D.W. (Di Wu), D.W. (Dexin Wang) and R.D.; writing—review and editing, P.B.; visualization, P.B., D.W. (Di Wu) and R.D.; supervision, P.B.; project administration, P.B.; funding acquisition, P.B. All authors have read and agreed to the published version of the manuscript.
Funding
This research was funded by the U.S. Department of Energy under contract number DE-AC05-76RL01830.
Acknowledgments
We are grateful to Imre Gyuk, who is the Energy Storage Program Manager in the Office of Electricity at the U.S. Department of Energy, for providing financial support and leadership on this and other related work at Pacific Northwest National Laboratory. We are also grateful to Chris Mason of the City of Northampton, Massachusetts for the data, information, and insights he offered the team throughout the study.
Conflicts of Interest
The authors declare no conflict of interest.
Abbreviations
| BESS | battery energy storage system |
| BSET | Battery Storage Evaluation Tool |
| BTM | behind-the-meter |
| CDH | Cooley Dickenson Hospital |
| DER | distributed energy resources |
| DG | distributed generator |
| DOER | Massachusetts Department of Energy Resources |
| DPW | Northampton Department of Public Works |
| FEDS | Federal Energy Decisions System |
| HVAC | heating, ventilation, and air conditioning |
| ICAP | installed capacity |
| ISO-NE | Independent System Operator New England |
| NMP | Northampton Microgrid Project |
| NPV | net present value |
| NSRDB | National Solar Radiation Database |
| O&M | operations and maintenance |
| PNNL | Pacific Northwest National Laboratory |
| PSM | physical solar model |
| PV | photovoltaics |
| REC | renewable energy credit |
| ROI | return on investment |
| SA | sensitivity analysis |
| SVAHS | Smith Vocational Area High School |
| VOLL | value of lost load |
References
- Balducci, P.; Alam, M.J.E.; Hardy, T.D.; Wu, D. Assigning value to energy storage systems at multiple points in an electrical grid. Energy Environ. Sci. 2018, 11, 1926–1944. [Google Scholar] [CrossRef]
- Parhizi, S.; Lotfi, J.; Khodaei, A.; Bahramirad, S. State of the art in research on microgrids: A review. IEEE Access 2015, 3, 890–925. [Google Scholar] [CrossRef]
- Bahramara, S.; Sheikhahmadi, P.; Golpîra, H. Co-optimization of energy and reserve in standalone micro-grid considering uncertainties. Energy 2019, 176, 792–804. [Google Scholar] [CrossRef]
- Hajipour, E.; Bozorg, M.; Fotuhi-Firuzabad, M. Stochastic capacity expansion planning of remote microgrids with wind farms and energy storage. IEEE Trans. Sustain. Energy 2015, 6, 491–498. [Google Scholar] [CrossRef]
- Yuan, C.; Illindala, M.S.; Khalsa, A.S. Co-optimization scheme for distributed energy resource planning in community microgrids. IEEE Trans. Sustain. Energy 2017, 8, 1351–1360. [Google Scholar] [CrossRef]
- Babazadeh, H.; Gao, W.; Wu, Z.; Li, Y. Optimal energy management of wind power generation system in islanded microgrid system. In Proceedings of the North American Power Symposium, Manhattan, KS, USA, 22–24 September 2013; pp. 1–5. [Google Scholar] [CrossRef]
- Alhaider, M.; Fan, L. Mixed integer programming based battery sizing. Energy Syst. 2014, 5, 787–805. [Google Scholar] [CrossRef]
- Yuan, C.; Illindala, M.S.; Haj-ahmed, M.A.; Khalsa, A.S. Distributed energy resource planning for microgrids in the United States. In Proceedings of the IEEE Industry Applications Society Annual Meeting, Addison, TX, USA, 18–22 October 2015; pp. 1–9. [Google Scholar] [CrossRef]
- Fotedar, V.; Balducci, P.; Warwick, M.; Wu, D.; Wang, D.; Mongird, K. Opportunities for Dispatchable Power Projects in the New England System Operator Area; PNNL-29279; Pacific Northwest National Laboratory: Richland, WA, USA, 2019. [Google Scholar]
- Khodaei, A. Resiliency-oriented microgrid optimal scheduling. IEEE Trans. Smart Grid 2014, 5, 1584–1591. [Google Scholar] [CrossRef]
- Rosales-Asensio, E.; de Simón-Martín, M.; Borge-Diez, D.; Blanes-Peiró, J.; Colmenar-Santos, A. Microgrids with energy storage systems as a means to increase power resilience: An application to office buildings. Energy 2019, 172, 1005–1015. [Google Scholar] [CrossRef]
- Simpkins, T.; Anderson, K.; Cutler, D.; Olis, D. Optimal sizing of a solar-plus-storage system for utility bill savings and resiliency benefits. In Proceedings of the Innovative Smart Grid Technologies Conference, Minneapolis, MN, USA, 6–9 September 2016; pp. 1–6. [Google Scholar] [CrossRef]
- Laws, N.D.; Anderson, K.; DiOrio, N.A.; Li, X.; McLaren, J. Impacts of valuing resilience on cost optimal PV and storage systems for commercial buildings. Renew. Energy 2018, 127, 896–909. [Google Scholar] [CrossRef]
- Apache Software Foundation. Apache License Version 2.0. Available online: https://www.apache.org/licenses/LICENSE-2.0 (accessed on 11 September 2020).
- Apache Software Foundation. Google Earth Satellite Imagery. Coordinates: 42.3335308° N, 72.6574563° W. Available online: https://www.google.com/maps/@42.3335308,-72.6574563,144m/data=!3m1!1e3 (accessed on 11 September 2020).
- Wu, D.; Jin, C.; Balducci, P.; Kintner-Meyer, M. An Energy Storage Assessment: Using Optimal Control Strategies to Capture Multiple Services. In Proceedings of the IEEE Power and Energy Society General Meetings, Denver, CO, USA, 26–30 July 2015; PNNL-SA-106768. IEEE: Piscataway, NJ, USA, 2015; pp. 1–5. [Google Scholar] [CrossRef]
- Dahowski, R.T. Facility Energy Decision System, Release 8.0; PNNL-29974; Pacific Northwest National Laboratory: Richland, WA, USA, 2020. [Google Scholar]
- Apache Software Foundation. Google Earth Satellite Imagery. Coordinates: 42.3313872° N, 72.6552245° W. Available online: https://www.google.com/maps/@42.3313872,-72.6552245,679m/data=!3m1!1e3 (accessed on 11 September 2020).
- Balducci, P.J.; Alam, M.E.; McDermott, T.E.; Fotedar, V.; Ma, X.; Wu, D.; Bhatti, B.A.; Mongrid, K.; Bhattarai, B.; Crawford, A.J.; et al. Nantucket Island Energy Storage System Assessment; PNNL-28941; Pacific Northwest National Laboratory: Richland, WA, USA, 2019. [Google Scholar]
- Sullivan, M.; Schellenberg, K.; Blundell, M. Updated Value of Service Reliability Estimates for Electric Utility Customers in the United States; Prepared for U.S. Department of Energy by Lawrence Berkeley National Laboratory; Lawrence Berkeley National Laboratory: San Francisco, CA, USA, 2015. [Google Scholar]
- “NSRDB Data Viewer”. National Renewable Energy Laboratory. Golden, CO. Available online: https://maps.nrel.gov/nsrdb-viewer/?aL=x8CI3i%255Bv%255D%3Dt%26ozt_aP%255Bv%255D%3Dt%26ozt_aP%255Bd%255D%3D1&bL=dI6joO&cE=0&lR=0&mC=42.326189357961205%2C-72.64185905456543&zL=13 (accessed on 15 May 2020).
- Habte, A.; Sengupta, M.; Lopez, A. Evaluation of the National Solar Radiation Database (NSRDB) Version 2; Technical Report NREL/TP-5D00-67722; National Renewable Energy Laboratory: Golden, CO, USA, 2017; pp. 1998–2015. [Google Scholar]
- “New England Class I REC Market Update”. Power Advisory LLC. Available online: https://poweradvisoryllc.com/new-england-class-i-rec-market-update/ (accessed on 11 May 2020).
- MassCEC’s Solar Costs Comparison Tool. Massachusetts Clean Energy Center. Boston, MA. Available online: https://www.masscec.com/solar-costs-performance (accessed on 18 May 2020).
- Nuclear Energy Institute. Regulatory Assessment Performance Indicator Guideline; Appendix F; Nuclear Energy Institute: Washington, DC, USA, 2013. [Google Scholar]
- Balducci, P.; Wu, D.; Ramachandran, T.; Campbell, A.; Fotedar, V.; Mongird, K.; Huang, S.; Bhatnagar, D.; Jones, S.; Smith, C.; et al. Power-to-Gas. System Valuation: Final Report; PNNL-ACT-10095; Pacific Northwest National Laboratory: Richland, WA, USA, 2020. [Google Scholar]
- Energy Information Administration. State Electricity Profiles, Massachusetts Electricity Profile 2018. Available online: https://www.eia.gov/electricity/state/massachusetts/ (accessed on 1 September 2020).
- Byrne, R.; Hamilton, S.; Borneo, D.; Olinsky-Paul, T.; Gyuk, I. The Value Proposition of Energy Storage at the Sterling Municipal Light Department; SAND2017-1093; Sandia National Laboratories: Albuquerque, NM, USA, 2017. [Google Scholar]
Figure 1.
Satellite Google Earth image of CDH, SVAHS, and Northampton DPW. Map data: Apache License, Version 2.0, Google, 2020 [
14,
15].
Figure 1.
Satellite Google Earth image of CDH, SVAHS, and Northampton DPW. Map data: Apache License, Version 2.0, Google, 2020 [
14,
15].
Figure 2.
Existing and planned power components of the Northampton microgrid project.
Figure 2.
Existing and planned power components of the Northampton microgrid project.
Figure 3.
SVAHS hourly peak load, 2016.
Figure 3.
SVAHS hourly peak load, 2016.
Figure 4.
CDH hourly peak load, 2016.
Figure 4.
CDH hourly peak load, 2016.
Figure 5.
Satellite image from Google Earth shows location of Northampton DPW buildings (garage on top and administrative building on bottom). Map data: Apache License, Version 2.0, Google, 2020 [
14,
18].
Figure 5.
Satellite image from Google Earth shows location of Northampton DPW buildings (garage on top and administrative building on bottom). Map data: Apache License, Version 2.0, Google, 2020 [
14,
18].
Figure 6.
FEDS screen shots show the DPW garage (
a) and administrative building (
b) models. Created via the FEDS software [
17].
Figure 6.
FEDS screen shots show the DPW garage (
a) and administrative building (
b) models. Created via the FEDS software [
17].
Figure 7.
Results of FEDS simulated model calibration show monthly electricity consumption vs. actuals for the DPW garage (a) and administrative building (b).
Figure 7.
Results of FEDS simulated model calibration show monthly electricity consumption vs. actuals for the DPW garage (a) and administrative building (b).
Figure 8.
Combined electric load profile for DPW.
Figure 8.
Combined electric load profile for DPW.
Figure 9.
Value of lost load by outage duration to medium/large commercial and industrial customers.
Figure 9.
Value of lost load by outage duration to medium/large commercial and industrial customers.
Figure 10.
NSRDB data viewer. Created via the NSRDB [
21].
Figure 10.
NSRDB data viewer. Created via the NSRDB [
21].
Figure 11.
ISO-NE class 1 REC prices ($/REC).
Figure 11.
ISO-NE class 1 REC prices ($/REC).
Figure 12.
Flowchart to simulate distributed generator (DG) failure in each hour.
Figure 12.
Flowchart to simulate distributed generator (DG) failure in each hour.
Figure 13.
Twenty-year benefits and costs for the Northampton microgrid.
Figure 13.
Twenty-year benefits and costs for the Northampton microgrid.
Figure 14.
Sensitivity analysis results.
Figure 14.
Sensitivity analysis results.
Figure 15.
Survival rate and fuel consumption of the system with PV arrays at CDH.
Figure 15.
Survival rate and fuel consumption of the system with PV arrays at CDH.
Figure 16.
Survival rate and fuel consumption of the system without PV arrays at CDH.
Figure 16.
Survival rate and fuel consumption of the system without PV arrays at CDH.
Table 1.
Independent System Operator New England (ISO-NE) installed capacity (ICAP) tag rates 2018–2023.
Table 1.
Independent System Operator New England (ISO-NE) installed capacity (ICAP) tag rates 2018–2023.
| Year Start | Year End | Capacity ($/kW—Month) |
|---|
| June-2018 | May-2019 | 9.55 |
| June-2019 | May-2020 | 7.03 |
| June-2020 | May-2021 | 5.30 |
| June-2021 | May-2022 | 4.63 |
| June-2022 | May-2023 | 3.80 |
| June-2023 | May-2024 | 2.00 |
Table 2.
ISO-NE historic ICAP tag dates.
Table 2.
ISO-NE historic ICAP tag dates.
| Year | Date | Time |
|---|
| 2001 | 9 August | 2 pm |
| 2002 | 14 August | 2 pm |
| 2003 | 22 August | 2 pm |
| 2004 | 30 August | 3 pm |
| 2005 | 27 July | 2 pm |
| 2006 | 2 August | 2 pm |
| 2007 | 3 August | 2 pm |
| 2008 | 10 June | 2 pm |
| 2009 | 18 August | 2 pm |
| 2010 | 6 July | 2 pm |
| 2011 | 22 July | 2 pm |
| 2012 | 17 July | 4 pm |
| 2013 | 19 July | 4 pm |
| 2014 | 2 July | 2 pm |
| 2015 | 29 July | 4 pm |
| 2016 | 12 August | 2 pm |
| 2017 | 13 June | 4 pm |
| 2018 | 29 August | 4 pm |
| 2019 | 30 July | 5 pm |
Table 3.
Initial costs of energy storage systems.
Table 3.
Initial costs of energy storage systems.
| Item | Cost |
|---|
| DC Modules and Battery Management System | $226,013 |
| Power Conversion System | $187,425 |
| Power Control System | $44,100 |
| Electrical Balance of Plant | $44,100 |
| Construction and Commissioning | $70,560 |
| Fixed O & M Cost (per year) | $3969 |
| Total | $576,167 |
Table 4.
Major maintenance and battery replacement costs for lithium-ion systems.
Table 4.
Major maintenance and battery replacement costs for lithium-ion systems.
| Item | Cost |
|---|
| Major Maintenance ($/kW) | $275 |
| Battery Replacement ($/kWh) | $100 |
Table 5.
Financial parameters used in pro forma.
Table 5.
Financial parameters used in pro forma.
| Parameter | Value |
|---|
| Energy Storage Book Life | 20 years |
| Inflation Rate | 2.5% |
| Benefit Growth Rate | 2.64% |
| Discount Rate | 2.2% |
| Insurance Rate | 0.7% |
| PV Degradation Rate | 0.5%/year |
Table 6.
Northampton microgrid 20-year present value benefits vs. costs.
Table 6.
Northampton microgrid 20-year present value benefits vs. costs.
| Component | Benefits | Costs |
|---|
| Demand Charge Reduction | $183,662 | - |
| NG Demand Response | $711,674 | - |
| ICAP Tag Reduction | $605,555 | - |
| Outage Mitigation | $274,308 | - |
| PV Energy Payment Reduction | $478,620 | - |
| PV RECs | $256,878 | - |
| BESS Costs | - | $1,026,833 |
| PV Costs | - | $1,138,700 |
| Total Benefits and Costs | $2,510,697 | $2,165,533 |
Table 7.
Mean survival rates of the system with CDH PV in 3 days outages.
Table 7.
Mean survival rates of the system with CDH PV in 3 days outages.
| Season | Scenario | No DG Failure | With DG Failures |
|---|
| CDH | SVAHS | DPW | CDH | SVAHS | DPW |
|---|
| Summer | No MG | 100.00 | 45.39 | 94.11 | 96.75 | 27.58 | 52.69 |
| Limited MG | 100.00 | 96.50 | 100.00 | 97.06 | 60.50 | 83.44 |
| Full MG | 100.00 | 100.00 | 100.00 | 97.67 | 98.20 | 99.36 |
| Winter | No MG | 100.00 | 10.92 | 75.85 | 99.55 | 6.54 | 41.43 |
| Limited MG | 100.00 | 79.10 | 89.92 | 99.57 | 44.70 | 67.37 |
| Full MG | 100.00 | 100.00 | 100.00 | 99.64 | 99.61 | 99.90 |
Table 8.
Mean diesel fuel consumption (gallons) of the system with CDH PV in 3 days outages.
Table 8.
Mean diesel fuel consumption (gallons) of the system with CDH PV in 3 days outages.
| Season | Scenario | No DG Failure | With DG Failures |
|---|
| CDH | SVAHS | DPW | CDH | SVAHS | DPW |
|---|
| Summer | No MG | 3385 | 166 | 36 | 3379 | 127 | 27 |
| Limited MG | 3243 | 260 | 90 | 3321 | 184 | 68 |
| Full MG | 3592 | 1 | 0 | 3583 | 5 | 2 |
| Winter | No MG | 2886 | 218 | 51 | 2883 | 165 | 38 |
| Limited MG | 2802 | 287 | 90 | 2861 | 208 | 68 |
| Full MG | 3179 | 0 | 0 | 3177 | 1 | 1 |
Table 9.
Mean survival rates of the system with CDH PV in 7 days outages.
Table 9.
Mean survival rates of the system with CDH PV in 7 days outages.
| Season | Scenario | No DG Failure | With DG Failures |
|---|
| CDH | SVAHS | DPW | CDH | SVAHS | DPW |
|---|
| Summer | No MG | 100.00 | 41.24 | 88.95 | 94.39 | 13.51 | 22.42 |
| Limited MG | 100.00 | 91.29 | 100.00 | 93.03 | 31.38 | 49.61 |
| Full MG | 100.00 | 100.00 | 100.00 | 94.38 | 95.56 | 97.54 |
| Winter | No MG | 100.00 | 2.91 | 70.75 | 98.68 | 0.92 | 18.43 |
| Limited MG | 100.00 | 69.86 | 89.35 | 98.76 | 19.34 | 35.17 |
| Full MG | 100.00 | 100.00 | 100.00 | 98.99 | 98.72 | 99.57 |
Table 10.
Mean diesel fuel consumption (gallons) of the system with CDH PV in 7 days outages.
Table 10.
Mean diesel fuel consumption (gallons) of the system with CDH PV in 7 days outages.
| Season | Scenario | No DG Failure | With DG Failures |
|---|
| CDH | SVAHS | DPW | CDH | SVAHS | DPW |
|---|
| Summer | No MG | 7889 | 391 | 84 | 7874 | 224 | 45 |
| Limited MG | 7569 | 600 | 210 | 7854 | 302 | 114 |
| Full MG | 8378 | 1 | 0 | 8346 | 15 | 5 |
| Winter | No MG | 6758 | 506 | 118 | 6754 | 286 | 64 |
| Limited MG | 6564 | 665 | 210 | 6783 | 349 | 115 |
| Full MG | 7440 | 0 | 0 | 7433 | 4 | 2 |
Table 11.
Mean survival rates of the system with CDH PV in 14 days outages.
Table 11.
Mean survival rates of the system with CDH PV in 14 days outages.
| Season | Scenario | No DG Failure | With DG Failures |
|---|
| CDH | SVAHS | DPW | CDH | SVAHS | DPW |
|---|
| Summer | No MG | 25.27 | 0.08 | 8.35 | 23.50 | 0.03 | 0.49 |
| Limited MG | 8.02 | 26.53 | 60.86 | 8.41 | 0.76 | 4.04 |
| Full MG | 8.04 | 8.39 | 7.98 | 7.51 | 7.83 | 7.92 |
| Winter | No MG | 85.50 | 0.00 | 44.43 | 85.47 | 0.00 | 3.29 |
| Limited MG | 70.04 | 34.63 | 72.74 | 69.78 | 2.38 | 6.54 |
| Full MG | 67.71 | 67.29 | 67.12 | 67.18 | 66.48 | 66.88 |
Table 12.
Mean diesel fuel consumption (gallons) of the system with CDH PV in 14 days outages.
Table 12.
Mean diesel fuel consumption (gallons) of the system with CDH PV in 14 days outages.
| Season | Scenario | No DG Failure | With DG Failures |
|---|
| CDH | SVAHS | DPW | CDH | SVAHS | DPW |
|---|
| Summer | No MG | 14,713 | 428 | 31 | 14,696 | 230 | 34 |
| Limited MG | 13,195 | 1573 | 405 | 14,462 | 401 | 143 |
| Full MG | 15,173 | 0 | 0 | 14,775 | 105 | 28 |
| Winter | No MG | 13,475 | 945 | 203 | 13,465 | 357 | 76 |
| Limited MG | 12,672 | 1622 | 418 | 13,548 | 468 | 144 |
| Full MG | 14,712 | 0 | 0 | 14,647 | 20 | 5 |
Table 13.
Mean Survival rates of the system without CDH PV in 3 days outages.
Table 13.
Mean Survival rates of the system without CDH PV in 3 days outages.
| Season | Scenario | No DG Failure | With DG Failures |
|---|
| CDH | SVAHS | DPW | CDH | SVAHS | DPW |
|---|
| Summer | No MG | 100.00 | 44.97 | 94.49 | 96.20 | 25.80 | 52.37 |
| Limited MG | 100.00 | 64.94 | 100.00 | 95.24 | 33.53 | 70.05 |
| Full MG | 100.00 | 100.00 | 100.00 | 96.81 | 97.59 | 99.03 |
| Winter | No MG | 100.00 | 10.52 | 76.48 | 99.09 | 5.75 | 43.36 |
| Limited MG | 100.00 | 26.01 | 81.79 | 98.73 | 12.79 | 52.70 |
| Full MG | 100.00 | 100.00 | 100.00 | 99.11 | 98.94 | 99.87 |
Table 14.
Mean diesel fuel consumption (gallons) of the system without CDH PV in 3 days outages.
Table 14.
Mean diesel fuel consumption (gallons) of the system without CDH PV in 3 days outages.
| Season | Scenario | No DG Failure | With DG Failures |
|---|
| CDH | SVAHS | DPW | CDH | SVAHS | DPW |
|---|
| Summer | No MG | 3515 | 189 | 36 | 3507 | 143 | 27 |
| Limited MG | 3363 | 306 | 90 | 3422 | 218 | 68 |
| Full MG | 3761 | 1 | 0 | 3749 | 5 | 2 |
| Winter | No MG | 2974 | 228 | 50 | 2971 | 172 | 38 |
| Limited MG | 2874 | 318 | 90 | 2918 | 233 | 68 |
| Full MG | 3291 | 0 | 0 | 3287 | 2 | 1 |
Table 15.
Mean survival rates of the system without CDH PV in 7 days outages.
Table 15.
Mean survival rates of the system without CDH PV in 7 days outages.
| Season | Scenario | No DG Failure | With DG Failures |
|---|
| CDH | SVAHS | DPW | CDH | SVAHS | DPW |
|---|
| Summer | No MG | 100.00 | 41.19 | 89.13 | 93.34 | 10.51 | 21.83 |
| Limited MG | 100.00 | 54.54 | 100.00 | 92.76 | 12.53 | 33.30 |
| Full MG | 100.00 | 100.00 | 100.00 | 92.85 | 94.37 | 97.10 |
| Winter | No MG | 100.00 | 2.48 | 71.64 | 98.17 | 0.57 | 18.28 |
| Limited MG | 100.00 | 8.18 | 79.96 | 97.68 | 1.52 | 22.73 |
| Full MG | 100.00 | 100.00 | 100.00 | 98.32 | 97.82 | 99.16 |
Table 16.
Mean diesel fuel consumption (gallons) of the system without CDH PV in 7 days outages.
Table 16.
Mean diesel fuel consumption (gallons) of the system without CDH PV in 7 days outages.
| Season | Scenario | No DG Failure | With DG Failures |
|---|
| CDH | SVAHS | DPW | CDH | SVAHS | DPW |
|---|
| Summer | No MG | 8203 | 443 | 84 | 8182 | 242 | 45 |
| Limited MG | 7836 | 728 | 210 | 8062 | 362 | 114 |
| Full MG | 8778 | 1 | 1 | 8738 | 17 | 5 |
| Winter | No MG | 6956 | 529 | 117 | 6952 | 291 | 64 |
| Limited MG | 6703 | 760 | 210 | 6873 | 398 | 116 |
| Full MG | 7693 | 0 | 0 | 7682 | 6 | 2 |
Table 17.
Mean survival rates of the system without CDH PV in 14 days outages.
Table 17.
Mean survival rates of the system without CDH PV in 14 days outages.
| Season | Scenario | No DG Failure | With DG Failures |
|---|
| CDH | SVAHS | DPW | CDH | SVAHS | DPW |
|---|
| Summer | No MG | 14.17 | 0.00 | 0.00 | 14.96 | 0.00 | 0.01 |
| Limited MG | 0.00 | 17.56 | 62.03 | 4.48 | 0.09 | 3.81 |
| Full MG | 0.00 | 0.00 | 0.00 | 0.00 | 0.00 | 0.00 |
| Winter | No MG | 79.22 | 0.00 | 26.93 | 82.20 | 0.00 | 1.67 |
| Limited MG | 58.47 | 0.00 | 65.79 | 64.49 | 0.00 | 4.24 |
| Full MG | 54.02 | 54.04 | 53.98 | 53.81 | 53.06 | 53.59 |
Table 18.
Mean diesel fuel consumption (Gallons) of the system without CDH PV in 14 days outages.
Table 18.
Mean diesel fuel consumption (Gallons) of the system without CDH PV in 14 days outages.
| Season | Scenario | No DG Failure | With DG Failures |
|---|
| CDH | SVAHS | DPW | CDH | SVAHS | DPW |
|---|
| Summer | No MG | 15,107 | 71 | 21 | 15,058 | 57 | 13 |
| Limited MG | 13,253 | 1549 | 398 | 14,451 | 418 | 143 |
| Full MG | 15,198 | 2 | 0 | 14,748 | 140 | 38 |
| Winter | No MG | 13,839 | 795 | 192 | 13,822 | 302 | 71 |
| Limited MG | 12,866 | 1621 | 418 | 13,598 | 487 | 144 |
| Full MG | 14,928 | 0 | 0 | 14,800 | 38 | 9 |
© 2020 by the authors. Licensee MDPI, Basel, Switzerland. This article is an open access article distributed under the terms and conditions of the Creative Commons Attribution (CC BY) license (http://creativecommons.org/licenses/by/4.0/).

 ,
, 


