Abstract
Effects of additional cavity floor injection on the ethylene ignition and combustion processes in a cavity-based scramjet combustor are investigated experimentally in a Mach 2.0 supersonic flow using flame luminosity and CH* (CH radical) spontaneous emission methods and static pressure measurements. Numerical calculation is performed to study the non-reacting flow-field structures prior to ignition. Two injection schemes, including the cavity upstream injection scheme and the combined injection scheme with an additional cavity floor injection, are compared to study the effects of the additional cavity floor injection on the ignition and combustion processes. It is found that there exists an equivalence ratio upper limit for maintaining stable combustion for the cavity upstream injection scheme. As the equivalence ratio further increases, the fuel jet penetration is improved accordingly, and thus, the interaction between the fuel jet and the cavity is weakened, which can lead to the ignition failure and flame blowout during combustion. On the contrary, although the combined injection scheme has a minor effect on combustion enhancement at the same global equivalence ratio, it can also provide a more favorable flow-field environment that enables more successful ignitions and better flame stabilizations. For the combined injection scheme, as the equivalence ratio increases, the initial flame propagations are observed to perform different routines during the ignition process, and the major combustion reaction zone tends to move further downstream the cavity shear layer. It is concluded that the advantages of the combined injection scheme with an additional cavity floor injection are more significant when the equivalence ratio is higher, as well as that the interaction between the fuel jet and the cavity becomes weaker.
1. Introduction
The scramjet engine is a potential air-breathing propulsion system that can be applied to hypersonic aircrafts in the future, and it has received increasing attention in recent decades [1,2,3,4,5]. Since the residence time of the airflow in the scramjet engine is short [6] (approximately 1 ms), the robust flameholding scheme is a significant challenge. The structure of the cavity flameholder is simple, but its recirculation zone can promote fuel/air mixing and combustion stability, and cause small total pressure loss [7,8,9]. Therefore, cavity-based flameholders have been widely used in the scramjet combustor [10,11,12,13,14,15,16].
The configuration of the fuel injection greatly influences the combustion characteristics of the combustor. The injection configurations employed for cavity-based supersonic combustors are usually divided into two types: cavity wall injections (direct injections) and upstream injections (passive injections) [17]. Compared with passive injection, Gruber et al. [10] found that cavity wall injection is conducive to fuel entering the cavity recirculation zone and maintaining a more stable combustion in the ignition transition process. They also found that cavity wall injections can maintain the combustion in a wider fuel flow range than other injection schemes. Rasmussen et al. [18] conducted an experimental study on the hydrocarbon flame stability limit of direct injections (floor fuel injection and aft wall fuel injection) in the cavity-based combustion. However, for the cavity wall injection configuration, the combustion tends to be fuel rich because the amount of oxygen that can be delivered from the main stream to the cavity is very limited.
Injecting fuel from the wall upstream of the cavity is a more attractive scheme for better fuel jet penetration and mixing [19]. This scheme can provide fuel for the main stream and cavity, thus, more oxygen is consumed and the combustion efficiency is improved. This injection scheme is a simple but effective method to keep combustion stable. Computational results by Lin et al. [20] indicated that the fuel distribution in the cavity recirculation zone depends on the position of the upstream injector. Cai et al. [21] found that the laser-induced plasma ignition process is more intense when an upstream injection scheme is adopted by comparing different injection configurations. Wang et al. [11] proposed that the jet and free flow pressure ratio plays an important role in the flame stabilized mode changes for a cavity with an upstream injection scheme. In general, fuel/air mixing and combustion stabilization under the condition of upstream injection are largely dependent on many factors, such as the injection parameters, the extent of the fuel jet penetration, and the interaction between the fuel jet and the cavity [10,20,22,23,24,25,26,27].
When the back-wall height of the cavity is lower than the front-wall depth, the cavity is called a rear-wall-expansion cavity. This cavity can decrease the total pressure loss, restrain the thermal choking, and increase the thrust [28]. However, the rear-wall-expansion cavity also has some bad effects on the combustion stabilization because it has a smaller recirculation zone than a conventional cavity [29]. The cavity with a lower rear wall may weaken the interaction between the fuel jet and the cavity, which is not conducive to the fuel/air mixing, and can lead to unstable combustion [30,31]. In this study, the combustion instability and flame blow out are observed in a rear-wall-expansion cavity with a transverse upstream injection configuration. The study of Gruber et al. [10] indicates that the cavity wall injections are beneficial to maintaining the combustion in a wider fuel flow range than other injection schemes. Considering the disadvantages of the cavity injection scheme mentioned above, the cavity wall injection is employed as an additional fuel injection scheme to maintain a wider range of ethylene combustion (a higher equivalence ratio). The main objective of this work is to investigate the effects of the additional cavity floor injection on the ignition and combustion processes in a supersonic combustor with a rear-wall-expansion cavity.
2. Experimental and Numerical Setups
2.1. Experimental Methods
Experiments were conducted in a direct-connected experimental facility in the National University of Defense Technology [11,13,21,31]. The facility has four main components: an air heater, a supersonic nozzle, an isolator, and a scramjet combustor, as shown in Figure 1a. The air heater supplies a vitiated air inflow at 1.8 kg/s with a total temperature of 920 K and a total pressure of 0.98 MPa using air/ethanol/O2 combustion. The vitiated air is accelerated to Ma 2.0 through a converging–diverging nozzle. Then, the air flow entrances the scramjet combustor and exhausts into the atmosphere. The inflow conditions of the scramjet combustor can be seen in Table 1.
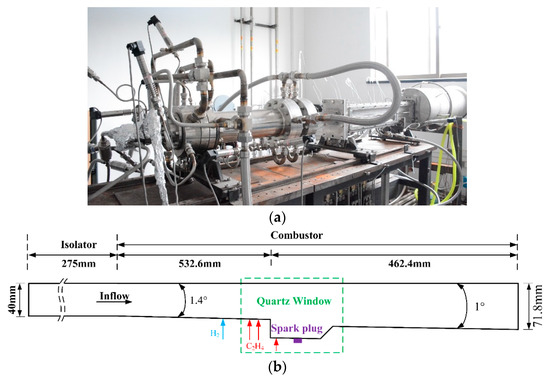
Figure 1.
Direct-connected experimental facility (a) and schematic of the model scramjet engine (b).

Table 1.
Inflow conditions of the scramjet combustor.
The schematic of the model scramjet engine is shown in Figure 1b. The rectangular cross-section of the model scramjet engine is 40 mm in height by 53.6 mm in width. A spark plug with an excitation energy of 50 J and an excitation frequency of 50 Hz is installed on the cavity floor.
Figure 2a shows the schematic of the rear-wall-expansion cavity. The front-wall depth D1, rear-wall depth D2, length L, width W, and aft-wall angle A of the cavity are 35.7 mm, 24.1 mm, 91.3 mm, 53.6 mm, and 45°, respectively. In the experiment, hydrogen pilot ignition is used due to its high reliability [32]. There are three 1.4 mm-diameter hydrogen injectors located 120 mm upstream of the cavity. The distance between adjacent injectors is 13.4 mm. The 99.5–99.8% pure ethylene (C2H4) is used as the fuel in the experiment, which is injected at room temperature. Ethylene is a colorless gas with a slightly characteristic odor of hydrocarbons at room temperature, and its relative molecular mass is 28.06. The ignition temperature and the combustion heat of C2H4 are 698.15 K and 1411.0 kJ/mol, respectively. Ethylene is injected vertically with circular holes on the wall. Four 2.4 mm-diameter ethylene injectors are located upstream of the cavity and one 1.0 mm-diameter ethylene injector is located on the cavity floor. The schematic of the fuel injector located upstream of the cavity is shown in Figure 2b. The injection on the cavity floor will cause the ethylene to concentrate in the cavity, leading to local rich combustion in the cavity. It is not conducive to ignition and flame stability, thus, the diameter of ethylene injector on the cavity floor is generally small.
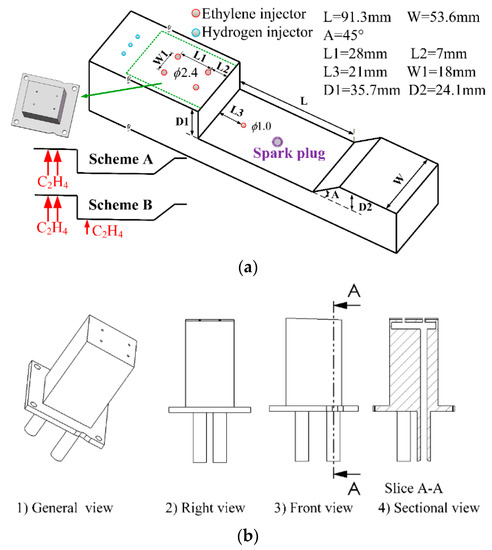
Figure 2.
Schematic of the rear-wall-expansion cavity with the fuel injectors and the fuel injection schemes (a) and schematic of the ethylene injector located upstream of the cavity (b).
To investigate the effects of the additional cavity floor injection on the combustion characteristics, two injection schemes are set according to whether the ethylene is additionally injected on the cavity floor. Figure 2a shows the two injection schemes: the cavity upstream injection scheme (Scheme A) and the combined injection scheme with an additional cavity floor injection (Scheme B). In the experiments, the injection pressure of the two injection schemes remains the same. Since there is one extra cavity floor injection of the Scheme B, the mass flow rate of the ethylene injection of the Scheme B is 4.34% higher than the Scheme A. From the experimental results, the additional ethylene fuel in Scheme B has minor effects on the combustion intensity, but has a great effect on enhancing the flame stabilization.
A quartz glass window is placed on the side wall of the combustor to allow optical access. Flame luminosity and CH* (CH radical) spontaneous emission images are captured to characterize the ignition and flame dynamics during the experiments. Flame luminosity images are obtained with a high-speed camera with a Nikon lens. CH* spontaneous emission images are captured by a bandpass filter. The frame rate and shutter time of the high-speed camera are 20,000 fps and 1/21,183 s, respectively. Additionally, a pressure scanning system is used to measure the static pressure distribution of the combustor bottom wall through 15 0.5 mm-diameter pressure taps. The sampling frequency is 100 Hz, and the measurement uncertainty is 0.05%.
2.2. Numerical Setup
Three-dimensional steady Reynolds averaged Navier-Stokes (RANS) equations are employed to investigate the non-reacting flow-field characteristics in the scramjet combustor. The detailed RANS equations can be seen in Ref. [33]. The two equations SST k-ω turbulence model [34] is used in this study. The above equations are solved by the density based double precision solver of Fluent. The SST k-ω turbulence model has been proved to be very suitable for the jet flow problems [35].
The computational domain of the combustor is the same as the experimental configuration, as shown in Figure 1 and Figure 2. The pressure inlet condition is applied for the inflow conditions of the combustor inlet and the fuel jets, and the pressure outlet condition is applied for the combustor outlet. All the walls are set as the non-slip and adiabatic boundary conditions. All the calculated parameters are consistent with the experimental data.
3. Results and Discussion
Table 2 lists the 16 cases arranged in the experiments. Each case is conducted three times for repeatability. For the sake of simplicity, the label “A-ER0.20” is used to indicate the case for which injection Scheme A is adopted and the global fuel-air equivalence ratio (denoted as ER) is 0.20, and so on. Two injection schemes are designed to study the effects of the additional cavity floor injection on the ignition and combustion characteristics. In the experiment, with the increase of fuel flow rate, the combustion heat release also increases, which leads to an increase in pressure at the combustor entrance. Then, the entry velocity changes and the combustor unstart occurs, as in the case B-ER0.45. Therefore, the present work is only focused on the cases for which the ER is no more than 0.4. In the experiments, there are three states in all the cases, as listed in Table 2. In the first state, the ignition cannot be successful, which means that the ethylene flame is blown out after the piloted hydrogen is turned off (Failure ignition). In the second state, the flame can be ignited successfully but the stable flame cannot be maintained. After a period of time, the flame can be blown out (Unstable combustion). In the third state, both successful ignition and a stable flame can be achieved (Stable combustion). As shown in Figure 3, the successful ignition and stable combustion can be achieved in all cases of injection Scheme B. For injection Scheme A, it is difficult to maintain successful ignition and flame stability with the increase of ER. Injection Scheme A can only ensure successful ignition and stable combustion when the ER is greater than 0.2. When the ER is greater than 0.2, the stable flame cannot be maintained; when the ER is greater than 0.3, the ignition cannot be successful. The experimental results show that injection Scheme B is much more beneficial to the flame ignition and combustion stability than injection Scheme A, which means that the introduction of the additional cavity floor injection can greatly improve the ignition and combustion environment.
Table 2.
Experimental cases.
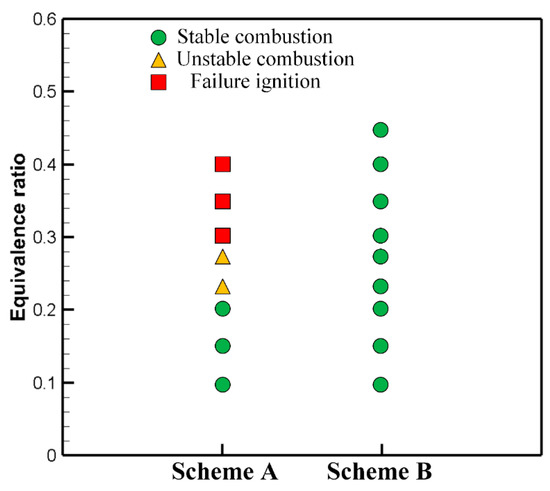
Figure 3.
Schematic of the experimental states of all cases in Table 2.
3.1. Flame Ignition Process
The CH* spontaneous emission technique is adopted to record the ignition processes. The distribution of CH* can be a good marker of the flame reaction zone. Figure 4a shows CH* spontaneous emission images of case A-ER0.20 from a flame kernel to a global flame after spark plug ignition. The flame kernel initially appears in the cavity shear layer near the cavity front wall, and then the initial flame propagates downstream along the cavity shear layer. During the propagation process, the upstream flame is gradually extinguished, and finally the initial flame anchors near the rear of the cavity. Then, the flame propagates upstream along the cavity shear layer and gradually grows into a stable global flame.
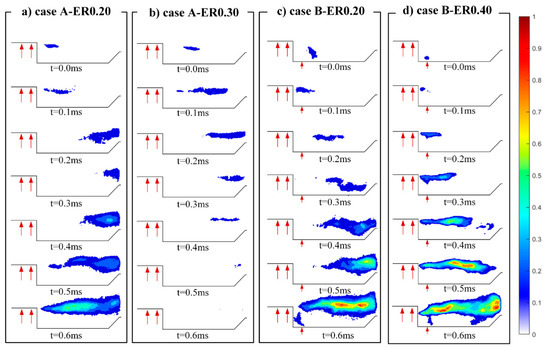
Figure 4.
Sequential images of CH* spontaneous emission images in the cases of injection Scheme A at ER = 0.2 and 0.3 and injection Scheme B at ER = 0.2 and 0.4 (failure ignition occurs in case A-ER0.30; different initial flame propagations are observed in the case A-ER0.20, B-ER0.20, and B-ER0.40).
The ignition failure process is also observed in the experiments. For injection Scheme A, the failure ignition occurs when the ER increases to 0.3, as shown in Figure 4b. One possible explanation for this phenomenon is that the injection pressure is so high that most of the fuel enters the mainstream. Then, the fuel is blown away by the mainstream, thus, very little ethylene is entrained into the cavity shear layer. Therefore, it is insufficient to support the initial flame to stabilize near the rear of the cavity when the initial flame propagates downstream along the cavity shear layer. As a result, the initial flame is blown out and cannot further propagate to the cavity front wall.
However, for injection Scheme B, ethylene can directly enter the cavity through the cavity floor injection. Therefore, the fuel distribution near the cavity shear layer increases, which is beneficial to ignition. All cases with injection Scheme B are successfully ignited, which indicates the advantages of the additional cavity floor injection on ignition. Figure 4c shows the initial flame propagation process of the case B-ER0.20. The flame kernel first appears inside the cavity, close to the cavity floor injector. Then, the initial flame moves toward the shear layer, near the cavity front wall. Next, the initial flame propagates downstream, along the cavity shear layer and, finally, anchors the rear of the cavity. Compared with the case A-ER0.20, the initial flame of the case B-ER0.20 at this moment (t = 0.3 ms) is closer to the cavity wall, which indicates that the flame is more stable and the ignition is more reliable. Then, the flame grows into a stable global flame. From the above analysis, it can be found that the ignition of the combined injection scheme is more robust than that of the cavity upstream injection scheme.
As the ER increases, the initial flame of injection Scheme B presents a different propagation routine. Compared with the case B-ER0.20, which is revealed in Figure 4c, the initial flame propagation routine of the case B-ER0.40 is different, as shown in Figure 4d. After the flame kernel propagates from the cavity floor to the shear layer near the cavity front wall, the flame kernel directly anchors and grows into a stable global flame in the front of the cavity. This is because when the ER increases, the pressure of the cavity floor injection increases and more fuel is transported into the cavity shear layer, creating a favorable environment for continuous combustion in the cavity shear layer. Therefore, the upstream flame can be kept from being blown out when the initial flame propagates downstream along the cavity shear layer.
Based on the above analysis, Figure 5 shows the different initial flame propagation routines during the ignition process. Due to the limitation of experimental observations, only the zone before the cavity rear wall in the combustor is investigated. The flame propagation of the expansion wall downstream of the cavity is not considered. When the ER is relatively low, the initial flame propagation of injection Scheme B can be decomposed into three stages, as shown in Figure 5a: in stage 1, the flame kernel propagates upward from the cavity floor to the shear layer near the cavity front wall; in stage 2, the initial flame propagates downstream, along the cavity shear layer. During the propagation process, the upstream flame is gradually blown out. Finally, the initial flame anchors near the rear of the cavity; in stage 3, the flame propagates upstream, along the shear layer from the rear of the cavity and gradually grows into a stable global flame. Compared with injection Scheme B, the initial flame propagation of the Scheme A mainly includes stage 2 and stage 3, and stage 1 is not obvious. When the ER is relatively high, the initial flame propagation of injection Scheme B can be divided into the following two stages, as shown in Figure 5b: in stage 1, the flame kernel propagates upward from the cavity floor to the shear layer near the cavity front wall; in stage 2, the flame kernel directly anchors and gradually grows into a stable global flame in the front of the cavity. The different initial flame propagation routines during the ignition process show that the injection scheme and the ER can affect the propagation and distribution of the flame during the ignition process. Compared with the upstream injection scheme, the combined injection scheme with an additional cavity floor injection can greatly improve the ignition environment.
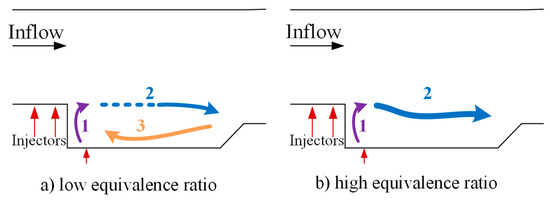
Figure 5.
Schematic of the different initial flame propagation routines during the ignition process.
3.2. Flame Stabilization Process
As shown in Figure 3, the additional cavity floor injection also greatly affects the combustion stability. Therefore, the combustion characteristics of the different injection schemes are focused on in this section. It should be noted that for some unstable combustion cases (the flame is blown out after a period of combustion), the experimental data before blowout are used in the analysis.
Figure 6 shows the time-averaged static pressure distributions along the combustor bottom wall of cases at ER = 0.20 and ER = 0.27. The wall pressure distribution for injection Scheme A is almost the same as that for injection Scheme B with the same ER, which indicates that the introduction of the additional cavity floor injection has a minor effect on the combustion intensity at the same global ER. When the ER is not too high, and the flame can be stabilized in both injection schemes, the effect of injection Scheme B on the combustion enhancement is not obvious.
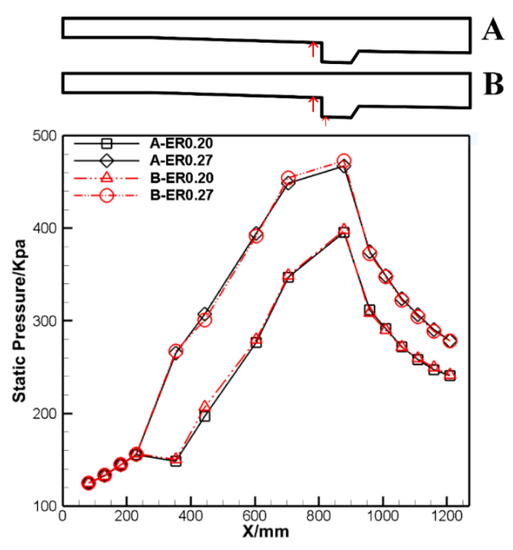
Figure 6.
Comparison of the time-averaged static pressure distributions along the combustor bottom wall of different cases.
However, when the ER is larger than 0.2, the flame in the cases with injection Scheme A will be blown out after a period of combustion. When the ER is larger than 0.3, the flame will even be directly blown out after ignition. For injection Scheme B, there is no such phenomenon, and stable combustion can be achieved in the whole combustion process. It indicates that although injection Scheme B has a minor effect on the combustion enhancement, it has a strong effect on promoting combustion stabilization. In the experiments, when injection Scheme A is adopted and the ER is larger than 0.2, the flame is often blown to the cavity trailing edge, and then the flame gradually ignites the whole shear layer at the rear of the cavity. The combustion process is similar to stage 2 and stage 3 of the initial flame propagation during ignition in Figure 5a. Then, flame oscillations occur near the cavity, and at a certain time, the flame is blown out. The flame of injection Scheme B is often stabilized in the cavity shear layer. This is because the additional cavity floor injection ensures that there is always a resident flame located at the front edge of the cavity bottom wall.
Figure 7 shows the different flame development processes with different injection schemes at ER = 0.27. Initially (t = 0.0 ms), the combustion of both cases is in the cavity shear layer mode [36]. Due to the additional cavity floor injection, the fuel will accumulate in the cavity, leading to local rich combustion inside the cavity. Therefore, a rich orange flame is formed below the blue-white flame of the shear layer and above the cavity floor injector in case B-ER0.27. Then, because the combustion is in the cavity shear layer mode, the combustion is intense, consuming a large amount of ethylene in the shear layer. Furthermore, there is less fuel entering into the cavity and the shear layer because of the high injection pressure, which is not enough to maintain the combustion in the cavity shear layer mode. Therefore, the flame is gradually blown downstream of the shear layer. For injection Scheme A, after the flame propagates to the cavity trailing edge, the flow field in the shear layer still cannot provide a favorable environment for the mixture to be ignited again. As a result, the flame cannot return the upstream of the shear layer and is blown out. However, for injection Scheme B, during the flame propagation to the downstream of the shear layer, the resident flame formed by the cavity floor injection at the cavity bottom wall will gradually grow and propagate upward (t = 0.5–1.5 ms). Eventually, the combustion is re-stabilized in the cavity shear layer mode with the assistance of the resident flame. The residence flame accelerates the propagation of the blown flame to the upstream of the cavity shear layer in two ways: first, some of the superfluous fuel carried by the rich combustion flame will enter the shear layer, leading to more sufficient fuel/air mixing in the shear layer, providing a favorable flow field environment for the blown flame back propagation to the upstream of the shear layer; second, the rising resident flame plays the role of ignition, igniting the shear layer near the cavity leading edge, and merging with the flame that is propagating upstream of the cavity shear layer, so that the combustion is again re-stabilized in the cavity shear layer mode.
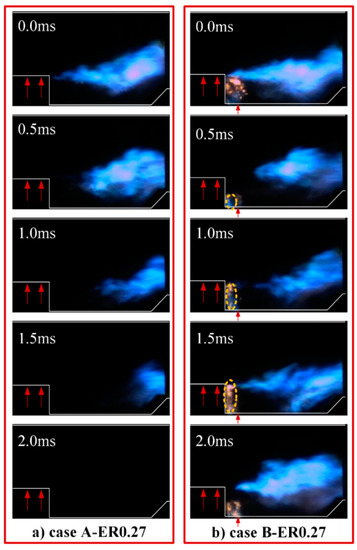
Figure 7.
Comparison of flame development processes with different injection schemes at ER = 0.27 (the flame blowoff process is shown in (a) case A-ER0.27, and the mechanism of flame stabilization by the additional cavity floor injection is shown in (b) case B-ER0.27).
Figure 8 shows the flamebase oscillations in the cases of injection Schemes A and B at ER0.20 and 0.27. The flamebase is defined as the axial position of the flame leading edge [13]. It can be seen that during most of the combustion process, the flamebase of injection Scheme B is closer to the cavity leading edge than that of injection Scheme A. However, for both injection schemes, the flamebase can hardly cross the cavity leading edge, consistent with the conclusion of the analysis in Figure 7. The flame stabilization mechanism of the additional cavity floor injection indicates that for injection Scheme B, there is more time for the combustion to be in the cavity shear layer mode during the whole combustion process, which means that the flamebase will be closer to the cavity leading edge with injection Scheme B. This finding further illustrates that injection Scheme B can provide a favorable flow field environment for promoting flame stabilization.
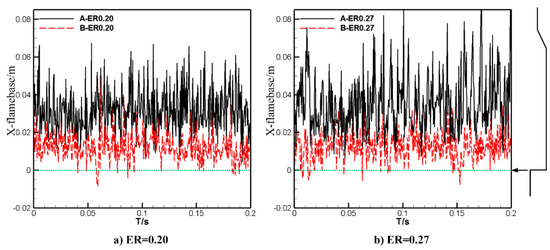
Figure 8.
Flamebase oscillations in the cases of injection schemes (a) and (b) at ER0.20 and 0.27 (the position of the cavity leading edge is the coordinate origin of the flamebase oscillation).
To further study the effect of the additional cavity floor injection on the combustion characteristics, the experimental results of different ERs of injection Scheme B are compared. Figure 9 displays representative CH* spontaneous emission images of cases with injection Scheme B at ER = 0.2, 0.3, and 0.4. In the combustion process, there is a major reaction zone (the reaction zone is in the cavity shear layer and the main stream above the shear layer) and a secondary reaction zone (the reaction zone is located near the cavity floor injector and the cavity front wall). A higher ER is bound to make combustion more intense. As the ER increases, the reaction zone gradually propagates away from the cavity leading edge because as the ER increases, the injection pressure also increases, leading to a weaker interaction between the fuel jet and the cavity. Therefore, more fuel enters the mainstream and is transported downstream by the mainstream. The weak secondary reaction zone near the cavity nozzle acts as the ignition source and keeps the flame in the major reaction zone from being blown out. As the ER increases, the secondary reaction zone becomes increasingly important for stable combustion.
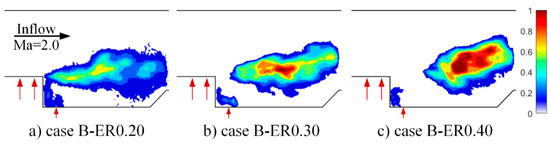
Figure 9.
Representative CH* spontaneous emission images during the combustion process of cases with injection Scheme B.
To quantitatively study the CH* and heat release, time-averaged CH* spontaneous emission images are processed into gray images; then, the gray-scale integration is performed along the direction perpendicular to the cavity and parallel to the cavity. The integration results are shown in Figure 10. It can be seen from Figure 9 and Figure 10 that as the ER increases, the major combustion reaction zone tends to move further downstream the shear layer in the direction parallel to the inflow direction. There is a tendency to move upward in the direction perpendicular to the inflow, which makes the combustion deeper into the inflow. The change of the reaction zone perpendicular to the inflow direction is not as great as that parallel to the inflow direction. It is found from Figure 10a that when the ER is no more than 0.3, there is only the CH* integration curve perpendicular to the cavity direction (case B-ER0.20 and case B-ER0.30). When the ER increases to 0.4, there are two larger peaks and a smaller peak in the CH* integration curve. This is because the reaction zone is easier to propagate downstream the shear layer with the increase of ER, but the combustion will be re-stabilized in the cavity shear layer mode with the assistance of the resident flame, which means that the flame is more likely to oscillate in the combustion process and that the position of the heat release area will change accordingly. There will be multiple heat release centers on the average CH* spontaneous emission image, leading to multiple peaks of the CH* integration curve.
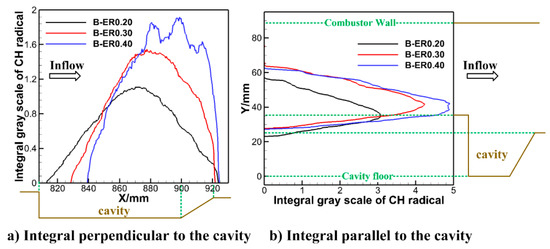
Figure 10.
Gray scale integration distributions of the time-averaged CH* spontaneous emission images in the injection Scheme B cases.
In summary, the combined injection scheme with an additional cavity floor injection has a minor effect on combustion enhancement at the same global ER. However, due to the existence of the cavity resident flame, the flame can be kept from being blown out in the combustion process. As the ER increases, the combustion reaction zone tends to move downstream the shear layer and the upper wall of the combustor. The combined injection scheme with an additional cavity floor injection can provide a favorable flow field environment for promoting flame stabilization. It is meaningful and useful for the injection design of the scramjet combustor.
3.3. Non-Reacting Flow-Field Analysis
The experimental results of ignition and combustion processes have been previously investigated. To further investigate the reason for the failure ignition of injection Scheme A when the ER increases to 0.30 and the mechanism of injection Scheme B to promote successful ignition and stable combustion, the non-reacting flow-fields of different cases are analyzed by the numerical calculations. Figure 11 shows the wall static pressure distribution of case A-ER0.10 from experiments and numerical simulations. The numerical schlieren contour of the central plane is also shown. A coarse grid “988730”, a moderate grid “1829802”, and a refined grid “4051782” are adopted in the grid independency study. The numerical results agree well with the experimental data, and only the wall pressure around x = 1100 mm is underestimated. The numerical results are also independent of grids. In order to reduce the computational cost and ensure the accuracy of the numerical results, the moderate grid is adopted in the study.
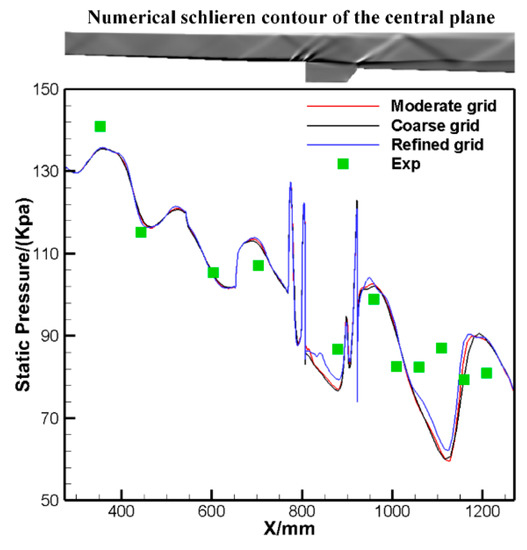
Figure 11.
Static pressure distribution comparison of case A-ER0.10 between experiments and numerical simulations.
The mass fraction of ethylene distribution can be used to analyze the fuel/air mixing, as shown in Figure 12. As the ER increases, the fuel jet penetration depth of the upstream injection also increases. Furthermore, the penetration depth of upstream injection close to the cavity leading edge () is deeper than that far away from the cavity leading edge (). For injection Scheme A, the fuel can only be transported into the cavity through the shear layer. Figure 12d shows the iso-line of ethylene mass fraction (of 0.10) of injection Scheme A. It can be seen that as the ER increases, the mixture is more fuel-rich above the shear layer and the expansion wall downstream of the cavity, but the fuel entrained into the cavity does not increase significantly. The cavity low-speed recirculation zone can provide a favorable flow field environment for ignition; thus, the fuel entering into the recirculation zone of the cavity is very important for successful ignition. Combining with the ignition failure situation of injection Scheme A in the experiments, as shown in Figure 3 and Table 2, less fuel entering the cavity should be a very important reason for the failure ignition. For injection Scheme B, the introduction of the additional cavity floor injection greatly increases the fuel mass fraction inside the cavity, as shown in Figure 12h. It can greatly improve the ignition environment and keep the flame from being blown out in the combustion process. As the ER increases, the front of the cavity becomes fuel-richer. This explains why the different initial flame propagation routine appears during the ignition process of injection Scheme B at a higher ER. Due to the sufficient fuel in the front of the cavity and the entire shear layer, the flame kernel directly anchors and grows into a stable global flame in the front of the cavity, as shown in Figure 5b. At the same time, it should be noted that the injection flow rate of the additional cavity floor injection should be limited to prevent excessive fuel in the cavity, which is not conducive to ignition and flame stability.
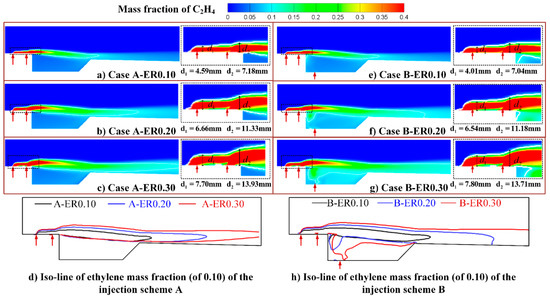
Figure 12.
Ethylene mass fraction distributions in the planes of the upstream jet orifice of the injection Schemes A and B cases (the fuel jet penetration depths of the upstream injection ( and ) increase as the ER increases; the iso-lines of ethylene mass fraction (of 0.10) are compared to investigate the effect of the ER on the transport of ethylene into the cavity).
The turbulence close to the cavity shear layer is beneficial to the mixing enhancement, and the vorticity can be used as an indicator to measure the turbulence intensity. Figure 13 shows the vorticity magnitude in the case A-ER0.30 and B-ER0.30. The vorticity magnitude is mainly concentrated near the jet orifice, the cavity shear layer, and the wall. By employing the cavity floor injection, the vorticity magnitude around the front of the shear layer is shown to increase. It would enhance the mixing, allowing more fuel from upstream injection to enter the shear layer and the cavity. From the mass fraction distributions of fuel shown in Figure 12 and the vorticity magnitude distributions shown in Figure 13, it can be concluded that injection Scheme B can provide a better flow field condition for ignition and flame stabilization than the Scheme A in two ways: first, the introduction of the cavity floor injection allows more fuel into the cavity, and second, the increase of the vorticity magnitude further enhances the fuel/air mixing.
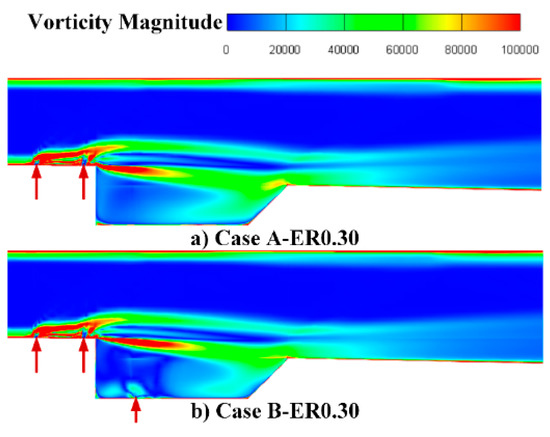
Figure 13.
Vorticity magnitude in the cases A-ER0.30 and B-ER0.30.
The mass flow rate of fuel across the upper surface of the cavity with injection Scheme A can be used to quantitatively describe the fuel/air mixing process [31], as shown in Figure 14. The most fuel is transported into the cavity near the end of the cavity bottom wall. Furthermore, the fuel flows out from the cavity close to the cavity trailing edge. As the ER increases, the mass flow rate of ethylene entrained into the cavity first increases and then decreases. The fuel entrainment mass flow of case A-ER0.3 is lower than that of case A-ER0.2, even slightly lower than that of case A-ER0.1. Considering that more fuel enters the combustor for case A-ER0.30, the interaction between the fuel jet and the cavity when the ER is 0.3 may be weaker than when the ER is 0.1. It can be concluded that as the ER increases, the interaction between the jet and the cavity first increases and then decreases. It can also be seen from Figure 15 that the vorticity magnitude of the iso-surface of the ethylene mass fraction is largest when the ER is 0.2. Therefore, for injection Scheme A, when the ER is about 0.2 (the injection pressure is 0.81 MPa), the interaction between the fuel jet and the cavity is strongest.
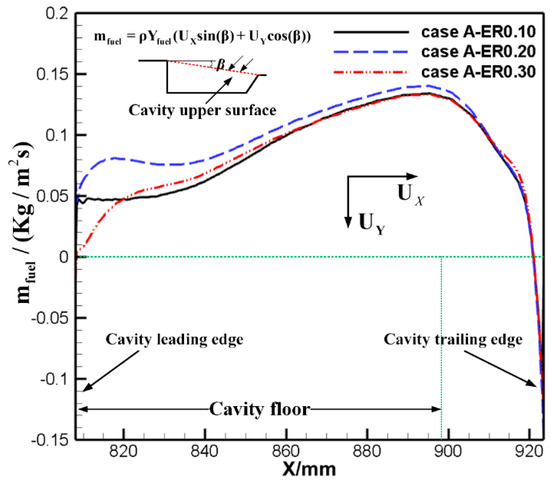
Figure 14.
Comparison of the fuel entrainment rate across the cavity upper surface in injection Scheme A cases (in this study, positive values of indicate that the fuel flows into the cavity).
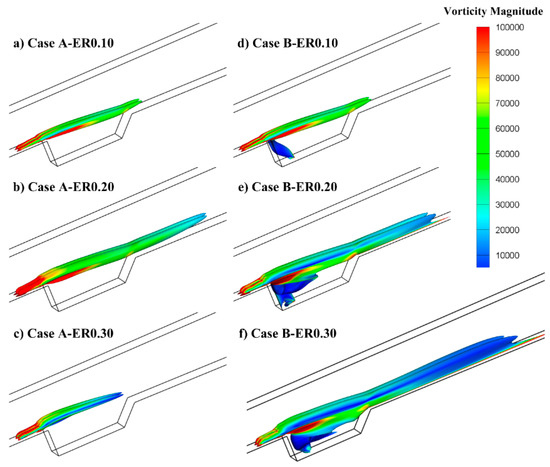
Figure 15.
Iso-surface of the ethylene mass fraction (of 0.10) colored by vorticity magnitude of injection Schemes A and B cases.
Figure 15 shows the spatial distributions of the fuel jet in the combustor and the vorticity magnitude distribution of iso-surface of fuel mass fraction (of 0.10). The magnitude of the vorticity in the iso-surface decreases along the flow direction. For injection Scheme A, the three-dimensional spatial distribution of the fuel jet further confirms the conclusion that excessively high injection pressure leads to a worse mixing effect. Comparing Figure 15a–c, one can see that when the ER increases from 0.1 to 0.2, the fuel/air mixing is enhanced. When the ER increases from 0.2 to 0.3, the vorticity magnitude of the iso-surface on the lower side of the cavity shear layer decreases significantly. It indicates that the jet is more deeply into the mainstream, and the interaction between the fuel jet and the cavity becomes weaker, resulting in a poor mixing effect. Comparing the calculation results of the different injection schemes, it can be found that when the ER is less than 0.2, there is little difference in the fuel/air mixing between the two injection schemes near the cavity shear layer and the downstream expansion wall. Only the front of the cavity of injection Scheme B becomes fuel-rich due to the cavity floor injection. Due to insufficient oxygen in the front of the cavity, it is difficult to enhance the combustion effect during combustion. Therefore, it can be speculated that the combustion intensity of the two injection schemes is almost the same, which corresponds to the analysis of the experimental results (Figure 6). By comparing Figure 15c,f, it can be found that at higher ER, injection Scheme B can greatly enhance the fuel/air mixing, so that there is a greater distribution of the fuel near the shear layer and the downstream expansion wall.
The analysis of the non-reacting flow-field results agree well with the experimental results. According to the results of the experiments and calculations, the ER of 0.2 is the upper limit of stable combustion with the cavity upstream injection scheme. When the injection pressure is too high and the ER is larger than 0.2, the interaction between the fuel jet and the cavity is weakened, and the mixing effect is poor, which also affects the later combustion. Therefore, it is very unfavorable for ignition and flame stabilization. The combined injection scheme can greatly improve the fuel/air mixing when the ER is too high, and enhance the interaction between the fuel jet and the cavity, which is conducive to the successful ignition and stable combustion.
4. Conclusions
The ignition and combustion processes in an ethylene-fueled scramjet combustor with a rear-wall-expansion cavity are investigated experimentally in a Mach 2.0 supersonic inflow. Numerical simulations are also conducted to investigate the characteristics of the non-reacting flow-field prior to ignition. The effects of the additional cavity floor injection on the ignition and flame stabilization are studied by comparing two injection schemes: the cavity upstream injection scheme and the combined injection scheme with an additional cavity floor injection.
The cavity upstream injection scheme can achieve successful ignition only when the ER is less than 0.3, whereas the combined injection scheme can achieve successful ignition from the ER of 0.1 to 0.45. During the ignition process, there are two different initial flame propagation routines. When the ER is low, the initial flame propagates downstream along the cavity shear layer from the front of the cavity and then anchors the rear of the cavity and grows into a stable global flame there. As the ER increases, the flame kernel directly anchors and grows into a stable global flame in the front of the cavity. Only the first initial flame propagation routine exists in the cavity upstream injection scheme.
The experimental and computational results show that the ER of 0.2 is the upper limit of stable combustion for the cavity upstream injection scheme in the current configuration. As the ER further increases, the fuel jet penetration is improved accordingly, but the interaction between the fuel jet and the cavity becomes weaker and the mixing effect becomes poorer, which leads to the ignition failure and flame blowout during combustion. Compared with the cavity upstream injection scheme, although the combined injection scheme hardly affects the combustion enhancement at the same global ER, it can provide a favorable flow-field environment for the ignition and flame stabilization. The combined injection scheme can enhance the fuel/air mixing. The resident flame inside the cavity can keep the flame from being blown out and maintain stable combustion over a larger range of the ER values. As the ER increases, the major combustion reaction zone tends to move further downstream the cavity shear layer. The experimental results indicate that successful ignition and stable combustion can be achieved before the combustor unstart occurs for the combined injection scheme. Therefore, when the ER is higher and the interaction between the fuel jet and the cavity becomes weaker, the advantage of the combined injection scheme with an additional cavity floor injection is more significant.
Author Contributions
Conceptualization, F.L. (Fan Li), M.S., and Y.C.; Data curation, F.L. (Fan Li) and F.L. (Fei Li); Formal analysis, F.L. (Fan Li) and Y.S.; Funding acquisition, M.S., Z.C., Y.C., and J.Z.; Investigation, F.L. (Fan Li), Z.C., Y.C., and F.L. (Fei Li); Methodology, F.L. (Fan Li) and Y.S.; Project administration, Z.C. and J.Z.; Resources, F.L. (Fan Li), M.S., and J.Z.; Software, F.L. (Fan Li) and F.L. (Fei Li); Supervision, M.S.; Validation, Y.S.; Visualization, Y.C.; Writing—original draft, F.L. (Fan Li); Writing—review and editing, Z.C. and J.Z. All authors have read and agreed to the published version of the manuscript.
Funding
This research was funded by the National Natural Science Foundation of China (NSFC), grant numbers 11925207, 11902353, 91741205, and 91741107 and the Foundation of Innovation-oriented Province Construction of Hunan, grant number 2019RS2028. The APC was funded by the National Natural Science Foundation of China (NSFC), grant number 11925207.
Acknowledgments
This work is supported by the National Natural Science Foundation of China (NSFC) (Nos. 11925207, 11902353, 91741205, and 91741107) and the Foundation of Innovation-oriented Province Construction of Hunan (2019RS2028).
Conflicts of Interest
The authors declare no conflict of interest.
References
- Neill, S.M.; Pesyridis, A. Modeling of Supersonic Combustion Systems for Sustained Hypersonic Flight. Energies 2017, 10, 1900. [Google Scholar] [CrossRef]
- Xianyu, W.; Xiaoshan, L.; Meng, D.; Weidong, L.; Zhenguo, W. Experimental Study on Effects of Fuel Injection on Scramjet Combustor Performance. Chin. J. Aeronaut. 2007, 20, 488–494. [Google Scholar] [CrossRef][Green Version]
- Sen, D.; Pesyridis, A.; Lenton, A. A Scramjet Compression System for Hypersonic Air Transportation Vehicle Combined Cycle Engines. Energies 2018, 11, 1568. [Google Scholar] [CrossRef]
- Hou, L.-Y.; Weigand, B.; Banica, M. Effects of Staged Injection on Supersonic Mixing and Combustion. Chin. J. Aeronaut. 2011, 24, 584–589. [Google Scholar] [CrossRef]
- Cui, T.; Ou, Y. Modeling of Scramjet Combustors Based on Model Migration and Process Similarity. Energies 2019, 12, 2516. [Google Scholar] [CrossRef]
- Ben-Yakar, A.; Hanson, R.K. Cavity Flame-Holders for Ignition and Flame Stabilization in Scramjets: An Overview. J. Propuls. Power 2001, 17, 869–877. [Google Scholar] [CrossRef]
- Mathur, T.; Gruber, M.; Jackson, K.; Donbar, J.; Donaldson, W.; Jackson, T.; Billig, F. Supersonic Combustion Experiments with a Cavity-Based Fuel Injector. J. Propuls. Power 2001, 17, 1305–1312. [Google Scholar] [CrossRef]
- Ukai, T.; Zare-Behtash, H.; Erdem, E.; Lo, K.H.; Kontis, K.; Obayashi, S. Effectiveness of jet location on mixing characteristics inside a cavity in supersonic flow. Exp. Therm. Fluid Sci. 2014, 52, 59–67. [Google Scholar] [CrossRef]
- Micka, D.J.; Driscoll, J.F. Combustion characteristics of a dual-mode scramjet combustor with cavity flameholder. Proc. Combust. Inst. 2009, 32, 2397–2404. [Google Scholar] [CrossRef]
- Gruber, M.R.; Donbar, J.M.; Carter, C.; Hsu, K.-Y. Mixing and Combustion Studies Using Cavity-Based Flameholders in a Supersonic Flow. J. Propuls. Power 2004, 20, 769–778. [Google Scholar] [CrossRef]
- Wang, H.; Wang, Z.; Sun, M.; Qin, N. Combustion characteristics in a supersonic combustor with hydrogen injection upstream of cavity flameholder. Proc. Combust. Inst. 2013, 34, 2073–2082. [Google Scholar] [CrossRef]
- Li, C.; Xia, Z.; Ma, L.; Zhao, X.; Chen, B. Numerical Study on the Solid Fuel Rocket Scramjet Combustor with Cavity. Energies 2019, 12, 1235. [Google Scholar] [CrossRef]
- Li, F.; Sun, M.; Cai, Z.; Sun, Y.; Li, F.; Zhang, J.; Zhu, J. Experimental study of flame stabilization in a single-side expansion scramjet combustor with different cavity length-to-depth ratios. Acta Astronaut. 2020, 173, 1–8. [Google Scholar] [CrossRef]
- Sathiyamoorthy, K.; Danish, T.H.; Iyengar, V.S.; Manjunath, P.; Muruganandam, T.M.; Chakravarthy, S.R. Flow visualization and supersonic combustion studies of an acoustically open strut cavity. Acta Astronaut. 2020. [Google Scholar] [CrossRef]
- Sun, Y.; Cai, Z.; Wang, T.; Sun, M.; Gong, C.; Huang, Y. Numerical study on cavity ignition process in a supersonic combustor. J. Zhejiang Univ. Sci. A 2020, in press. [Google Scholar]
- Roos, T.; Pudsey, A.; Bricalli, M.; Ogawa, H. Numerical investigation of upstream cavity enhanced fuel mixing in scramjet combustors. Acta Astronaut. 2020, 169, 50–65. [Google Scholar] [CrossRef]
- Barnes, F.W.; Segal, C. Cavity-based flameholding for chemically-reacting supersonic flows. Prog. Aerosp. Sci. 2015, 76, 24–41. [Google Scholar] [CrossRef]
- Chadwick, C.; Rasmussen, C.; Driscoll, J. Blowout Limits of Flames in High-Speed Airflows: Critical Damkohler Number; American Institute of Aeronautics & Astronautics: Hunter Mill, VA, USA, 2008; p. 4571. [Google Scholar]
- Wang, H.; Wang, Z.; Sun, M.; Qin, N. Large eddy simulation of a hydrogen-fueled scramjet combustor with dual cavity. Acta Astronaut. 2015, 108, 119–128. [Google Scholar] [CrossRef]
- Lin, K.-C.; Tam, C.-J.; Boxx, I.; Carter, C.; Jackson, K.; Lindsey, M. Flame Characteristics and Fuel Entrainment Inside a Cavity Flame Holder of a Scramjet Combustor. In Proceedings of the 43rd AIAA/ASME/SAE/ASEE Joint Propulsion Conference & Exhibit, Cincinnati, OH, USA, 8–11 July 2007; p. 5381. [Google Scholar]
- Cai, Z.; Zhu, J.; Sun, M.; Wang, Z. Effect of cavity fueling schemes on the laser-induced plasma ignition process in a scramjet combustor. Aerosp. Sci. Technol. 2018, 78, 197–204. [Google Scholar] [CrossRef]
- Zhang, J.; Chang, J.; Tian, H.; Li, J.; Bao, W. Flame Interaction Characteristics in Scramjet Combustor Equipped with Strut/Wall Combined Fuel Injectors. Combust. Sci. Technol. 2019, 1–24. [Google Scholar] [CrossRef]
- Kim, C.-H.; Jeung, I.-S. Forced Combustion Characteristics Related to Different Injection Locations in Unheated Supersonic Flow. Energies 2019, 12, 1746. [Google Scholar] [CrossRef]
- Zhang, J.; Chang, J.; Ma, J.; Wang, Y.; Bao, W. Investigations on flame liftoff characteristics in liquid-kerosene fueled supersonic combustor equipped with thin strut. Aerosp. Sci. Technol. 2019, 84, 686–697. [Google Scholar] [CrossRef]
- Jeong, E.; O’Byrne, S.; Jeung, I.-S.; Houwing, A.F.P. The Effect of Fuel Injection Location on Supersonic Hydrogen Combustion in a Cavity-Based Model Scramjet Combustor. Energies 2020, 13, 193. [Google Scholar] [CrossRef]
- Zhang, J.; Wang, Z.; Sun, M.; Wang, H.; Liu, C.; Yu, J. Effect of the Backward Facing Step on a Transverse Jet in Supersonic Crossflow. Energies 2020, 13, 4170. [Google Scholar] [CrossRef]
- Swain, T.K.; Kumar, S. Evaluation of Fuel and Air Mixing in a Scramjet Engine Using an Asymmetric Strut-Based Fuel Injection Using CFD. Combust. Sci. Technol. 2020, 1–21. [Google Scholar] [CrossRef]
- Kim, K.M.; Baek, S.W.; Han, C.Y. Numerical study on supersonic combustion with cavity-based fuel injection. Int. J. Heat Mass Transf. 2004, 47, 271–286. [Google Scholar] [CrossRef]
- Gruber, M.R.; Baurle, R.A.; Mathur, T.; Hsu, K.-Y. Fundamental Studies of Cavity-Based Flameholder Concepts for Supersonic Combustors. J. Propuls. Power 2001, 17, 146–153. [Google Scholar] [CrossRef]
- Zhang, Y.-X.; Wang, Z.; Sun, M.; Yang, Y.; Wang, H.-B. Hydrogen jet combustion in a scramjet combustor with the rearwall-expansion cavity. Acta Astronaut. 2018, 144, 181–192. [Google Scholar] [CrossRef]
- Cai, Z.; Sun, M.; Wang, Z.; Bai, X.-S. Effect of cavity geometry on fuel transport and mixing processes in a scramjet combustor. Aerosp. Sci. Technol. 2018, 80, 309–314. [Google Scholar] [CrossRef]
- Cai, Z.; Wang, T.; Sun, M. Review of cavity ignition in supersonic flows. Acta Astronaut. 2019, 165, 268–286. [Google Scholar] [CrossRef]
- Cai, Z.; Wang, Z.; Sun, M.; Bai, X.-S. Effect of combustor geometry and fuel injection scheme on the combustion process in a supersonic flow. Acta Astronaut. 2016, 129, 44–51. [Google Scholar] [CrossRef]
- Menter, F.R. Two-equation eddy-viscosity turbulence models for engineering applications. AIAA J. 1994, 32, 1598–1605. [Google Scholar] [CrossRef]
- Bardina, J.E.; Huang, P.G.; Coakley, T.J. Turbulence modeling validation, testing, and development. In Nasa Technical Memorandum; National Aeronautics and Space Administration: Washington, DC, USA, 1997; p. 110446. [Google Scholar]
- Wang, H.; Wang, Z.; Sun, M.; Wu, H. Combustion modes of hydrogen jet combustion in a cavity-based supersonic combustor. Int. J. Hydrogen Energy 2013, 38, 12078–12089. [Google Scholar] [CrossRef]
© 2020 by the authors. Licensee MDPI, Basel, Switzerland. This article is an open access article distributed under the terms and conditions of the Creative Commons Attribution (CC BY) license (http://creativecommons.org/licenses/by/4.0/).